Analyzing on-Street Parking Duration and Demand in a Metropolitan City of a Developing Country: A Case Study of Yogyakarta City, Indonesia

1
Graduate School of Environmental Studies, Seoul National University, Seoul 08826, Korea
2
Graduate School of Environmental Studies, Interdisciplinary Program in Landscape Architecture, and Environmental Planning Institute, Seoul National University, Seoul 08826, Korea
*
Author to whom correspondence should be addressed.
Sustainability 2018, 10(3), 591; https://doi.org/10.3390/su10030591
Submission received: 30 December 2017
/
Revised: 18 February 2018
/
Accepted: 22 February 2018
/
Published: 26 February 2018
Abstract
:On-street parking is an urgent issue to address in a fast-growing city of a developing country, such as Yogyakarta City in Indonesia. However, this issue has not been satisfactorily studied due to a lack of relevant parking data. Using a sample of 21 street segments that are currently used for on-street parking in the central district of the city, this study analyzes how the parking duration and demand are differentiated by street and land use characteristics. The characteristics are evaluated through a field survey, which is supplemented by remote sensing and GIS. Specifically, QuickBird imagery is used to roughly examine the length and angle of the street segments and GIS data to calculate parking capacity and demand as well as to confirm the street length and angle. Regression models find that the parking duration is affected by the street length, parking volume, and commercial type of land use, while the street length also differentiates the parking demand. Although the model for the parking demand has only one significant variable—street length—its variation is better accounted for by the same set of variables than the variation in the parking duration. Regarding the street length, it is found to be the only significant variable in the demand model, but it becomes the weakest among those significant in the duration model, where the land use type has the highest magnitude.
1. Introduction
Indonesia is among the fastest-growing economies. Private mobility such as motorcycles and passenger cars function as the main modes of road transportation in major cities like Yogyakarta City, which was previously underdeveloped compared to other cities, and is now experiencing a more rapid economic growth, even in this booming economy. In the city, the numbers of registered motorcycles and passenger cars increased for three years (2012–2015) by 20.12% (from 45,410 to 54,546) and 17.41% (340,350 to 399,615), respectively [1]. This subsequently resulted in a skyrocketing demand for parking spaces. However, due to a lack of off-street parking lots and easy access to final destinations, most vehicles were parked on the street. Subsequently, on-street parking became overloaded, and it reduced traffic safety, air quality (narrowed streets worsened traffic congestion), and public space; ultimately, it is believed to harm the economic potential of the city [2]. At this juncture, as an initial step to address the parking issue, this study attempts to analyze the characteristics of on-street parking.
In this study, on-street parking is evaluated in terms of the parking duration as well as the parking demand. As characteristics that are expected to affect the two measures, this study analyzes the street segment length and land use types as well as the parking volume while taking into account the parking angle on the street segment. Some of the variables are evaluated with high-definition remote sensing data such as QuickBird imagery and others through first-hand field surveys. In fact, as with other developing countries, Indonesia is not equipped with data on parking volume and other parking-related characteristics, and these were manually collected by the researchers. Moreover, the manual counts of parked vehicles were considered more reliable because most on-street parking spaces do not have parking lines and signs (see Figure 1), and cannot be correctly captured in remote sensing data.
This study was limited to vehicles parked to passenger cars and motorcycles, which account for 96.52% of all registered vehicles as of 2015: passenger cars = 54,546 (11.59%), load vehicles = 13,875 (2.95%), buses = 2233 (0.47%), special purpose vehicles = 273 (0.06%), and motorcycles = 399,615 (84.93%). The study area for this study is the Gondokusuman District, which is located in the center of Yogyakarta City. As a regional center of the residential, economic, and social/leisure activities, it has experienced a rapid growth in the parking demand and subsequent on-street parking issues.
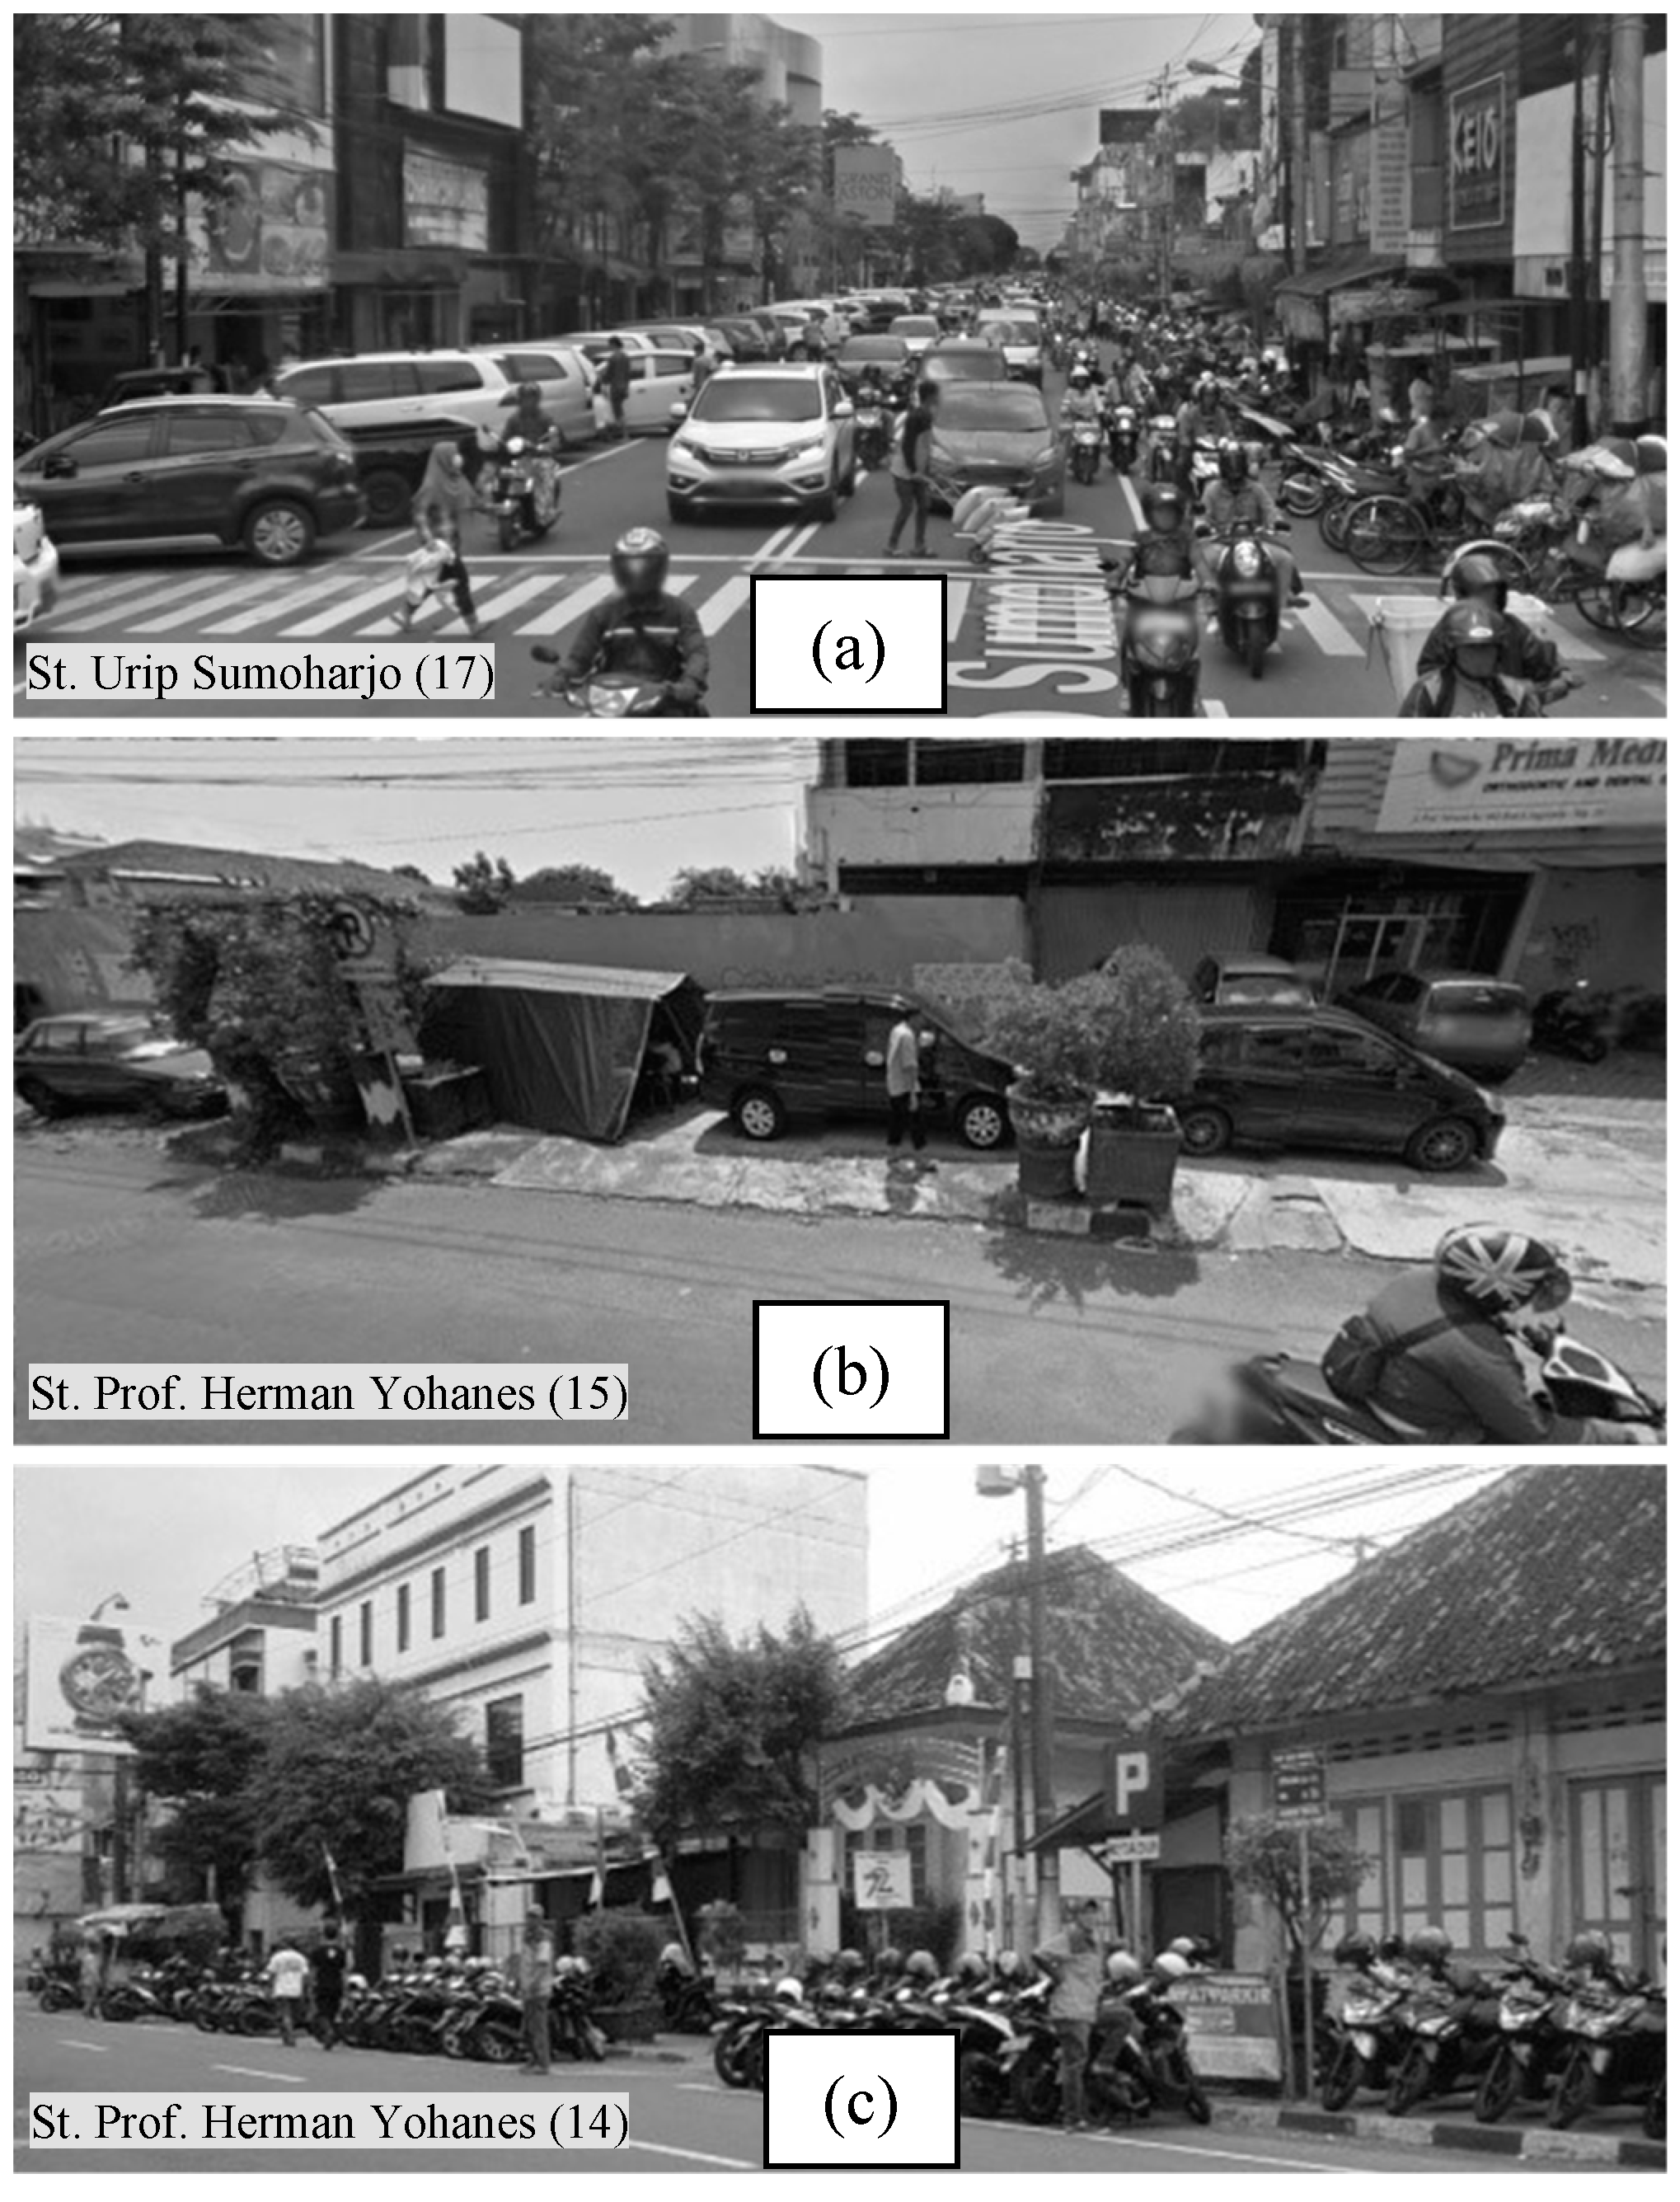
As shown on the left of Figure 1, two lanes on St. Urip Sumoharjo are used for illegal on-street parking: one for motorcycles and pedicabs and the other for passenger cars. Due to excessive parking demand, vehicles are sometimes parked in two lines on each side and even on sidewalks. The middle and bottom photos of Figure 1—which were taken on St. Prof. Herman Yohanes, another main street of the Gondokusuman District—show that passenger cars as well as motorcycles are parked on sidewalks. This sidewalk parking forces pedestrians to walk on automobile roads, which critically harms traffic safety [3,4,5].
2. Remote Sensing and GIS Studies on Parking
There are an excessively small number of studies that have used remote sensing and GIS for parking research [6]. Similar to this study, Fauziati [7] evaluated the degree to which QuickBird remote sensing data can be used to assess parking service conditions in eight street segments of Yogyakarta City. He found that the imagery was capable of predicting land use and parking patterns, street lengths, and street widths at the accuracy rates of 85.14%, 100%, 97.65%, and 93.18%, respectively. Li and Guan [8] used GPS PDOP (Position Dilution of Precision) data in order to improve the efficiency of the parking space search on the campus of University of Nebraska–Lincoln. In the City of Bat Yam, Levy and Benenson [9] evaluated parking patterns, particularly the fit between residential overnight parking demand and parking capacity, using a GIS-based technique called PARKFIT. Compared to them, this particular study evaluates all types of parking, not just residential parking and it considers not only passenger cars, but also motorcycles, which make up about 85% of the registered vehicles in Yogyakarta City. Lastly, Levy et al. [10] applied an ArcGIS application called the PARKAGENT model to the case of a Diamond Exchange area in Tel Aviv, Israel. In contrast to this study, they examined a search for parking spaces by a driver, not parking demand. In general, previous studies have used remote sensing and GIS approaches for parking space searches and the match between the supply and the demand of parking spaces, but few studies have analyzed through inferential statistics the relationship that parking characteristics have with land use and street characteristics [11,12].
3. Analysis
3.1. Case Study
Yogyakarta City is the capital of the Special Region of Yogyakarta; this province is located in the central part of Java Island. In 2015, Yogyakarta City had a population density of 12,698 persons/km2 (area = 32.5 km2 and population = 412,704 persons) [1]. Yogyakarta City is the center of economy, education, tourism, and culture in the province. As presented in Figure 2, the Gondokusuman District (area = 3.99 km2) is one of 14 districts in Yogyakarta City. Around 85% of the district is built-up areas, mostly low-rise buildings. The district has the highest population in Yogyakarta City, 11.35% of its population [1].
3.2. Data and Methods
QuickBird imagery of 2014 (geometrically corrected) was used to evaluate parking angle and land use of each street segment, as with Fauziati [7]. Because the imagery has no geometrical error, it can help to interpret objects. (Strictly speaking, every image has in some sense geometrical errors according to the type of analyzed data; terrain coverage almost always has radial distortions.) This study used the segment as the unit of analysis. The city government defines the segment considering the function of a block and its land use. Then, the digitization of the segment was conducted on a screen after the visual interpretation of the imagery, particularly for the initial identification of land use and street characteristics. Land use was evaluated by examining such characteristics as color, shadow, and pattern. Also, GIS tools were employed to evaluate parking characteristics such as parking angle, street length, and land use. Since the imagery is outdated by three years (i.e., 2014 imagery, but 2017 parking characteristics), the current Administration Map of Indonesia—two 1:25,000 scale maps, each of which was for Yogyakarta City and Timoho—and the road network map of the Yogyakarta City Master Plan of 2015–2035 were used to update the values of the variables. The field survey was conducted for 10 hours in each segment—on the same Friday from 8 AM to 6 PM—to confirm the accuracy of the imagery interpretation through visual examination and to compute or confirm parking capacity such as parking demand, volume, duration, and angle. Then, this study used multiple linear regression to identify land use and street characteristics that affect parking duration and demand.
To evaluate on-street parking service and related issues, this study manually collected data on the following parking characteristics: street length, parking demand, parking volume, parking duration (time), parking angle, and parking capacity. As shown in Figure 3, the street length is defined as the length of a street segment used for parking. The parking demand in this study means the maximum number of vehicles that are parked at the same time on the segment. The parking volume is the sum of the parked vehicles in the survey day. The parking duration refers to the average time span during which a vehicle is parked on the segment. The formula of each parking characteristic is as follows:
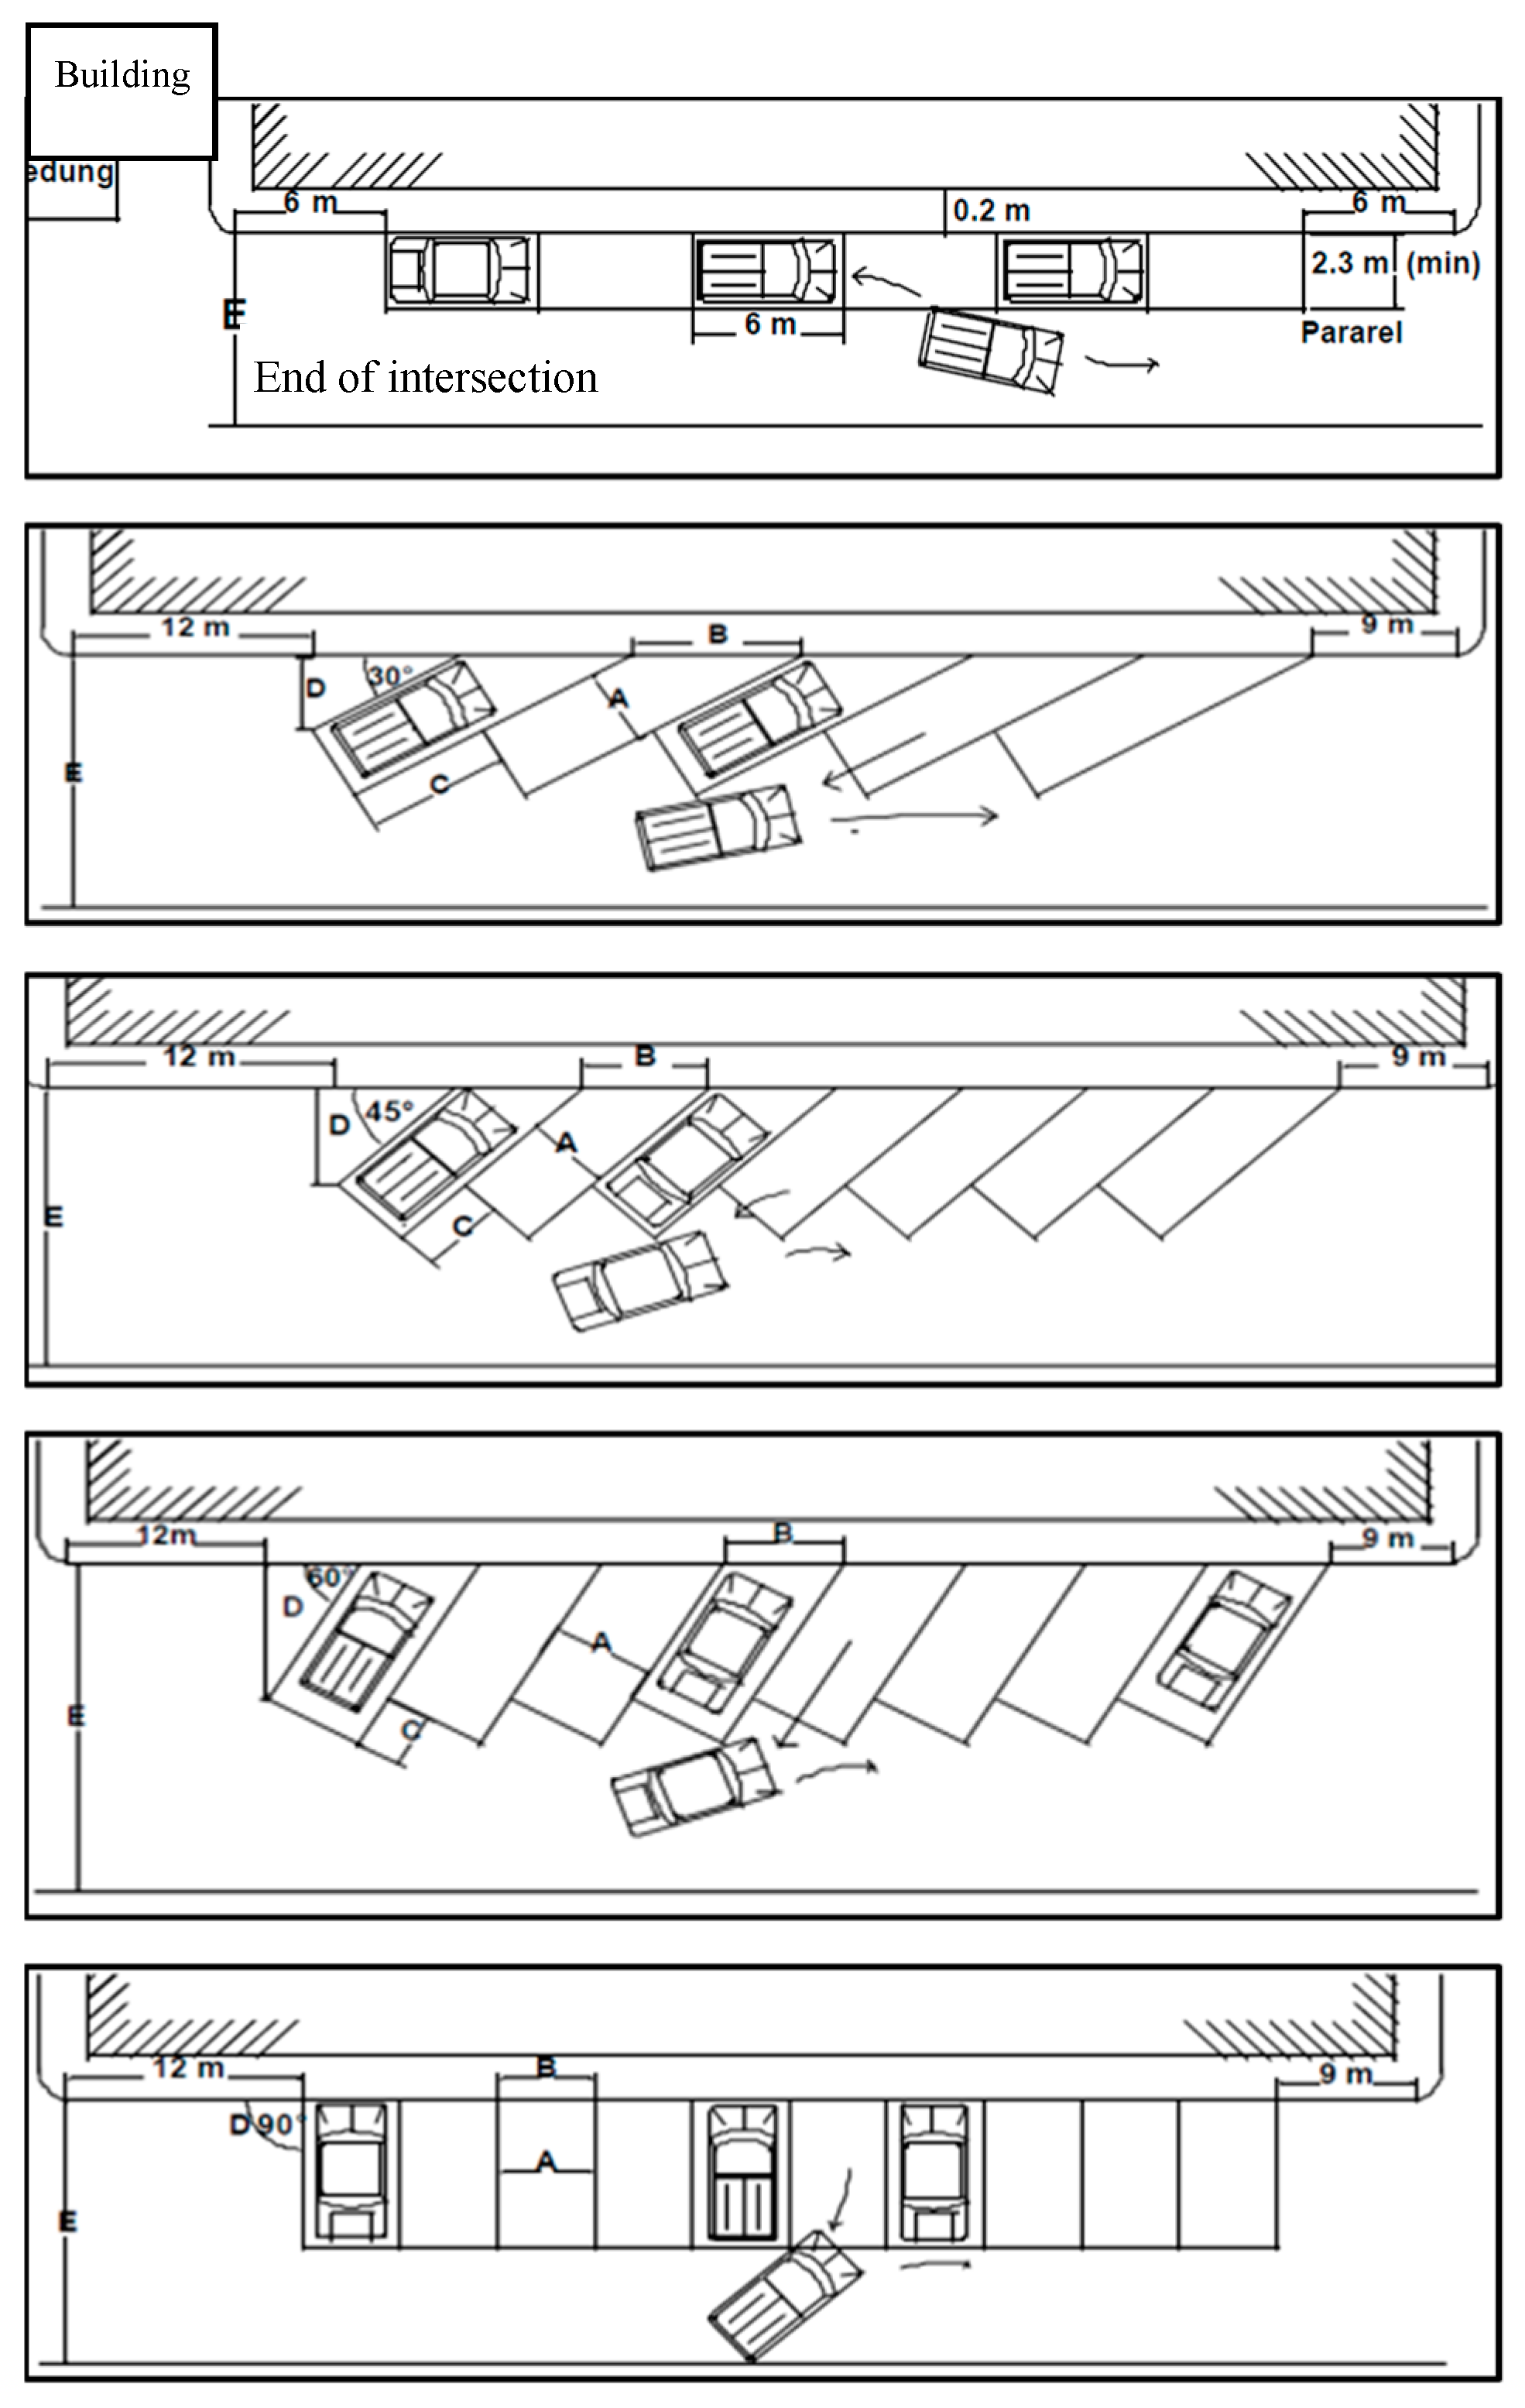
The parking angle refers to the angle between the side of a parking space and a line parallel to the street. As in Figure 4, on-street parking has either a parallel (0 degrees) or an angular system with four slopes: 30, 45, 60, and 90 degrees. The angle has an impact on the parking capacity of the street segment and subsequently on its traffic congestion. Lastly, the parking capacity is defined as the maximum number of vehicles that the segment can carry at the same time. As shown in Table 1, the capacity was officially calculated based on the street length, parking angle, and vehicle type by the Yogyakarta City Department of Transportation in 2011.
Notably, different types of vehicles are parked together on a street segment. Thus, in statistical analyses, this study did not directly use the counts of the vehicles, but the summed area (m2) based on the actual size of each vehicle, which was manually measured by fieldworkers.
QuickBird imagery has been reported to reliably provide information on the ground surface, especially on large-scale land use with the interpretation accuracy of above 90% [14,15,16]. However, the degree of object recognition and the accuracy and reliability of photointerpretation may vary according to the place of image registration, type of identified objects, current position of the satellite sensor, etc. Therefore, a field survey was somewhat necessary in order to check the accuracy of imagery interpretation, particularly to take into due consideration motorcycle sizes and parking angles. First, compared to passenger cars, motorcycles could not be fully captured in QuickBird imagery because while the definition of the imagery pixel is 60 × 60 cm, motorcycles are typically 50 × 80 cm in size and its length is about 175 cm, denoting that a motorcycle cannot be represented by more than one pixel. Second, GIS raster geometry was also not highly useful in interpreting the parking angle, in the sense that trees and building shadows in the imagery sometimes made it difficult to identify parking angles.
Figure 5 presents street segments that are used for parking in the study area and its demand. Figure 6 shows an example of how this study calculated parking angles. Through the field survey, the authors found that parking angles are either 0° or 45° for passenger cars while motorcycles on all street segments were parked orthogonally (90°), except for those motorcycles that were parked along St. Urip Sumoharjo; their parking angle was consistently 45°.
In the following section, this study will first present the descriptive statistics of research variables in relation to whether their variations are wide enough for statistical inference. The descriptive statistics will also be used to describe unique parking conditions in Yogyakarta City inasmuch as it is relatively unfamiliar to Western researchers. Then, multiple regression models will be specified with the same set of explanatory variables in order to explain variations in parking duration and demand. Subsequently, major findings of the models will be discussed to draw policy implications for the city.
3.3. Results
Table 2 presents the min and max, the mean, and the standard deviation of research variables. As intuitively evaluated, they appear to well represent the parking characteristics of Yogyakarta City. More importantly, the variations of the characteristics are wide enough for inferential analysis and linear regression in this particular study.
Table 3 shows the length of each street segment and its parking capacity, which is defined as the maximum vehicles that can be carried for parking. In the areal unit (i.e., meter), the capacity is determined not only by the street length, but also by the parking angle [17]: The steeper the parking angle, the larger the parking capacity is provided. In the sample, the GARDENA of St. Urip Sumoharjo is found to have the largest capacity not only because it has the longest length, but also because its angle is 45° instead of 0°.
Table 4 shows that the parking demand is the highest in GARDENA according to the absolute count (231 cars) as well as to the area (2656.5 m2). The segment also has the largest volume in terms of the absolute count (793 cars). However, in the areal unit, the largest volume is found in TOKO EMAS partially because the segment is located on St. Laksada Adisucipto, which is the major arterial to the Yogyakarta International Airport (Adisucipto Airport). The street is well known for frequent traffic congestion, especially along those street segments that have double-sided on-street parking, such as TOKO EMAS.
Notably, the highest volume of GARDENA is attributed to motorcycles, as shown in Table 5. On the survey day, only two passenger cars (23 m2) were parked on the segment. Regarding passenger cars, their volume was the highest on the segment of GALERIA Mall 2, the major upscale shopping area in the city, both in number and area. This indicates that in the city, the passenger car is generally regarded as a luxurious good and for the utilitarian purpose of transportation, the motorcycle plays an important role [18,19]
Figure 7 visualizes parking durations and parking-related characteristics considered in this study. In general, lengthy parking occurs in a commercial area where movie theaters are located while areas near markets show relatively shorter parking spans. This parking time difference somewhat hinges on planned activities after the parking: If people watch movies, they should park their vehicles over the movie running time, about two hours, but if they buy commodities, lengthy parking is not necessary. Areas near hotels were expected to present longer parking durations, but among parked vehicles in the areas, more than 60% spent less than an hour. This may be because the vehicles do not belong to hotel customers, that is, most would be taxis that pick up or drop off passengers or wait for customers. Indeed, hotel employees and visitors usually park their vehicles in a designated parking lot inside the hotel property.
Table 6 shows that at the 90% confidence level, parking volume, street length, and the presence of commercial land use are significantly related to the variation in the parking duration. Based on the standardized coefficient, whether the land use is commercial had the largest effect on the duration (in Table 6, standardized coefficient = 0.560). Notably, R2 value is relatively low, which implies that there exist other important determinants of parking duration.
In Figure 5, which presents the entire street segments and land uses in the Gondokusuman District, the parking demand of each segment is also illustrated. In general, the highest parking demand is present in areas where the dominant type of parked vehicles is the motorcycle, including St. Prof. Herman Yohanes, St. Urip Sumoharjo, St. Affandi, and St. Laksada Adisucipto. The demand was around 447 m2 to 2657 m2, on average 231 motorcycles. The demand of most of these segments was more than twice of its capacity. Such a supply deficit has often led to parking rule violations (e.g., sidewalk parking).
Regarding the parking demand, the street length was found to be the only significant variable. Nonetheless, the model itself had a relatively high explanatory power, as evaluated by R2 (= 0.648) (see Table 7). Thus, at least in Yogyakarta City, the length of the on-street parking itself can be a relevant policy measure for effective parking management. Indeed, the longer the street length, the larger the parking capacity, allowing for larger demand for parking. Among the sampled street segments, GARDENA on St. Urip Sumoharjo has the longest length as well as the largest parking demand.
Notably, when the parking volume and street length were controlled for, the land use type did not significantly affect the parking demand. In this sense, as opposed to our initial expectation, land use may not be an effective measure for parking management. (It cannot be used as a “proxy,” either, in the sense that as shown in the VIF statistic, it has low collinearity with other research variables [20,21].) For mitigating parking demand, the Yogyakarta City Government categorized its jurisdiction into differential parking zones. The categorization is mainly based on land use, specifically whether the parking facility is located in tourism and commercial areas. Given the above finding, they are advised to add the street length criterion to the existing parking fare system.
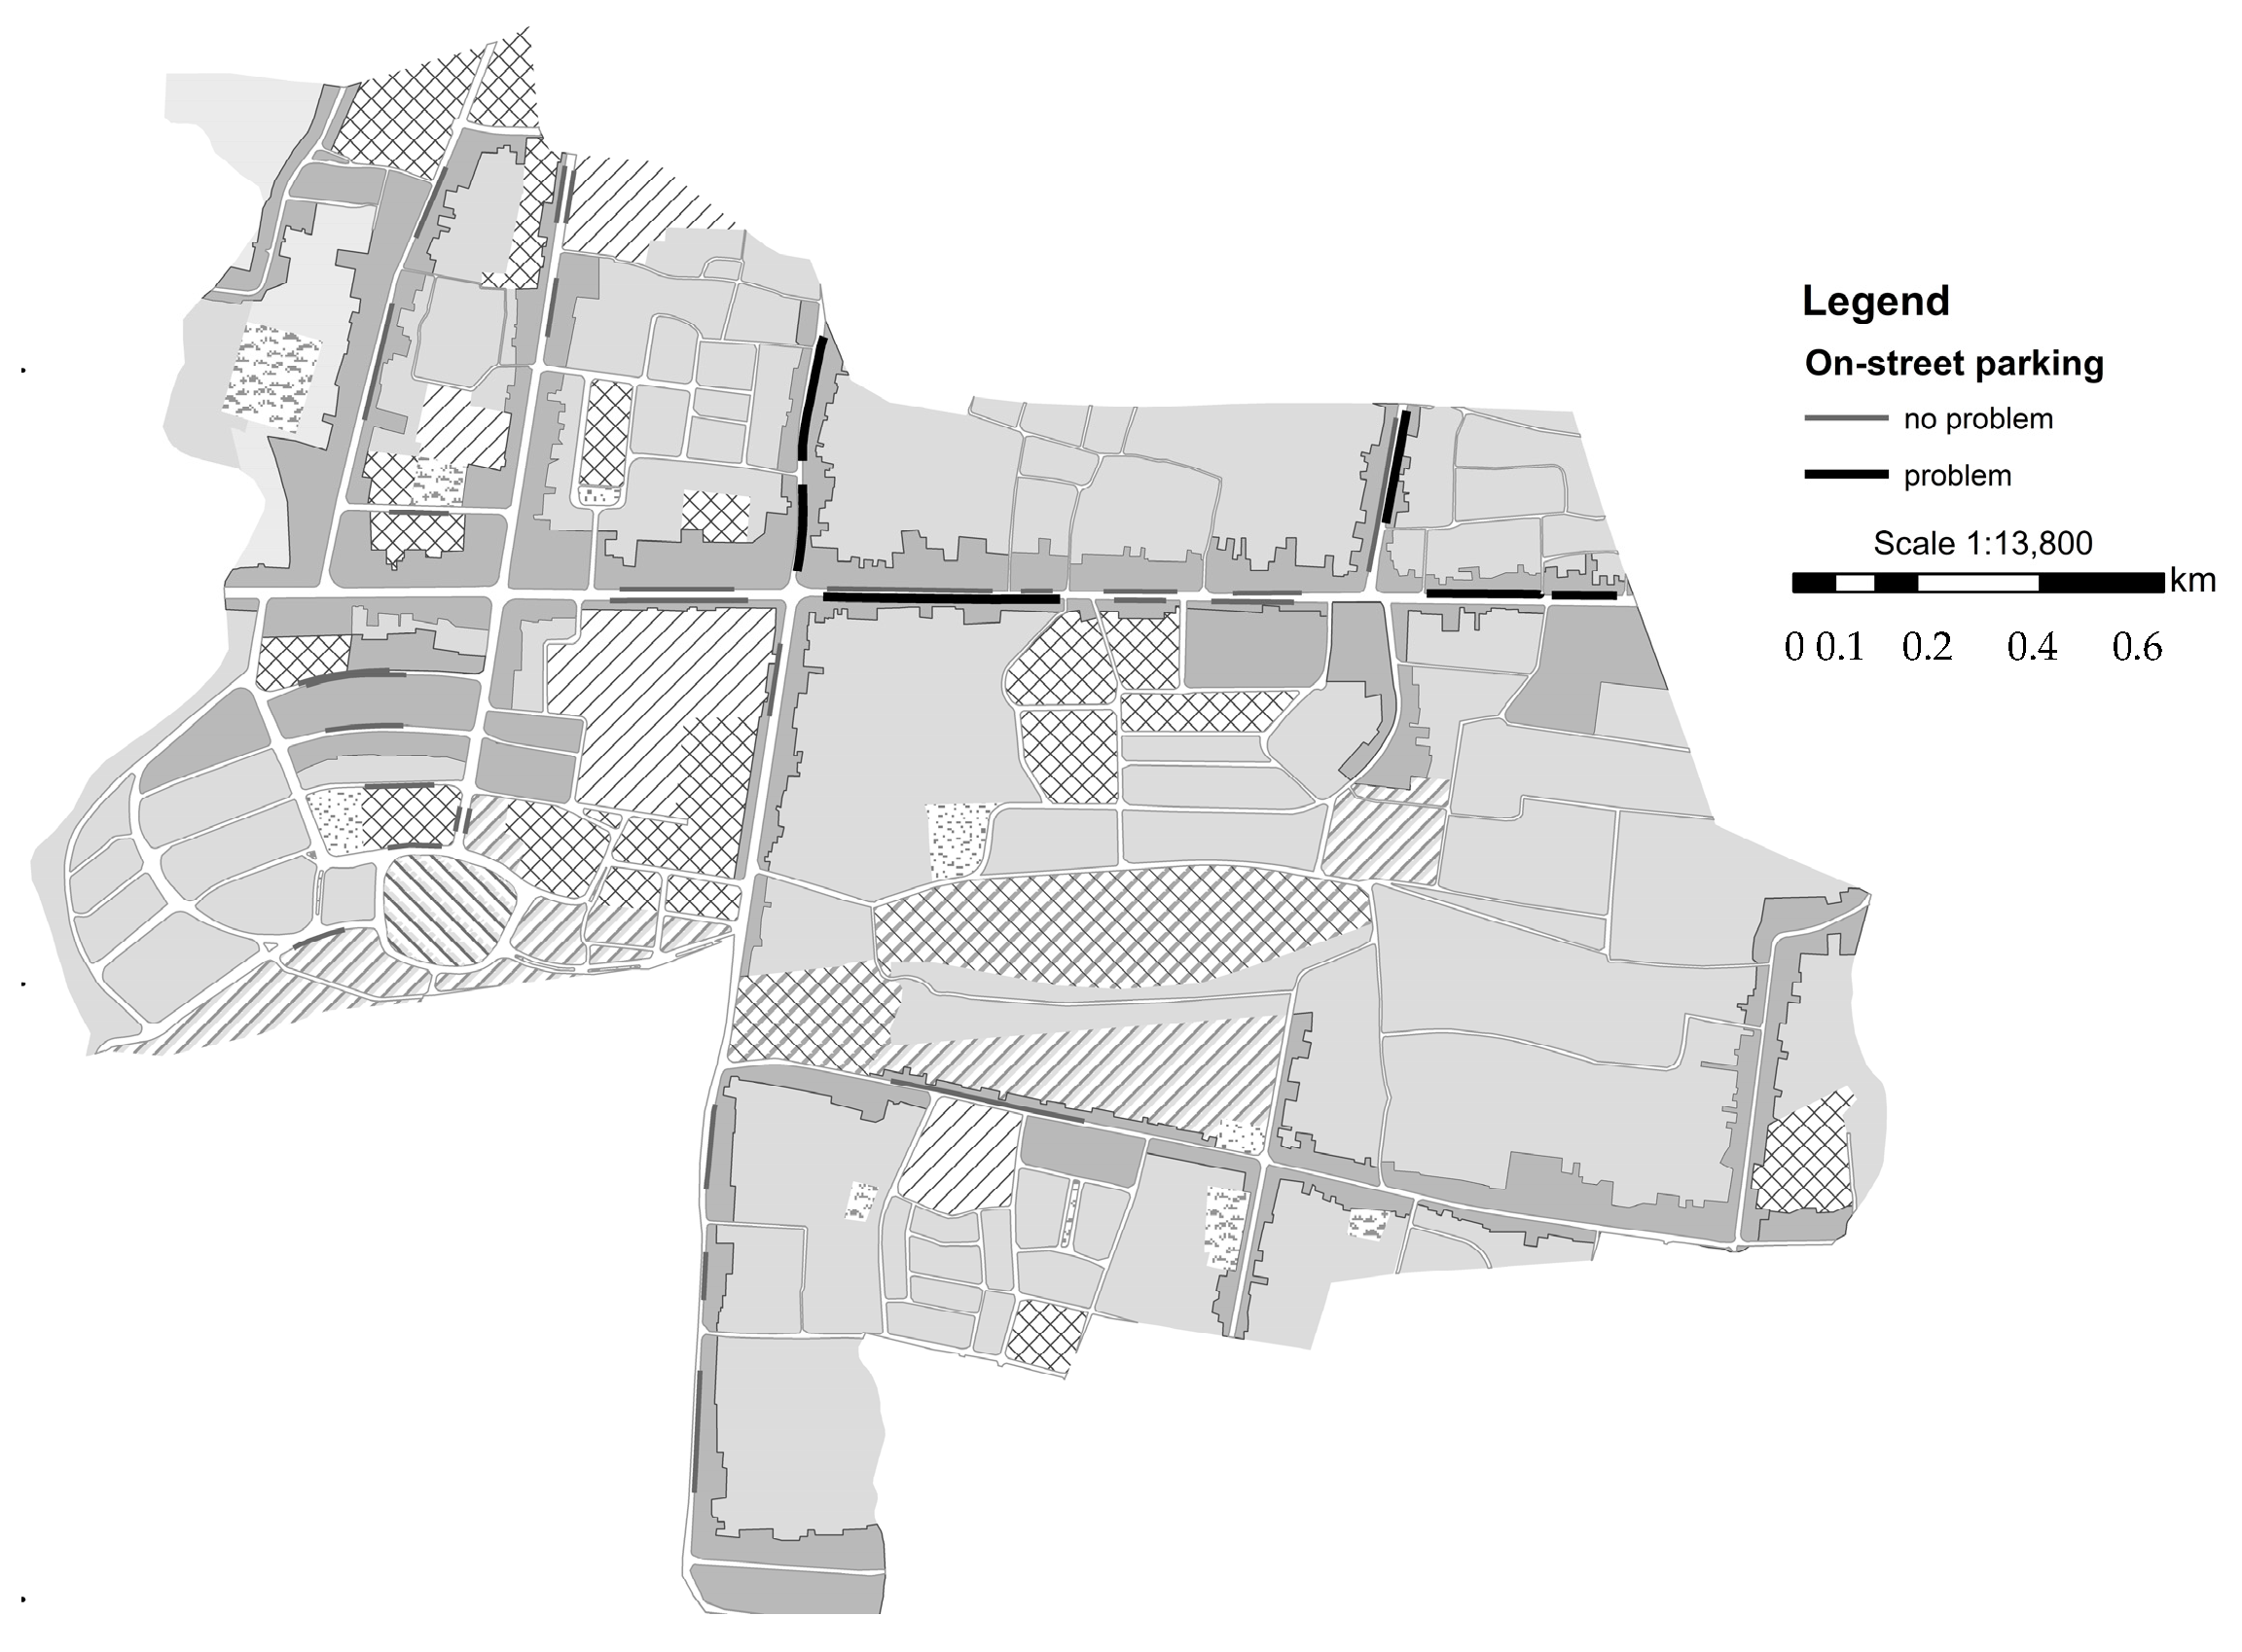
Figure 8 presents six street segments with a parking demand surplus. On a few segments, the demand for parking is twice as high as its capacity. As shown above in Table 3, the demand-supply mismatch is brought about by excessive motorcycle parking. In fact, in major Indonesian cities, motorcycle parking management is arguably a key to the success of parking management because if a parking area is full, passenger car drivers, unlike motorcyclists, explore alternative areas rather than forcefully parking their cars in the initially considered area. Owing to their small sizes, motorcycles are often parked on the roadway and sidewalk, close to the final destination.
4. Summary
Despite its considerable impact on the traffic congestion and safety, on-street parking has not been duly investigated mainly because of data limitations [6] and it was particularly so in major cities in developing countries like Indonesia; often, naturally originated on-street parking is not considered in comprehensive transportation plans. At this juncture, this study, using a case of Yogyakarta City, explored the potential of remote sensing imagery in identifying the demand and volume of on-street parking and in analyzing how they are affected by several street and land use characteristics. In its exploratory nature, this study examined a total of 21 street segments for on-street parking and found that difficulties exist in interpreting parking characteristics through QuickBird satellite imagery, specifically in identifying the parking angle, in the sense that most on-street parking segments were covered with trees and they had no parking lines. Also, motorcycles were parked without a fixed angle. A second issue was that small objects—for example, motorcycles—could not be precisely identified since they were too small for the imagery to capture with more than one pixel. In this sense, in order to estimate parking volumes in Asian developing countries in which motorcycles assume a considerable proportion of the mode share, it may be indispensable to conduct a supplementary field survey as with this study.
The empirical regression models found that the (average) parking duration is differentiated by the (daily total) parking volume, street length, and existence of commercial type of land use while the parking demand (i.e., maximum number of parked vehicles in the areal unit) is affected only by the street length. Thus, if planners consider parking time limit—the maximum allowable time for parking—or time-based differential parking fare, they may first consider implementing it in commercial districts or long street segments. To mitigate the demand–supply mismatch, which stands for the situation that the supply is less than the demand, planners are recommended to divide the long street segment into shorter sections.
This study had several limitations. It did not consider possibly important factors on the parking demand and duration including driver’s inherent sociodemographic and attitudinal characteristics [23]. Second, while this study intended to apply a remote sensing approach in evaluating the parking demand and supply, neither was successfully measured with high accuracy. This is why a supplementary field survey was adopted as a means of suggesting an alternative for compensation. A further study is recommended to employ different types of airborne images as taken by airplane, drone, and others.
Acknowledgments
This work was supported by the Ministry of Education of the Republic of Korea and the National Research Foundation of Korea (NRF-2017S1A5A2A02067705).
Author Contributions
Carolina Ajeng designed the research, collected data, and wrote the paper; Tae-Hyoung Tommy Gim advised the first author, conducted statistical analyses, and wrote the paper.
Conflicts of Interest
The author declares no conflict of interest.
References
- Statistic of Yogyakarta City. Land Transportation Statistics; Statistic of Yogyakarta City: Yogyakarta, Indonesia, 2016. [Google Scholar]
- Indonesian General Directorate of Land Transportation. Pedoman Teknis Penyelenggaraan Fasilitas Parkir; Indonesian Department of Transportation: Jakarta, Indonesia, 1998. [Google Scholar]
- Cui, J.; Loo, B.P.Y.; Lin, D. Travel behaviour and mobility needs of older adults in an ageing and car-dependent society. Int. J. Urban Sci. 2017, 21, 109–128. [Google Scholar] [CrossRef]
- Loo, B.P.Y.; du Verle, F. Transit-oriented development in future cities: Towards a two-level sustainable mobility strategy. Int. J. Urban Sci. 2017, 21, 54–67. [Google Scholar] [CrossRef]
- Zhang, X.; Riedel, T. Urban traffic control: Present and the future. Int. J. Urban Sci. 2017, 21, 87–100. [Google Scholar] [CrossRef]
- Cho, S. A study of Applying Smart Parking to Seoul; Seoul National University: Seoul, Korea, 2016. [Google Scholar]
- Fauziati, Y. Quickbird Image Utilization to Interpret Conditions of Vehicle Parking Space on Each Segment of the Street; Gadjah Mada University: Yogyakarta, Indonesia, 2012. [Google Scholar]
- Li, R.; Guan, Q. Environmental campus: Managing campus parking meters using gps and gis. In Proceedings of the 2011 International Symposium on Water Resource and Environmental Protection, Xi’an, China, 20–22 May 2011. [Google Scholar]
- Levy, N.; Benenson, I. Gis-based method for assessing city parking patterns. J. Transp. Geogr. 2015, 46, 220–231. [Google Scholar] [CrossRef]
- Levy, N.; Render, M.; Benenson, I. Spatially explicit modelling of parking search as a tool for urban parking facilities and policy assessment. Transp. Policy 2015, 39, 9–20. [Google Scholar] [CrossRef]
- Ramani, T.L.; Zietsman, J. Sustainable transportation—alternative perspectives and enduring challenges. Int. J. Urban Sci. 2016, 20, 318–333. [Google Scholar] [CrossRef]
- Thilakaratne, R.S.; Wirasinghe, S.C. Implementation of bus rapid transit (brt) on an optimal segment of a long regular bus route. Int. J. Urban Sci. 2016, 20, 15–29. [Google Scholar] [CrossRef]
- Yogyakarta City Department of Transportation. Studi dan pola Jaringan Jalan Kota Yogyakarta; Yogyakarta City Department of Transportation: Yogyakarta, Indonesia, 2011. [Google Scholar]
- Carter, G.; Lucas, K.; Blossom, G.; Lassitter, C.; Holiday, D.; Mooneyhan, D.; Fastring, D.; Holcombe, T.; Griffith, J. Remote sensing and mapping of tamarisk along the colorado river, USA: A comparative use of summer-acquired hyperion, thematic mapper and quickbird data. Remote. Sens. 2009, 1, 318–329. [Google Scholar] [CrossRef]
- Mallinis, G.; Galidaki, G.; Gitas, I. A comparative analysis of eo-1 hyperion, quickbird and landsat tm imagery for fuel type mapping of a typical mediterranean landscape. Remote. Sens. 2014, 6, 1684–1704. [Google Scholar] [CrossRef]
- Yin, J.; Zhou, C.; Gao, Y.; Zhang, J. Study on urban land use changes based on high resolution remote sensing images. Int. Arch. Photogramm. Remote. Sens. Spat. Inf. Sci. 2008, 37, 1623–1629. [Google Scholar]
- Anda, C.; Erath, A.; Fourie, P.J. Transport modelling in the age of big data. Int. J. Urban Sci. 2017, 21, 19–42. [Google Scholar] [CrossRef]
- Lin, D.; Allan, A.; Cui, J. Sub-centres, socio-economic characteristics and commuting: A case study and its implications. Int. J. Urban Sci. 2017, 21, 147–171. [Google Scholar] [CrossRef]
- Oguchi, T.; Mitsuyasu, A.; Oshima, D.; Imagawa, T. An evaluation study on advanced public transport priority system using traffic simulation. Int. J. Urban Sci. 2017, 21, 43–53. [Google Scholar] [CrossRef]
- Lee, S.; Suzuki, T. A scenario approach to the evaluation of sustainable urban structure for reducing carbon dioxide emissions in seoul. Int. J. Urban Sci. 2016, 20, 30–48. [Google Scholar] [CrossRef]
- Osman, T.; Divigalpitiya, P.; Arima, T. Driving factors of urban sprawl in giza governorate of the greater cairo metropolitan region using a logistic regression model. Int. J. Urban Sci. 2016, 20, 206–225. [Google Scholar] [CrossRef]
- SPSS Data. Available online: https://drive.google.com/open?id=1KTL0Xu7vuk4DpCdeQ-vwgASstyCtk1bH (accessed on 30 December 2017).
- Kim, Y. Impacts of the perception of physical environments and the actual physical environments on self-rated health. Int. J. Urban Sci. 2016, 20, 73–87. [Google Scholar] [CrossRef]
Figure 1.
On-street parking in the Gondokusuman District. (a) Traffic congestion caused by parking on both sides of the street, (b) Illegal parking on the sidewalk (passenger cars), (c) Illegal parking on the sidewalk (motorcycles). The first two pictures are from Google Images and the last one is from a field survey. The name and location of each street is shown on the bottom left of each picture (see Figure 5 and Table 3).

Figure 2.
Study area. (a) Administration Map of Yogyakarta City; (b) QuickBird Imagery Map of the Gondokusuman District.
Figure 2.
Study area. (a) Administration Map of Yogyakarta City; (b) QuickBird Imagery Map of the Gondokusuman District.
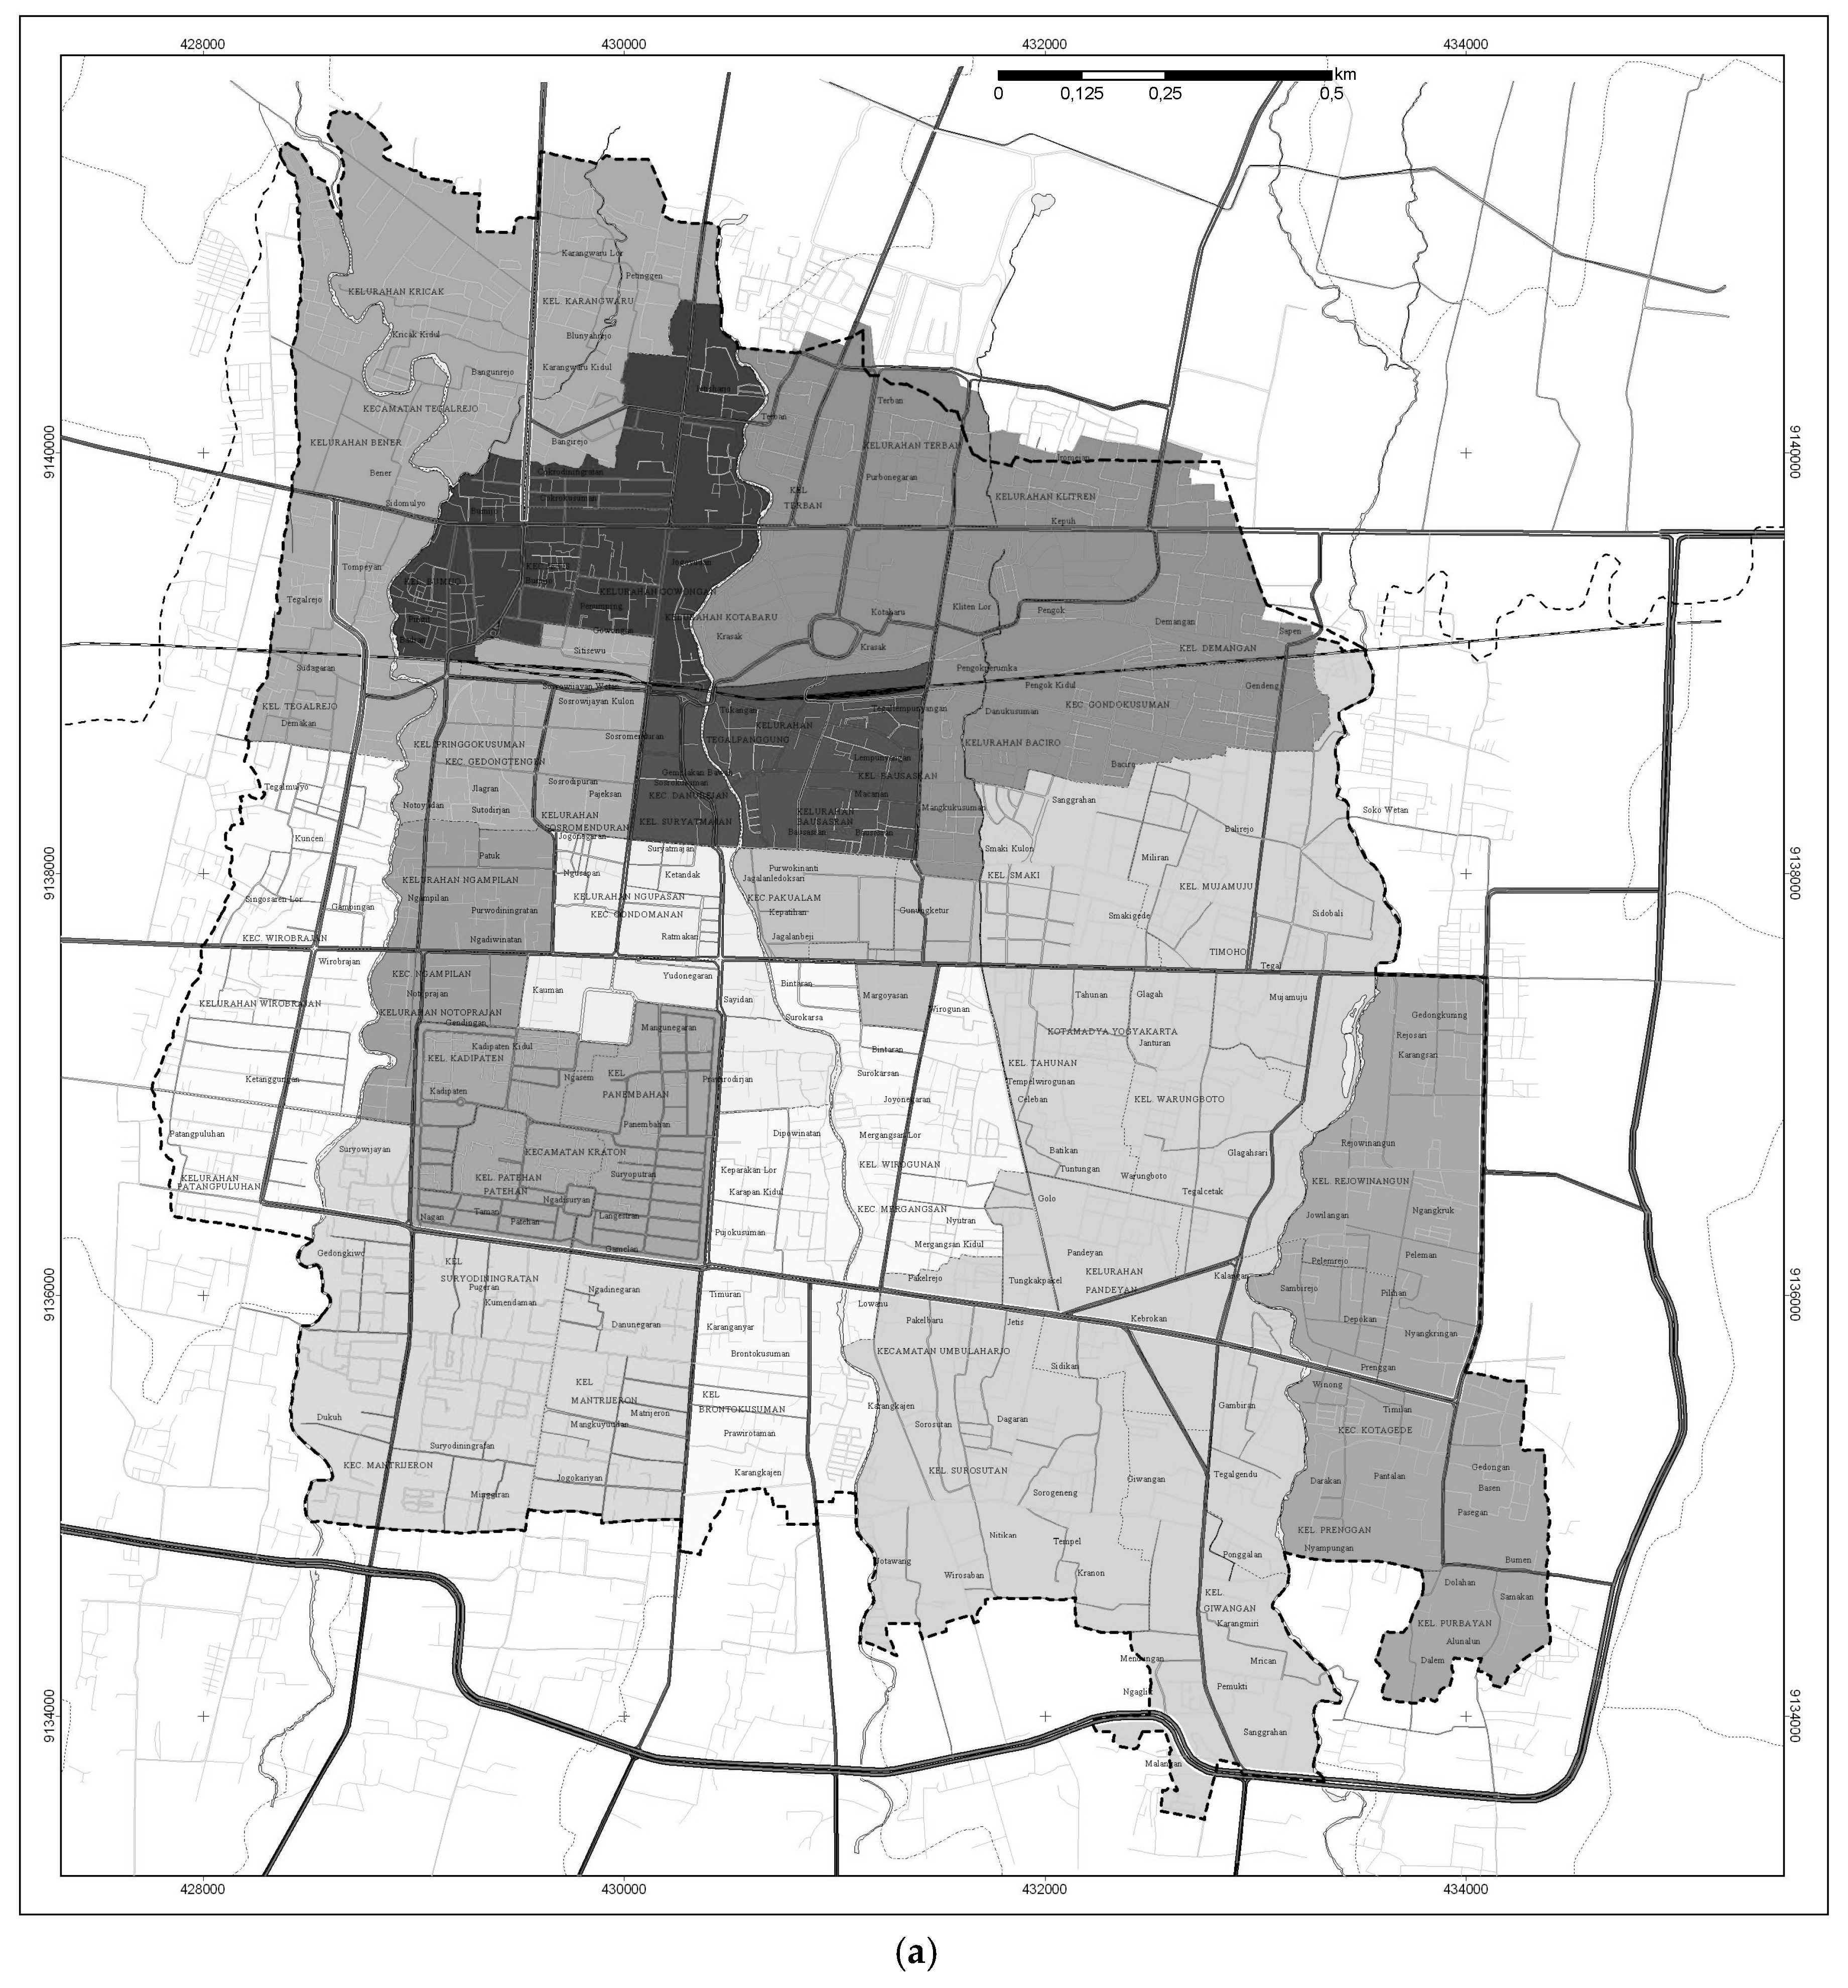
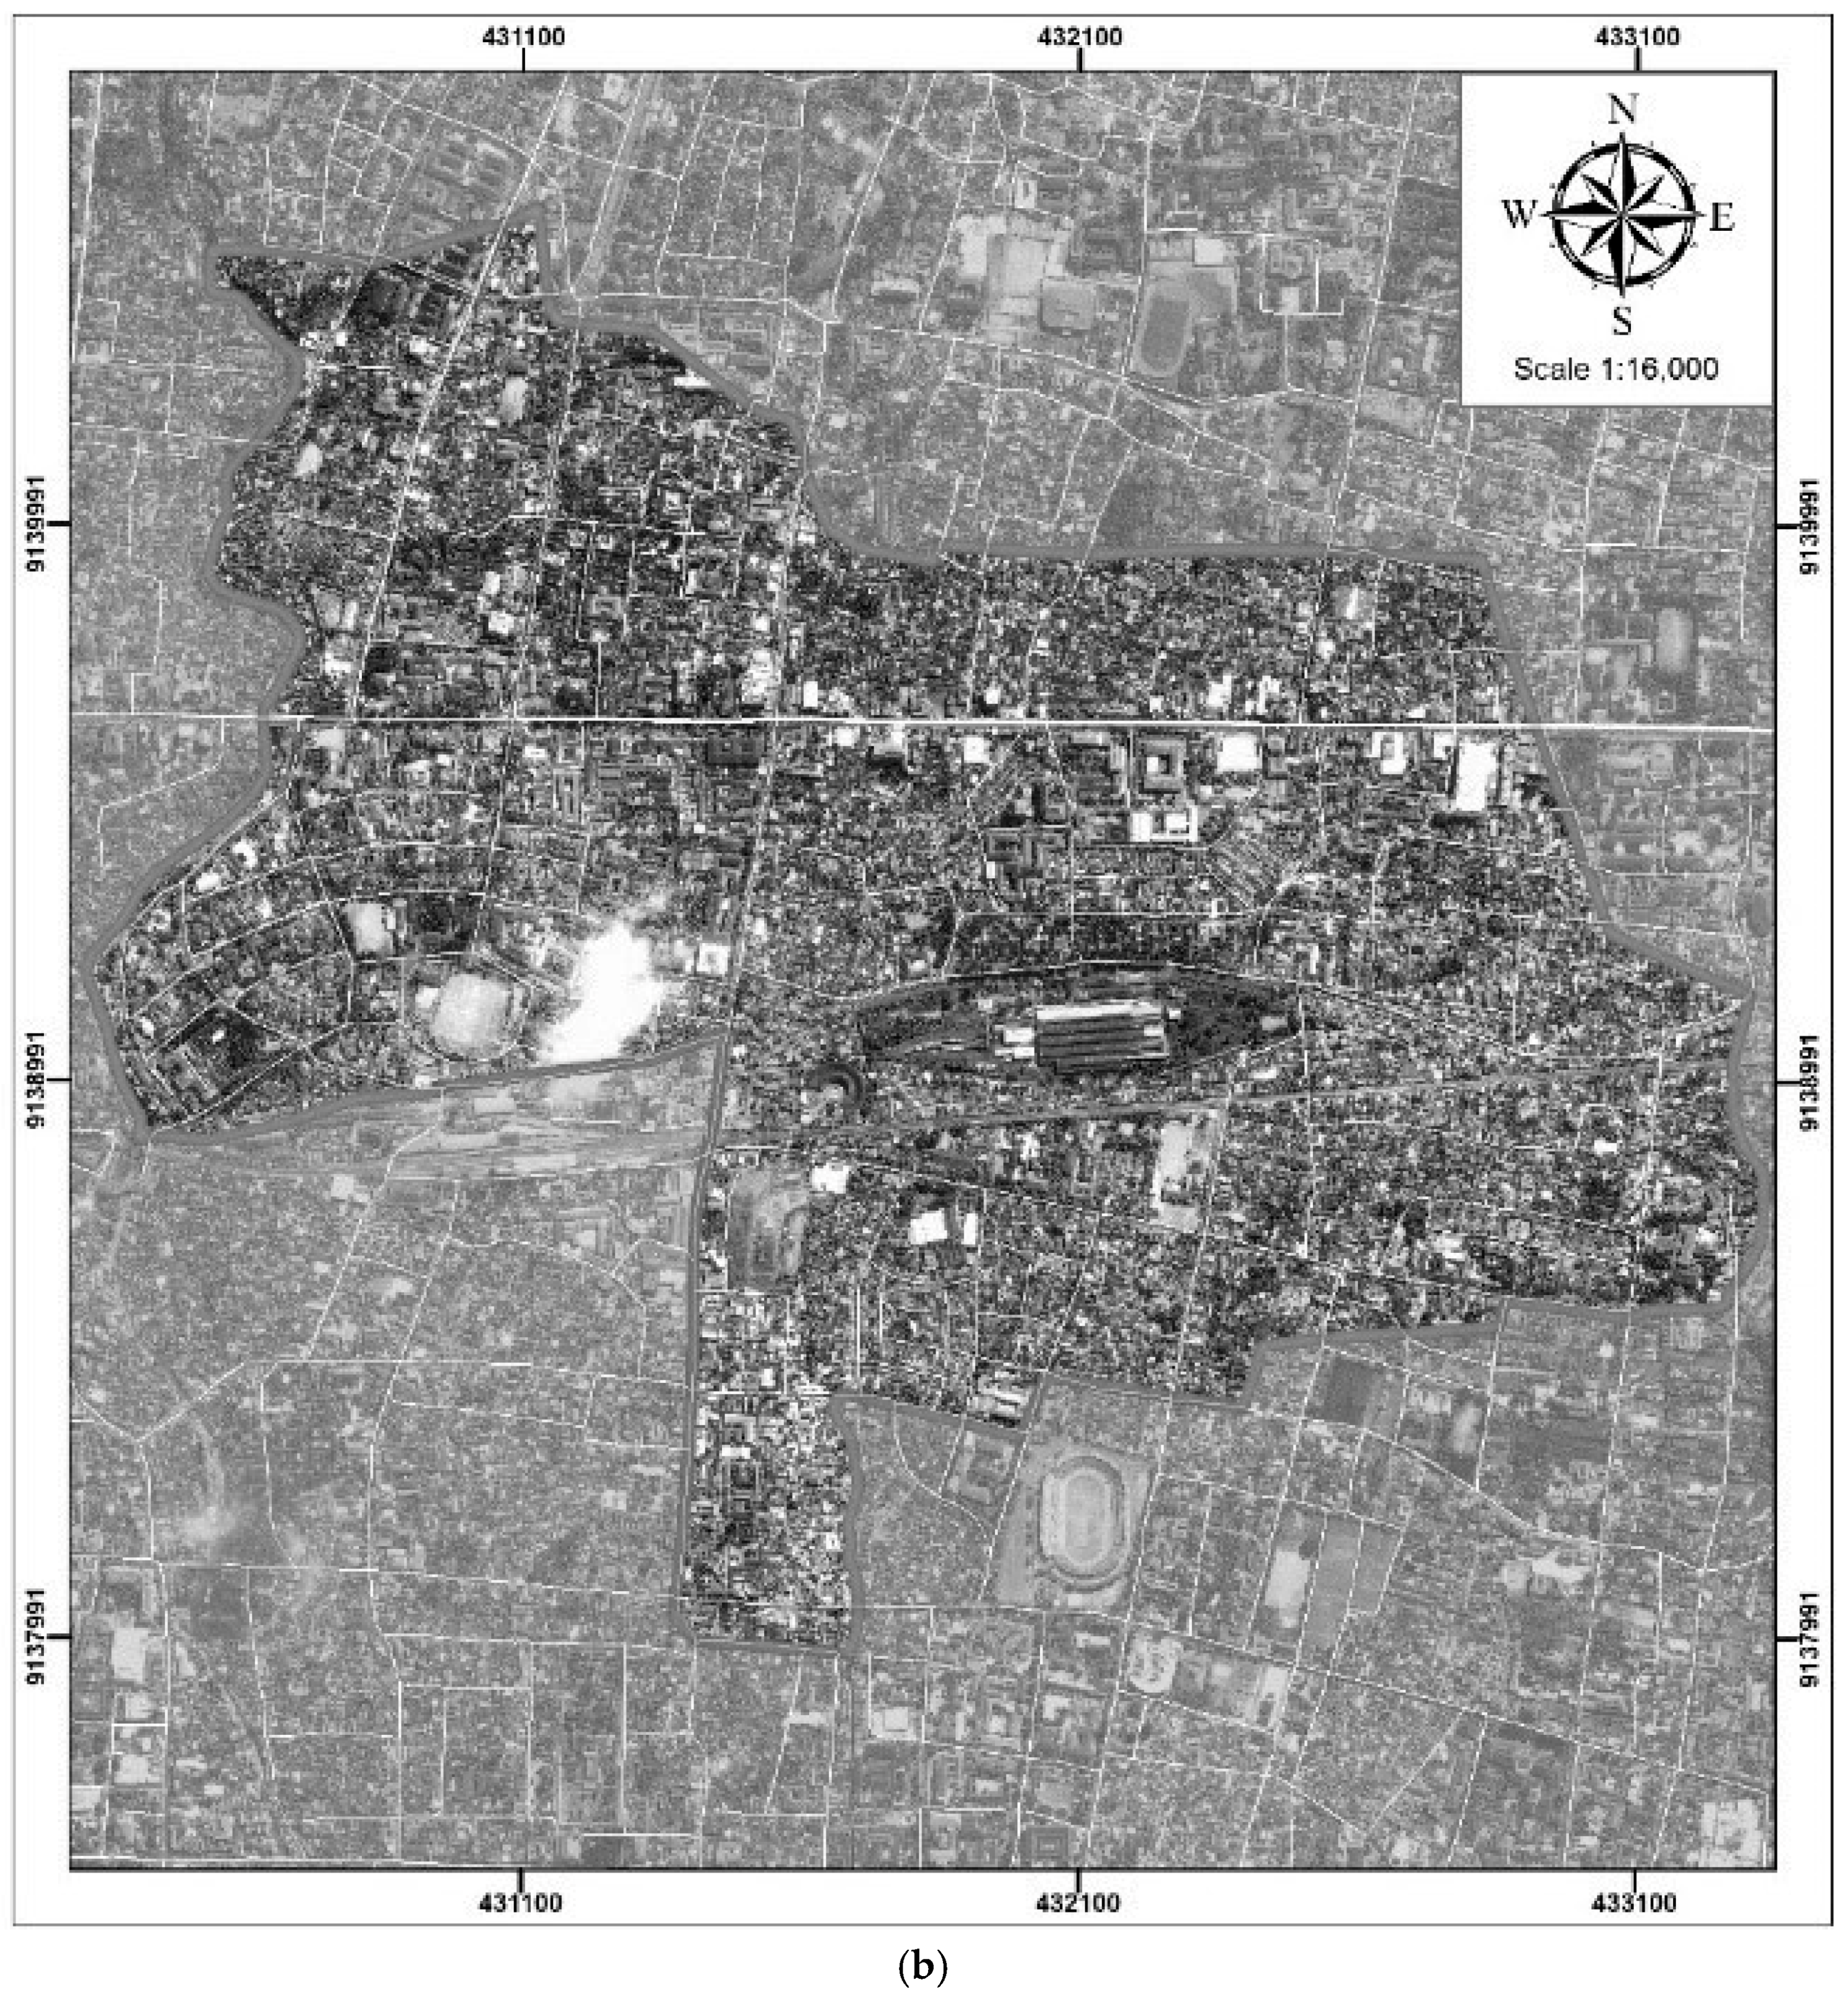
Figure 3.
Street length measurement.
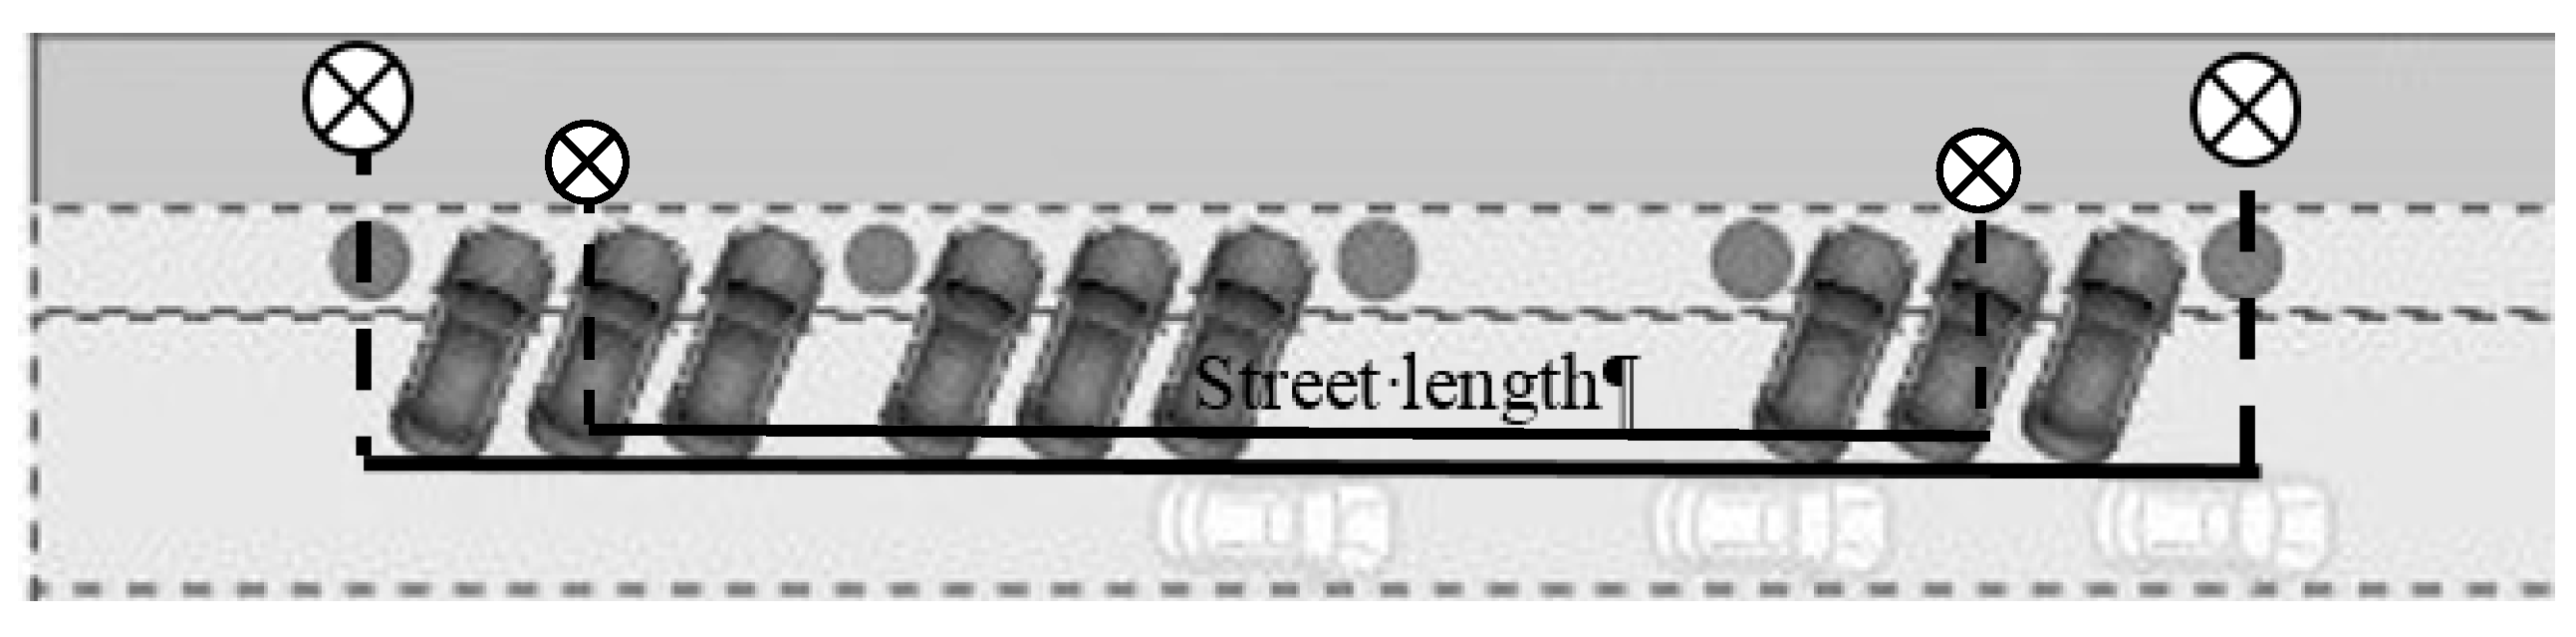
Figure 4.
On-street parking angles. The figures are from the Indonesian General Directorate of Land Transportation [2].
Figure 4.
On-street parking angles. The figures are from the Indonesian General Directorate of Land Transportation [2].

Figure 5.
Street segments for parking and its demand in the Gondokusuman District. For street and street segment names, see Table 3.
Figure 5.
Street segments for parking and its demand in the Gondokusuman District. For street and street segment names, see Table 3.
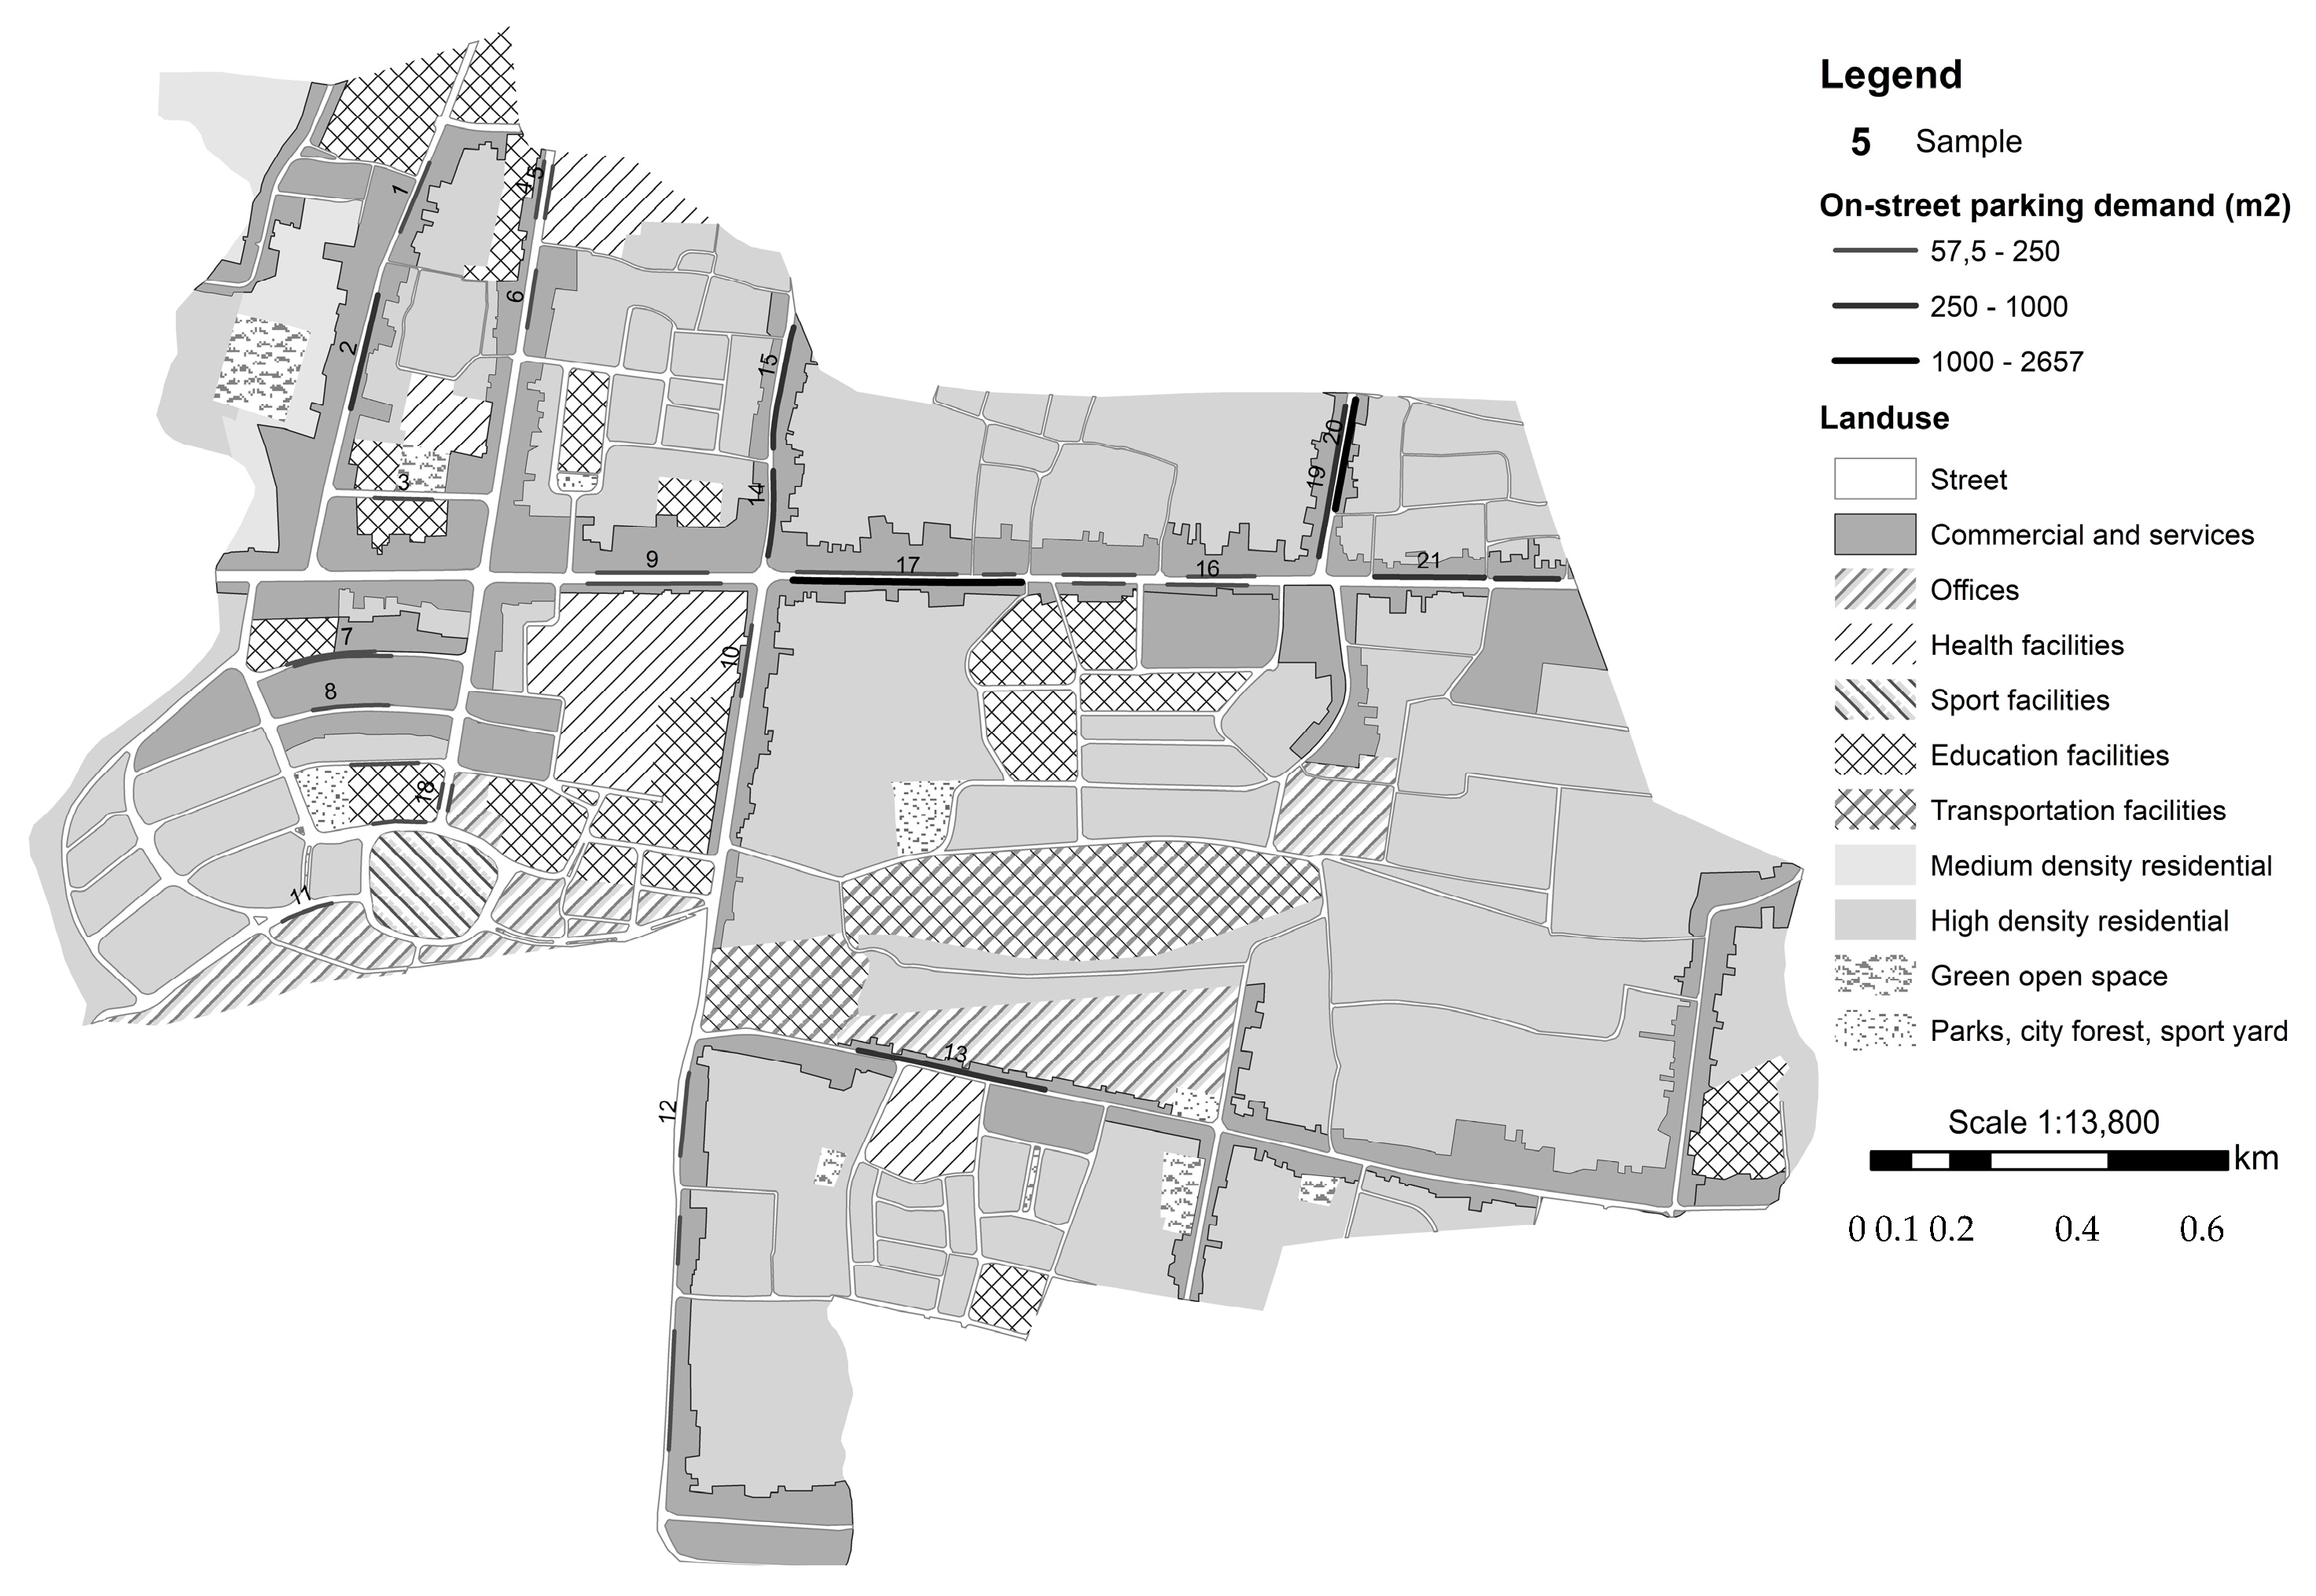
Figure 6.
Parking angles: satellite imagery (left) and field survey by the researchers (right).

Figure 7.
Parking durations: relatively longer durations on local roads than on arterial roads.
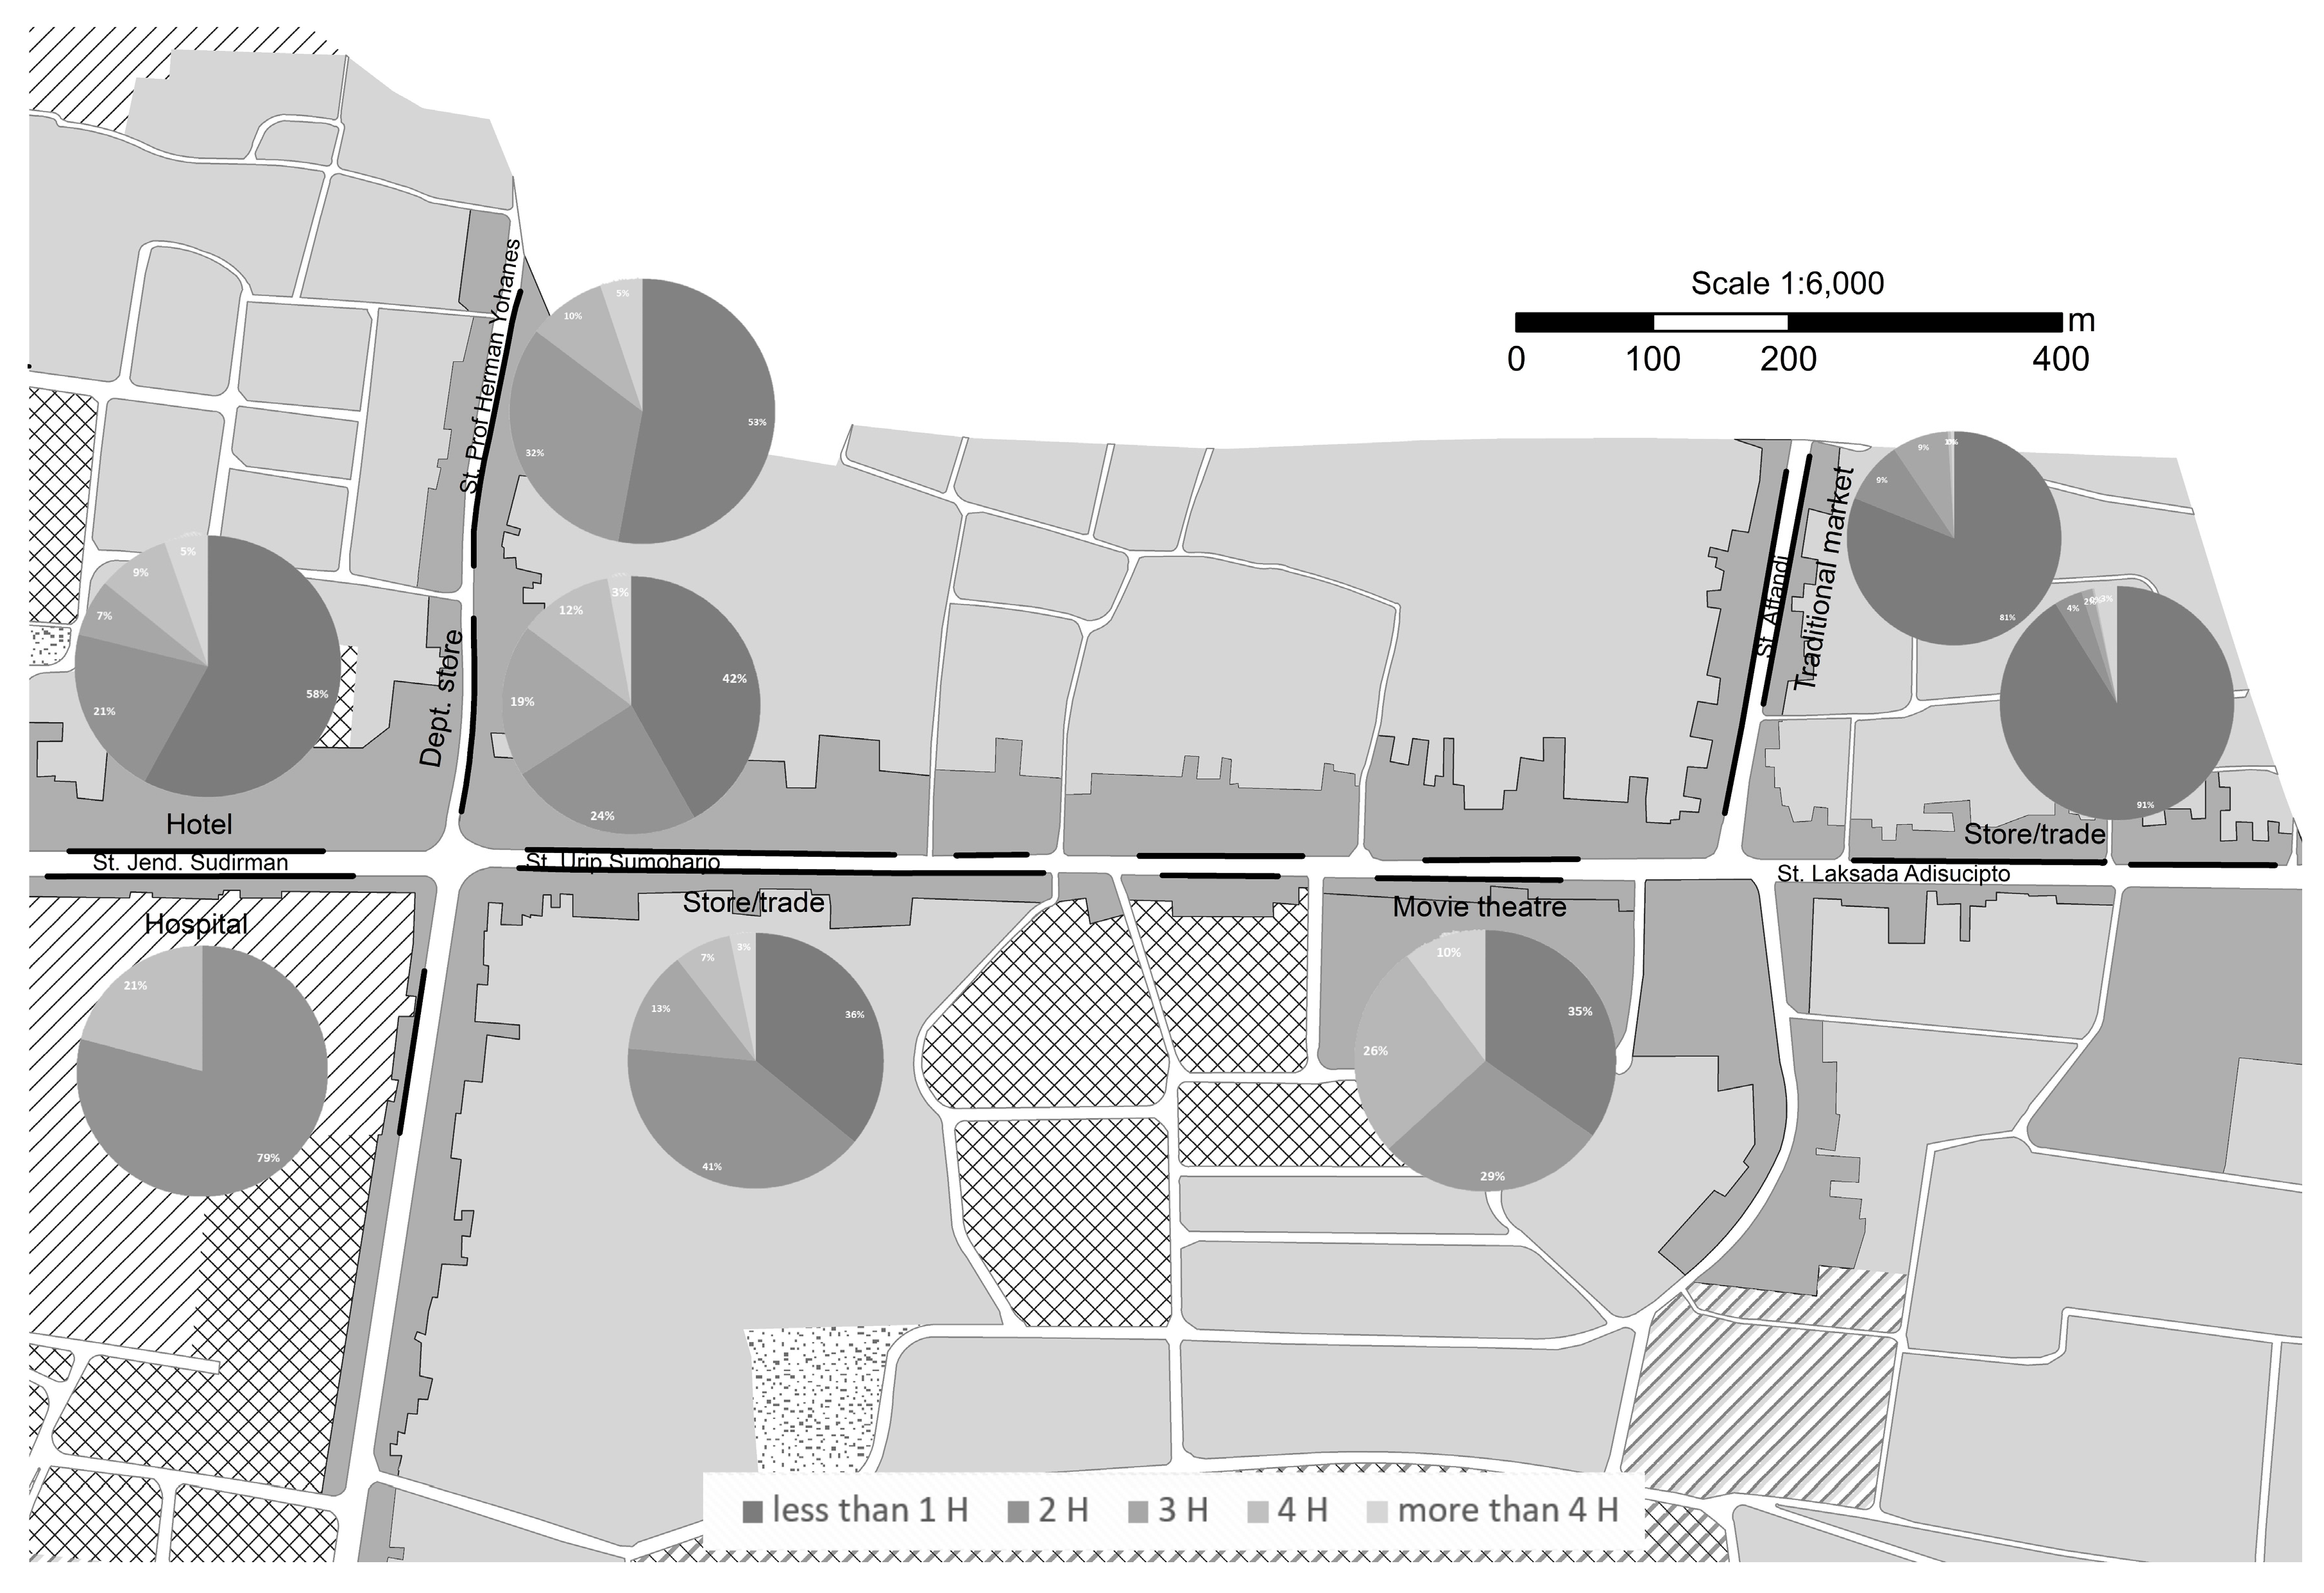
Figure 8.
Supply–demand mismatch in on-street parking. No problem = supply surplus; problem = demand surplus; for street and street segment names, see Figure 5 and Table 3.

Table 1.
Yogyakarta City official parking capacity calculation.
| Vehicle Types | Angles | Capacities (m2) |
|---|---|---|
| Motorcycles | 90° | Length/0.75 |
| Passenger cars | 0° | Length/5 |
| 30° | (Length − 0.88)/0.75 | |
| 45° | (Length − 1.91)/3.25 | |
| 60° | (Length − 1.84)/2.65 | |
| 90° | Length/2.3 | |
| Buses and trucks | 0° | Length/12.5 |
| 60° | Length/3.93 |
Source: Yogyakarta City Department of Transportation [13].
Table 2.
Descriptive statistics.
| Variables (continuous) | Min | Max | Mean | S.D. |
|---|---|---|---|---|
| Parking demand (m2/hour) | 57.50 | 2,656.50 | 415.64 | 581.28 |
| Parking duration (minutes) | 60.00 | 127.57 | 91.90 | 20.67 |
| Parking volume (m2/day) | 161.00 | 1,689.00 | 654.26 | 418.82 |
| Street segment length (m) | 40.87 | 384.74 | 160.14 | 81.44 |
| Mean parking volume (m2/hour) | 28.11 | 1,837.44 | 236.30 | 393.32 |
| Parking capacity (m2) | 92.00 | 885.50 | 375.12 | 188.67 |
| Variable (discrete) | Commercial | Educational | Health | Office |
| Land use (counts) | 12 | 4 | 3 | 2 |
Table 3.
Street segments for parking.
| ID | Segments | Street Names | Street Hierarchy † | Lengths (m) | Angles (°) | Capacity (Counts) | |
|---|---|---|---|---|---|---|---|
| Motorbikes | Passenger Cars | ||||||
| 1 | ELS | St. C Simanjuntak | 1 | 124.60 | 0 | 166 | 25 |
| 2 | South ELS | St. C Simanjuntak | 1 | 195.24 | 0 | 260 | 39 |
| 3 | JHS 8 | St. Kahar Muzakir | 1 | 97.11 | 0 | 129 | 19 |
| 4 | JHS 1 | St. Cikditiro | 0 | 94.71 | 0 | 126 | 19 |
| 5 | Pantirapih | St. Cikditiro | 0 | 87.38 | 0 | 117 | 17 |
| 6 | South Pantirapih | St. Cikditiro | 0 | 97.43 | 0 | 130 | 19 |
| 7 | SHS STECE | St. Sabirin | 1 | 151.06 | 0 | 201 | 30 |
| 8 | South SHS STECE | St. Supadi | 1 | 127.13 | 0 | 170 | 25 |
| 9 | NOVOTEL | St. Jend Sudirman | 0 | 186.26 | 0 | 248 | 37 |
| 10 | Bethesda | St. Dr. Wahidin | 0 | 120.40 | 0 | 161 | 24 |
| 11 | LEGEND Cafe | St. Abubakar Ali | 1 | 88.61 | 0 | 118 | 18 |
| 12 | MUTIARA | St. Dr. Sutomo | 0 | 139.44 | 0 | 186 | 28 |
| 13 | KEMENDAGRI | St. Argolubang | 1 | 320.69 | 0 | 428 | 64 |
| 14 | GALERIA Mall 1 | St. Prof. Herman Yohanes | 0 | 142.69 | 0 | 190 | 29 |
| 15 | GALERIA Mall 2 | St. Prof. Herman Yohanes | 0 | 205.06 | 0 | 273 | 41 |
| 16 | XXI | St. Urip Sumoharjo | 0 | 134.44 | 0 | 179 | 41 |
| 17 | GARDENA | St. Urip Sumoharjo | 0 | 384.74 | 45 | 513 | 77 |
| 18 | SHS 3 | St. Suroto | 1 | 40.87 | 0 | 54 | 8 |
| 19 | West AFFANDI | St. Affandi | 0 | 255.16 | 0 | 340 | 51 |
| 20 | East AFFANDI | St. Affandi | 0 | 185.22 | 0 | 247 | 37 |
| 21 | TOKO EMAS | St. Laksada Adisucipto | 0 | 184.64 | 0 | 246 | 37 |
† 0 = arterial road and 1 = local road. For the locations of the above street segments, see Figure 5.
Table 4.
Parking demand and volume.
| ID | Segments | Street Names | Parking Demands | Parking Volumes | ||
|---|---|---|---|---|---|---|
| (Counts) | (m2) | (Counts) | (m2) | |||
| 1 | ELS | St. C Simanjuntak | 16 | 184 | 59 | 608.5 |
| 2 | South ELS | St. C Simanjuntak | 26 | 299 | 101 | 1131.5 |
| 3 | JHS 8 | St. Kahar Muzakir | 14 | 161 | 49 | 463.5 |
| 4 | JHS 1 | St. Cikditiro | 7 | 80.5 | 14 | 161 |
| 5 | Pantirapih | St. Cikditiro | 8 | 92 | 26 | 299 |
| 6 | South Pantirapih | St. Cikditiro | 9 | 103.5 | 31 | 326.5 |
| 7 | SHS STECE | St. Sabirin | 10 | 115 | 35 | 402.5 |
| 8 | South SHS STECE | St. Supadi | 9 | 103.5 | 29 | 333.5 |
| 9 | NOVOTEL | St. Jend Sudirman | 17 | 195.5 | 57 | 655.5 |
| 10 | Bethesda | St. Dr. Wahidin | 5 | 57.5 | 24 | 256 |
| 11 | LEGEND Cafe | St. Abubakar Ali | 9 | 103.5 | 33 | 349.5 |
| 12 | MUTIARA | St. Dr. Sutomo | 15 | 172.5 | 71 | 596.5 |
| 13 | KEMENDAGRI | St. Argolubang | 42 | 483 | 176 | 574 |
| 14 | GALERIA Mall 1 | St. Prof. Herman Yohanes | 60 | 690 | 204 | 306 |
| 15 | GALERIA Mall 2 | St. Prof. Herman Yohanes | 55 | 632.5 | 130 | 1,495 |
| 16 | XXI | St. Urip Sumoharjo | 19 | 218.5 | 49 | 563.5 |
| 17 | GARDENA | St. Urip Sumoharjo | 231 | 2,656.5 | 793 | 1,209.5 |
| 18 | SHS 3 | St. Suroto | 10 | 115 | 50 | 575 |
| 19 | West AFFANDI | St. Affandi | 42 | 483 | 143 | 974.5 |
| 20 | East AFFANDI | St. Affandi | 92 | 1058 | 213 | 769.5 |
| 21 | TOKO EMAS | St. Laksada Adisucipto | 63 | 724.5 | 386 | 1,689 |
Parking demand = the maximum of the hourly counts of parked vehicles; parking volume = the total number of parked vehicles for 10 h; for the locations of the above street segments, see Figure 5.
Table 5.
Parking volume by vehicle type.
| ID | Segments | Street Names | Counts | m2 | ||
|---|---|---|---|---|---|---|
| (Motorcycles) | (Passenger Cars) | (Motorcycles) | (Passenger Cars) | |||
| 1 | ELS | St. C Simanjuntak | 7 | 52 | 10.5 | 598 |
| 2 | South ELS | St. C Simanjuntak | 3 | 98 | 4.5 | 1127 |
| 3 | JHS 8 | St. Kahar Muzakir | 10 | 39 | 15 | 448.5 |
| 4 | JHS 1 | St. Cikditiro | 0 | 14 | 0 | 161 |
| 5 | Pantirapih | St. Cikditiro | 0 | 26 | 0 | 299 |
| 6 | South Pantirapih | St. Cikditiro | 3 | 28 | 4.5 | 322 |
| 7 | SHS STECE | St. Sabirin | 0 | 35 | 0 | 402.5 |
| 8 | South SHS STECE | St. Supadi | 0 | 29 | 0 | 333.5 |
| 9 | NOVOTEL | St. Jend Sudirman | 0 | 57 | 0 | 655.5 |
| 10 | Bethesda | St. Dr. Wahidin | 2 | 22 | 3 | 253 |
| 11 | LEGEND Cafe | St. Abubakar Ali | 3 | 30 | 4.5 | 345 |
| 12 | MUTIARA | St. Dr. Sutomo | 22 | 49 | 33 | 563.5 |
| 13 | KEMENDAGRI | St. Argolubang | 145 | 31 | 217.5 | 356.5 |
| 14 | GALERIA Mall 1 | St. Prof. Herman Yohanes | 204 | 0 | 306 | 0 |
| 15 | GALERIA Mall 2 | St. Prof. Herman Yohanes | 0 | 130 | 0 | 1495 |
| 16 | XXI | St. Urip Sumoharjo | 0 | 49 | 0 | 563.5 |
| 17 | GARDENA | St. Urip Sumoharjo | 791 | 2 | 1186.5 | 23 |
| 18 | SHS 3 | St. Suroto | 0 | 50 | 0 | 575 |
| 19 | West AFFANDI | St. Affandi | 67 | 76 | 100.5 | 874 |
| 20 | East AFFANDI | St. Affandi | 168 | 45 | 252 | 517.5 |
| 21 | TOKO EMAS | St. Laksada Adisucipto | 275 | 111 | 412.5 | 1276.5 |
For the locations of the above street segments, see Figure 5.
Table 6.
OLS (ordinary least squares) regression on parking duration.
| Variables | Coef. | S.E. | Std. Coef. | t | p | VIF |
|---|---|---|---|---|---|---|
| Intercept | 79.256 | 11.733 | 6.755 | 0.000 | ||
| Parking volume | −0.025 | 0.013 | −0.514 | −1.921 | 0.074 | 1.927 |
| Street length | 0.118 | 0.062 | 0.465 | 1.905 | 0.076 | 1.602 |
| Land use: commercial † | 22.814 | 11.217 | 0.560 | 2.034 | 0.060 | 2.037 |
| Land use: health † | 14.589 | 12.758 | 0.284 | 1.143 | 0.271 | 1.660 |
| Street hierarchy: local ‡ | −14.340 | 8.700 | −0.345 | −1.648 | 0.120 | 1.180 |
† Base = educational and office, ‡ base = arterial road, F(5,15) = 2.382 (p = 0.088), R2 = 0.443, adjusted R2 = 0.257, SRMR = 17.821, Durbin-Watson = 2.165, SPSS (Statistical Package for the Social Sciences) data are available online for downloading: https://drive.google.com/open?id=1KTL0Xu7vuk4DpCdeQ-vwgASstyCtk1bH [22].
Table 7.
OLS regression on parking demand.
| Variables | Coef. | S.E. | Std. Coef. | t | p | VIF |
|---|---|---|---|---|---|---|
| Intercept | −503.778 | 262.235 | −1.921 | 0.074 | ||
| Parking volume | 0.116 | 0.295 | 0.083 | 0.392 | 0.701 | 1.927 |
| Street length | 5.074 | 1.384 | 0.711 | 3.665 | 0.002 | 1.602 |
| Land use: commercial † | 124.156 | 250.689 | 0.108 | 0.495 | 0.628 | 2.037 |
| Land use: health † | 267.049 | 285.152 | 0.185 | 0.937 | 0.364 | 1.660 |
| Street hierarchy: local ‡ | −238.086 | 194.442 | −0.204 | −1.224 | 0.240 | 1.180 |
† Base = educational and office, ‡ base = arterial road, F(5,15) = 5.519 (p = 0.004), R2 = 0.648, adjusted R2 = 0.530, SRMR = 398.305, Durbin-Watson = 2.419, SPSS data are available online: https://drive.google.com/open?id=1KTL0Xu7vuk4DpCdeQ-vwgASstyCtk1bH [22].
© 2018 by the authors. Licensee MDPI, Basel, Switzerland. This article is an open access article distributed under the terms and conditions of the Creative Commons Attribution (CC BY) license (http://creativecommons.org/licenses/by/4.0/).
Share and Cite
MDPI and ACS Style
Ajeng, C.; Gim, T.-H.T. Analyzing on-Street Parking Duration and Demand in a Metropolitan City of a Developing Country: A Case Study of Yogyakarta City, Indonesia. Sustainability 2018, 10, 591. https://doi.org/10.3390/su10030591
AMA Style
Ajeng C, Gim T-HT. Analyzing on-Street Parking Duration and Demand in a Metropolitan City of a Developing Country: A Case Study of Yogyakarta City, Indonesia. Sustainability. 2018; 10(3):591. https://doi.org/10.3390/su10030591
Chicago/Turabian StyleAjeng, Carolina, and Tae-Hyoung Tommy Gim. 2018. "Analyzing on-Street Parking Duration and Demand in a Metropolitan City of a Developing Country: A Case Study of Yogyakarta City, Indonesia" Sustainability 10, no. 3: 591. https://doi.org/10.3390/su10030591
Note that from the first issue of 2016, this journal uses article numbers instead of page numbers. See further details here.