Article

Dynamics of Metropolitan Landscapes and Daily Mobility Flows in the Italian Context. An Analysis Based on the Theory of Graphs

1
Department of Architecture and Design, Sapienza University of Rome, Via Antonio Gramsci 53, 00197 Roma, Italy
2
Department of Agricultural Sciences, University of Sassari, Viale Italia 39, 07100 Sassari, Italy
*
Author to whom correspondence should be addressed.
Sustainability 2018, 10(3), 596; https://doi.org/10.3390/su10030596
Submission received: 12 January 2018 / Revised: 23 February 2018 / Accepted: 23 February 2018 / Published: 26 February 2018
(This article belongs to the Section Sustainable Urban and Rural Development)

Abstract

:
The distribution of services across a territory generates daily commuting flows, which have a significant influence on the development of the territory and often causes congestion in large areas. This negatively affects the environmental, economic and social components of the metropolitan landscape. Using the graph theory, we constructed and analyzed various (in typologies of transportation and moving time) flow networks in the two main Italian metropolitan areas: Rome (MCR) and Milan (MCM). The analysis of these networks provided us with strategic information on the dynamics of the two urban macro-systems. In particular, the aim of our study was to: (i) identify the characteristics, distribution and direction of the main attractive forces within the regional systems under study; (ii) identify the main differences in size and structure of commuter networks between the two metropolitan areas and between the two regional systems that include the two mother cities; and, (iii) identify the main differences in the size and structure of the two commuting networks by transport modes (private, public, non-motorized mobility) and the travel time. The results highlighted significant differences between the two case studies regarding volume flows, complexity and structure networks, and the spatial extension of the territories that are governed by the two metropolitan areas. MCR is a strongly monocentric urban system with a regional influence centred on the mother city of Rome, while MCM is a diffused polycentric regional metropolitan system centred on multiple mother cities. The findings many have a role in urban planning choices and in the evaluation of policies aimed to favor sustainable mobility.

1. Introduction

The sustainability of a contemporary city and its evolution depends on the ability of institutions to harmonise resource use, infrastructure, and social investment, and technological development [1]. To develop policies for the sustainability of metropolitan areas it is essential to identify strategies for the sustainability of nations, continents, and the planet as a whole [2]. Recent studies show increasing urbanization rates caused by a large-scale population shift from rural and marginalized areas to cities [3]: in 1800, only 2% of the world’s population lived in urban areas. This percentage rose to 14% in 1900, 29% in 1950, 47% in 2000 and over 50% in 2008 [4]. It is estimated that by 2050, 70% of the global population will be living in urban areas, which will increase to 100% by the end of the century [5]. In Europe almost three quarters of the European population lived in an urban area in 2015, and the share is projected to rise to just over 80% by 2050 [6]. The flows, as generated by new residents and/or city users as in the case of commuting, are the basis of the new economic, political, and social geographies that influence the development of new regional and continental landscapes [7,8,9].
Commuting is an essential part of urban life in modern urbanized areas [10]. To manage these flows and control the negative effects derived, it is necessary to gain a better understanding of the dynamics that characterise the urbanization process [11,12]. Due to the complexity of the phenomenon it seems rather reductive to attribute cities’ attractiveness only to a higher quality of life, better employment opportunities and higher incomes, or the better quality of services such as health and education. The reasons for the “power of cities” contrast with the observed crisis of contemporary metropolises: environmental problems, poor access to resources and services, marginalization, and poverty are in fact characteristics of many contemporary metropolitan landscapes [3,13]. Therefore understanding the numerous reasons behind these agglomerating forces is essential for planning, but it is not sufficient for developing realistic planning tools. In line with this, it is also necessary to give form, strength and direction to these centripetal forces. Urban areas contain a wide variety of people, structures, activities, and functions, which interact and influence one another with different intensity and complexity [14].
The mitigation of undesirable effects, such as congestion, energy consumption, pollution etc. depends intrinsically on our understanding of urban structure, the spatial arrangement of urban hubs and centers, and how the individuals interact with these elements [15].
Even if there are several methodologies in the literature for studying metropolitan systems that were mainly derived from other disciplines, such as ecology and economics [16], there is no consensus on the best technique for defining the degree of interaction and geographic edges of the attraction of a city [17,18].
The typical model of the industrial city based on a monocentric structure is that it is increasingly replaced by more complex structures, where hierarchy appears to be a less dominant feature. Polycentricity seems to be the new prevalent model of spatial organisation in many contexts [19,20]. But, the question of how to assess this aspect is still open. Several authors have studied the morphological aspect of polycentricity, basically addressed on the size of urban centers across territory (gravity models) [21,22], while others have taken the functional relations between centers into account [23,24].
Several indexes have been proposed to measure centrality (e.g., ratio of commuting flows or employment between the central city and the rest of the city-region; ratio of commuters from other city-regions compared with total employment, in-degree index; degrade of evolvement of a node) and identify sub-centers [19,25,26,27,28]. Different methods have sometimes provided different results.
Furthermore, a system may be polycentric in respect of a specific aspect and monocentric in respect of another [29]. As showed the spatial organisation of the urban network depends on the lens through which it is assessed. In fact, the spatial organisation of each functional linkage (e.g., commuting, shopping trips and inter-firm trade) is not necessarily identical, and, therefore, a region can appear to be polycentric and spatially integrated based on the analysis of one type of functional linkage, but monocentric and loosely connected based on the analysis of another type of functional linkage [23].
As argued in the literature, it is possible to identify central places in a system by analyzing the way the relationships between cities are distributed within it, rather than the statistical characteristics of the territory [29,30]. The conceptualisation of metropolitan areas as networks of cities made up of nodes and links between each node (commuting flows) has led to the use of graph theory as tool for analyzing them. Graph theory is branch of mathematics developed by the Swiss physicist Eulero in the 18th century [31,32,33] to represent relationships between elements. Mathematical models formulated on the basis of graph theory make a description of structure elements possible, as well as the identification of more complicated relations between them [34]. The graph theory associated with exponential growth in computational capacity offers analysis tools that are absent in other methodologies. With the current technologies and algorithms, it is possible to calculate the reciprocal influence between the different nodes of the network considering hundreds of thousands of relationships, each with different weight and direction [35].
In the recent decades, the algorithms based on graph theory have been applied in numerous research fields related to the analysis of complex dynamic systems [36,37], such as interactions in economic and social systems [38,39] and infrastructure and transport [40,41,42], applications in urban and territorial planning [43,44], and for the analysis of ecological systems [45,46]. In particular, the algorithms based on graph theory are proving to be highly adaptable for analyzing commuting flows [47,48,49,50,51] and prove to be effective tools for evaluating changes in new urban geographies, as well as provide more clearly readable results.
Moreover, these algorithms have been used both for large metropolitan areas and for small to medium sized cities with different spatial patterns [52].
Although commuting flows are well known, the study of their networks from a graph theory perspective in Italy remains relatively limited.
Today, more than ever before, flow and mobility management issues are some of the major themes and challenges that urban and territorial planners face [53]. In its various forms and connotations, mobility is a dominant phenomenon of contemporaneity that has enormous consequences for urban systems, the quality of life of the inhabitants, environmental conditions and economic development and can provide useful insights into the physical spatial structure as determined by economic and social interactions [54,55,56]. In fact, as argued by some authors, mobility produces the greatest impact in fragmented and dispersed urban systems [55]. In particular, it has been observed that public transport loses in terms of efficiency and competitiveness as urban fragmentation increases when compared to the use of private transport. The latter, instead, does not seem to be directly related to the size or shape of the city as to wealth and the emergence of new lifestyles.
Expressed in another way, the studies on new urban geographies that were carried out with flow-through analysis are a result of the deep demographic, economic, and social changes, and the emergence of systems of interrelationships, metabolisms, and mechanisms that involve larger and more complex territories, which have local and global implications. With flow-through analyses, it is possible to measure the interdependence between the different parts of a metropolitan system by computing the demand for access to sites, services (such as health, education), and activities that are located in the territory (such as housing, work, shopping).
In this study based on commuter census data [57], various flow networks (for time shift mode) in two main Italian metropolitan areas, Rome (MCR) and Milan (MCM), were constructed and analyzed using graph theory.
The network analysis provided information on the dynamic processes occurring in these two urban macro-systems, on the forces of attraction that mother cities (as dominant cities able to influence surrounding territory and to attract important flows from it) have on daughter cities and the territories they depend on for the supply of resources and energy. In particular, the study focuses on the following aspects: (i) the identification of the characteristics, distribution and direction of the major attractive forces of the cities within the vast regional systems in which they are located; (ii) the identification of the main differences in the size and structure of commuting networks between the two metropolitan areas and between the two regional systems including the two mother cities; and, (iii) the identification of the main differences in the size and structure of the different commuting networks by transport modes (private, public, non-motorized mobility) and travel time.
In the first part of the paper we describe the two case studies (MCR; MCM), the data and the data analysis method used. We will then illustrate and discuss our results, and finally, we will draw some conclusions and propose directions for future research.

Case Studies

Metropolitan areas are defined by assessing the degree of functional integration between parts of the territory. In the Italian national context, the metropolitan issue refers to the consolidation of asymmetric interdependence between contiguous municipalities, where asymmetry is given by the presence of a larger municipality than the others whose forces of attraction structure the surrounding territories [
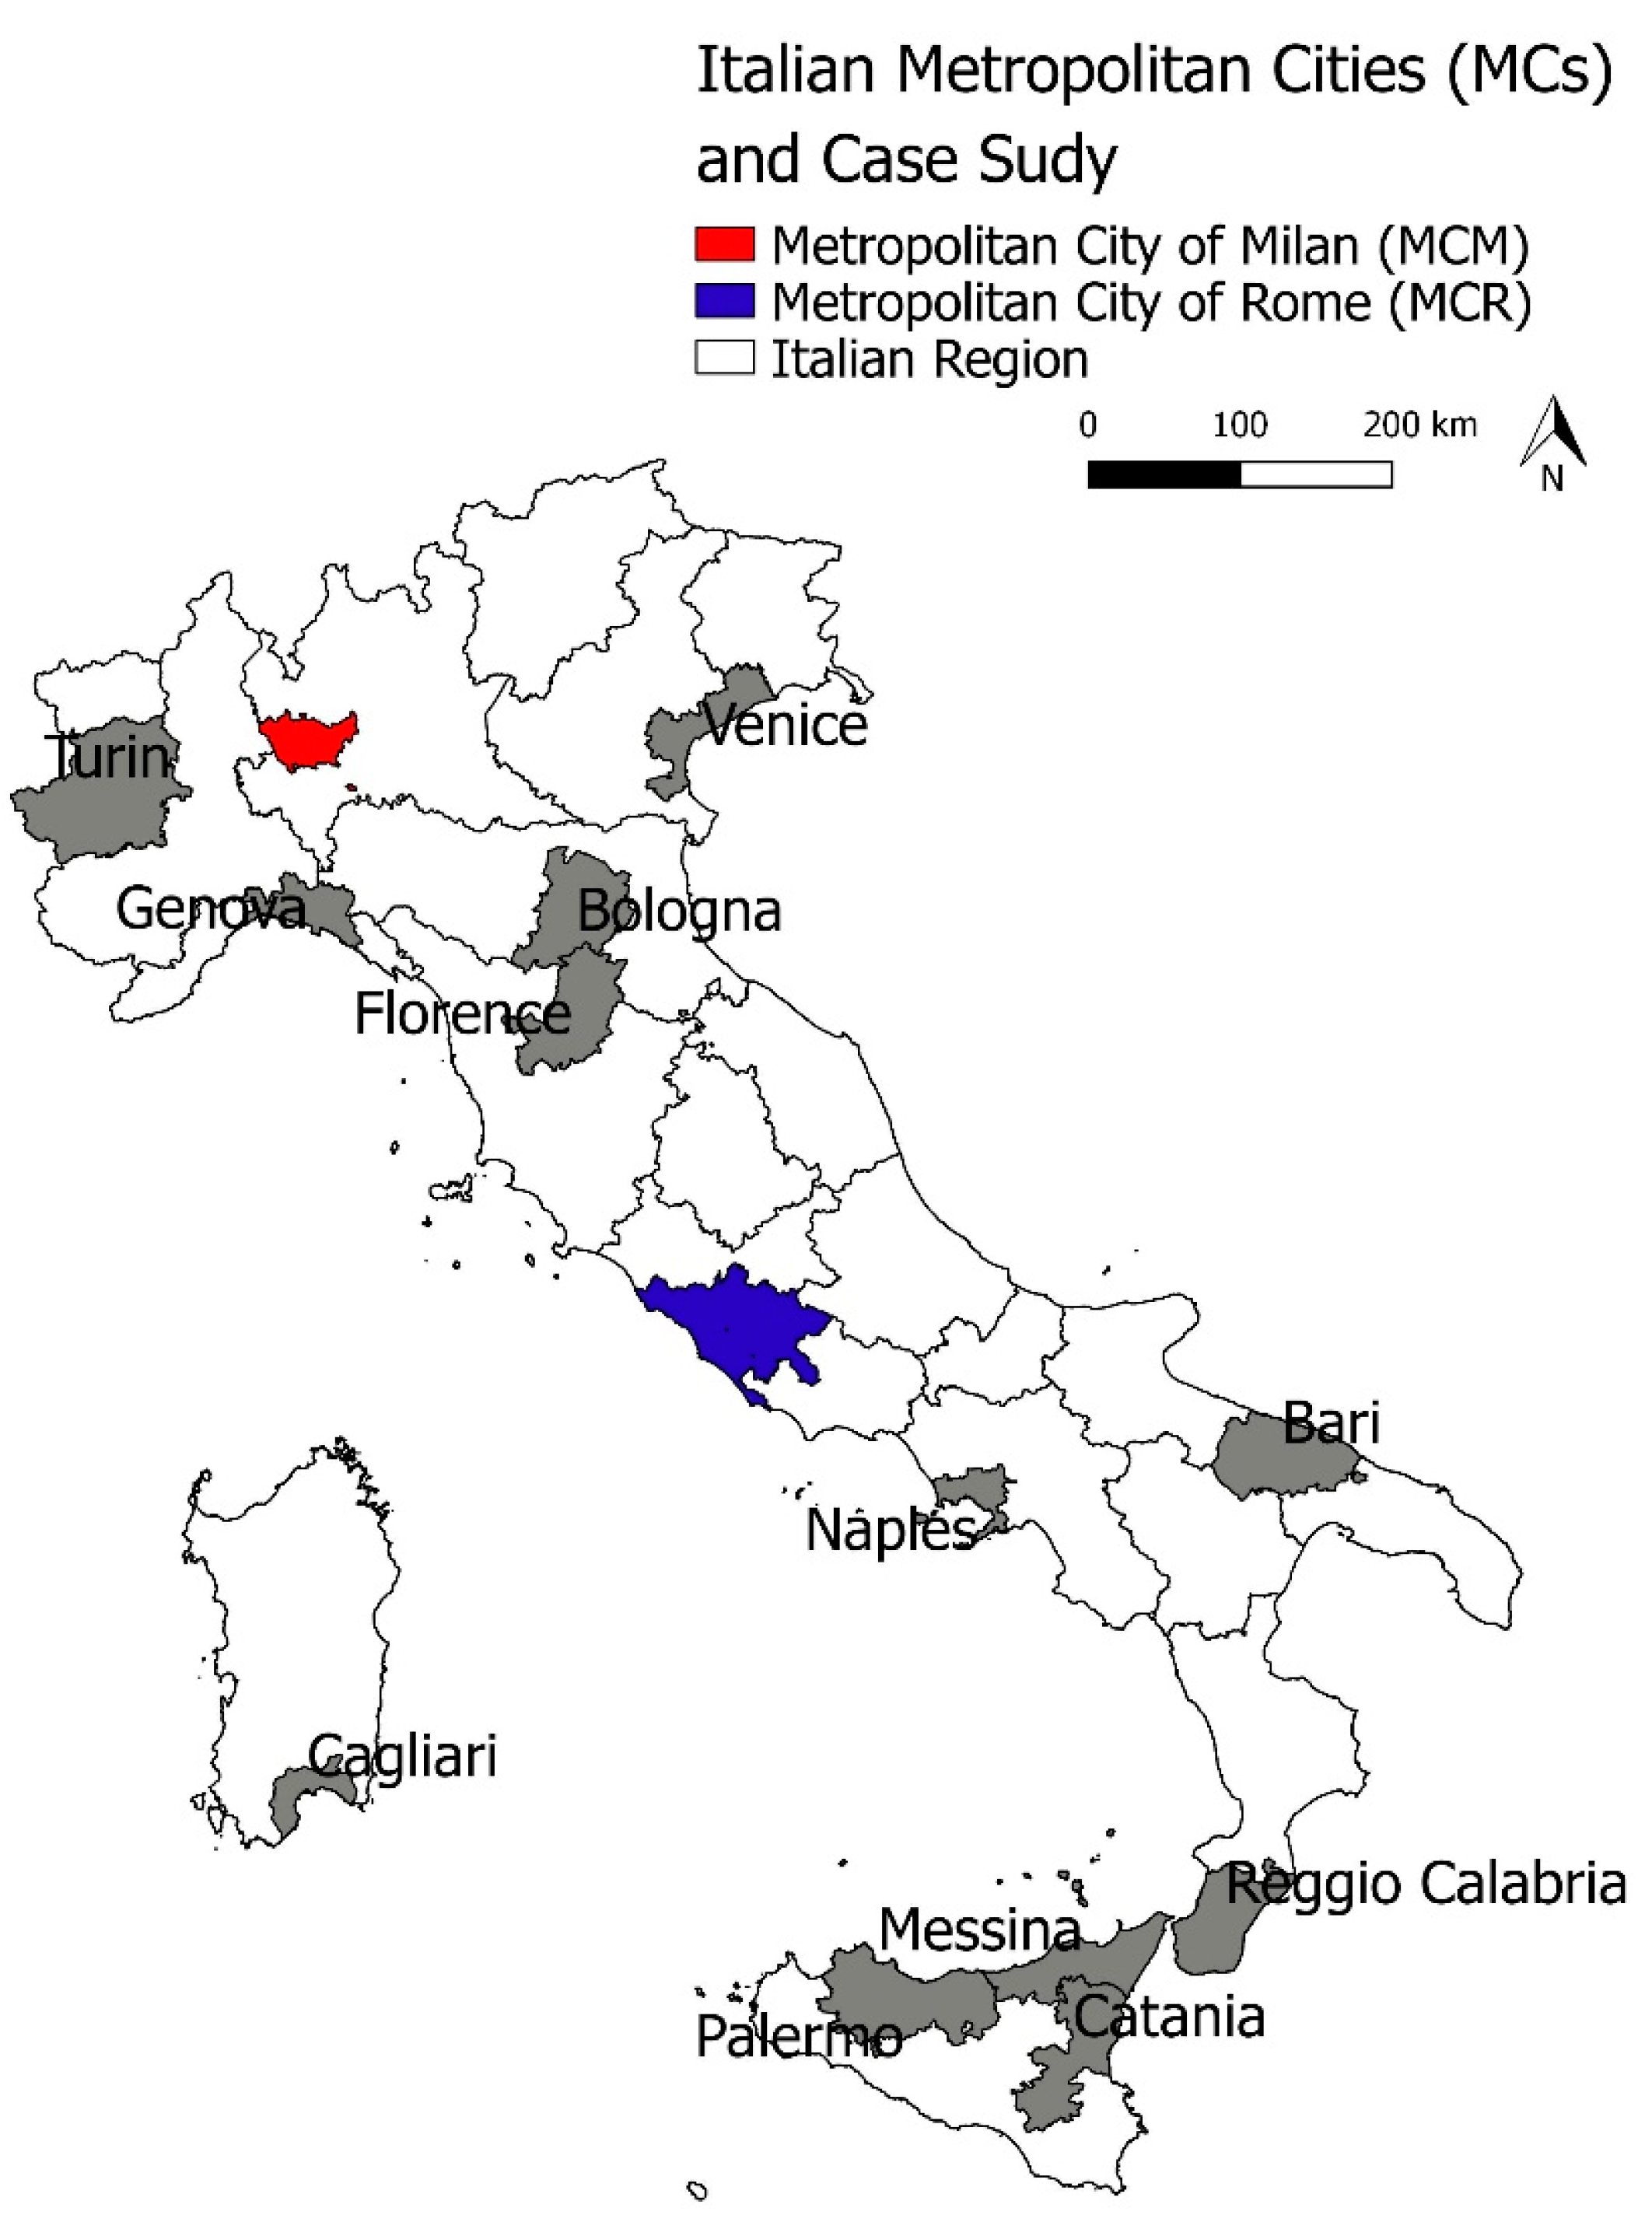
53]. The “metropolitan areas” pursuant to art. 118 of the Constitution of the Italian Republic have undergone a major administrative-functional reorganization following the issuance of National Law 56/2014 (“Delrio Law”). In fact, this law established that the major Italian provinces should be replaced with Metropolitan Cities (MCs) as new government authorities in large urban areas. They are second-level institutions that are politically and functionally connected to the municipalities of their district. The “Delrio Law” established 10 MCs in Italy: Rome, Turin, Milan, Venice, Genoa, Bologna, Florence, Bari, Naples, and Reggio Calabria, excluding the regions with Special Statutes (Friuli Venezia Giulia, Sardinia and Sicily) (Figure 1).
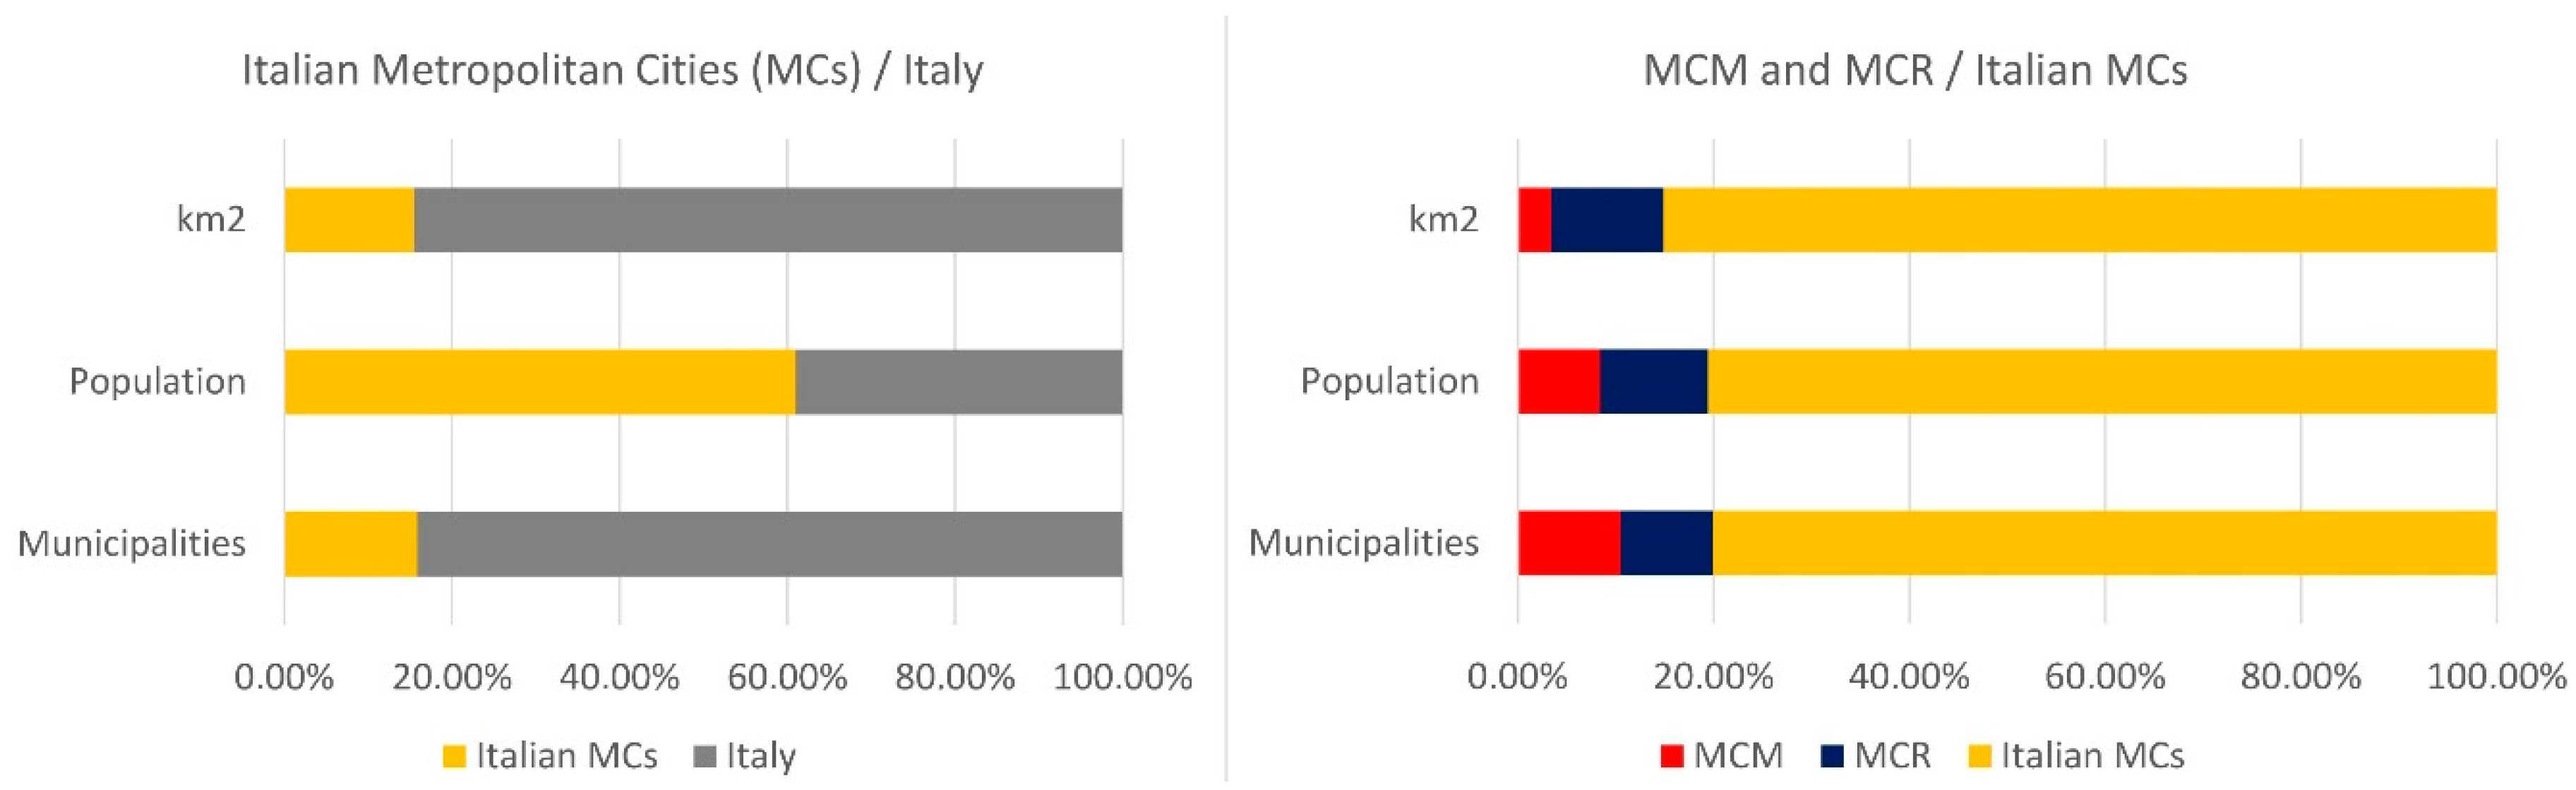
Overall MCs cover less than 20% of the national territory and affect less than 20% of the municipalities. However, almost 40% of the Italian population resides in them (Figure 2).
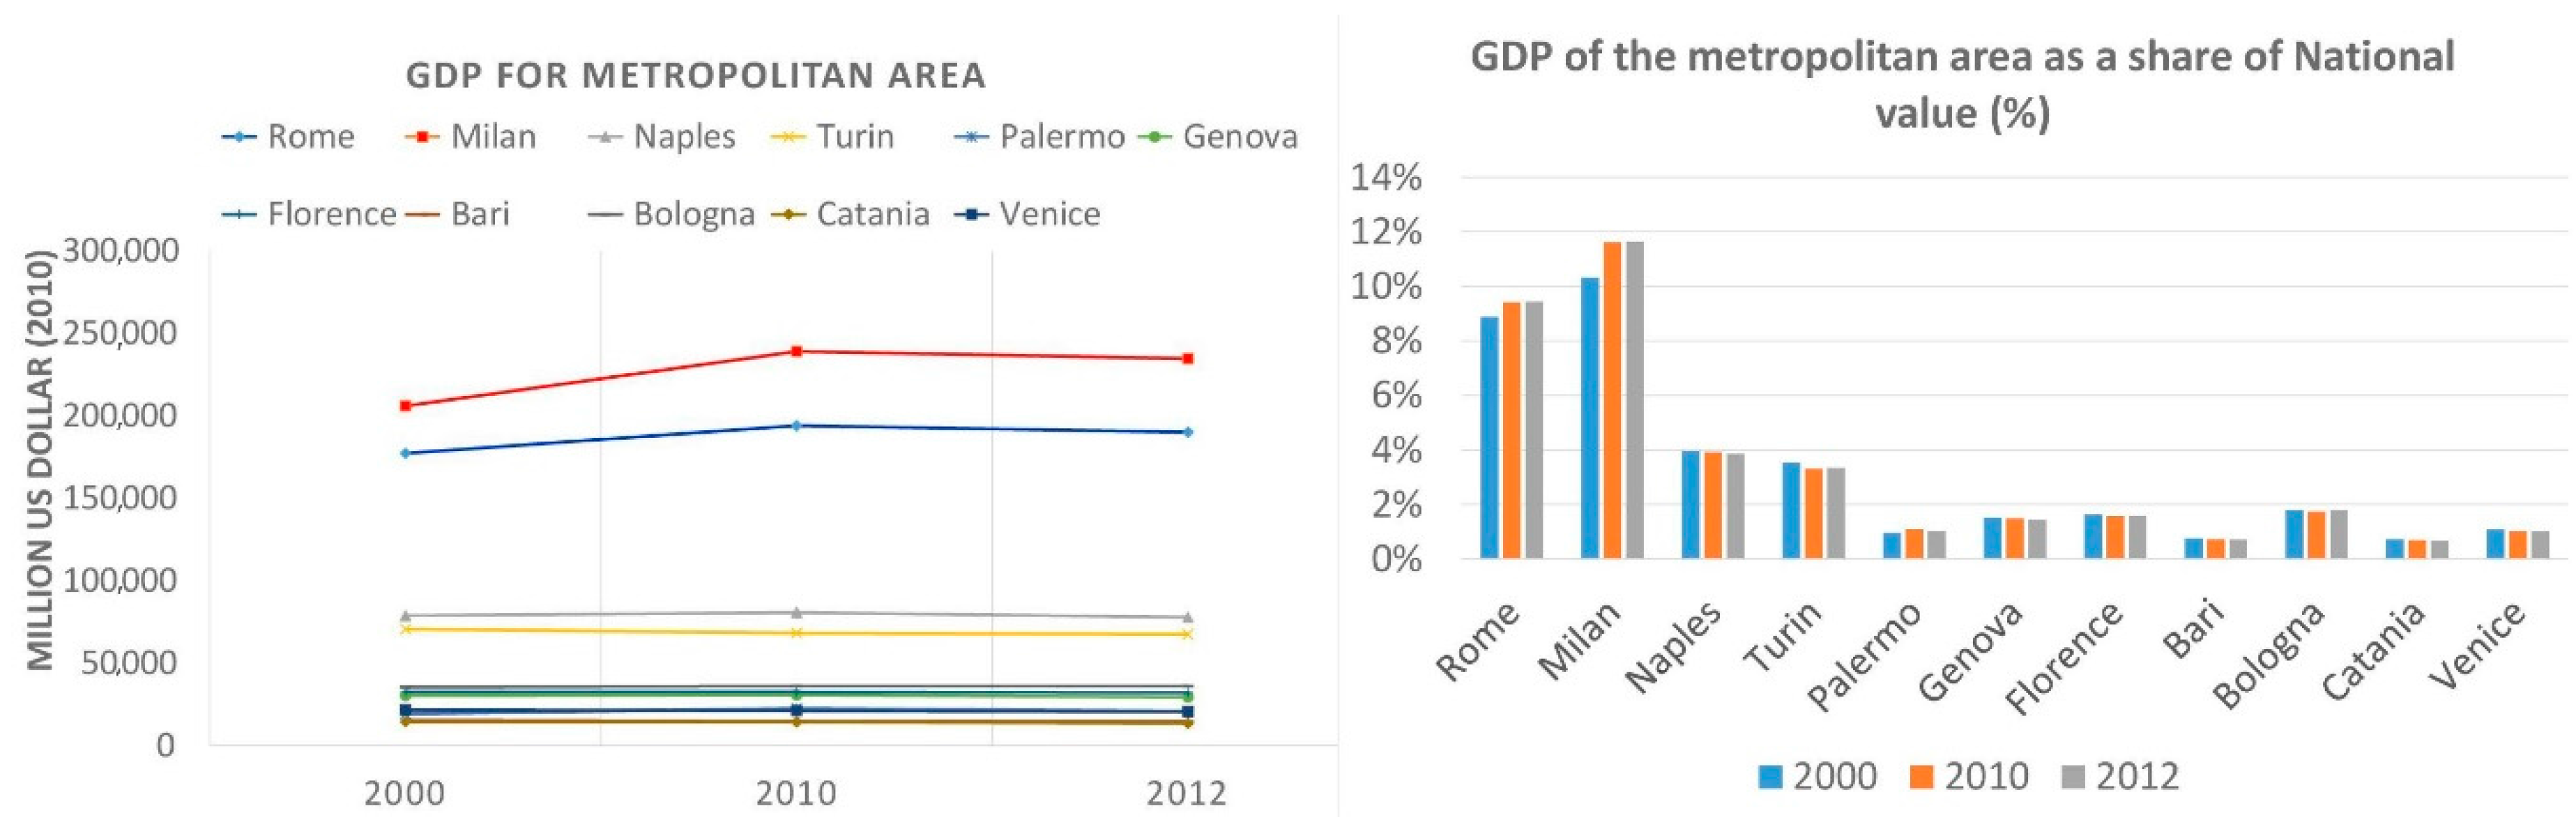
MCM and MCR are certainly the two most economically influential metropolitan areas in the national context [3] (Figure 3).
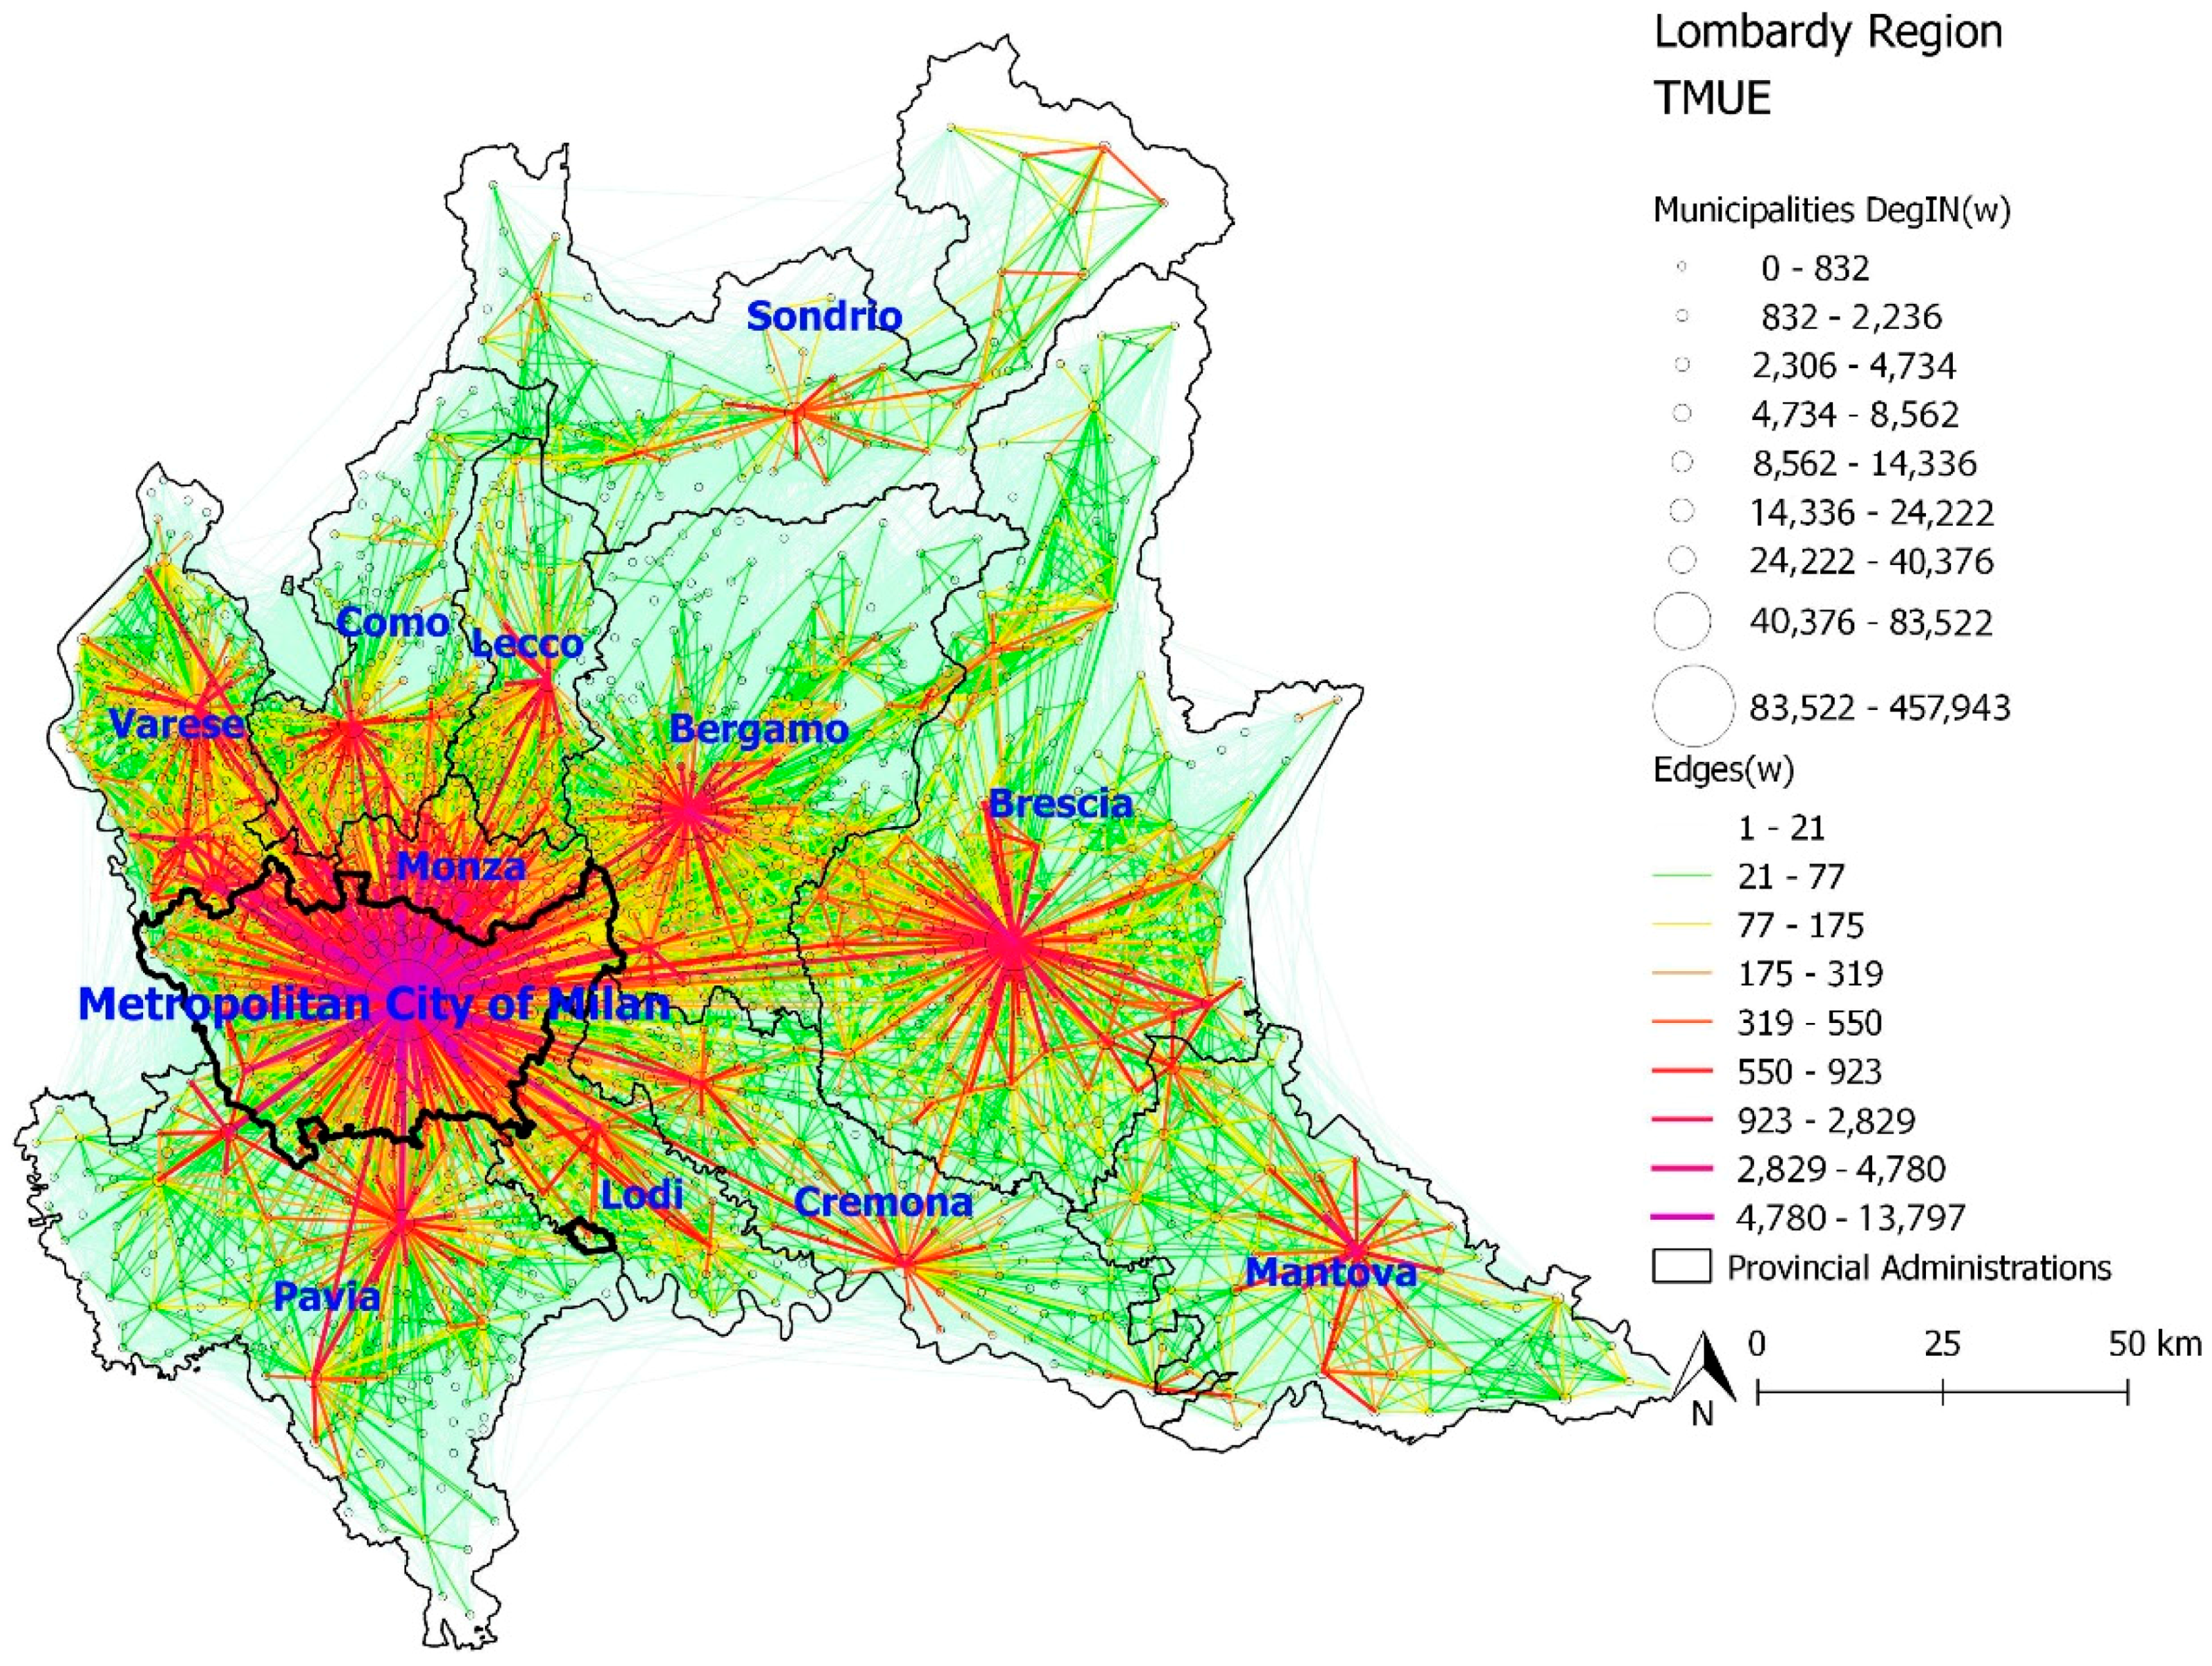
The MCM is a densely populated area (2.042 pop/kmq) with more than 3,000,000 residents [56] and almost one-third of the regional population. The area is composed of 134 municipalities, covering approximately 1500 square kilometres; it produces about 12% of the Italian Gross Domestic Product (GDP). 84 percent of the added value produced by the Milan economy derives from services. Also, at the occupational level, the preponderance of services emerges when compared to other production sectors in the Milan area. Over the last 20 years, the core of the city and all of the urban areas has undergone profound spatial and structural changes that have created new relationships between the center and the suburbs. The municipality of Milan is currently the heart of a large urban system that integrates numerous municipalities according to a geography in which the ex-provincial territory is an important part of the system but not the whole.
The MCR is composed of 121 municipalities that previously belonged to the province of Rome. The areas cover approximately 5300 square kilometres with a total of approximately 4,000,000 residents, and the density is 812 pop/kmq [57]. The economic productivity of this area is slightly lower than in the MCM (approximately 9% of Italian GDP). In Rome, there are concentrated service companies (especially the services for companies) that operate at national level, thus determining a specialization in the tertiary of the economy. It should be noted that the data is largely determined by the significant presence in Rome of the Administrations Power stations that alone contribute to the production of 20% of the added value. The metropolitan area is less densely populated than the MCM, with a weaker urban production system and a dispersed settlement pattern.

2. Materials and Methods

The data used in this study were extracted from the National Commuting Matrix (NCM) and collected during the 15th National Population Census by the Italian National Institute of Statistics (ISTAT) [57]. For NCM realization, ISTAT interviewed 28,871,447 citizens who commute daily between their residence and their place of study or work. Their responses have been elaborated and inserted in a database and then aggregated for homogeneity of information about the Municipality of Origin and Destination, type of transport and the time needed to reach the destination. The database (DB) was composed of 4,876,242 records. In the database, alphanumeric “tags” were used to classify the information on the daily habits and needs of the citizens. For this analysis, the information contained in the NCM was filtered and then aggregated using the following variables: transport modes (means of transportation used by the commuter), duration of trip (travel time from origin to destination), and departure and arrival municipalities (Table 1) (origin and destination).
The NCM was filtered through an Open Source Database Management System (DBMS): PostgreSQL © (https://www.postgresql.org/), by only selecting the records corresponding to the two Regions under study from the matrix, according to their Regional ISTAT code (Lombardy = 03; Lazio = 12). Subsequently, the records corresponding to the two AMs were filtered through the ISTAT provincial codes (Milan = 03015; Rome = 12058) by applying a new query to the result of the previous selection. This study only analyzes inter-municipalities commuting, therefore the records with values 01 and 03 for “Destination of the trip” were deleted from the four previously obtained commuting matrices. In short, four matrices (two for the regions and two for the MCs) were extracted from the NCM general matrix and were filtered in order to analyze only inter-municipalities commuting occurring within the administrative boundaries. On the basis of this information, we built different (for movement modes and times) commuter flow networks.
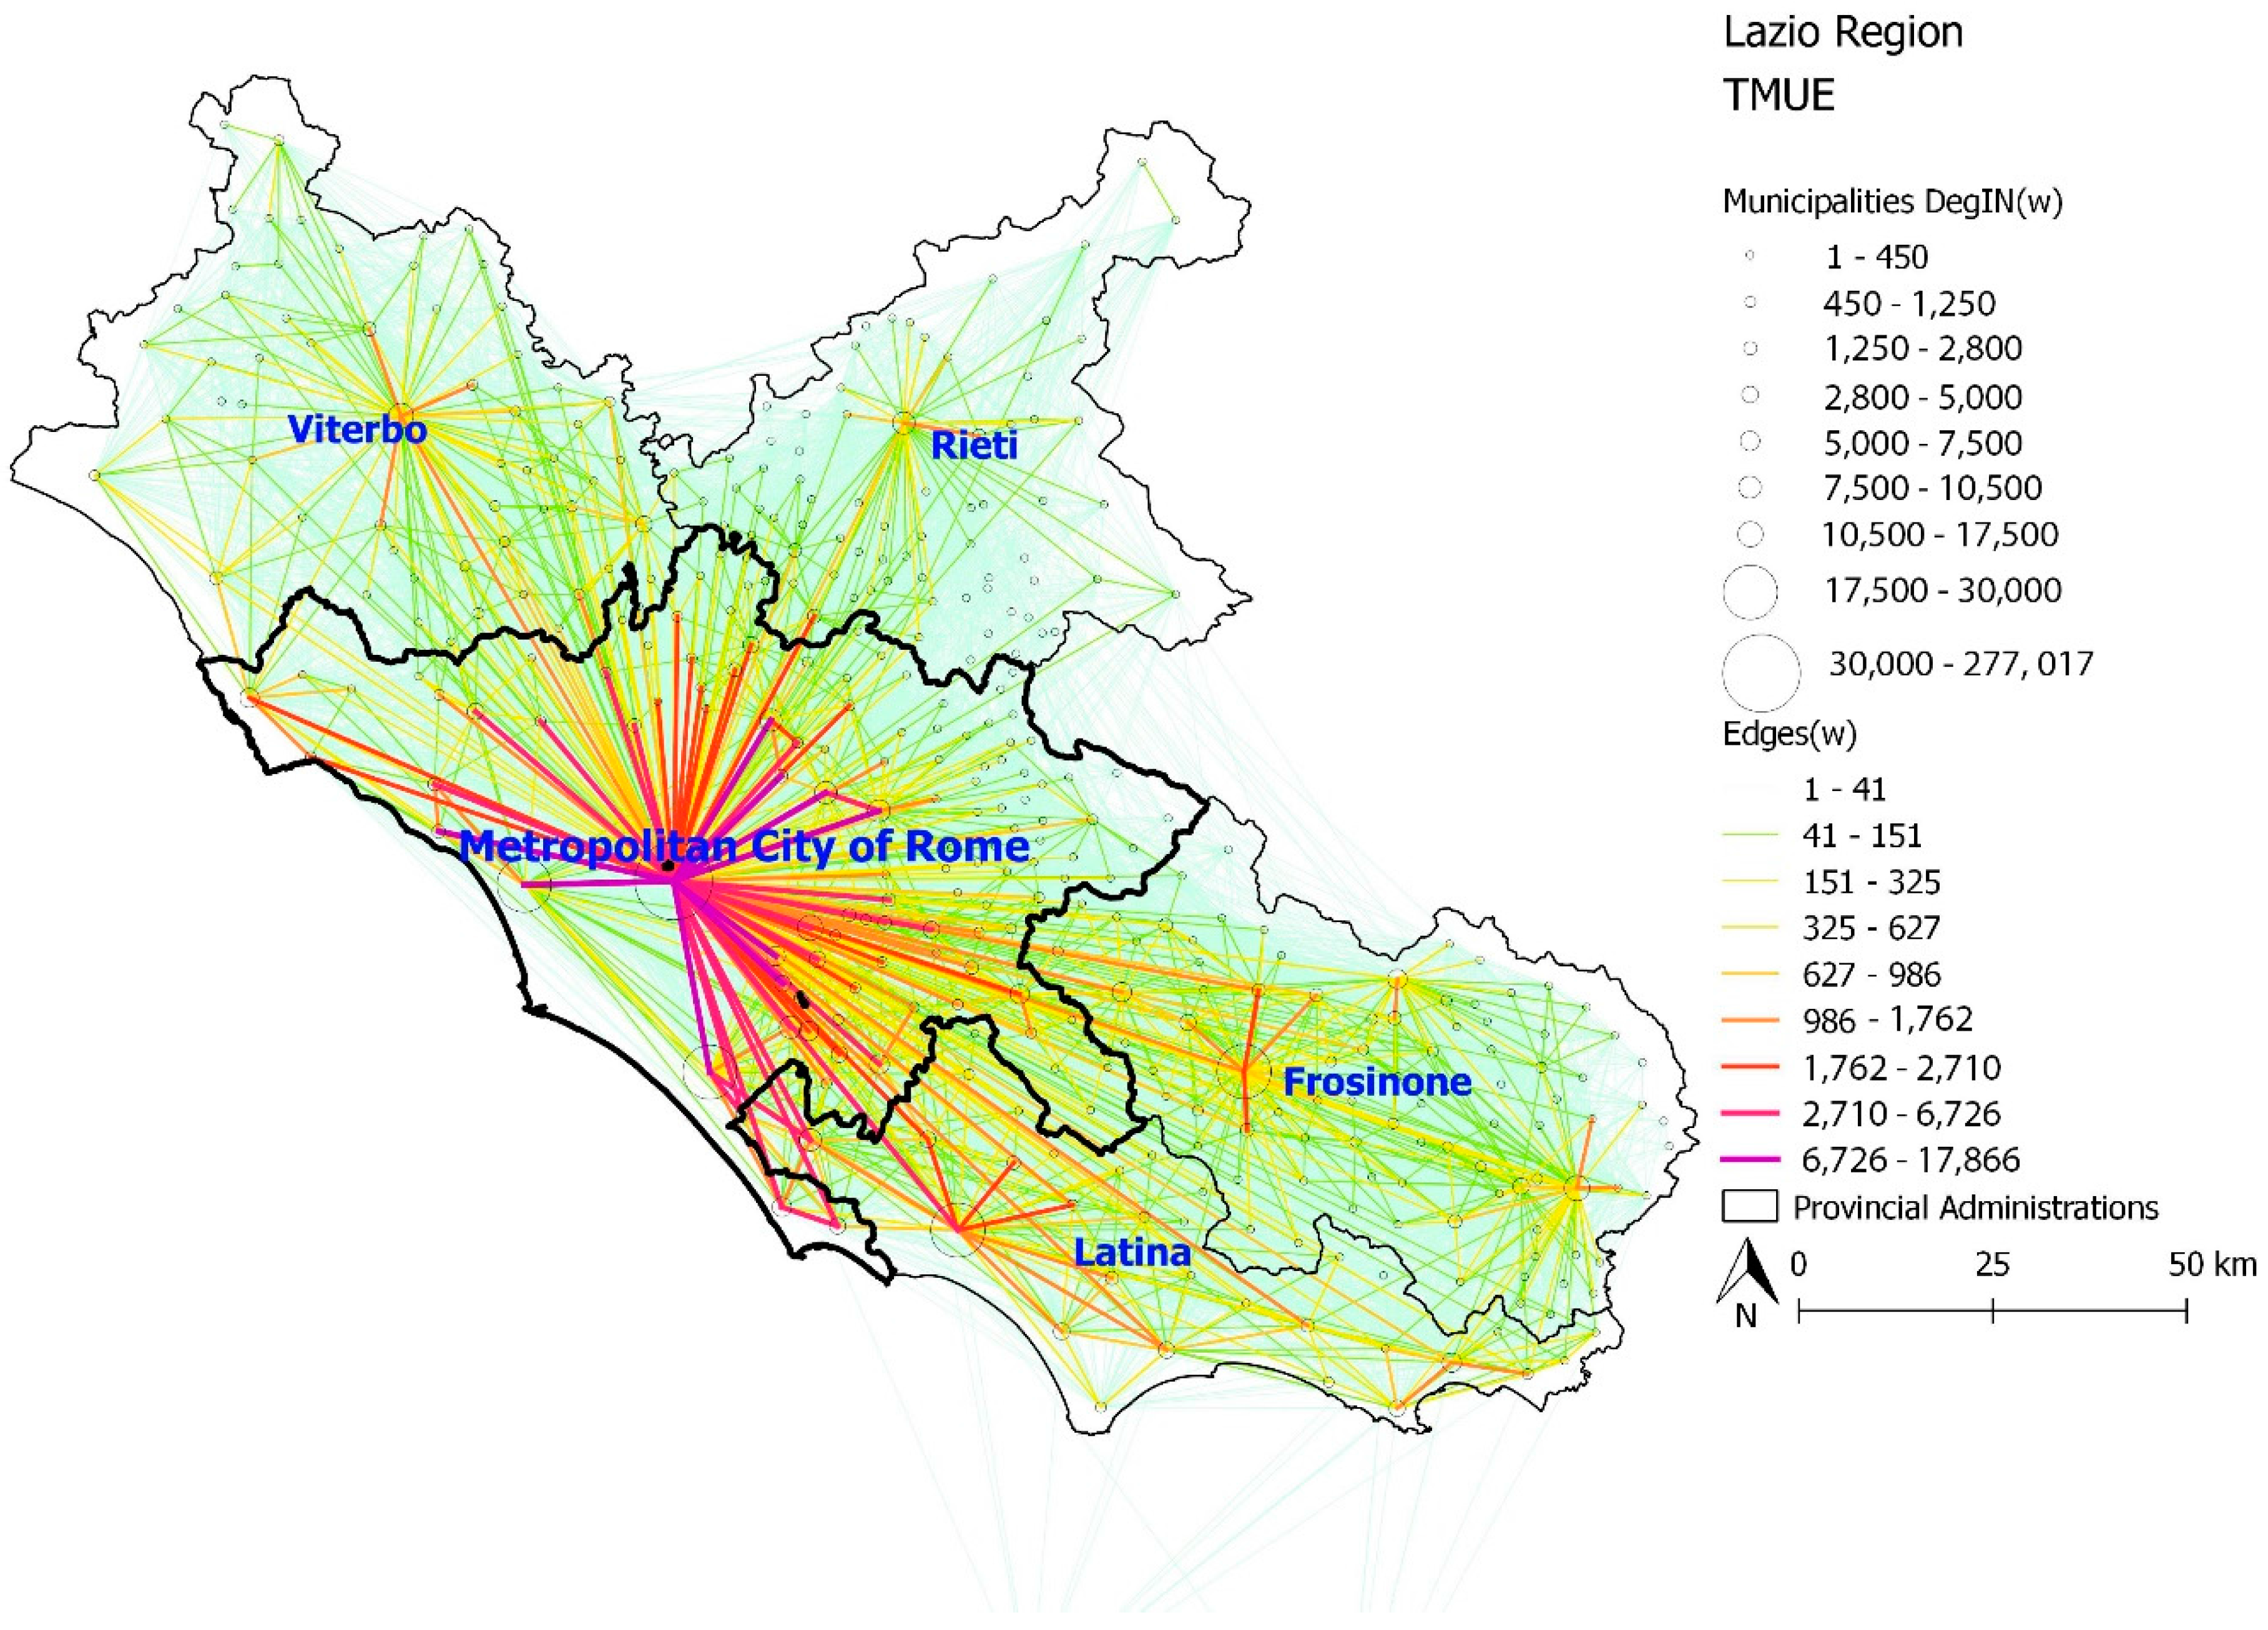
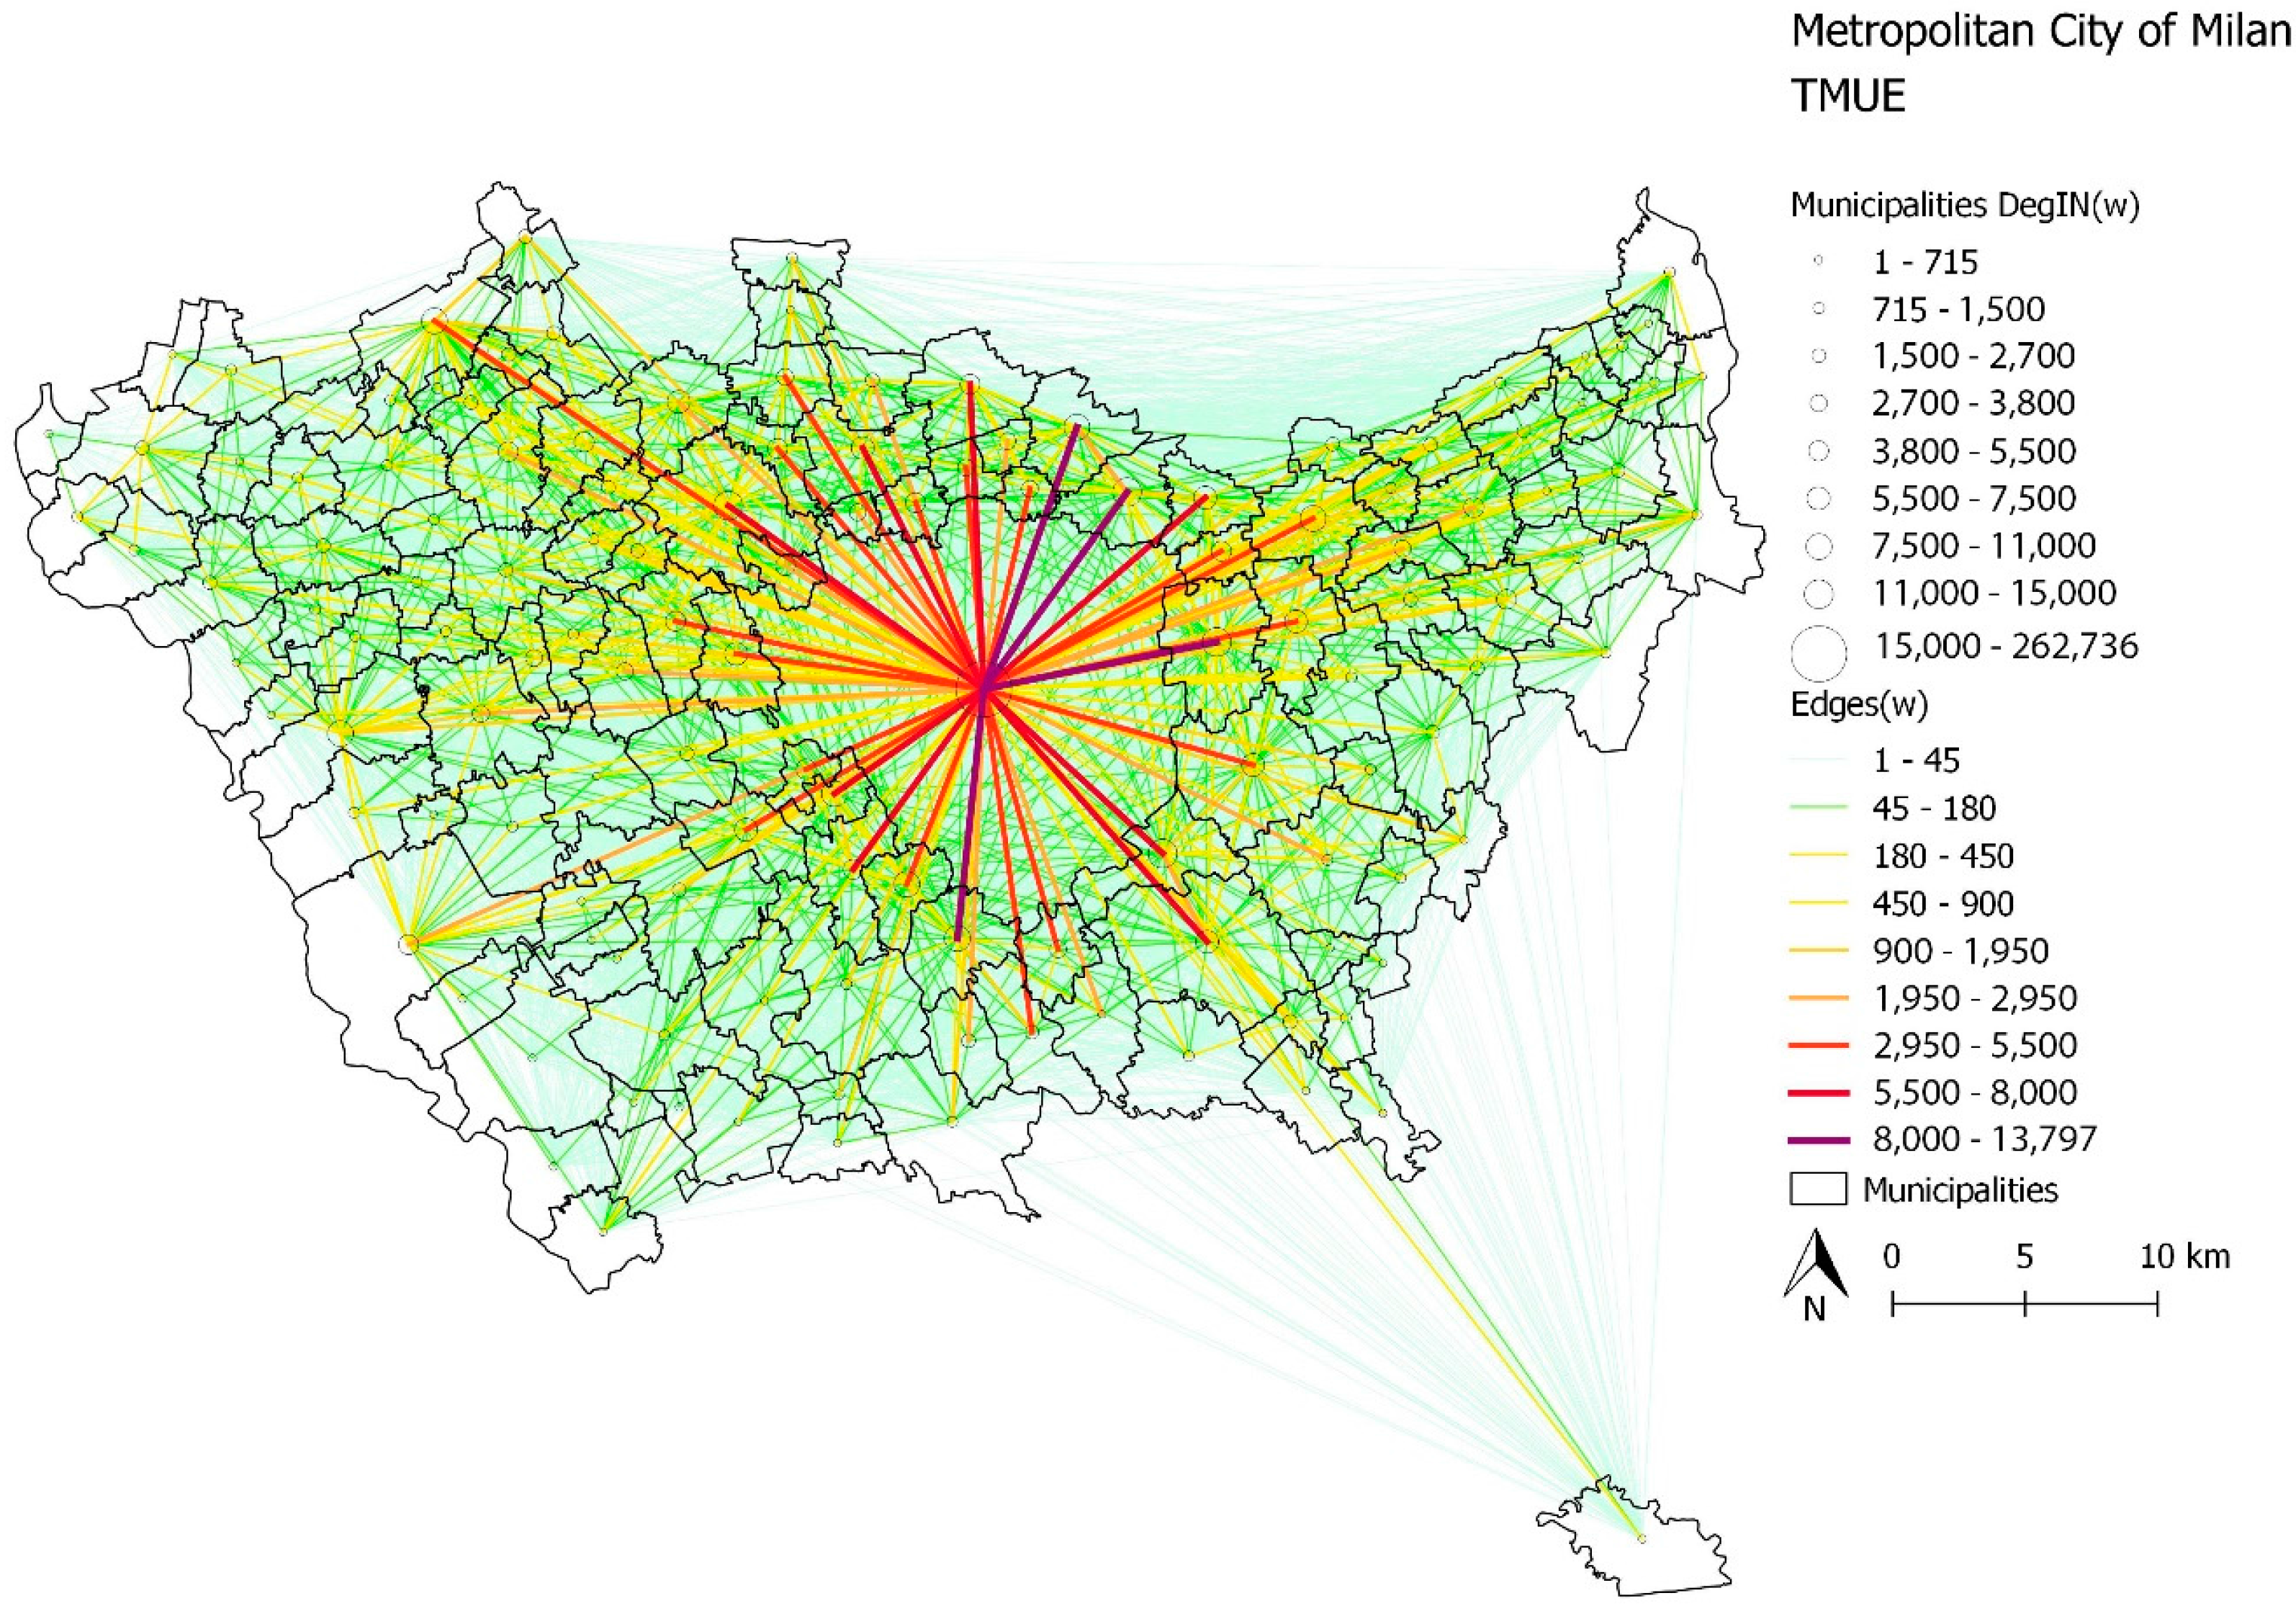
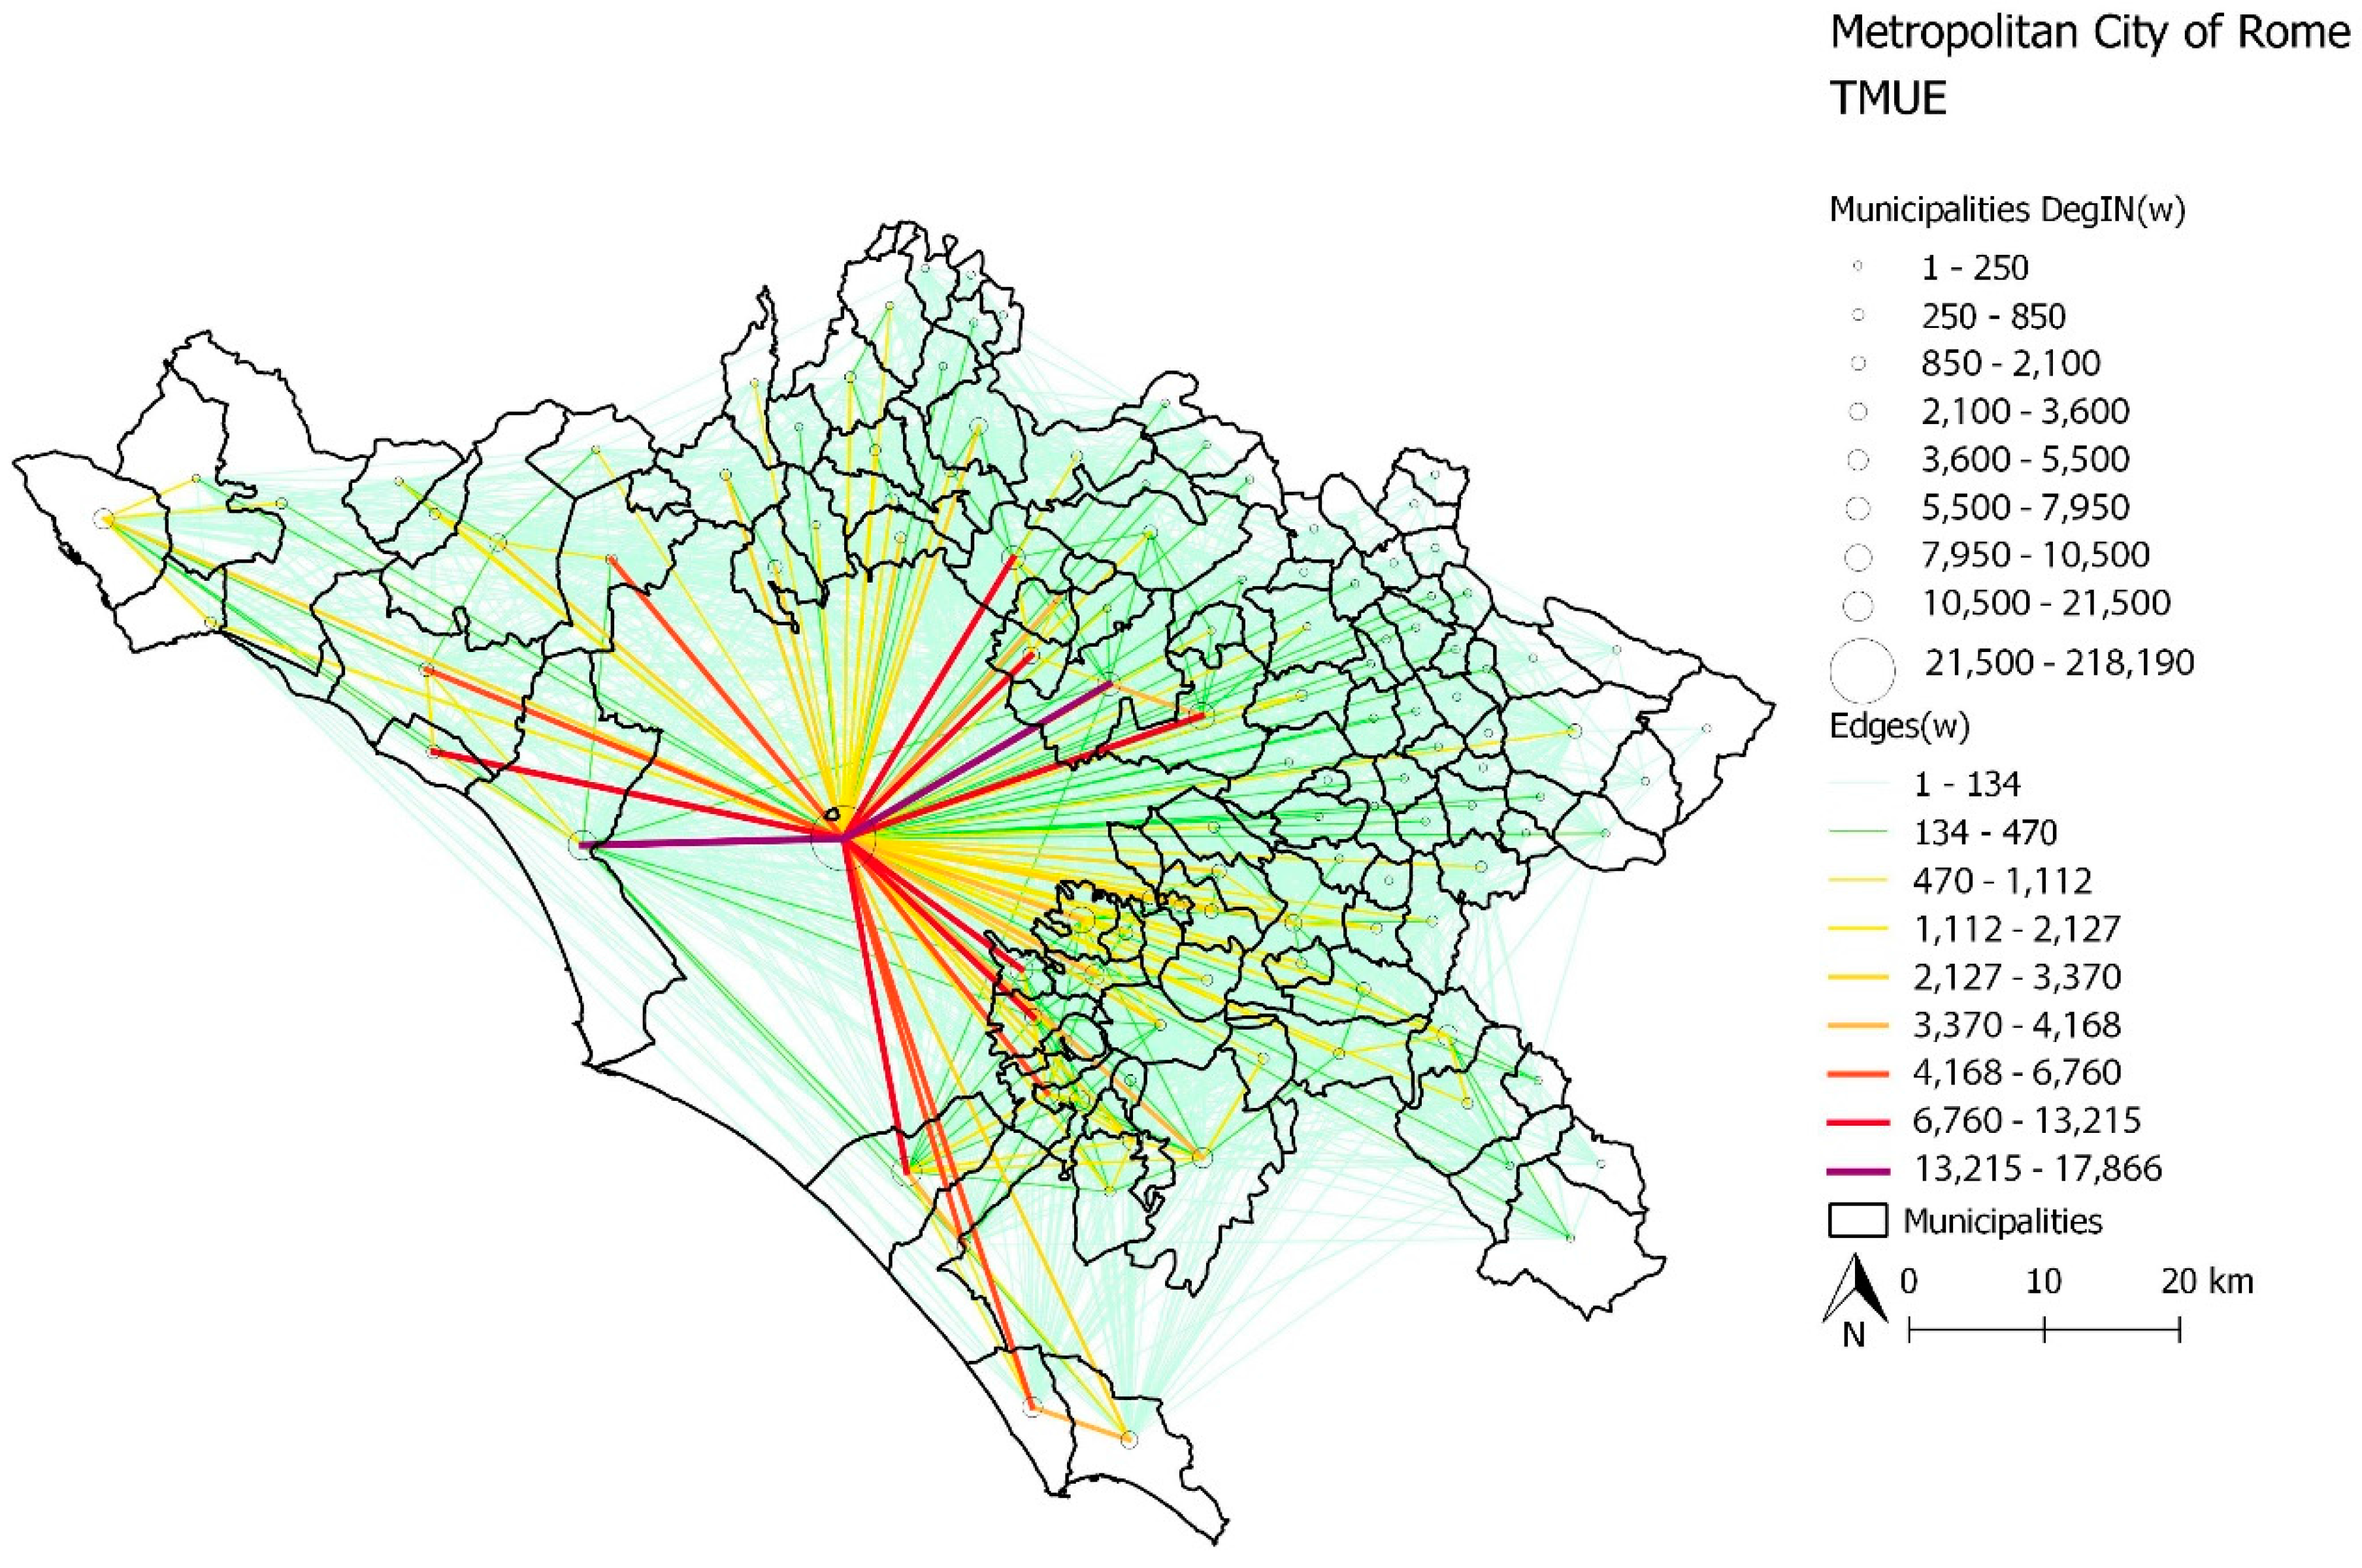
Firstly, we analyzed the four general matrices in the form of a graph in order to obtain four general networks, where commuting flows between municipalities is the sum of all daily travelers who use any means of transport with an unspecified duration of trip to commute between them. This value known as the “Total Moving Unit Estimator” (TMUE) (that is the total number of commuters that every day from home and using any means of transport with an undefined total travel time, even 24 h, reach their place of work) is calculated as:
TMUE = { (   Transport   Modes ) ( Travel   Time ) }
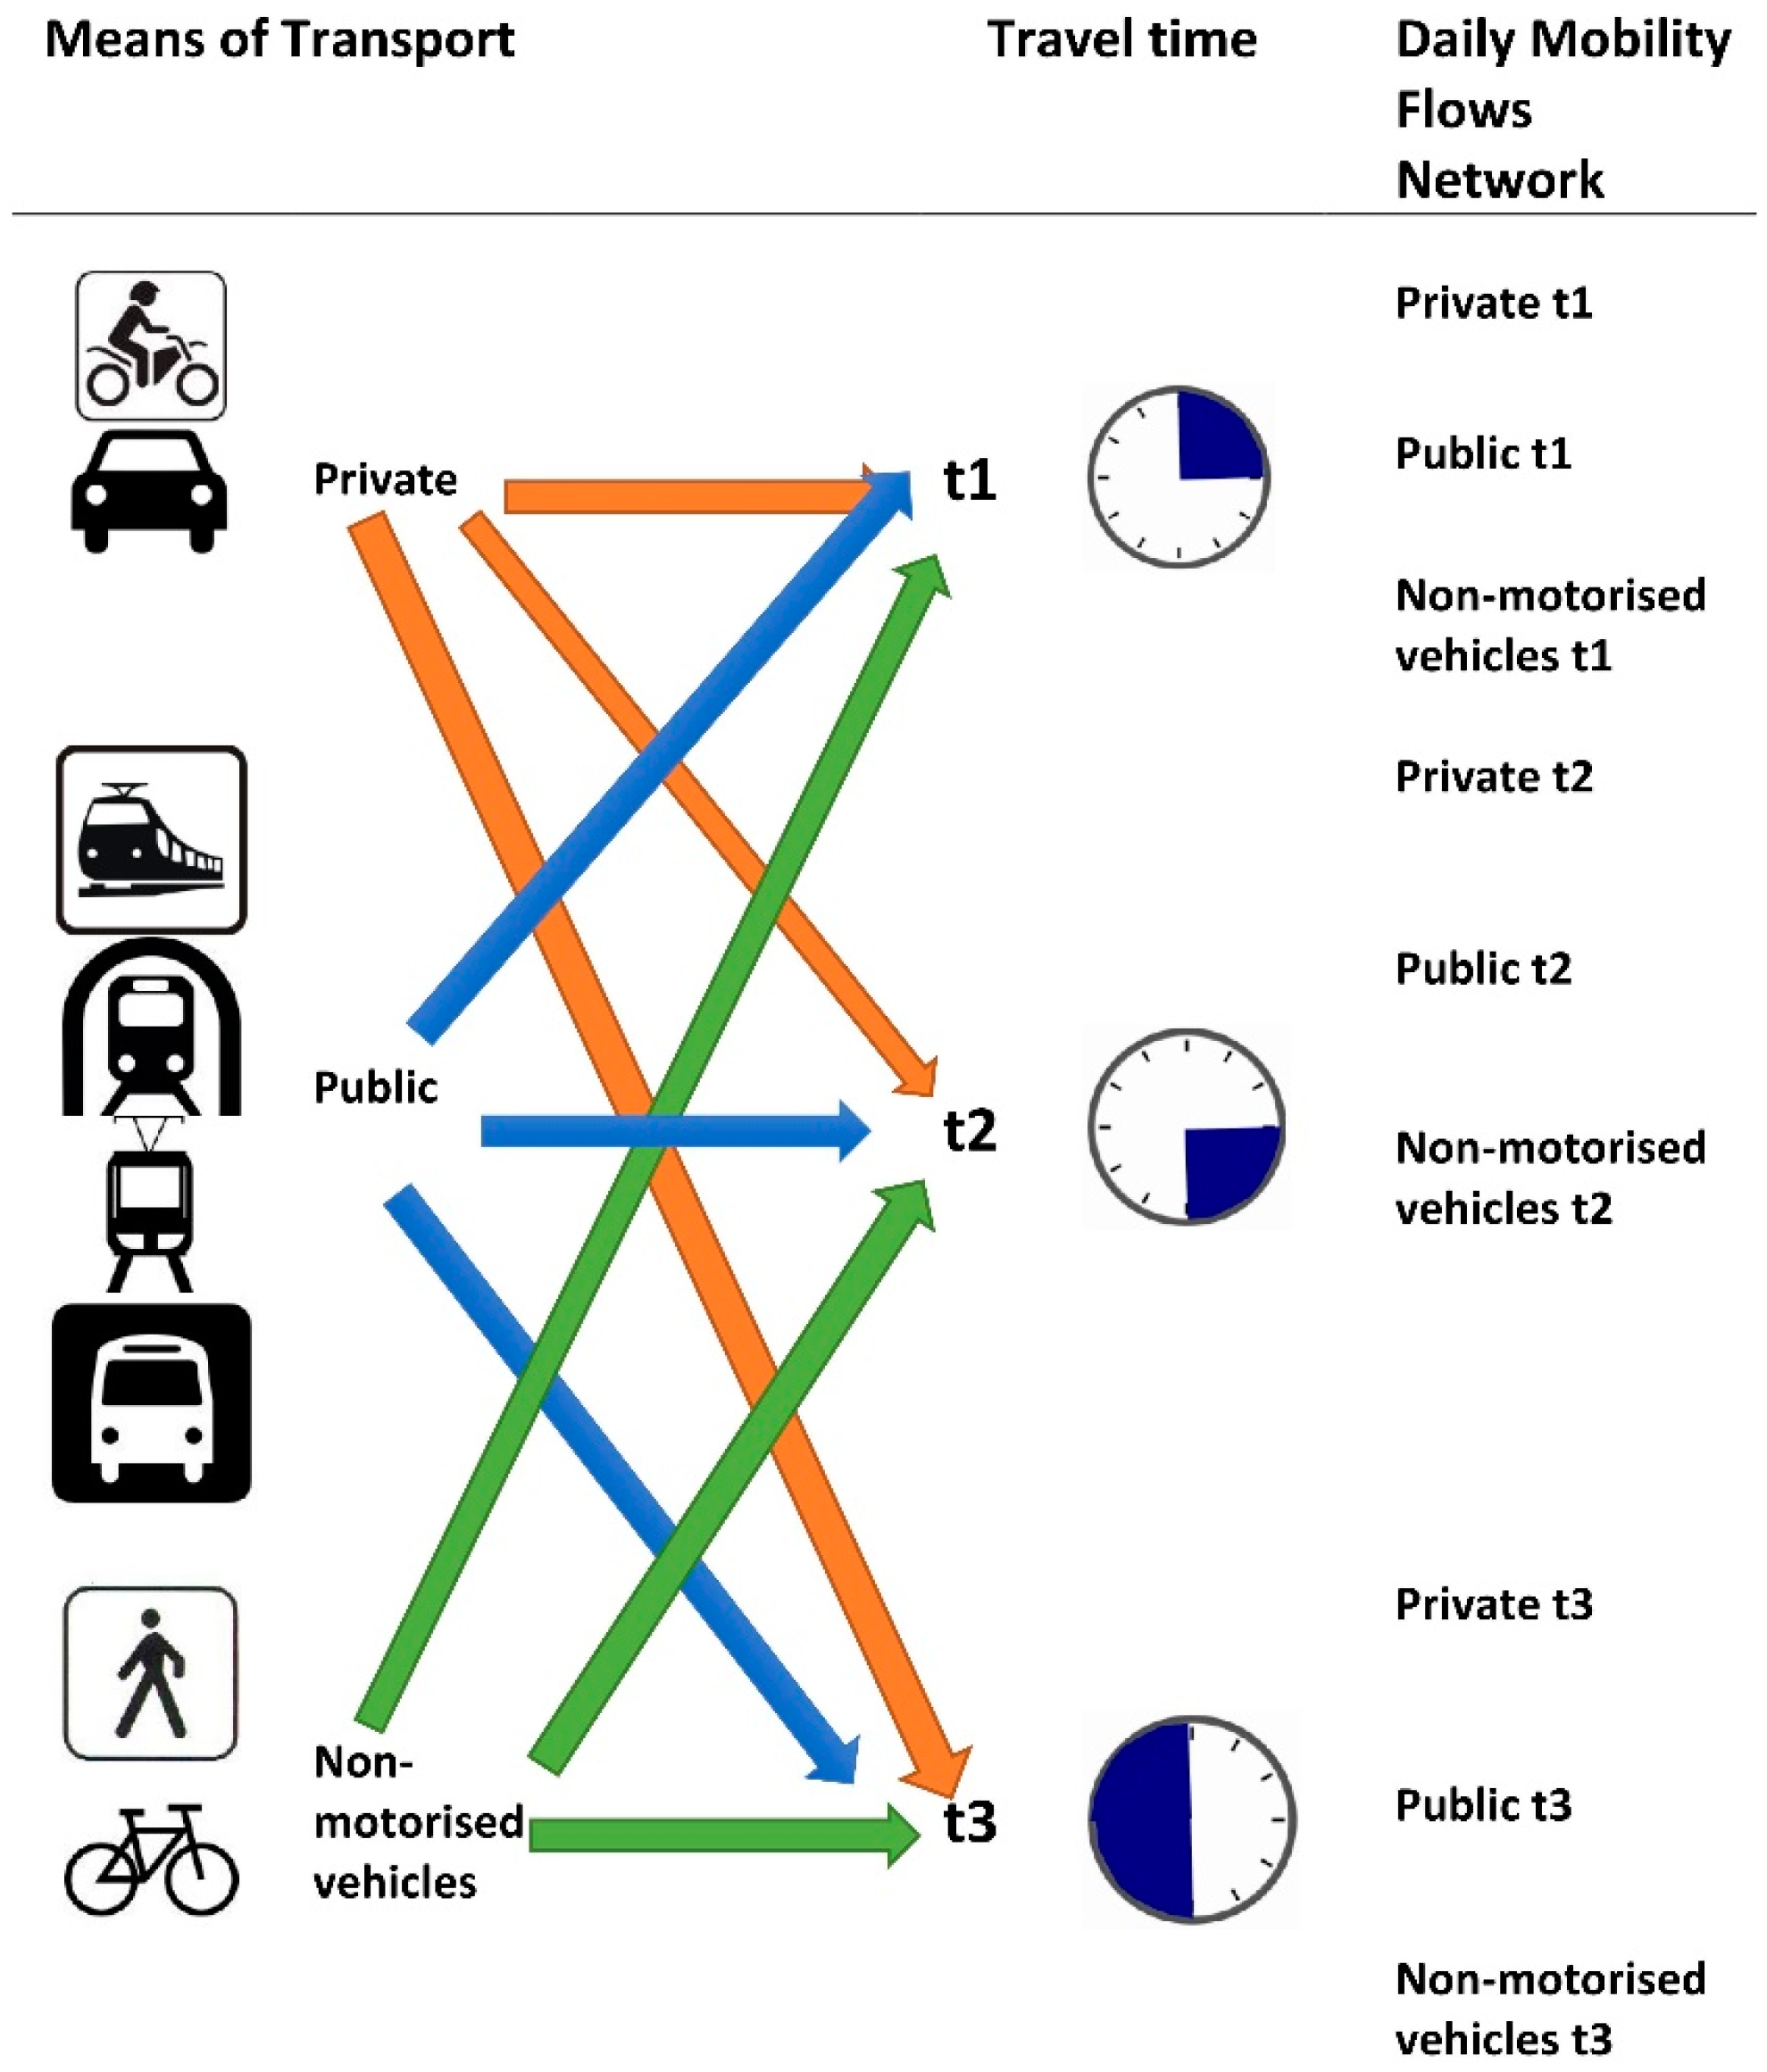
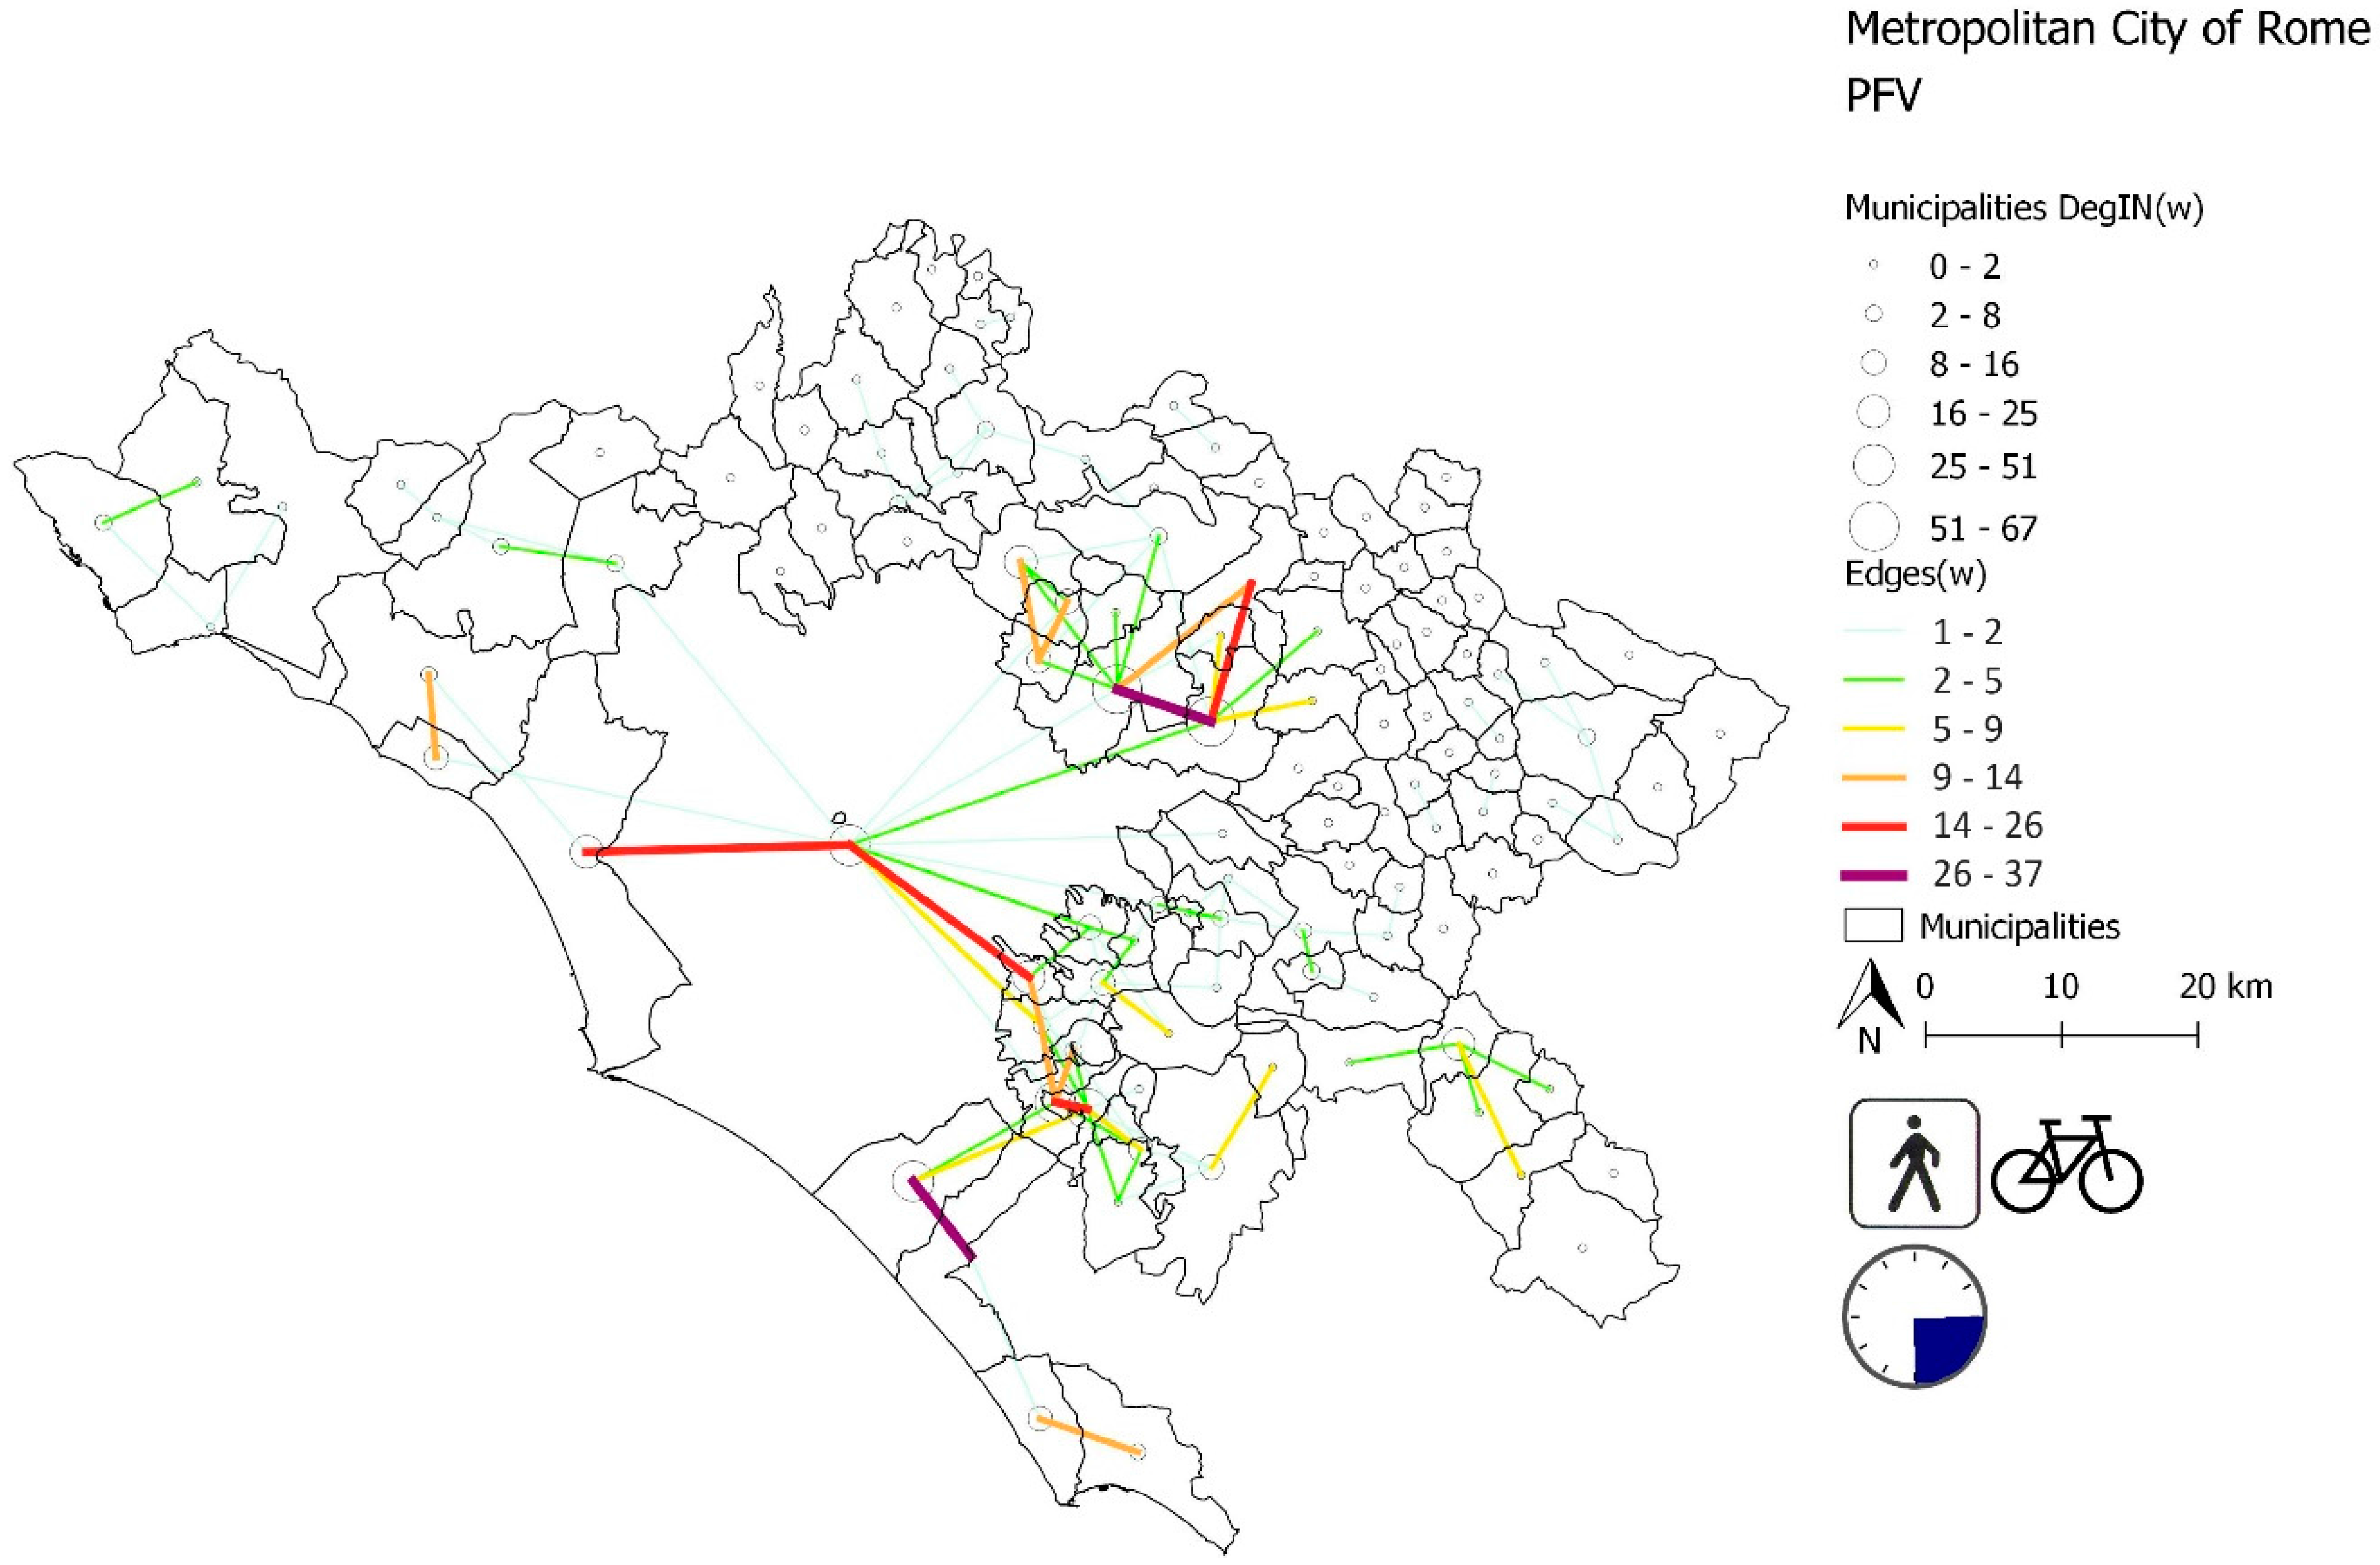
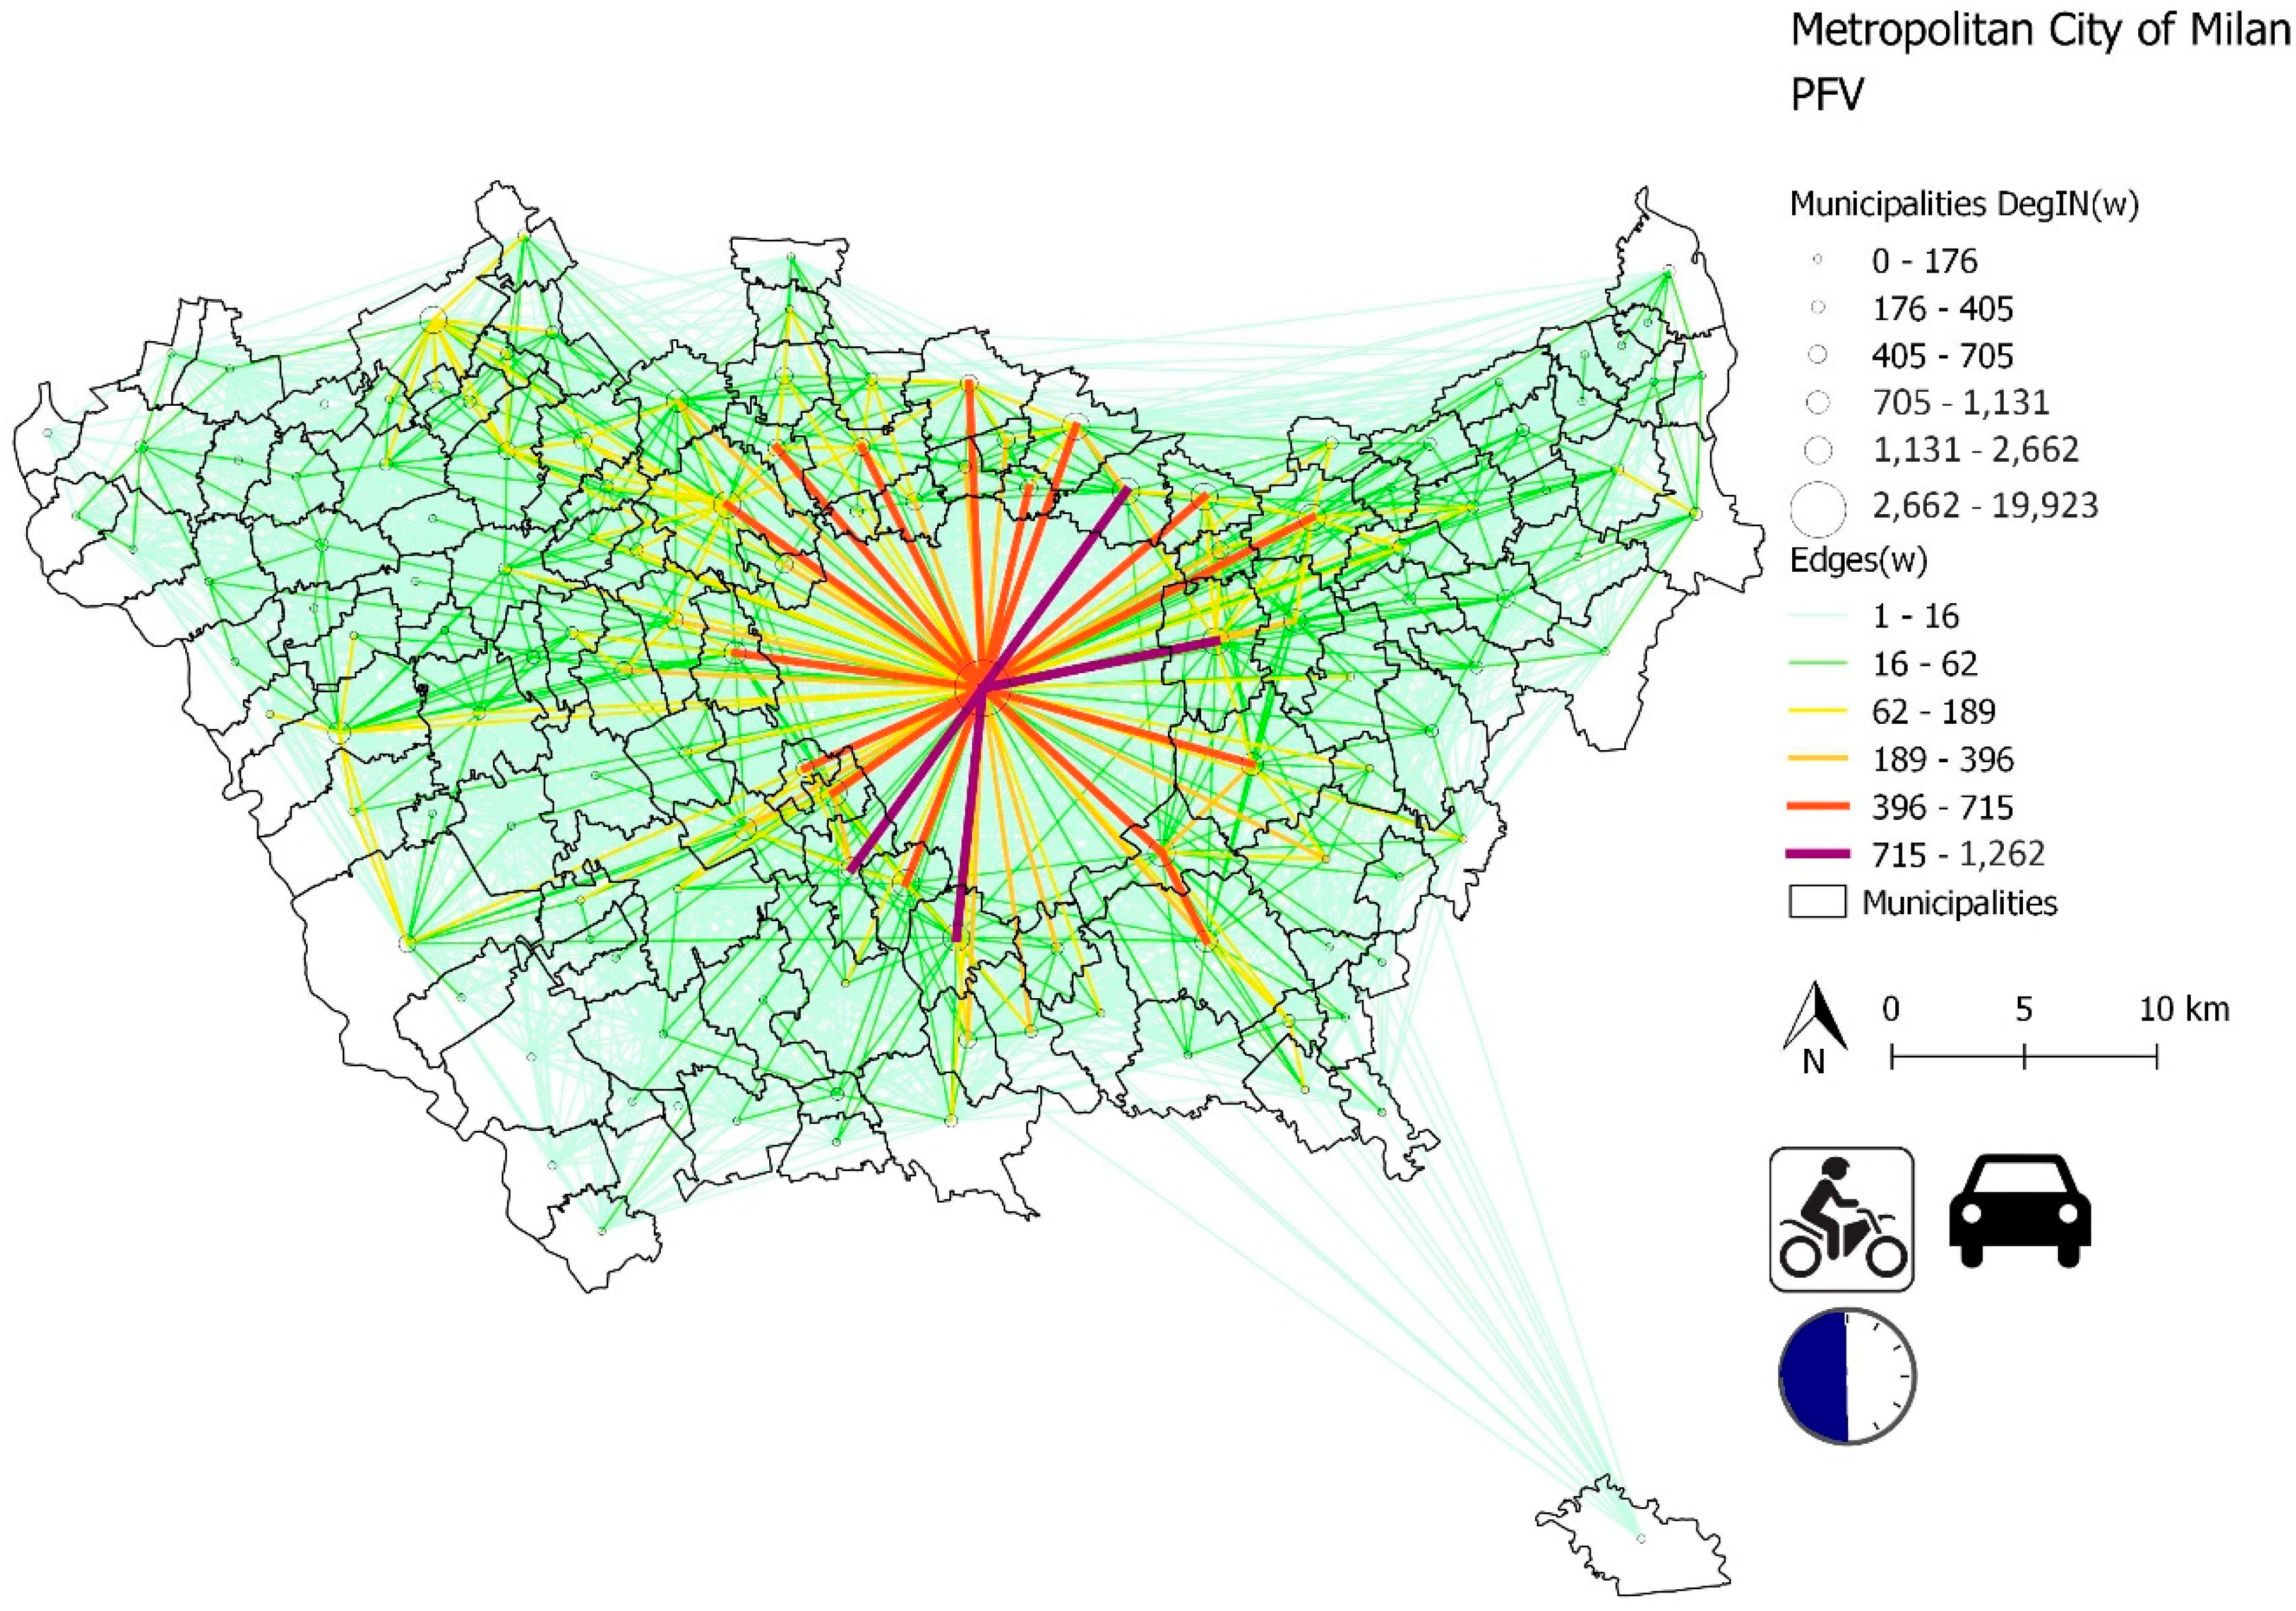
Subsequently, for the two metropolitan areas, the analysis was deepened by building specific commuting networks according to transport modes and duration of trip. In other words, a partial flow value (PFV) was calculated according to the means of transport used and the time required for the displacement.
PFV = { (   Transport   Modes ) ( Travel   Time ) }
To this aim, the various categories of “Means of transportation” were aggregated in three macro-categories, according to their typology: (A) Private vehicle; (B) Public vehicle; and, (C) Non-motorized mobility. The first macro-category includes the typologies indicated by codes 07 to 09, the second includes codes 01 to 06, while the third includes codes 10 and 12. Category 11 (Other) was excluded from the analysis, as it was not properly specified.
For the “Time” variable, we considered categories from 01 to 03. Category 04 was excluded due to lack of accuracy. Therefore for each of the two metropolitan areas, 9 PFV networks were built (Figure 4).
The networks were analysed using Graph Theory Algorithms. Graph Theory is a branch of mathematics developed by the Swiss physicist Eulero in the 18th century [31,32,33].
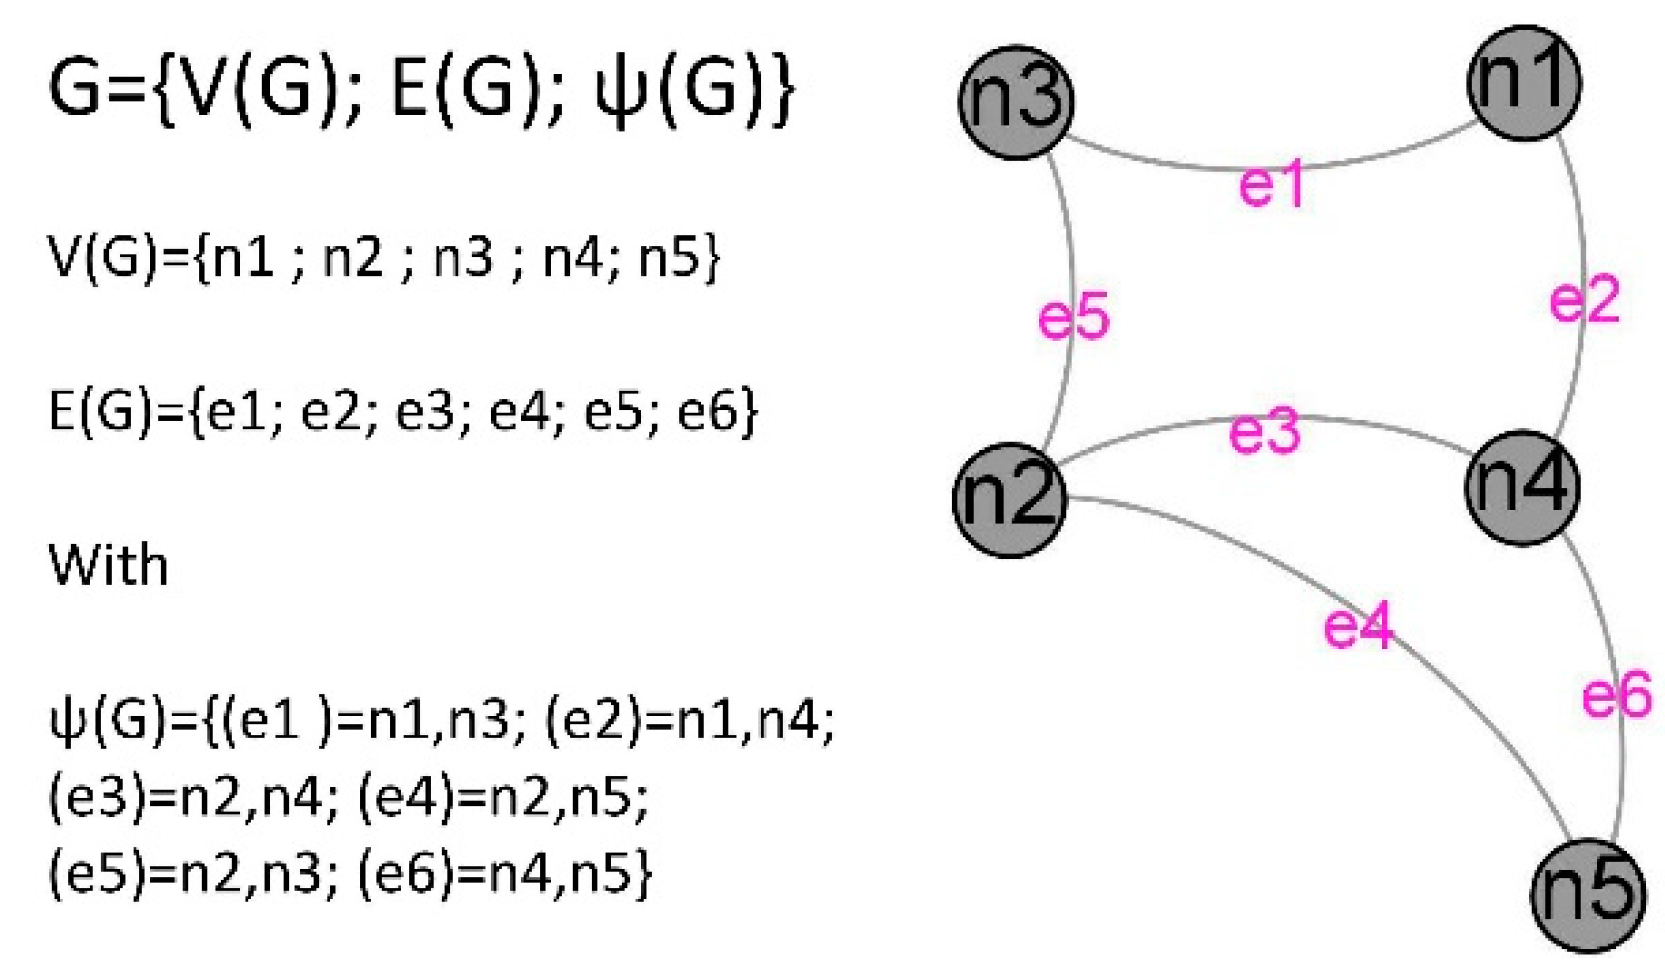
A graph is a mathematical structure for representing relationships (Figure 5). It is composed of nodes and edges, in which the nodes indicate elements and the edges indicate relations between nodes [58]. More formally, we can define a “G” graph as an ordered triple, which is composed of a nonempty set of nodes (n) designated as “V(G)”, a set of edges (e) designated as “E(G)” disjoint from “V(G)”, and the relations (Ψ) associated with each edge that connects two nodes [59]:
G = { V ( G ) ;   E ( G ) ;   Ψ }
In our analysis the nodes represent the municipalities, the presence of an edge between two nodes indicates the existence of a commuting flow between them, the magnitude of this flow, that is the number of people moving between two municipalities (TMUE or PFV), is a property associated to the edge as weight (w). There are many types of graphs that differ by type of structure, relationships that connect nodes and other features [58]. The graphs that are associated with the different networks analyzed in this study are geometric, weighted, and oriented. A graph is oriented when an automatic reciprocity of the flows between two Municipalities (i;j) cannot be acknowledged, for which the following relationships apply:
e ij e ji
SUST IJ SUST JI
SUSP IJ SUSP JI
This is because not all of the municipalities have both incoming and outgoing flows. Furthermore, even if both flows exist, the number of commuters that are travelling in each direction may not be equal. In order to determine the importance of nodes, the distribution characteristics of the graphs and their articulation on the territory, we used the main centrality measures at the various scales of analysis; for the regional level, we also carried out the Community Detection (CD) analysis and identified the relative modularity value (Q) (Table 2).
In particular, the first measure concerns the weighted degree (Degw) of the node. This value is often identified in literature by the “k” symbol and it is the sum of the weighted edges thag are connected at the node considered [58,59]:
k i w =   j = 1 , n e ij w
This represents the total number of inbound and outbound commuters from each network node (municipality).
When considering the previous three expressions on the direction of the flow, it is possible to split the (Degw) into two components: the In-Degree (DegInw), which is the number of people entering into each node, and the Out-Degree (DegOutw), which is the number of commuters leaving their municipality of residence on a daily basis.
k in w =   j = 1 , n e ij w
k out w =   j = 1 , n e ij w
k Tot w = k in w + k out w
Density (Δ) and Diameter (Φ) are two structural measurements. They express some general properties of the graph [60,61]. The first is a measure that enables us to evaluate the connectivity of the structure and takes into account the degree of centralization, multiplicity, and the diffusion of links within the network by correlating the actual number of edges present in the network at time “et” to the maximum number of arcs potentially possible at the same time (t) if each node (n) is connected to any other network node (n − 1).
Δ = e t n t * ( n t 1 )
Density assumes a value between 0 and 1; where 0 indicates that all of nodes are isolated, 1 is the maximum density possible. The distance d(G) between two nodes “i(V)”and “j(V)” is the length of the shortest path that connects them [62]. Diameter (Φ) indicates the shortest path between the pair of nodes (i;j) that are farther away from each other in the graph.
Φ = max min | d | i , j   V ( G ) d : i j
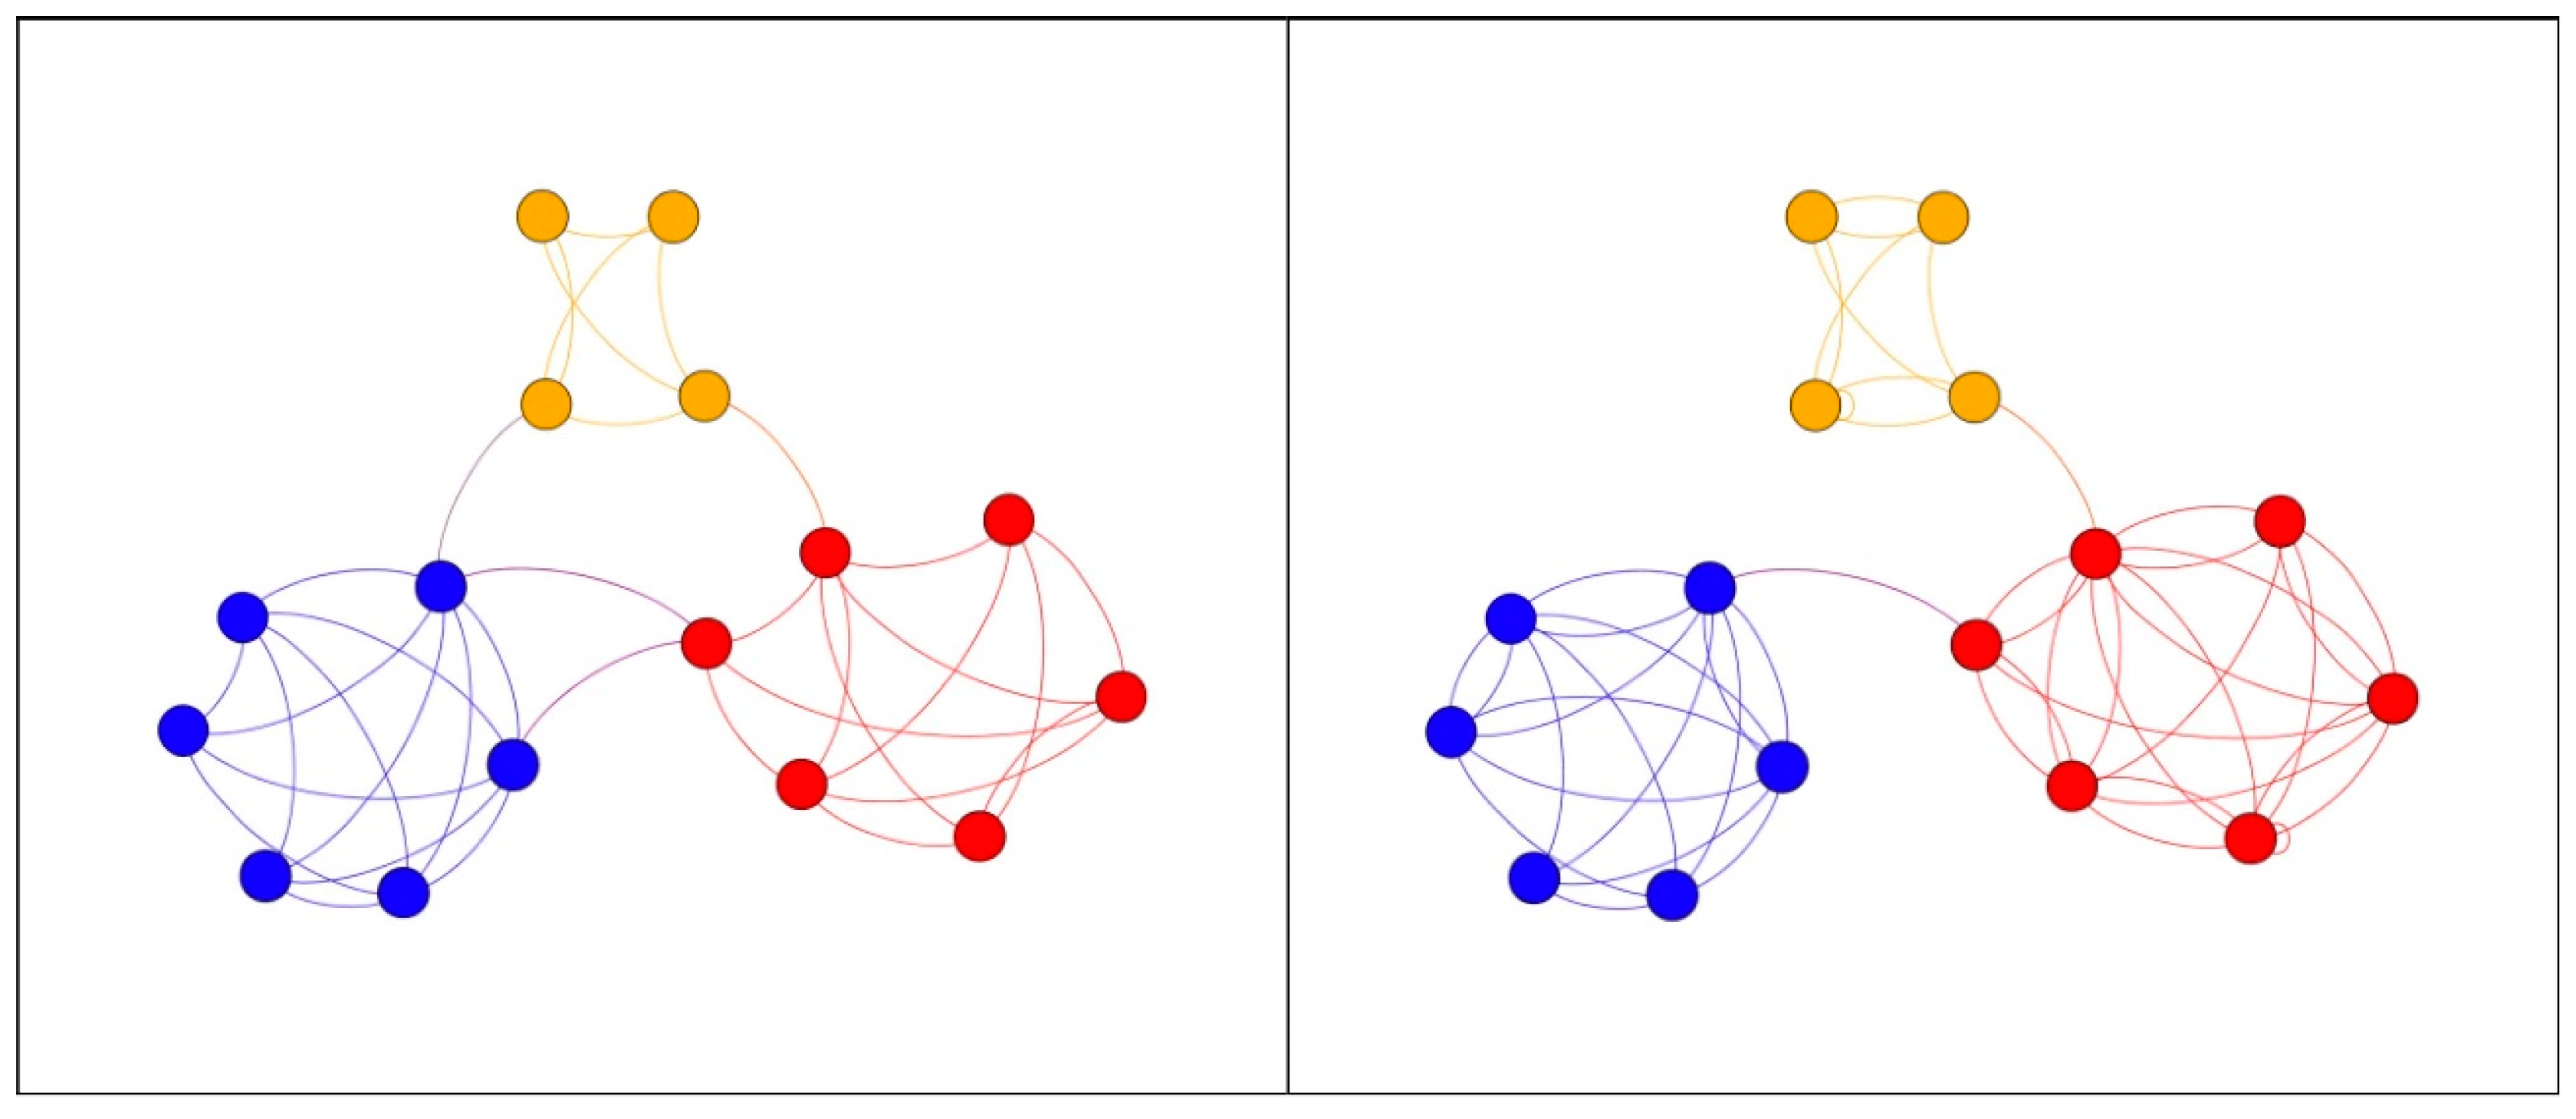
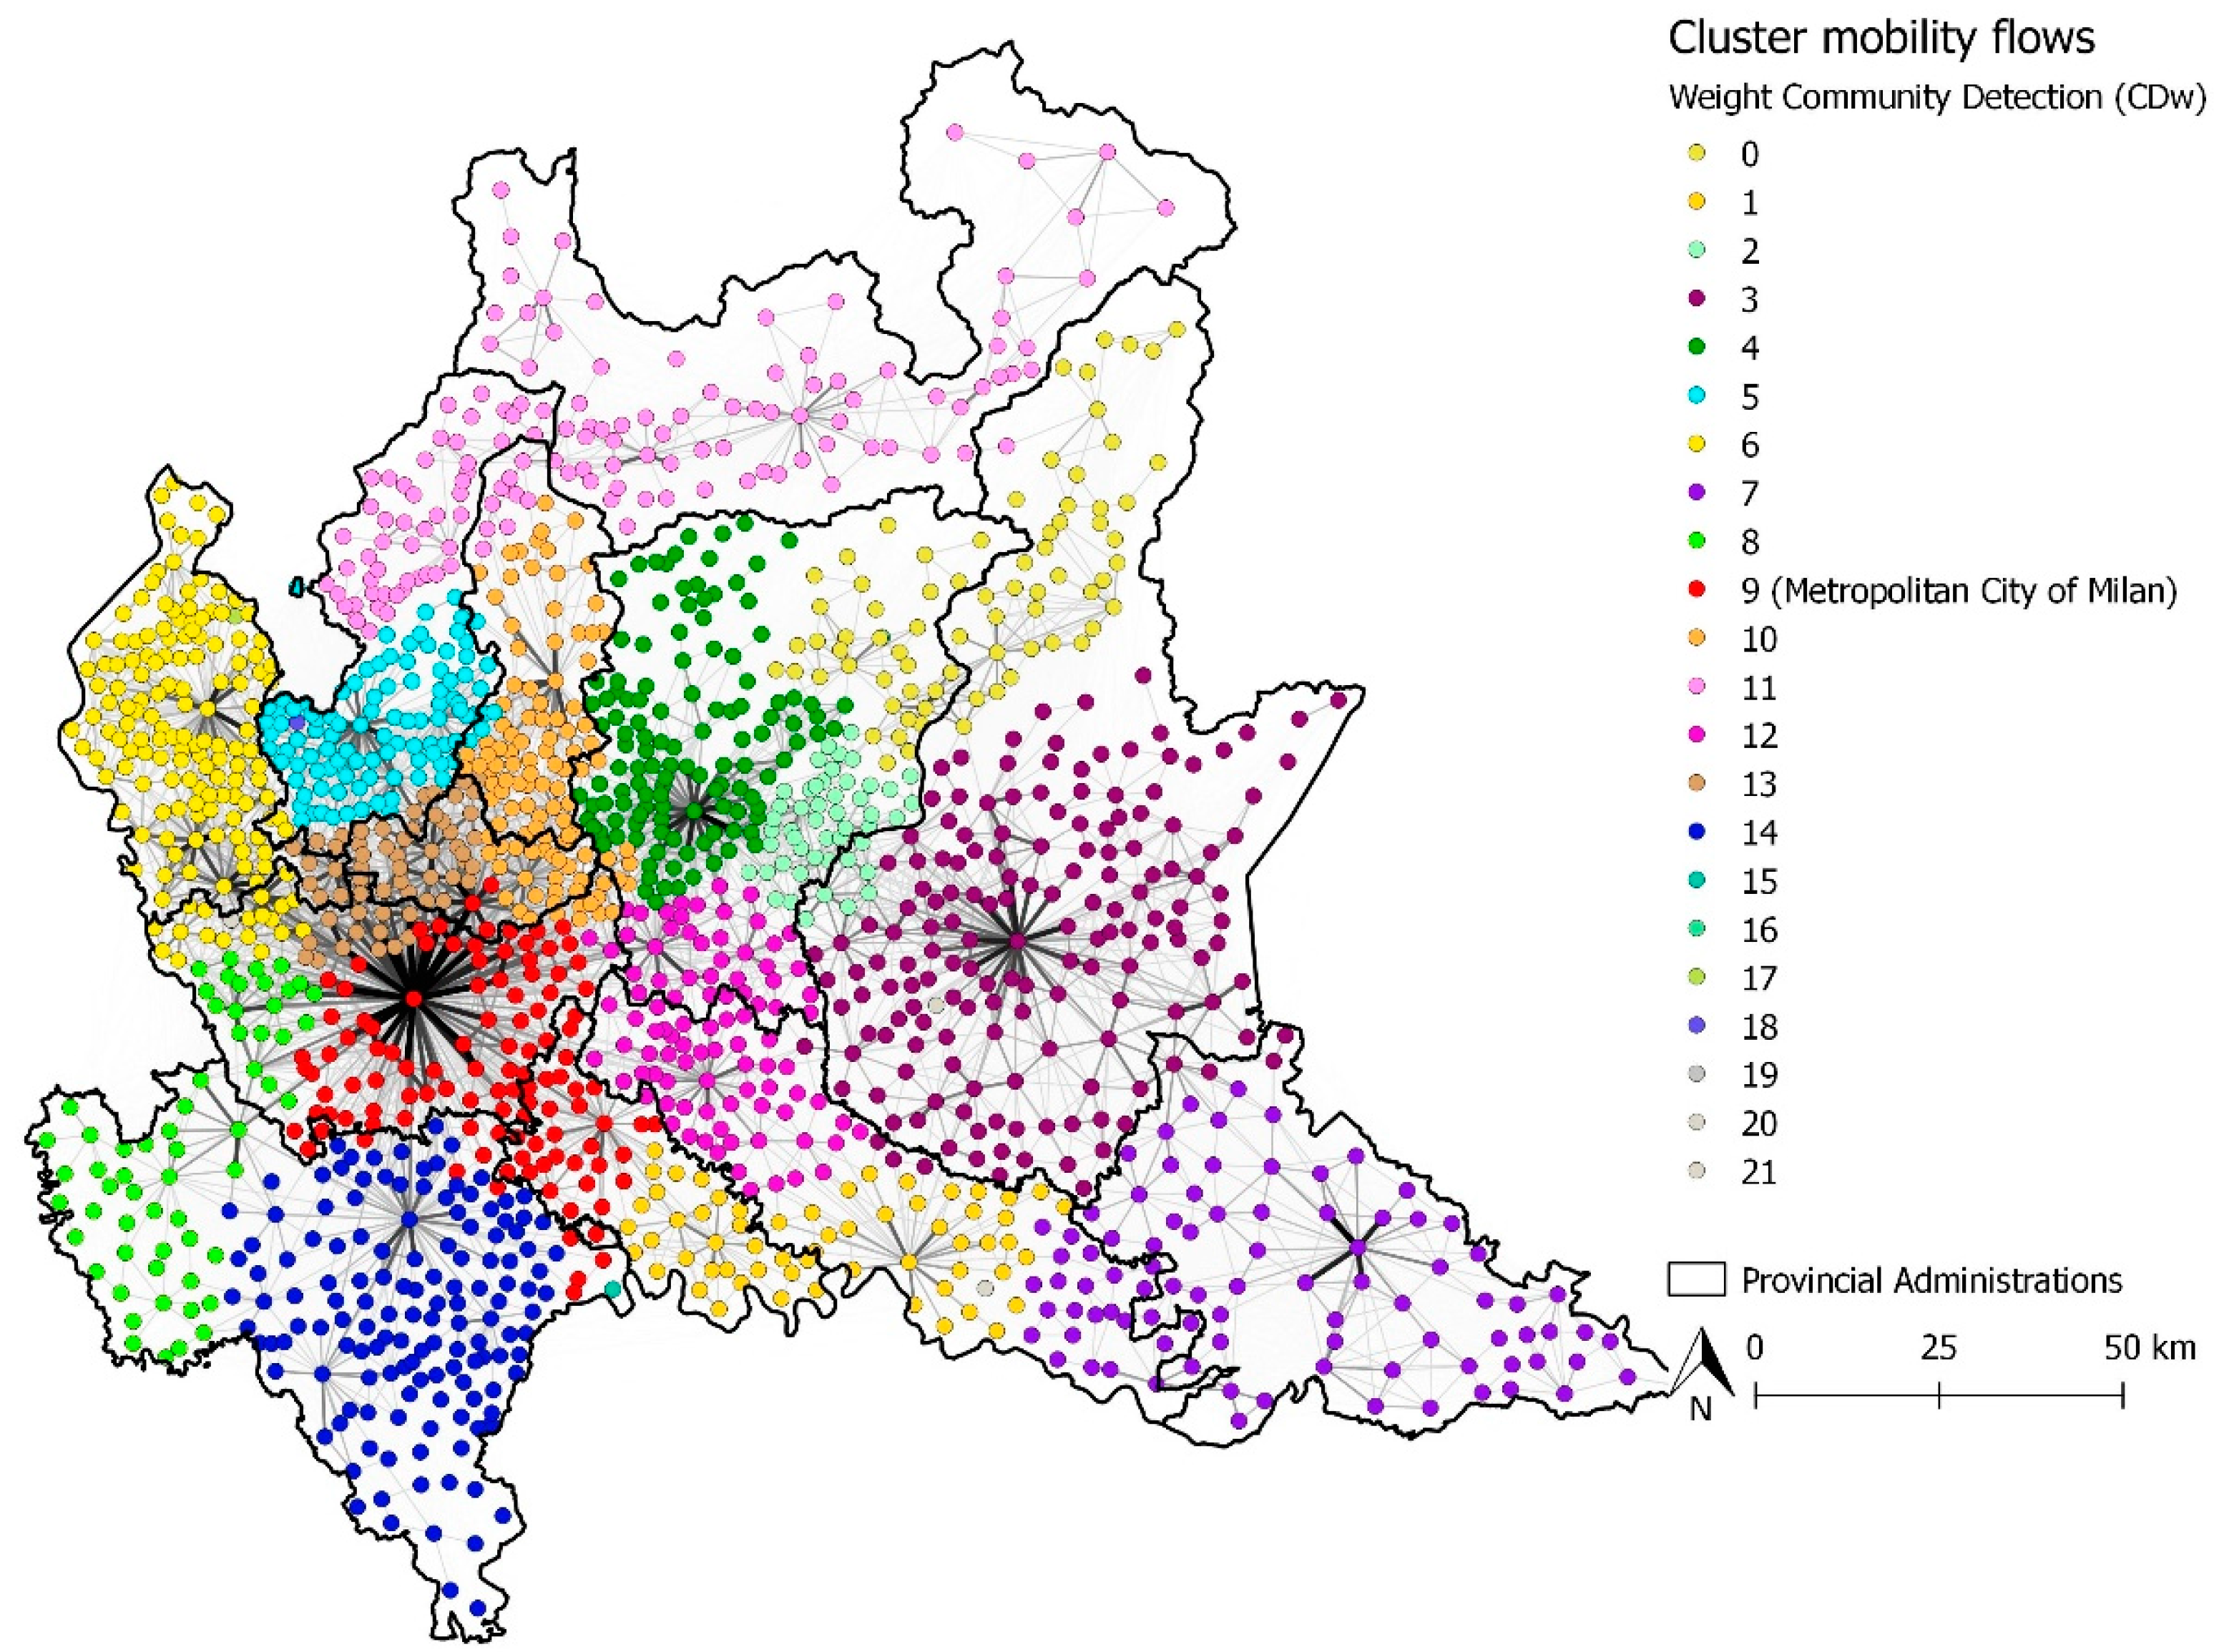
For the regional networks, we carried out an analysis of sub-reticular structures (Community) in order to identify composition, characteristics, and geographical location (Community Detection) (Figure 6). These sub-structures are identified in many scientific areas, for example, in social sciences, with the aim of identifying ethnic and religious minorities [36], or in the analysis of bibliographic networks for highlighting groups of articles or authors who cite each other more frequently [39]. In this analysis, the identification of the Communities provides us with valuable insight on the territorial extension of the influence or attraction force that “mother cities” have over the surrounding area. In literature, there are numerous procedures for identifying communities, which can be classified into three large families [63,64]: divisive methods, spectral analyses, and methods that are based on modularity optimization (Q). Optimizing modularity involves dividing a network into several sub-structures so that the gap between the number of edge connecting nodes belonging to the same community and the linking nodes belonging to different communities is as wide as possible [58].
The value of modularity is generally expressed as [36]:
Q =   1 2 m ( a ij K i K j 2 m ) δ ( C i , C j )
where “K” is the degree of the nodes, “m” is the number of the edges of the graph; “aij” identifies the edge in the adjacency matrix; the δ function assumes value 1 if vertices i and j belong to the same community, otherwise 0. Its value may range between 0 and 1, where 0 indicates poor clustering and 1 means that the clusters are well separated. Results vary considerably according to the algorithm used and the parameter “γ” which expresses the value of its resolution [65]. In our study, we used the Louvain algorithm [66] for the execution speed that reduces response times even in networks with thousands of nodes and links.
Our CD analysis also considers the weight of the edge (wij). In this case however, in line with the literature on gravitational models, the assumption is that the influence between two nodes increases as the commuting flux increases and decreases as the distance between them increases [17].
w ij = SUST ij Dist ij
The analysis was carried out on open source platforms: QGIS® for the geographic part and Gephi © for specific analysis of the network properties.

3. Results

3.1. Regional Level

The two regional systems show significant differences regarding the sample size (number of commuters) and complexity of the phenomenon (number of edges). The dimension of the phenomenon is considerably greater in the Lombardy region (Milan) than in the Lazio region (Rome), in fact the total flow of commuters (TMUE), and the number of strings are, respectively, 4 and 10 times higher in the Lombardy region (Table 3).
Regional commuting in Lombardy is centred on several “mother cities”, such as Brescia and Mantua in addition to Milan. These cities are characterised by a high degree of territorial attraction and are capable of limiting the territorial influence of the main mother city of Milan (Figure 7). Contrastingly, in the Lazio region, there is a polarisation of the commuting flows on the city of Rome, which is the main dominant nucleus. Other urban centers such as Viterbo and Frosinone have much smaller commuting flows than Rome (Figure 8).
In line with previous results, the TMUE analysis (Degw) and the TMUE analysis for incoming flows (DegINw) confirm the structural differences between the two metropolitan systems. In both cases, the cumulative Degw distribution highlights that 60% of the municipalities contribute to 10% of the total daily flow, and significant differences were observed in the behaviour of commuters in respect of the two mother cities. The city of Rome demonstrates a greater capacity to influence its region than the City of Milan in Lombardy. In fact, Rome is responsible for 20% of the total incoming and outgoing flows from all of the regional municipalities, while Milan has a lower exchange capacity with the other cities. The differences are particularly evident regarding the incoming commuting flow (DegINw). Over 40% of Lazio’s commuting flows converge on Rome, while Milan “captures” less than 20% of the regional flow (Figure 9).
The results on the density and diameter of the two networks define the degree of cohesion. As regards this cohesion, the regional network of the Lazio region shows a particular feature. In fact, the number of commuters and edges is significantly higher in the Lombardy region than in the Lazio region, even though the network is denser in Lazio due to its structure. Diameter measurements indicate that the Lazio network is smaller, the link density is higher and the diameter lower (Table 4).
The weighting Community Detection (CDw) performed using the Louvain algorithm (setting a value of its resolution γ = 1), revealed marked differences between the two regional systems regarding the number of communities identified and the quality of their modularity (Q). In line with the previous results, the network of the Lombardy region shows a degree of fragmentation that is three times higher than the degree observed in the Lazio region, with a higher modularity index (Q) (Table 5).
In the Lazio region, with the exception of the Frosinone province, which is more fragmented (three Communities), we observed a better correspondence between administrative limits and the extension of communities, especially for the MCR cluster (Figure 10).
In the Lombardy region, with the exception of the provinces of Brescia and Mantua, which show a good correspondence between provincial administration limits and area of influence, the rest of the territory is fragmented into numerous communities. The attractiveness of the Milan metropolitan area is limited in the north by the important City of Monza and by the other municipalities of the province of Brianza, while its capacity to attract commuters in the south goes beyond the administrative limits concerning the municipalities between the provinces of Pavia and Lodi (Figure 11).

3.2. Metropolitan Level—TMUE

At the metropolitan scale, in the MCM the phenomenon is significantly higher in terms of population and edges than that observed in the MCR (Table 6).
In addition, the results of the density and diameter analysis show a much denser and more compact network in the MCM than in the MCR (Table 7).
However, upon analysing the data of the two MCs in proportion to the largest regional network to which they belong, the preponderance of the MCR within Lazio for both of the populations that are involved (TMUE) and number of edges, is evident. Contrariwise, the MCM, which is clearly superior in absolute values to the MCR, shows a more limited influence within its region (Figure 12, Figure 13 and Figure 14).
The observation of Degw, through the analysis of its cumulative distribution, enabled us to understand the importance of each mother city within its metropolitan system.
The DegINw results reveal the monopoly exercised by the City of Rome, which attracts more than 50% of the total flow of its metropolitan area. It is also possible to note how this network is characterised by the presence of numerous municipalities with a minimal influence capability, which is in contrast with the situation observed in the MCM (Figure 15).

3.3. Metropolitan Level—PFV

The results for travel time and transport modes highlighted several differences between the two metropolitan areas both in absolute and relative terms.
It was observed that in the MCM over 90% of the commuters reach their destination (with all transport modes) within 60 min, while this occurs for only 70% of the commuters in the MCR.
Furthermore, the analysis indicates a shift towards green public transport in the MCM, both in absolute and relative terms when compared to the MCR (Figure 16).
Using macro categories of transport modes (Private, Public, Non-motorized mobility) as filters, we again observed a greater capacity for territorial connection capacity in shorter commuting times in MCM than in the MCR. As regards the “non motorized mobility” macro category, the volume of commuting flows was 10 times higher in MCM than in the MCR, and 60% of the commuters reach their destination within 30 min, while this percentage was only 50% in the MCR (Figure 17).
In the MCM, the number of commuters who have declared to reach with non-motorized vehicles their destination within 15 min is sufficiently high to visualize within the networks most articulated and extensive reticular structures (indicated by thicker arches and coloured from yellow to purple). Instead, in the MCR in order to have a commuter flow sufficiently high to allow for the identification of more important reticular structures a longer travel time (16 to 30 min) has to be considered.
Moreover, in the MCM, we can see an east-west axis that crosses the city of Milan, and a ramification in the north of the mother city (Figure 18).
In MCR, also considering a wider time range, the structure of the non-motorized mobility flow appears to be more fragmented. In particular, two important structures can be observed: the first involves Rome and connects it to the southern areas of town (Ciampino, Albano Laziale and Ariccia); the second is centred on the towns of Guidonia and Tivoli (Figure 19).
On studying the dynamics of the flows related to the use of private motorized vehicles, the two MCs show significant differences in the structural and functional organisation of the territory. In the MCM, over 80% of the commuters declared reaching their destination within 30 min, while only 50% of them manage to do so in the MCR (Figure 20).
The cumulative distribution of the DegINw, related to time “t3” (31–60 min), once again shows the ability of the city of Rome to attract commuters; in fact, over 60% of the metropolitan area commuting flows converge on the mother city of Rome. This trend is also confirmed for time “t2” (16–30 min). The curve is almost completely flattened along the X axis. This indicates the presence of a very large number of municipalities with poor attraction rates. In other words, it indicates that the commuter flow is predominantly outwards.
In line with previous results, in the MCM the presence of other urban centers contrasts with the attractiveness of the city of Milan, which is only responsible for 30% of the total metropolitan flows. This reveals a more polycentric spatial organisation than in the MCR (Figure 21).
The density and diameter analyses of the networks confirm these differences. In fact, strong networks have the same diameter (Φ). In the MCM, the greater connection between the MC daughter cities generates a higher density network (Δ). Vice versa, in the MCR, where most of the edges converge on Rome and there are fewer exchanges between the other towns, the network has a lower value Δ (Table 8).
The aspect of the graphs also confirms the results. The MCR’s tendencies are clearly monocentric, with important commuting flows that converge on the mother city even from the most remote localities; the exchanges between the smaller municipalities are negligible. In the MCM, there are numerous incoming commuter flows from nearby municipalities, yet a significant number of exchanges can also be observed within the peripheral areas, especially in the north eastern and north-western areas of the MCM (Figure 22 and Figure 23).
On analysing the commuting flows on public transportation services, the MCM’s infrastructures are clearly more efficient and commuters are more inclined to travel by public transport than to use private vehicles. In fact, more than 90% of Milanese commuters are able to reach their destination within 30 min, while this is possible for only 40% of MCR commuters (Figure 24).
However, differences are observed if we compare the current articulation of flows with the previous results. The study of the cumulative distribution in time “t2” (16–30 min) shows a more homogeneous attraction capability in the MCR than in the MCM. In particular, the city of Milan is the destination of almost 70% of the total flows, and the measurements of diameter and density, territorial articulation of displacements are denser in the MCM (Figure 25, Table 9).
These results, apparently in contrast with the rest of the analysis, can be explained by observing the graph of the two structures (Figure 26 and Figure 27). In the MCR there are many other urban centers apart from Rome, such as Fiumicino, Ciampino, Tivoli and Guidonia, which receive considerable daily commuter flows; whereas in the MCM public transport mainly converges on the city of Milan. Furthermore, the graph concerning the MCM shows the large number of exchanges (2173 edges), which makes the network very dense and compact. In comparison the MCR is definitely more fragmented and has a smaller number of exchanges (653 edges), but covers a larger number of cities, not only Rome.

4. Discussion

In the Lombardy region (Milan), commuting is a more widespread daily phenomenon with a greater number of individuals involved and a major number of exchanges (edges) between the towns of the case of the Lazio region (Rome).
However, in the Lazio region, a denser network of commuters was observed than in the case of Lombardy, due to the fact that there are fewer municipalities.
Initially, this result may appear to be due to the difference in the number of nodes that are analysed in the two cases, which partly explains the results on the density and diameter of the regional networks.
However, the most important indications on the morphological differences in the two metropolitan systems can be obtained from subsequent analyses on communities and the value of their modularity (Q). This value highlights the presence of numerous widespread urban settlements within the Lombardy region with a high ability to polarise flows, leading to the fragmentation of the regional network into 22 communities.
Contrastingly, in the Lazio region, the smaller number of substructures and lower quality of clustering can be explained by two factors: the presence of the mother city of Rome, which is able to attract substantial flows even from the peripheral municipalities of the region, and the absence of other large urban centers that can contrast this capacity.
Expressed in another way, the results of the analysis seem to indicate the existence of a wider regional city with a functional polycentric organisation in the Lombardy region, where the MCM is definitely the most important component, but not the only one; while, the Lazio region has a monocentric nature thanks to the city of Rome, which develops attractive capacities throughout the whole region. This means that even if, as many authors argue [19,67], the polycentric model is becoming a typical contemporary from of urban systems’ organisation, a monocentric typology persists. This is not necessarily good or bad per se. Some authors have highlighted the advantages of polycentric systems [29,68,69], with respect to monocentric systems, but there is not a consensus about that [29,70]. The polycentric nature of the MCM and the monocentric nature of the MCR found in this work are consistent with other studies on the two areas through with other methodologies and different types of data [25,71,72].
These considerations are confirmed by the analysis at the metropolitan scale and by investigating the influence of the two metropolitan areas on their metropolitan system.
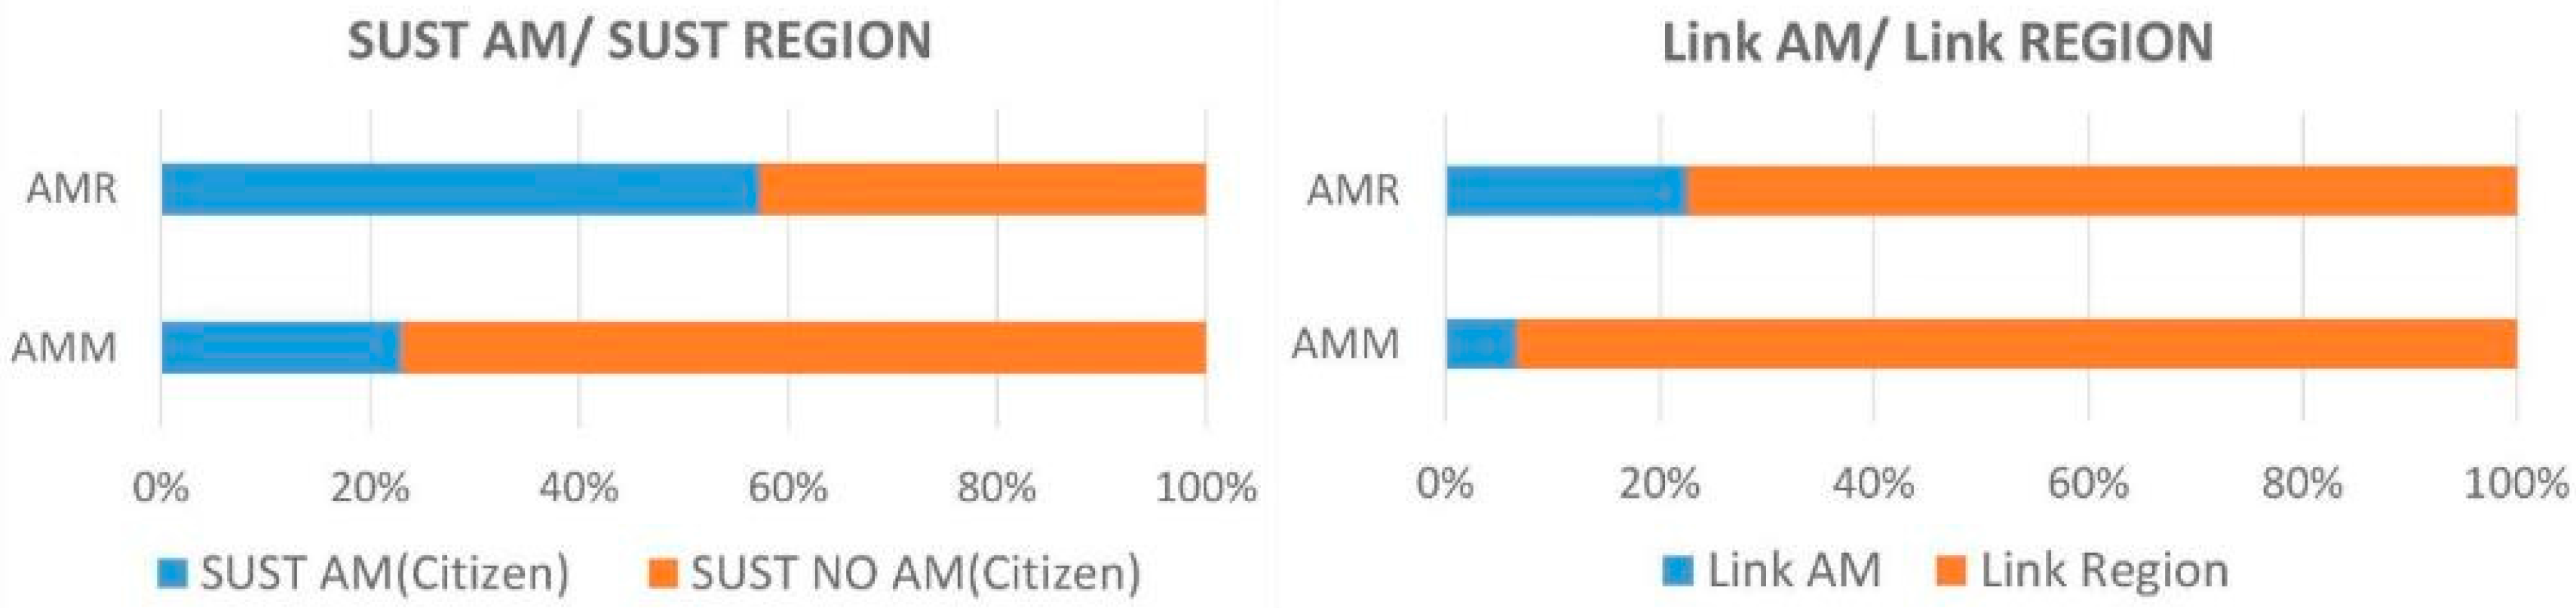
In Lazio almost 60% of the entire regional flow is focused on the MCR and over 50% of this flow converges upon the city of Rome; while less than 25% of the entire regional flow is focused on the MCM and the city of Milan attracts approximately 40% of all the incoming flows.
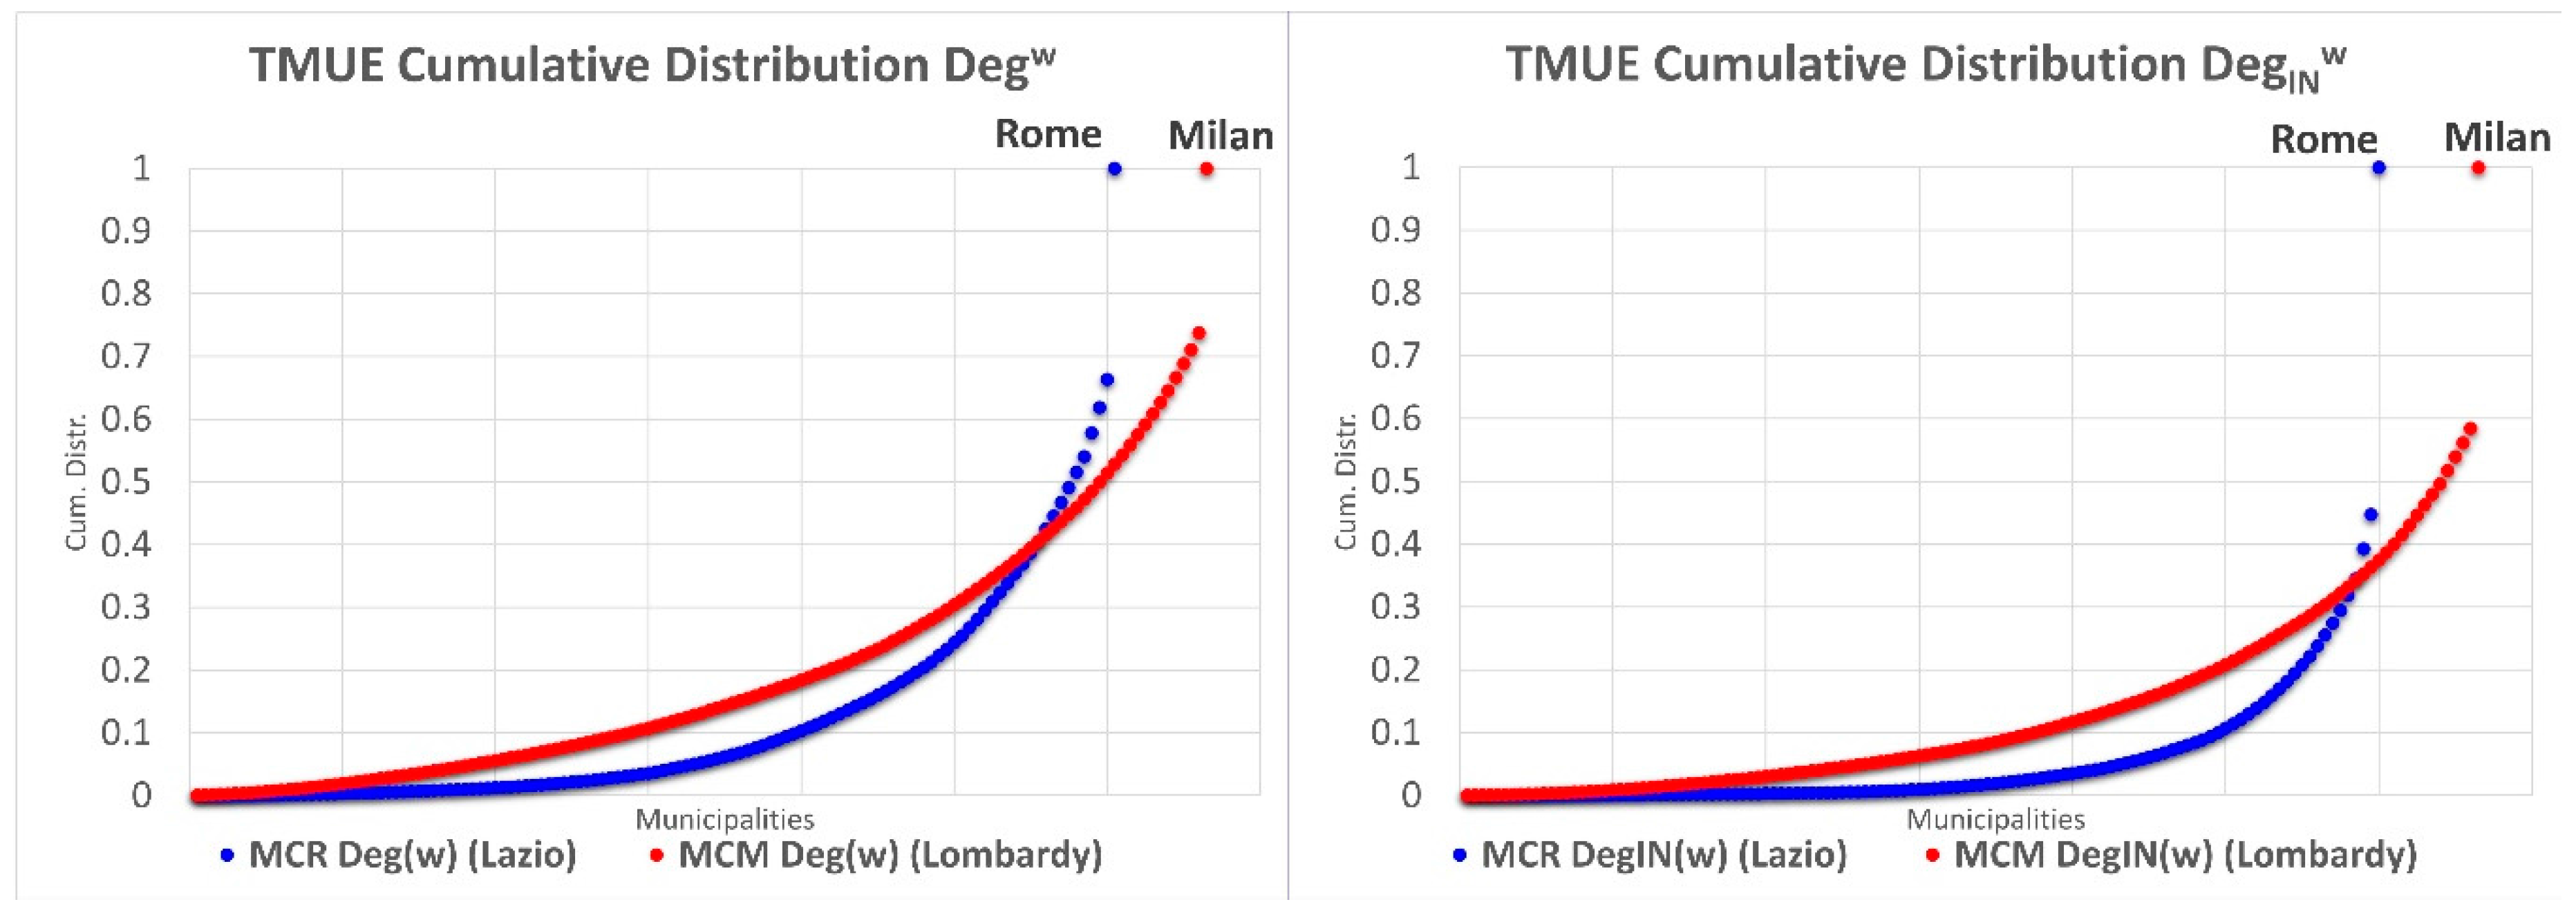
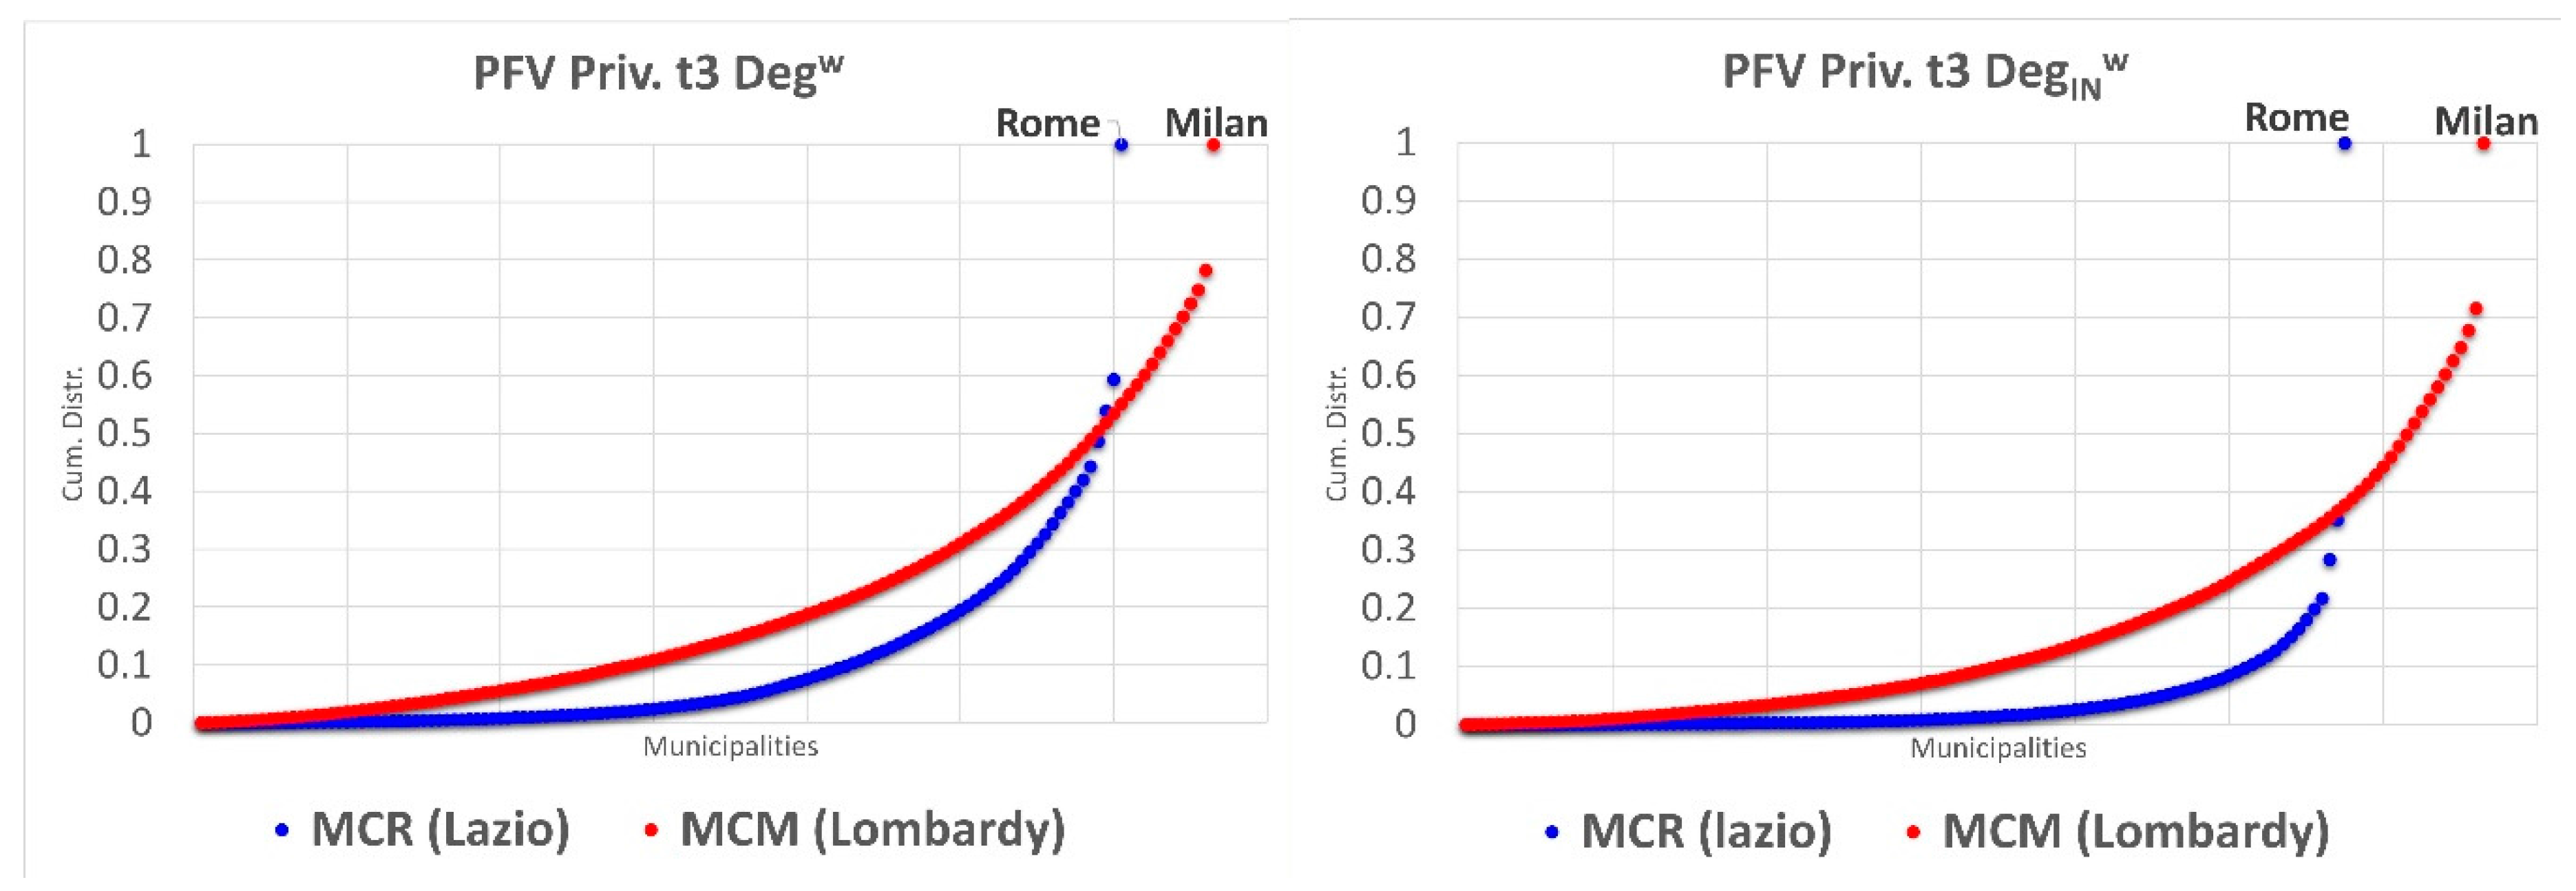
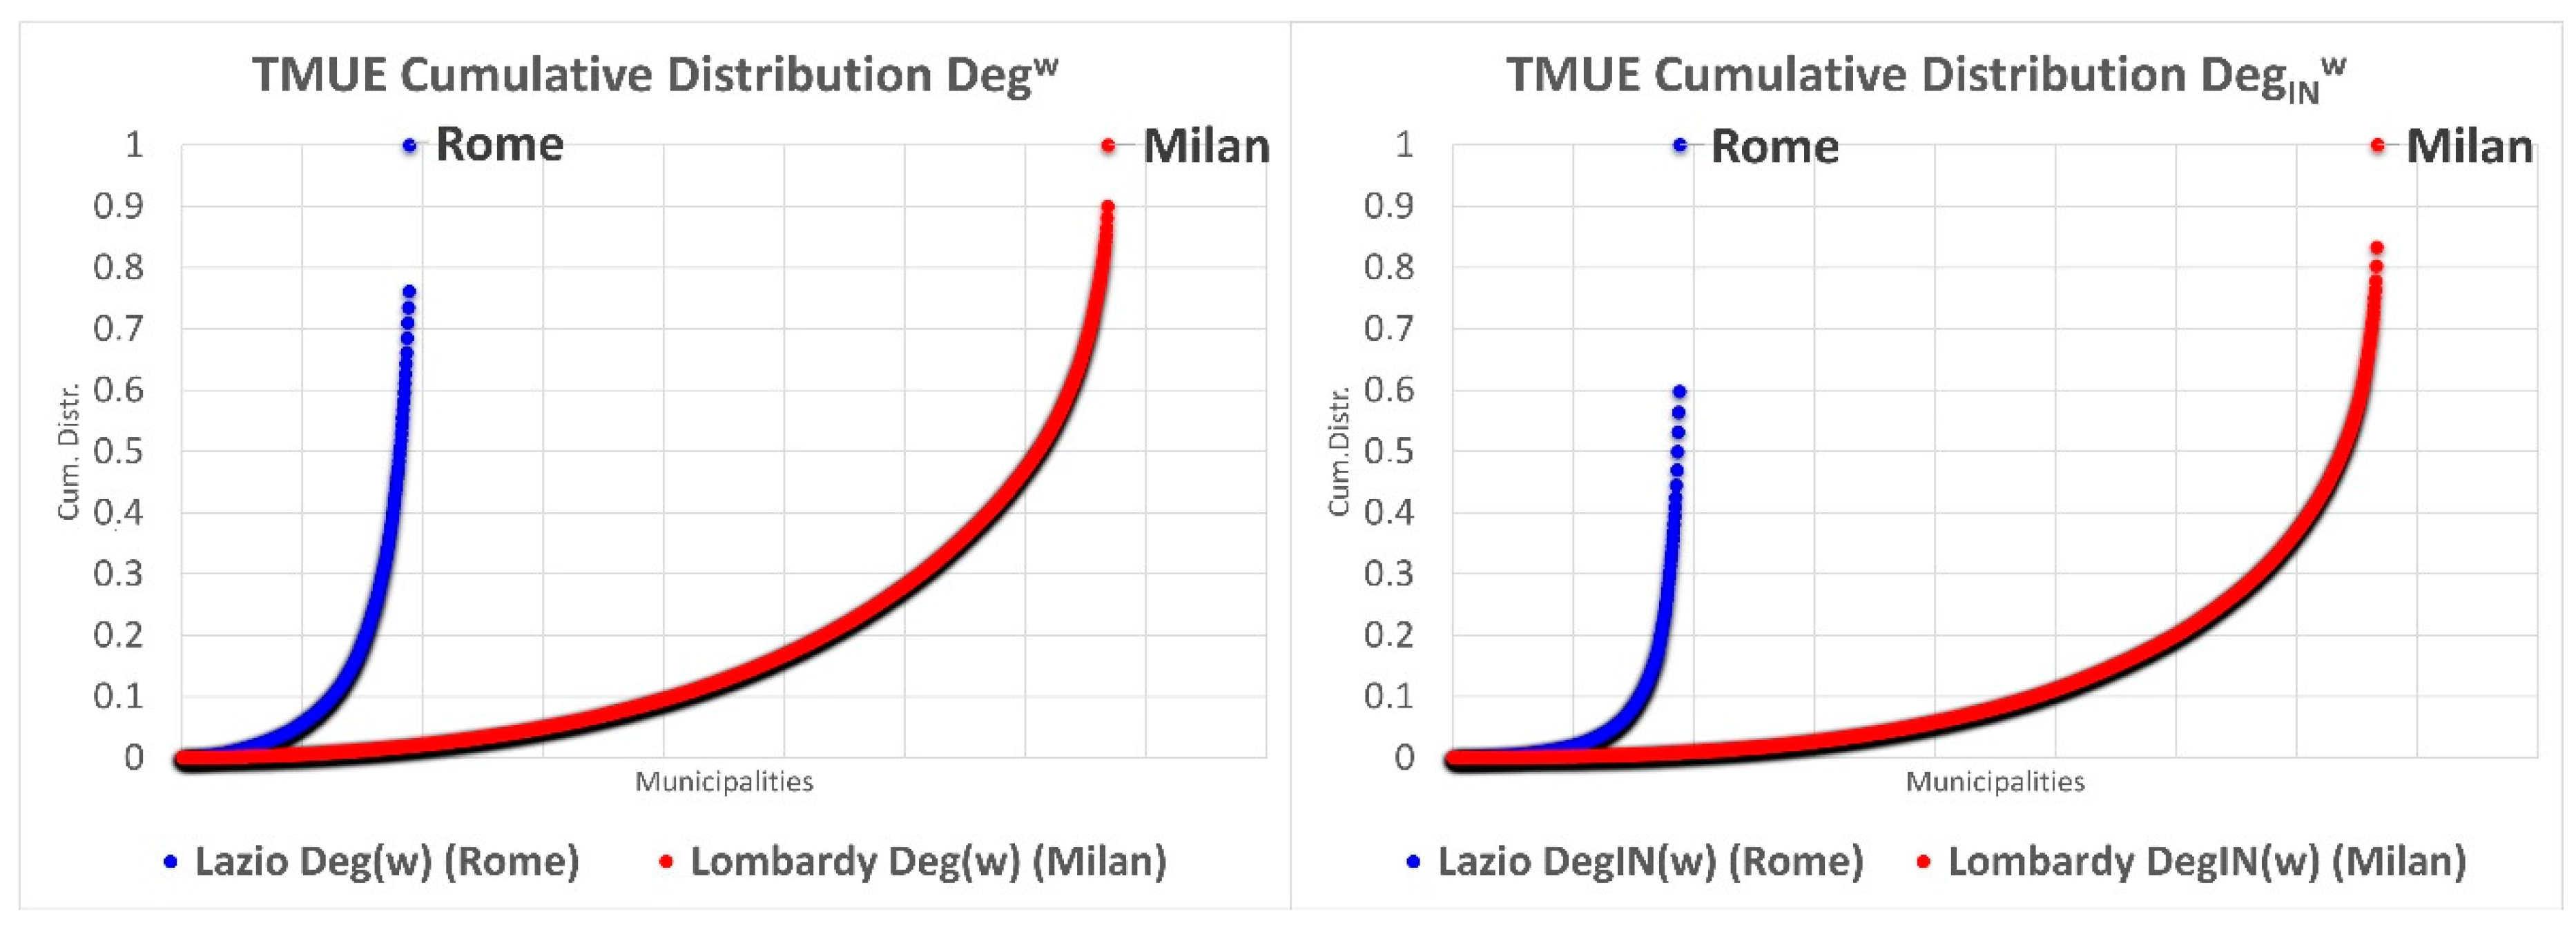
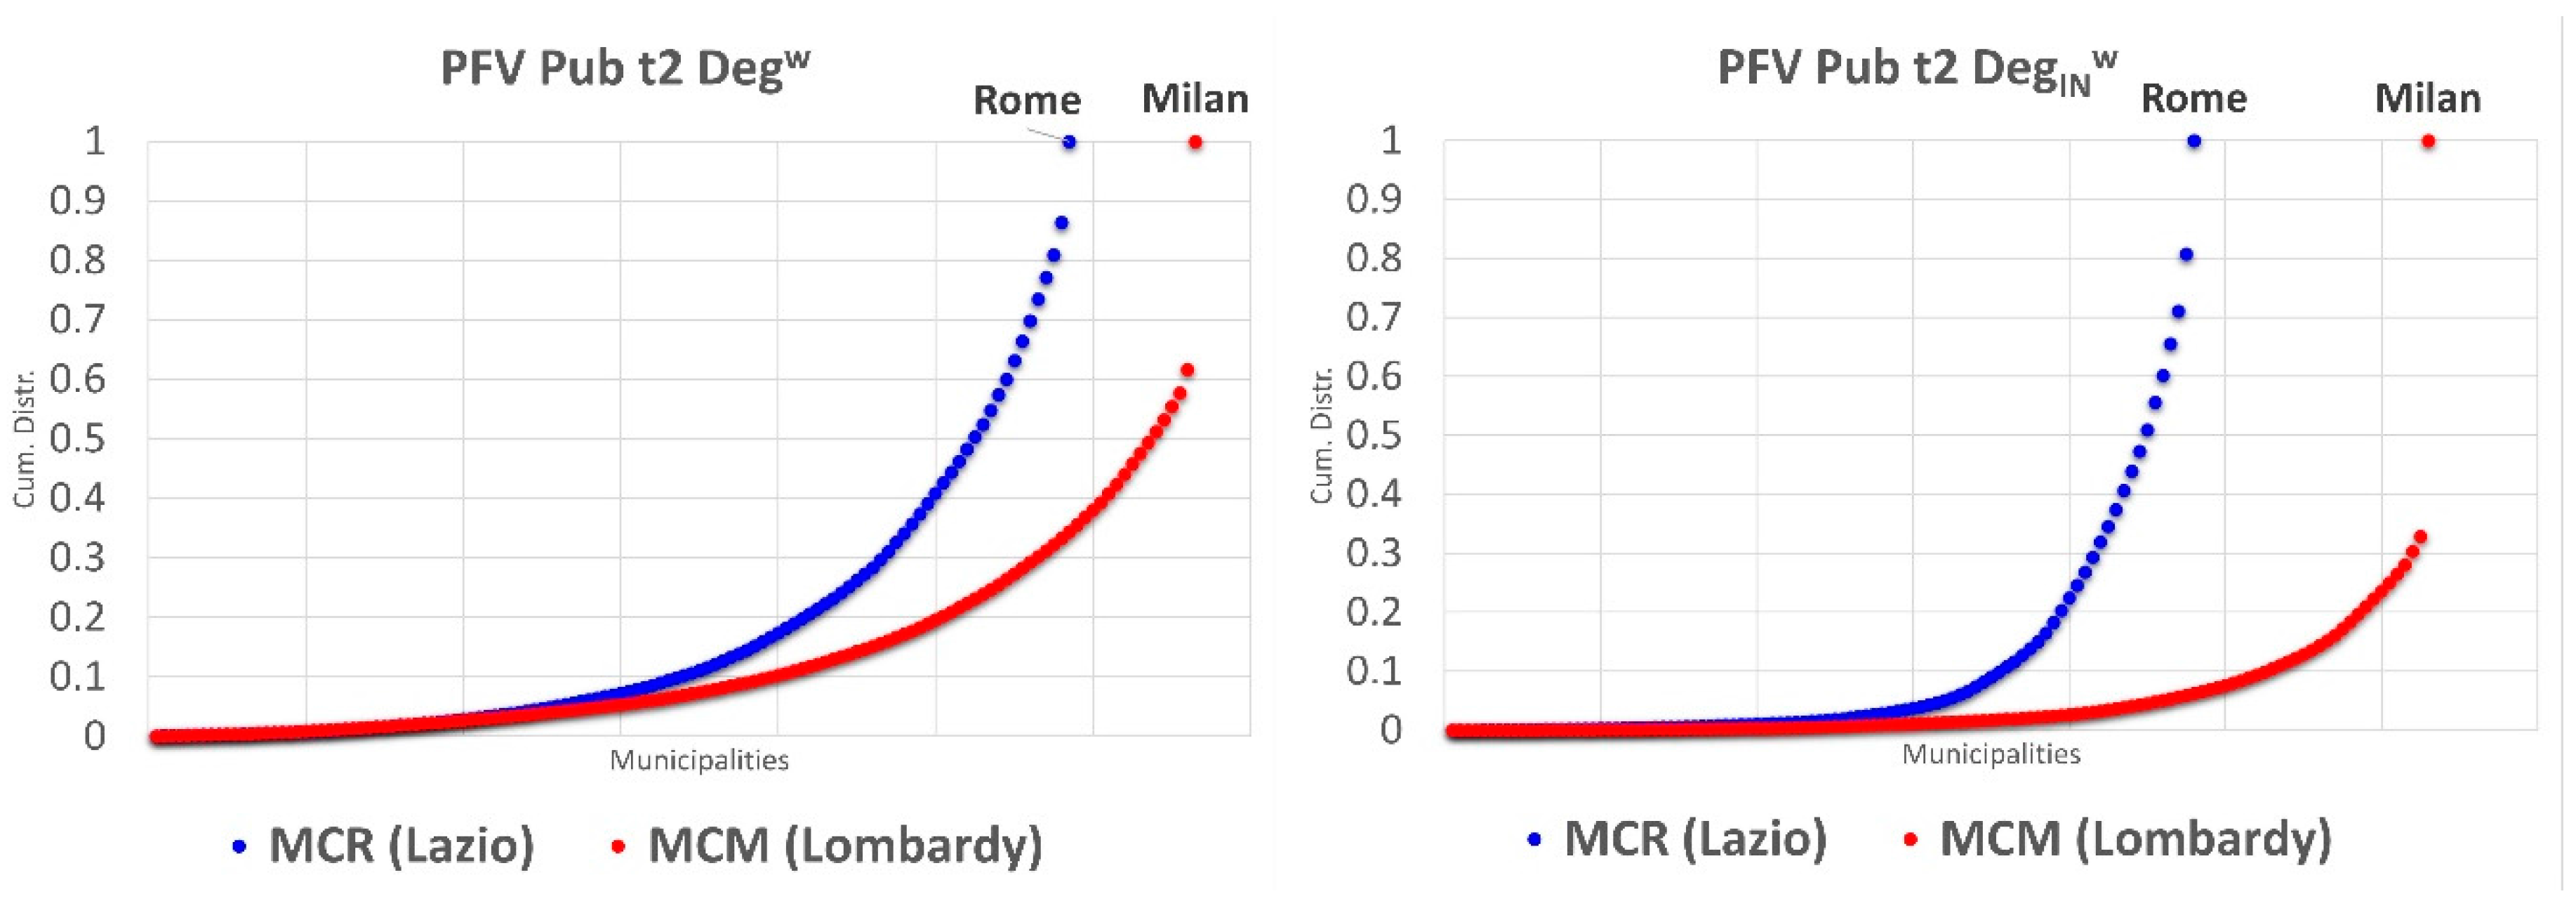
The cumulative distribution DegINw curve of MCM shows the presence of many other centers with high attractiveness. This trend is not present in the MCR where the cumulative distribution is much flatter along the horizontal axis.
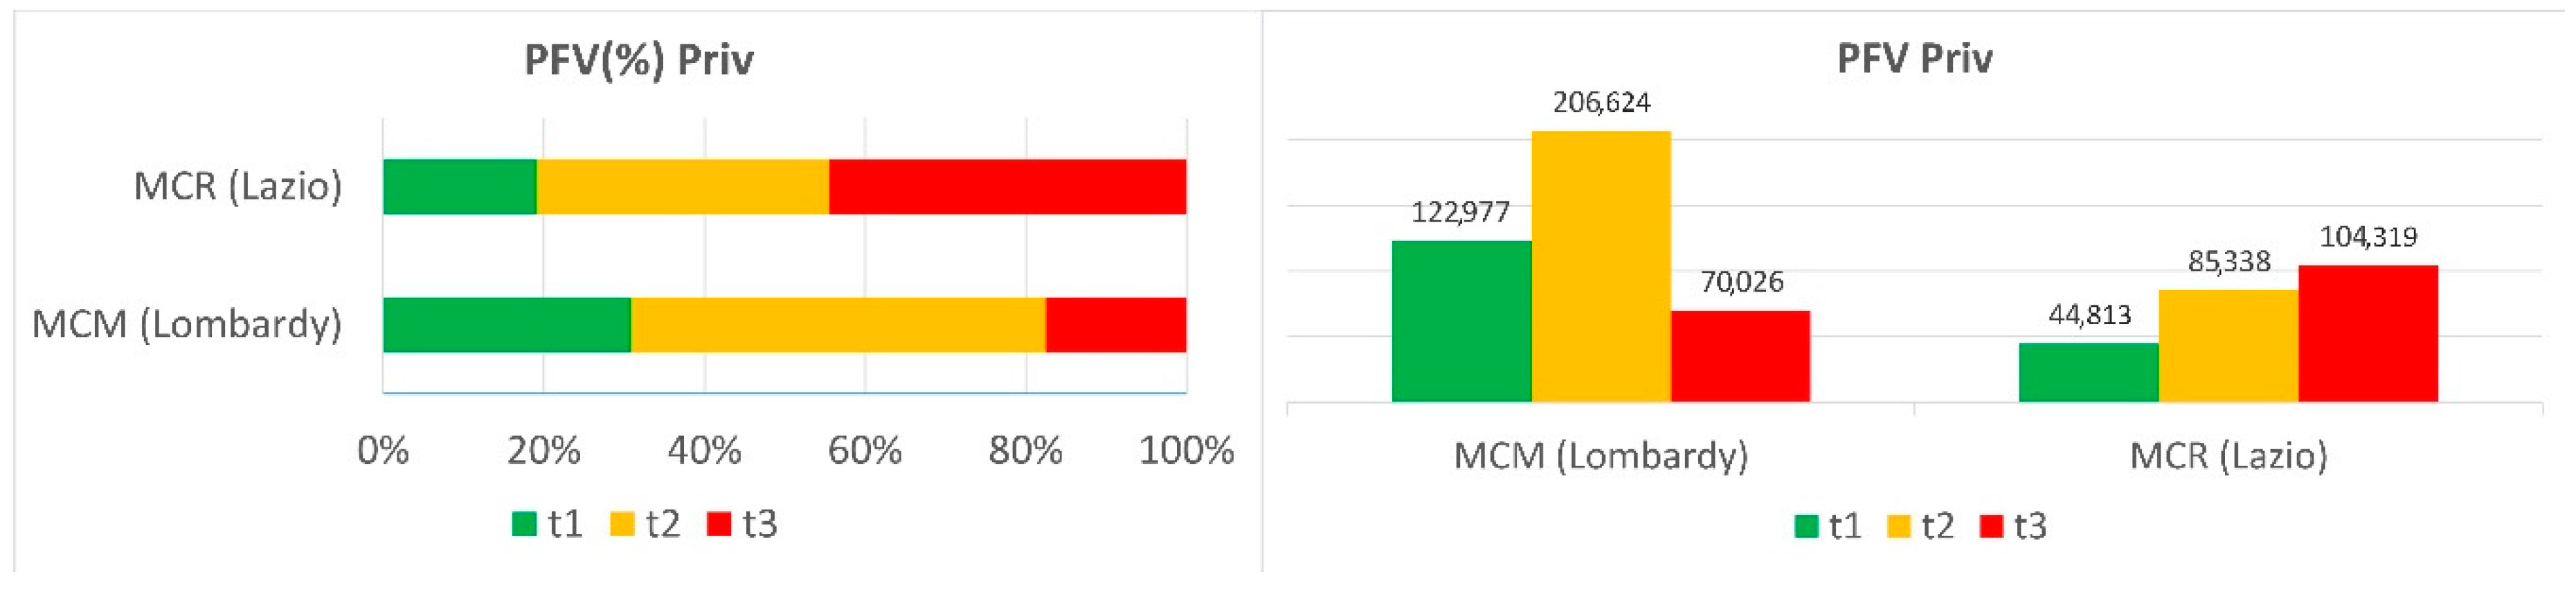
The analysis of the network according to transport modes and travel time shows numerous differences as well as some similarities between the two metropolitan morphologies. In particular, they are similar in respect to the use of private vehicles. This result is in line with a general national and international trend [73], which is partly explained by the diffusion of a new form of living and new of forms of settlement [74], but also by the lack of adequate policies, investments, and interventions [75,76,77]. However, the networks created and the weight (attraction capacity) of the two mother cities within their respective urban systems are very different.
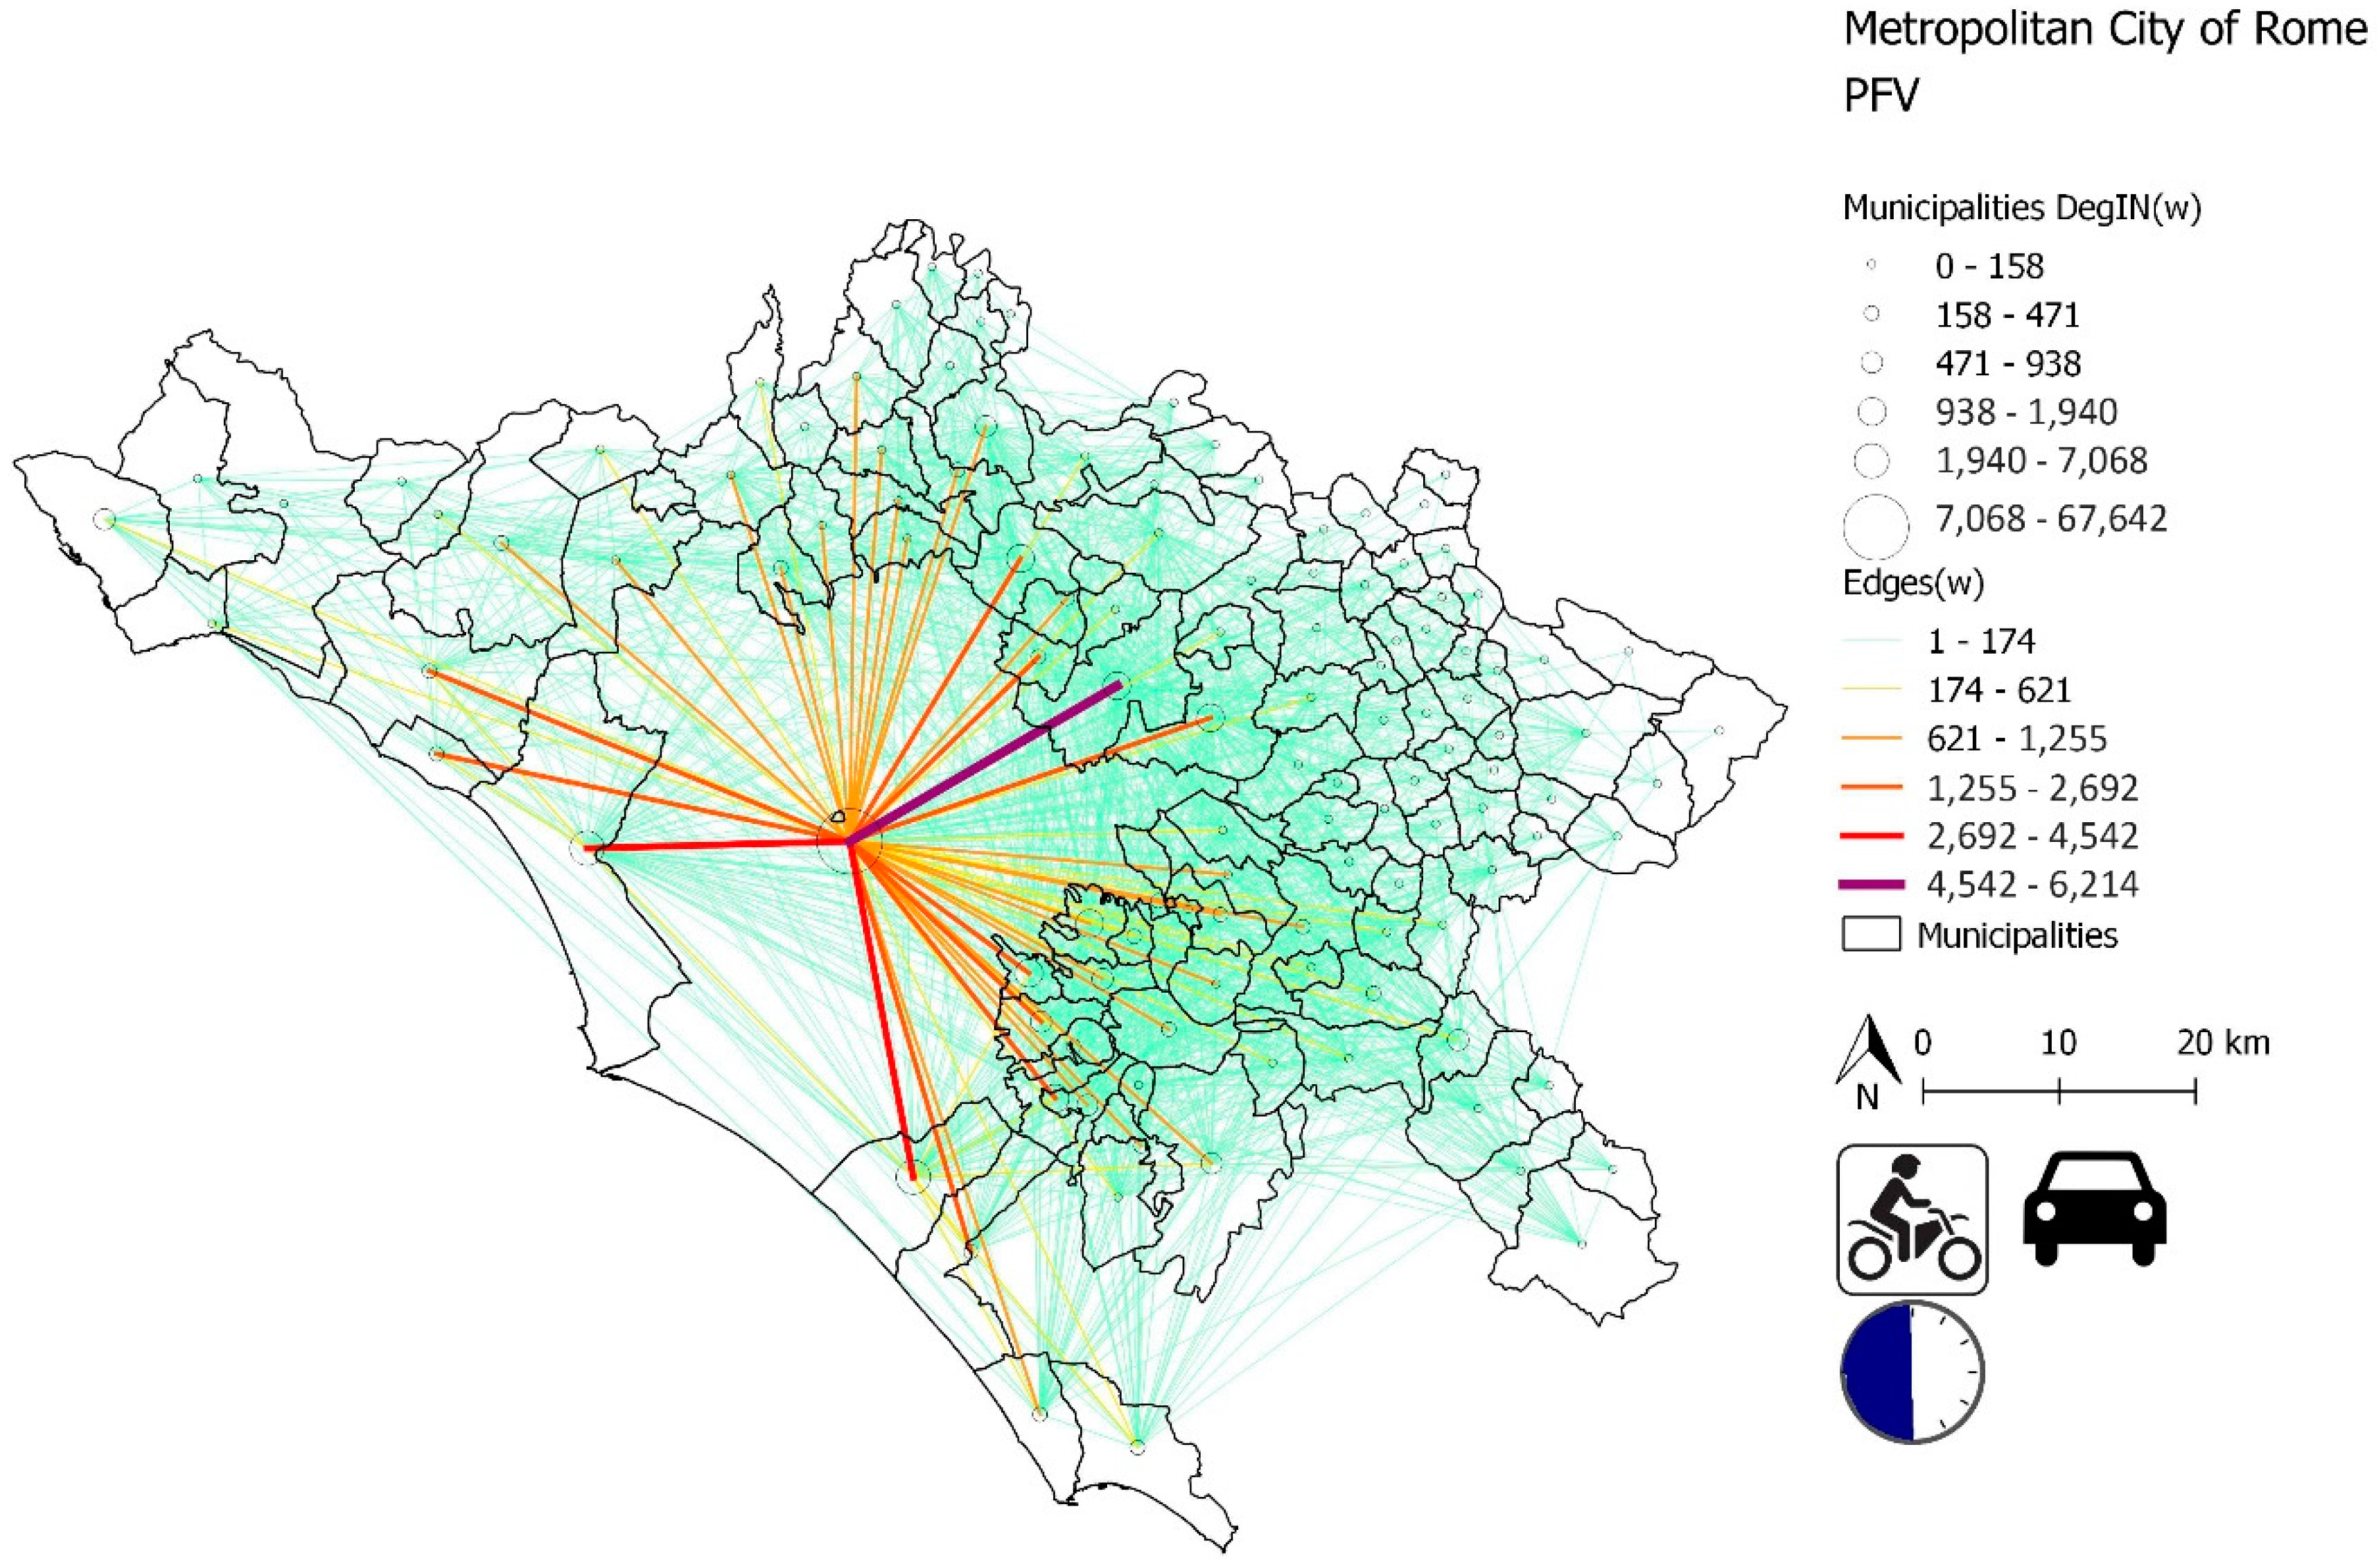
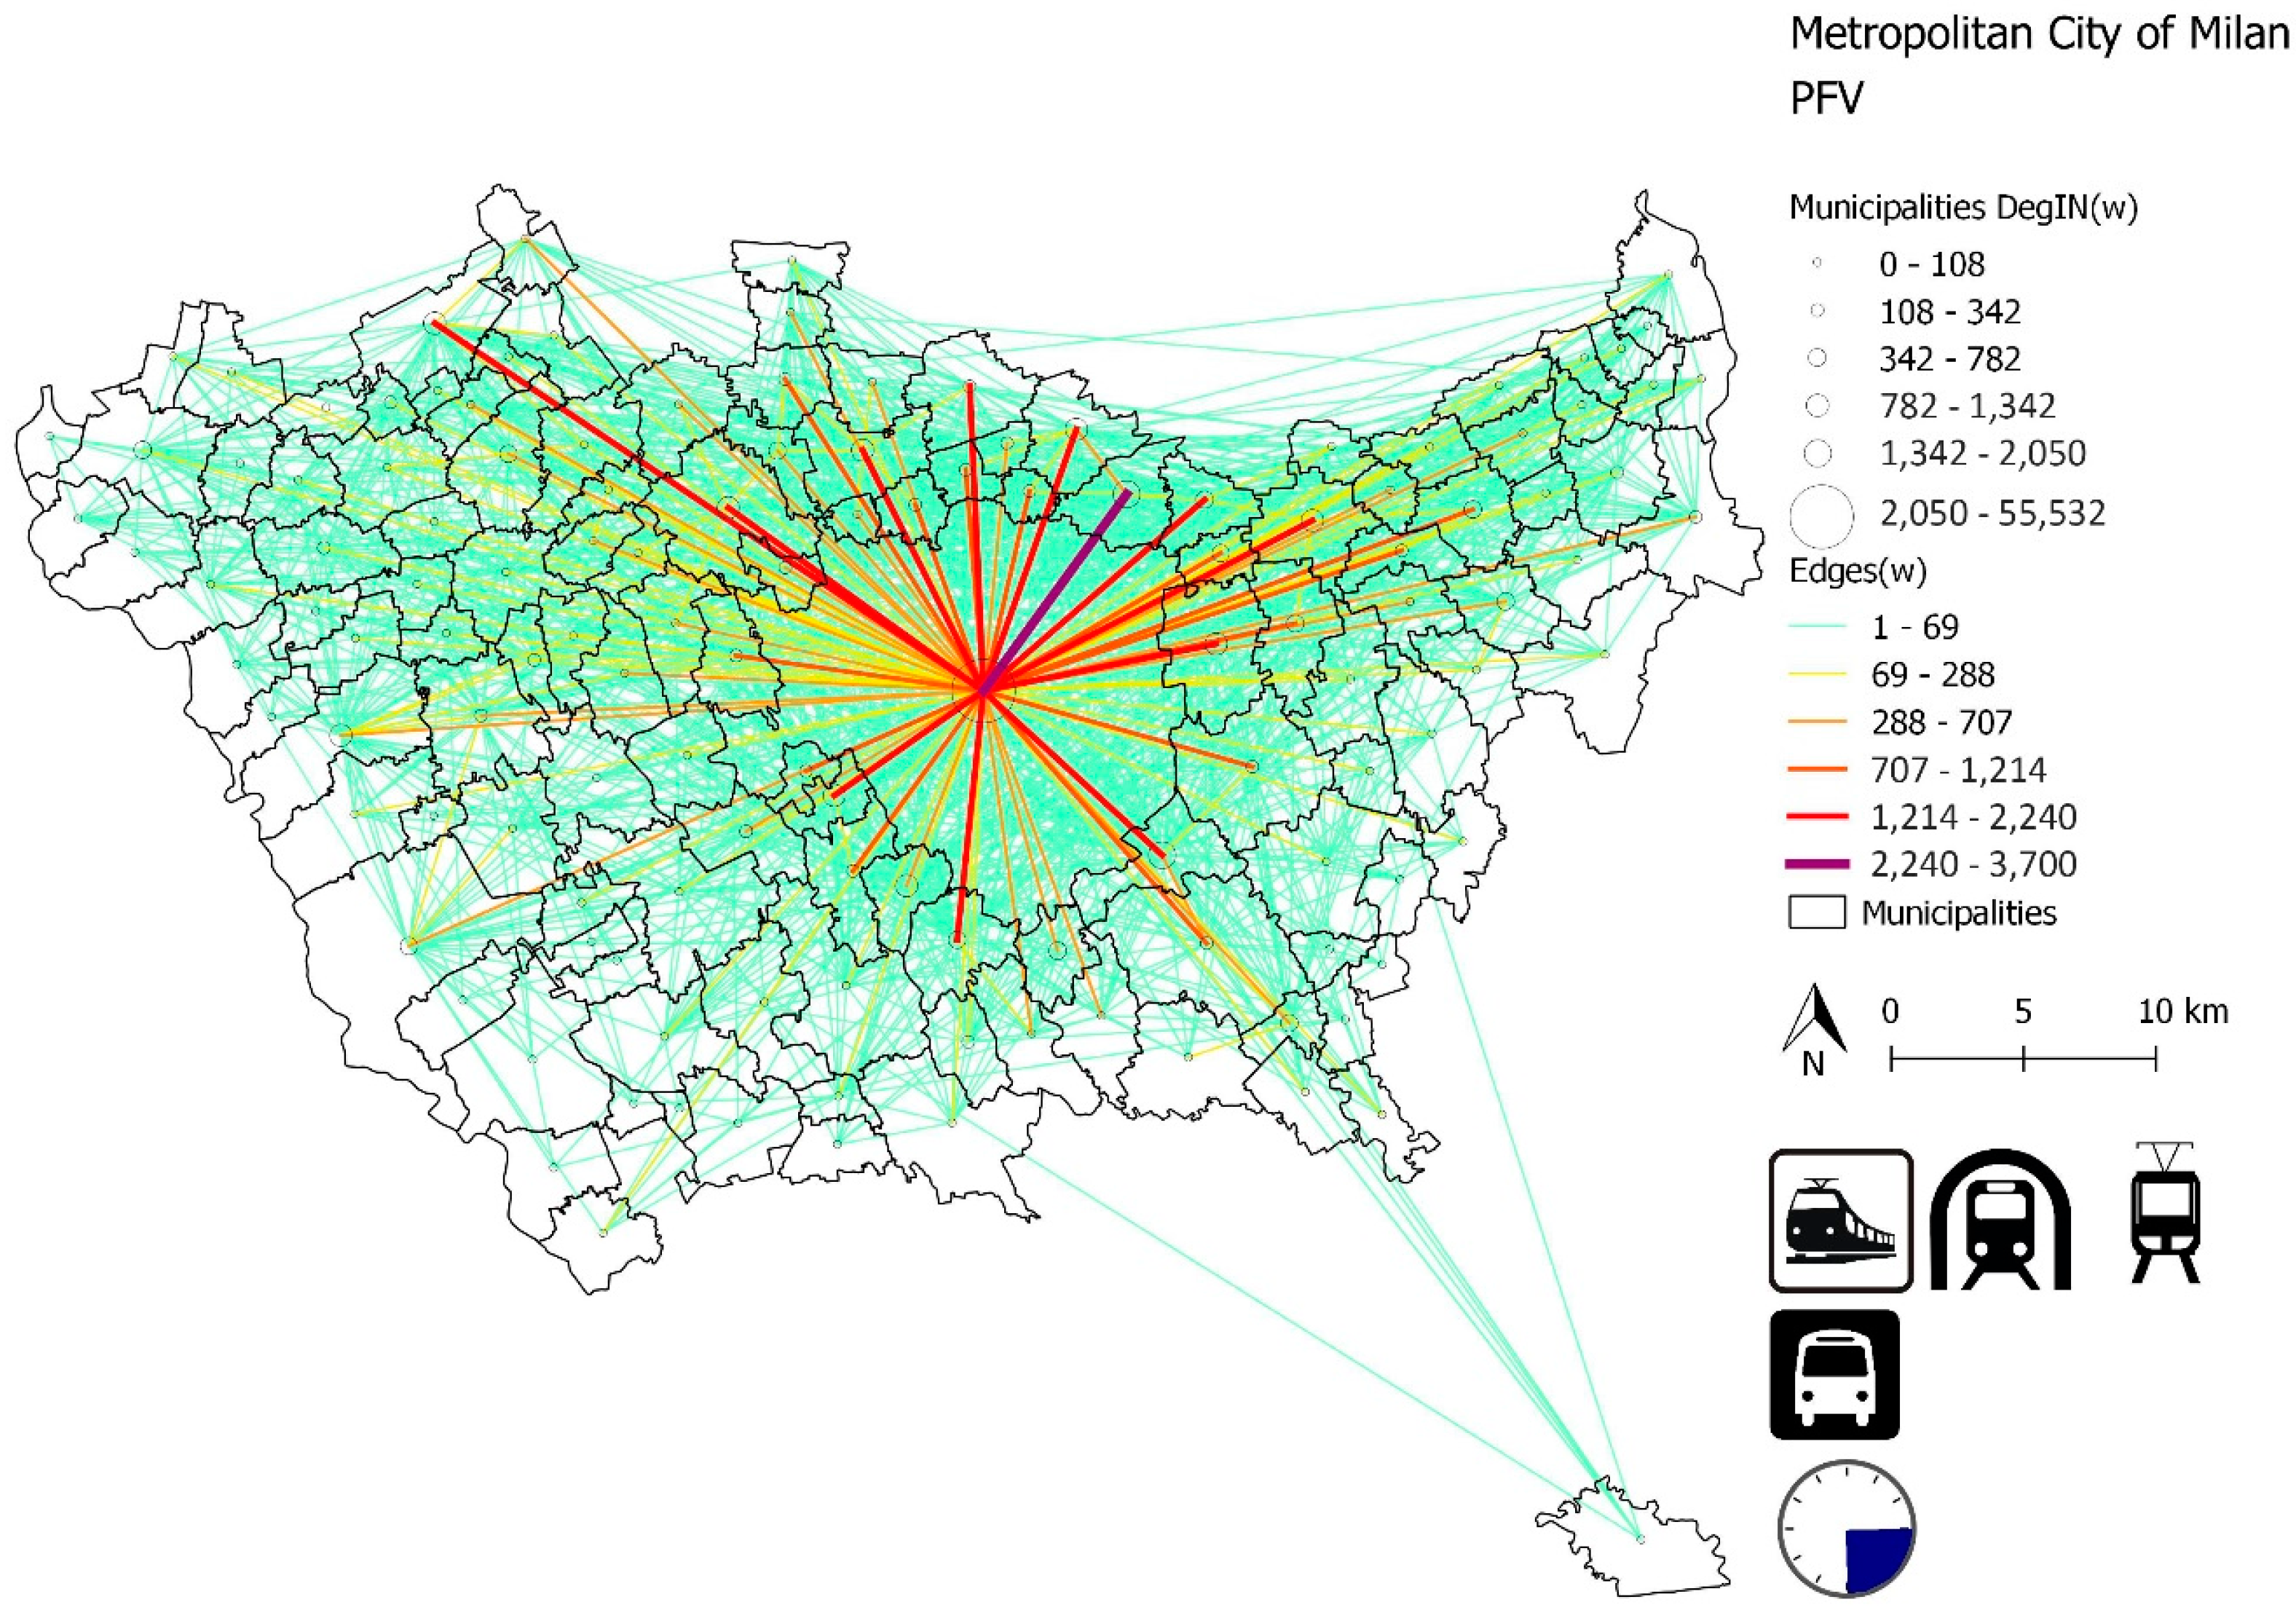
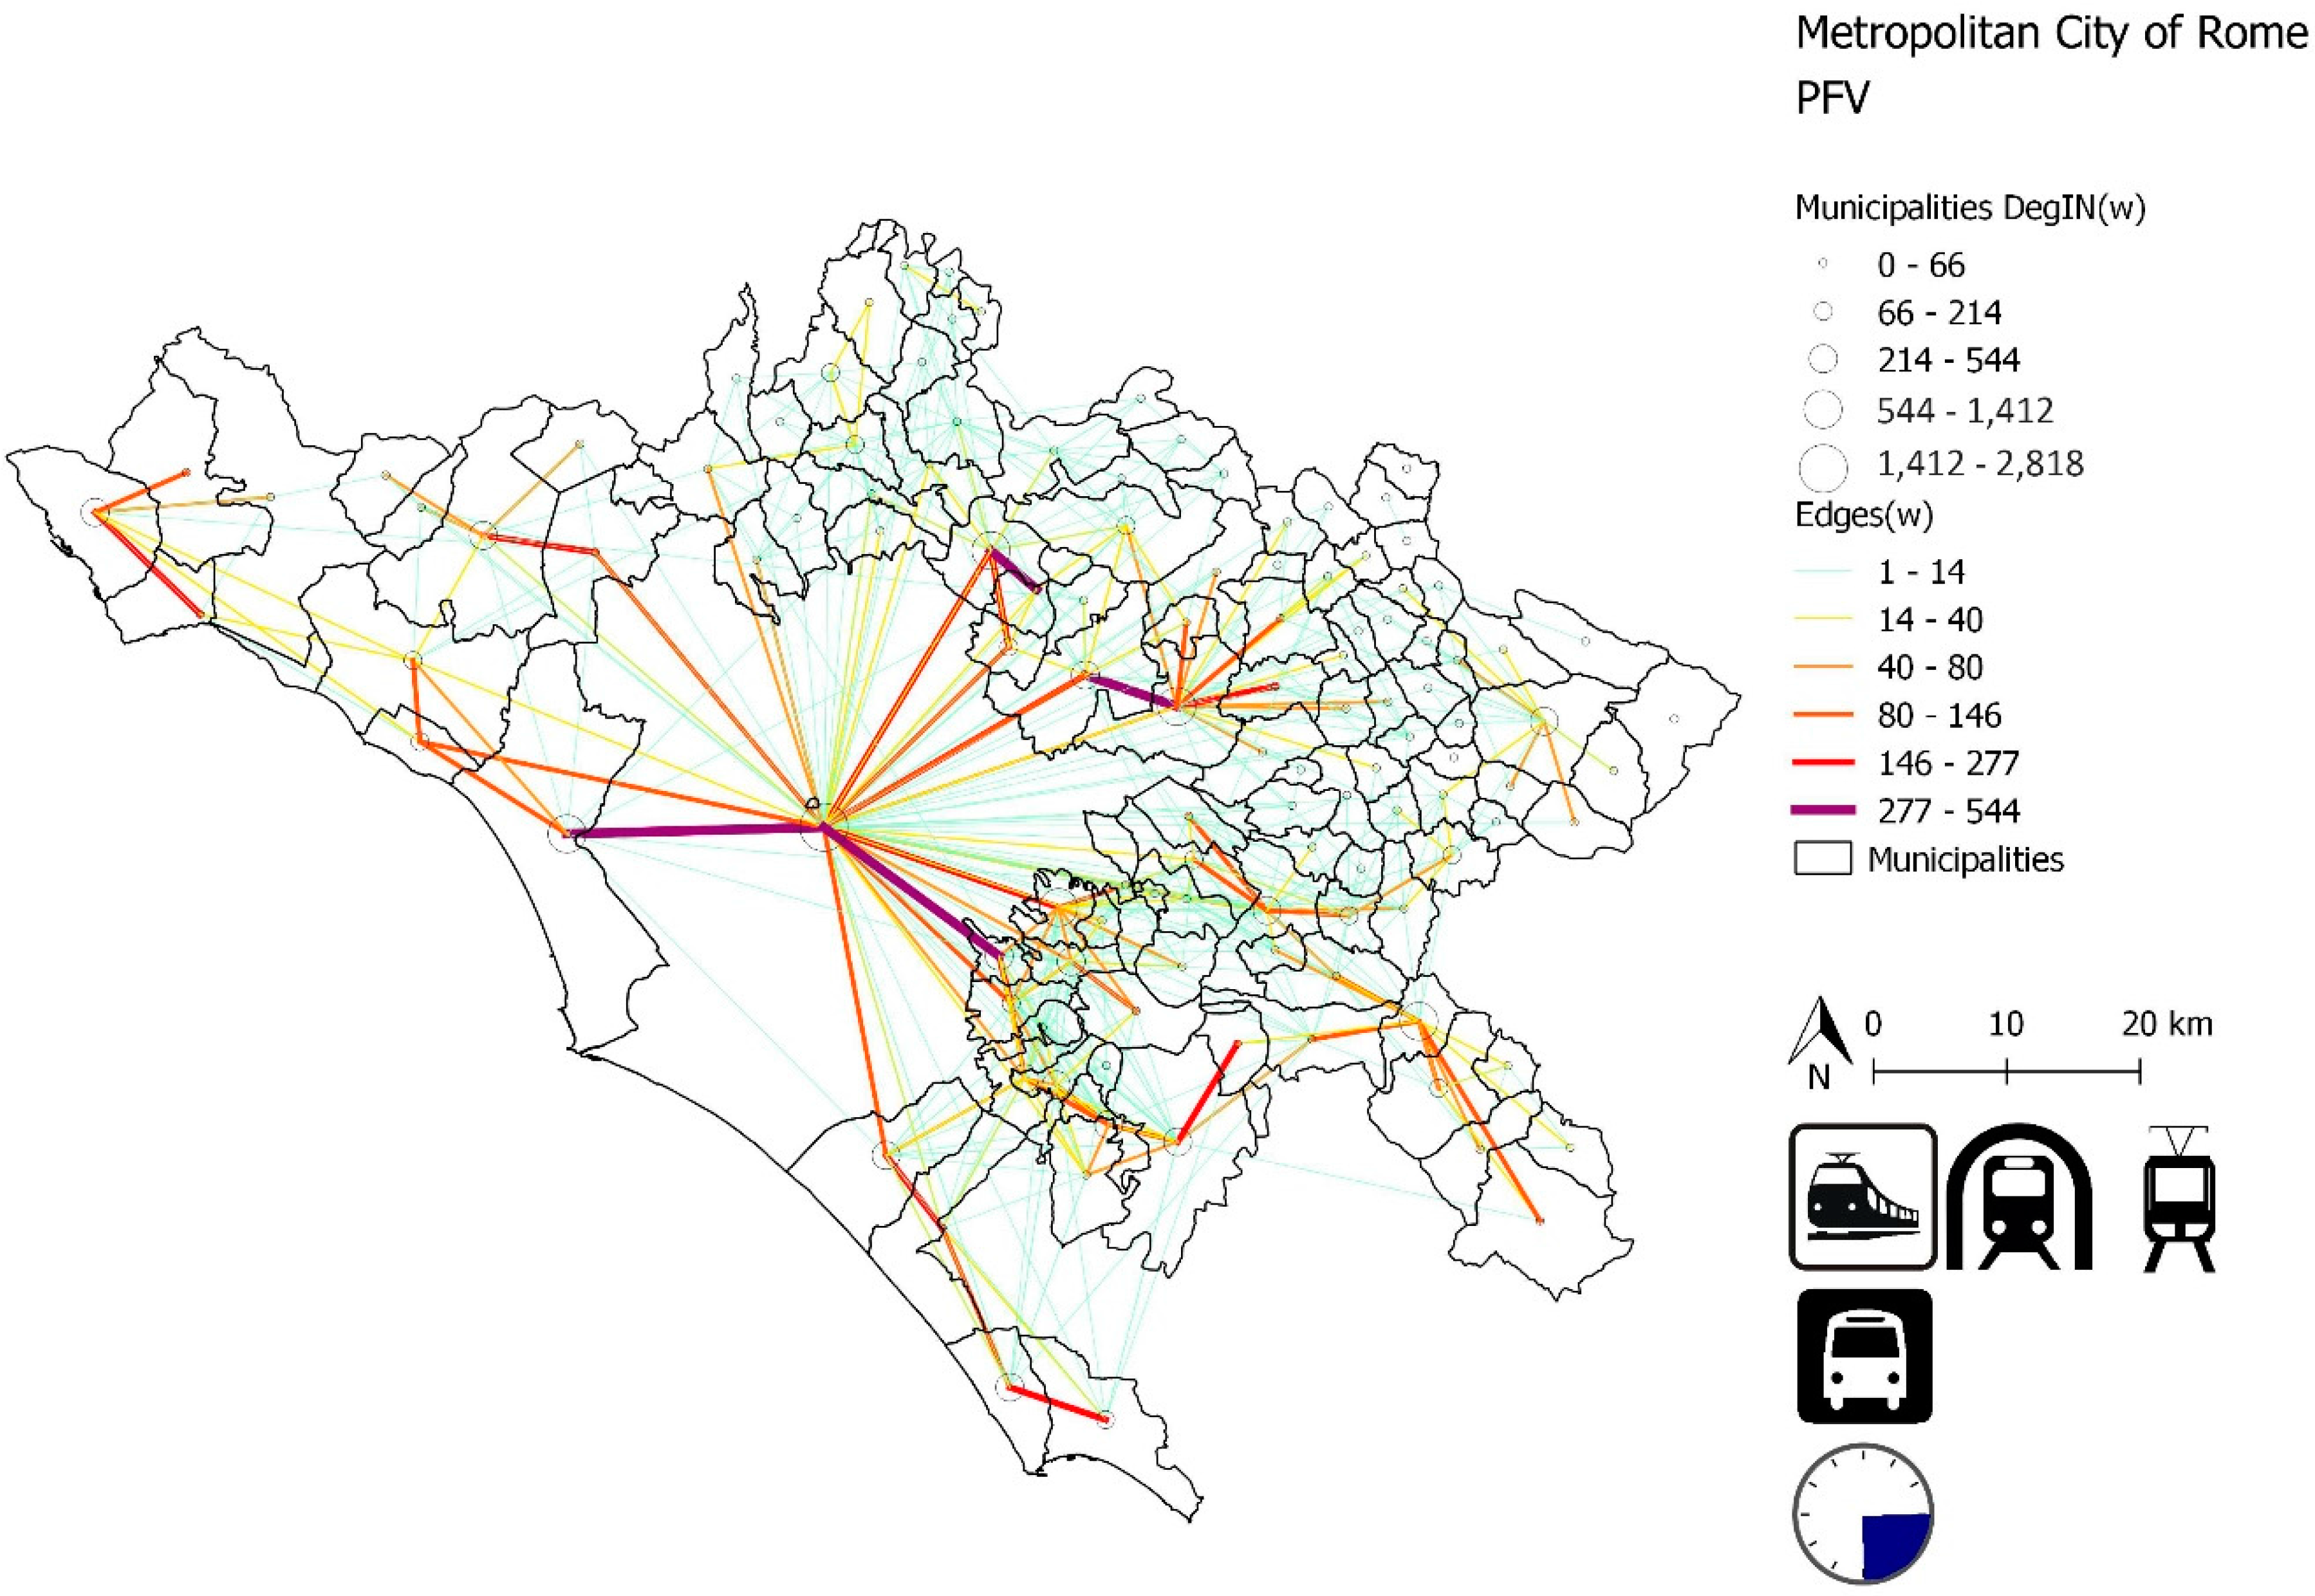
The hypothesis of MCR monocentrism vs. MCM polycentricism is also confirmed by the analysis at the metropolitan scale.
The strength of the city of Rome prevails sharply within its metropolitan city, dominating the incoming flows during the two periods (t2, 16 ÷ 30 min and t3, 31 ÷ 60 min), while in the MCM the strength exercised by Milan is limited by the attractiveness of other urban centers. Contrary to these results, we notice that an opposite trend was observed for the “t1” (0 ÷ 15 min) interval as Milan clearly dominates its territory. This result is consistent with that stream of the literature arguing that polycentric systems are characterised by a reduction of time spent on travelling [52], but in contrast with the other stream arguing that polycentricity does not seem to influence the time spent on travelling in significant way [29].
This result provides valuable insight into how variations in the intensity of a mother city’s attractiveness change not only in terms of transport modes but also in regard to the temporal variability considered. These changes can be reasonably assumed to be cyclical and similar over several days. Therefore, it seems reasonable to state that the metropolis “breathes” (somehow recall a person’s lungs dilating and contracting), that is, its strength is not static as it can increase and decrease.
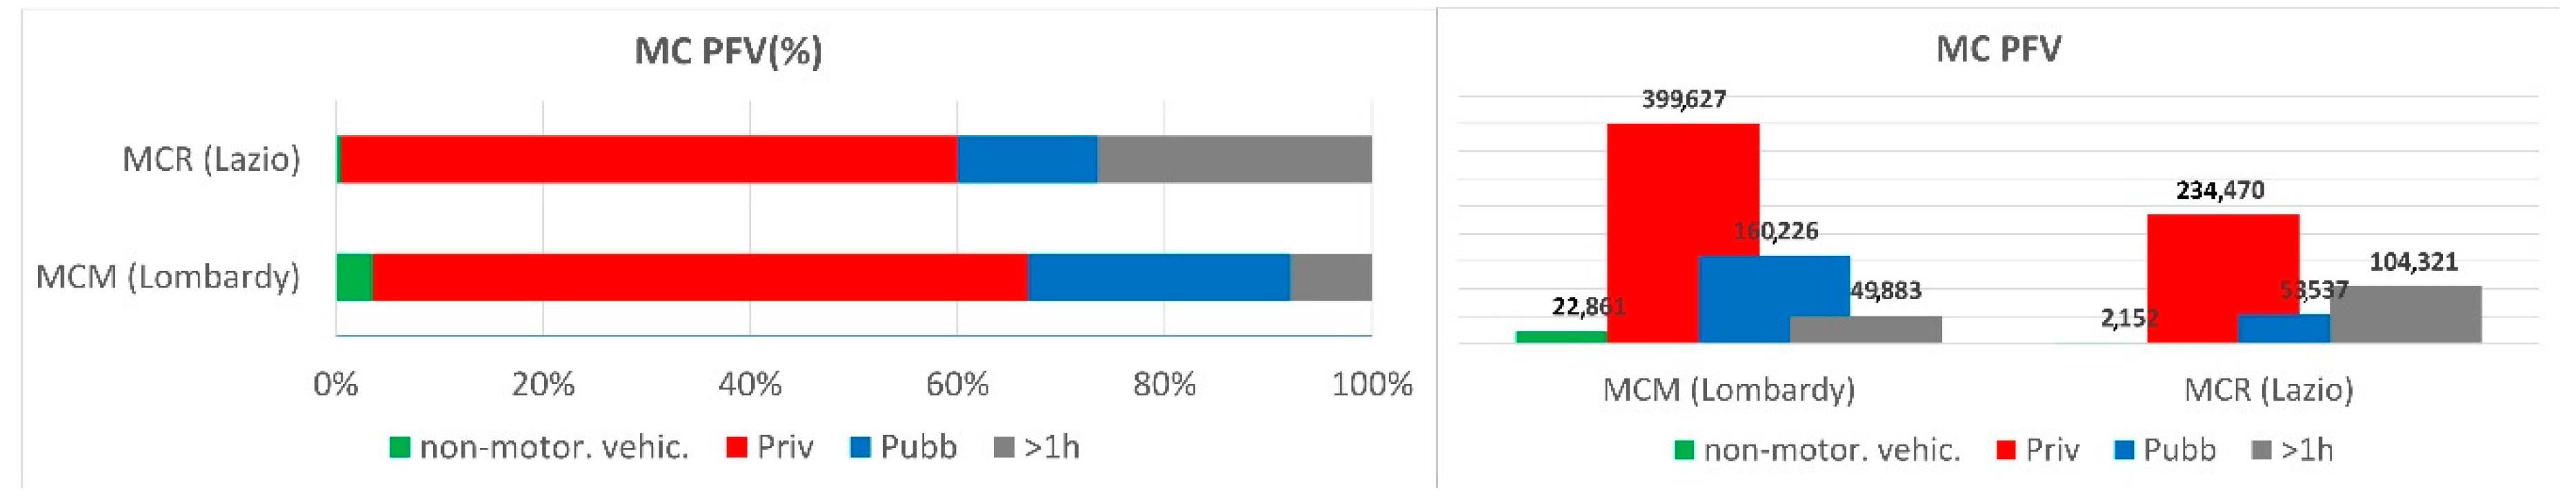
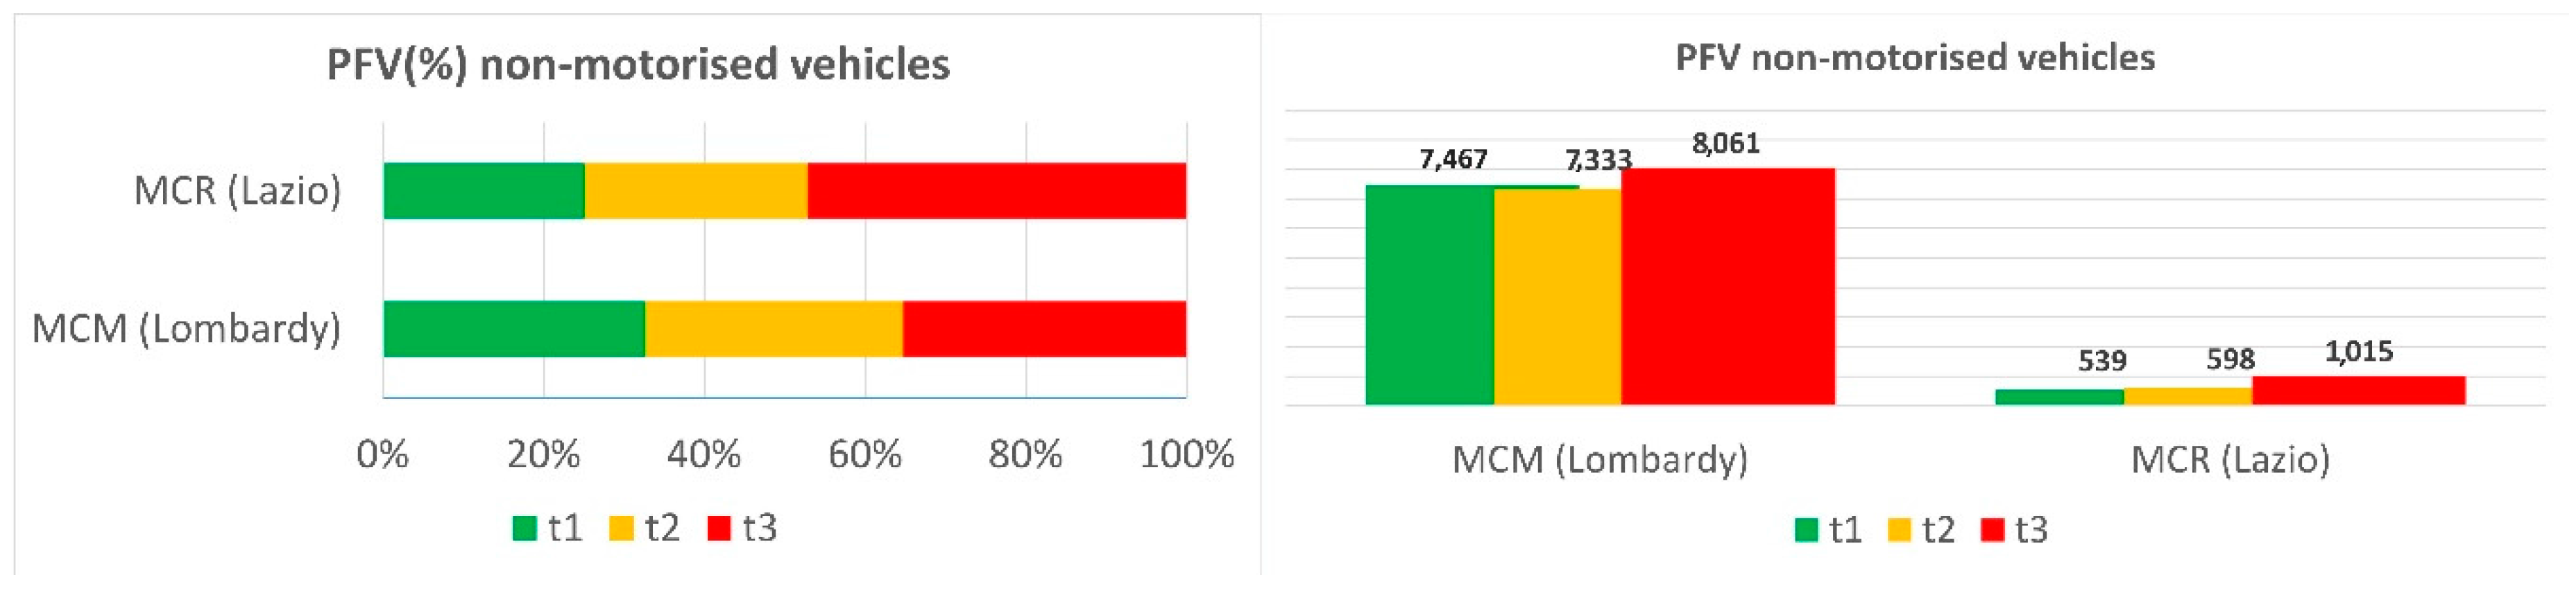
In both areas of analysis, the propensity toward non-motorized mobility appears limited in proportion to the total flow, even if it is higher in the MCM. This latter aspect confirms what some scholars have observed in different polycentric areas [
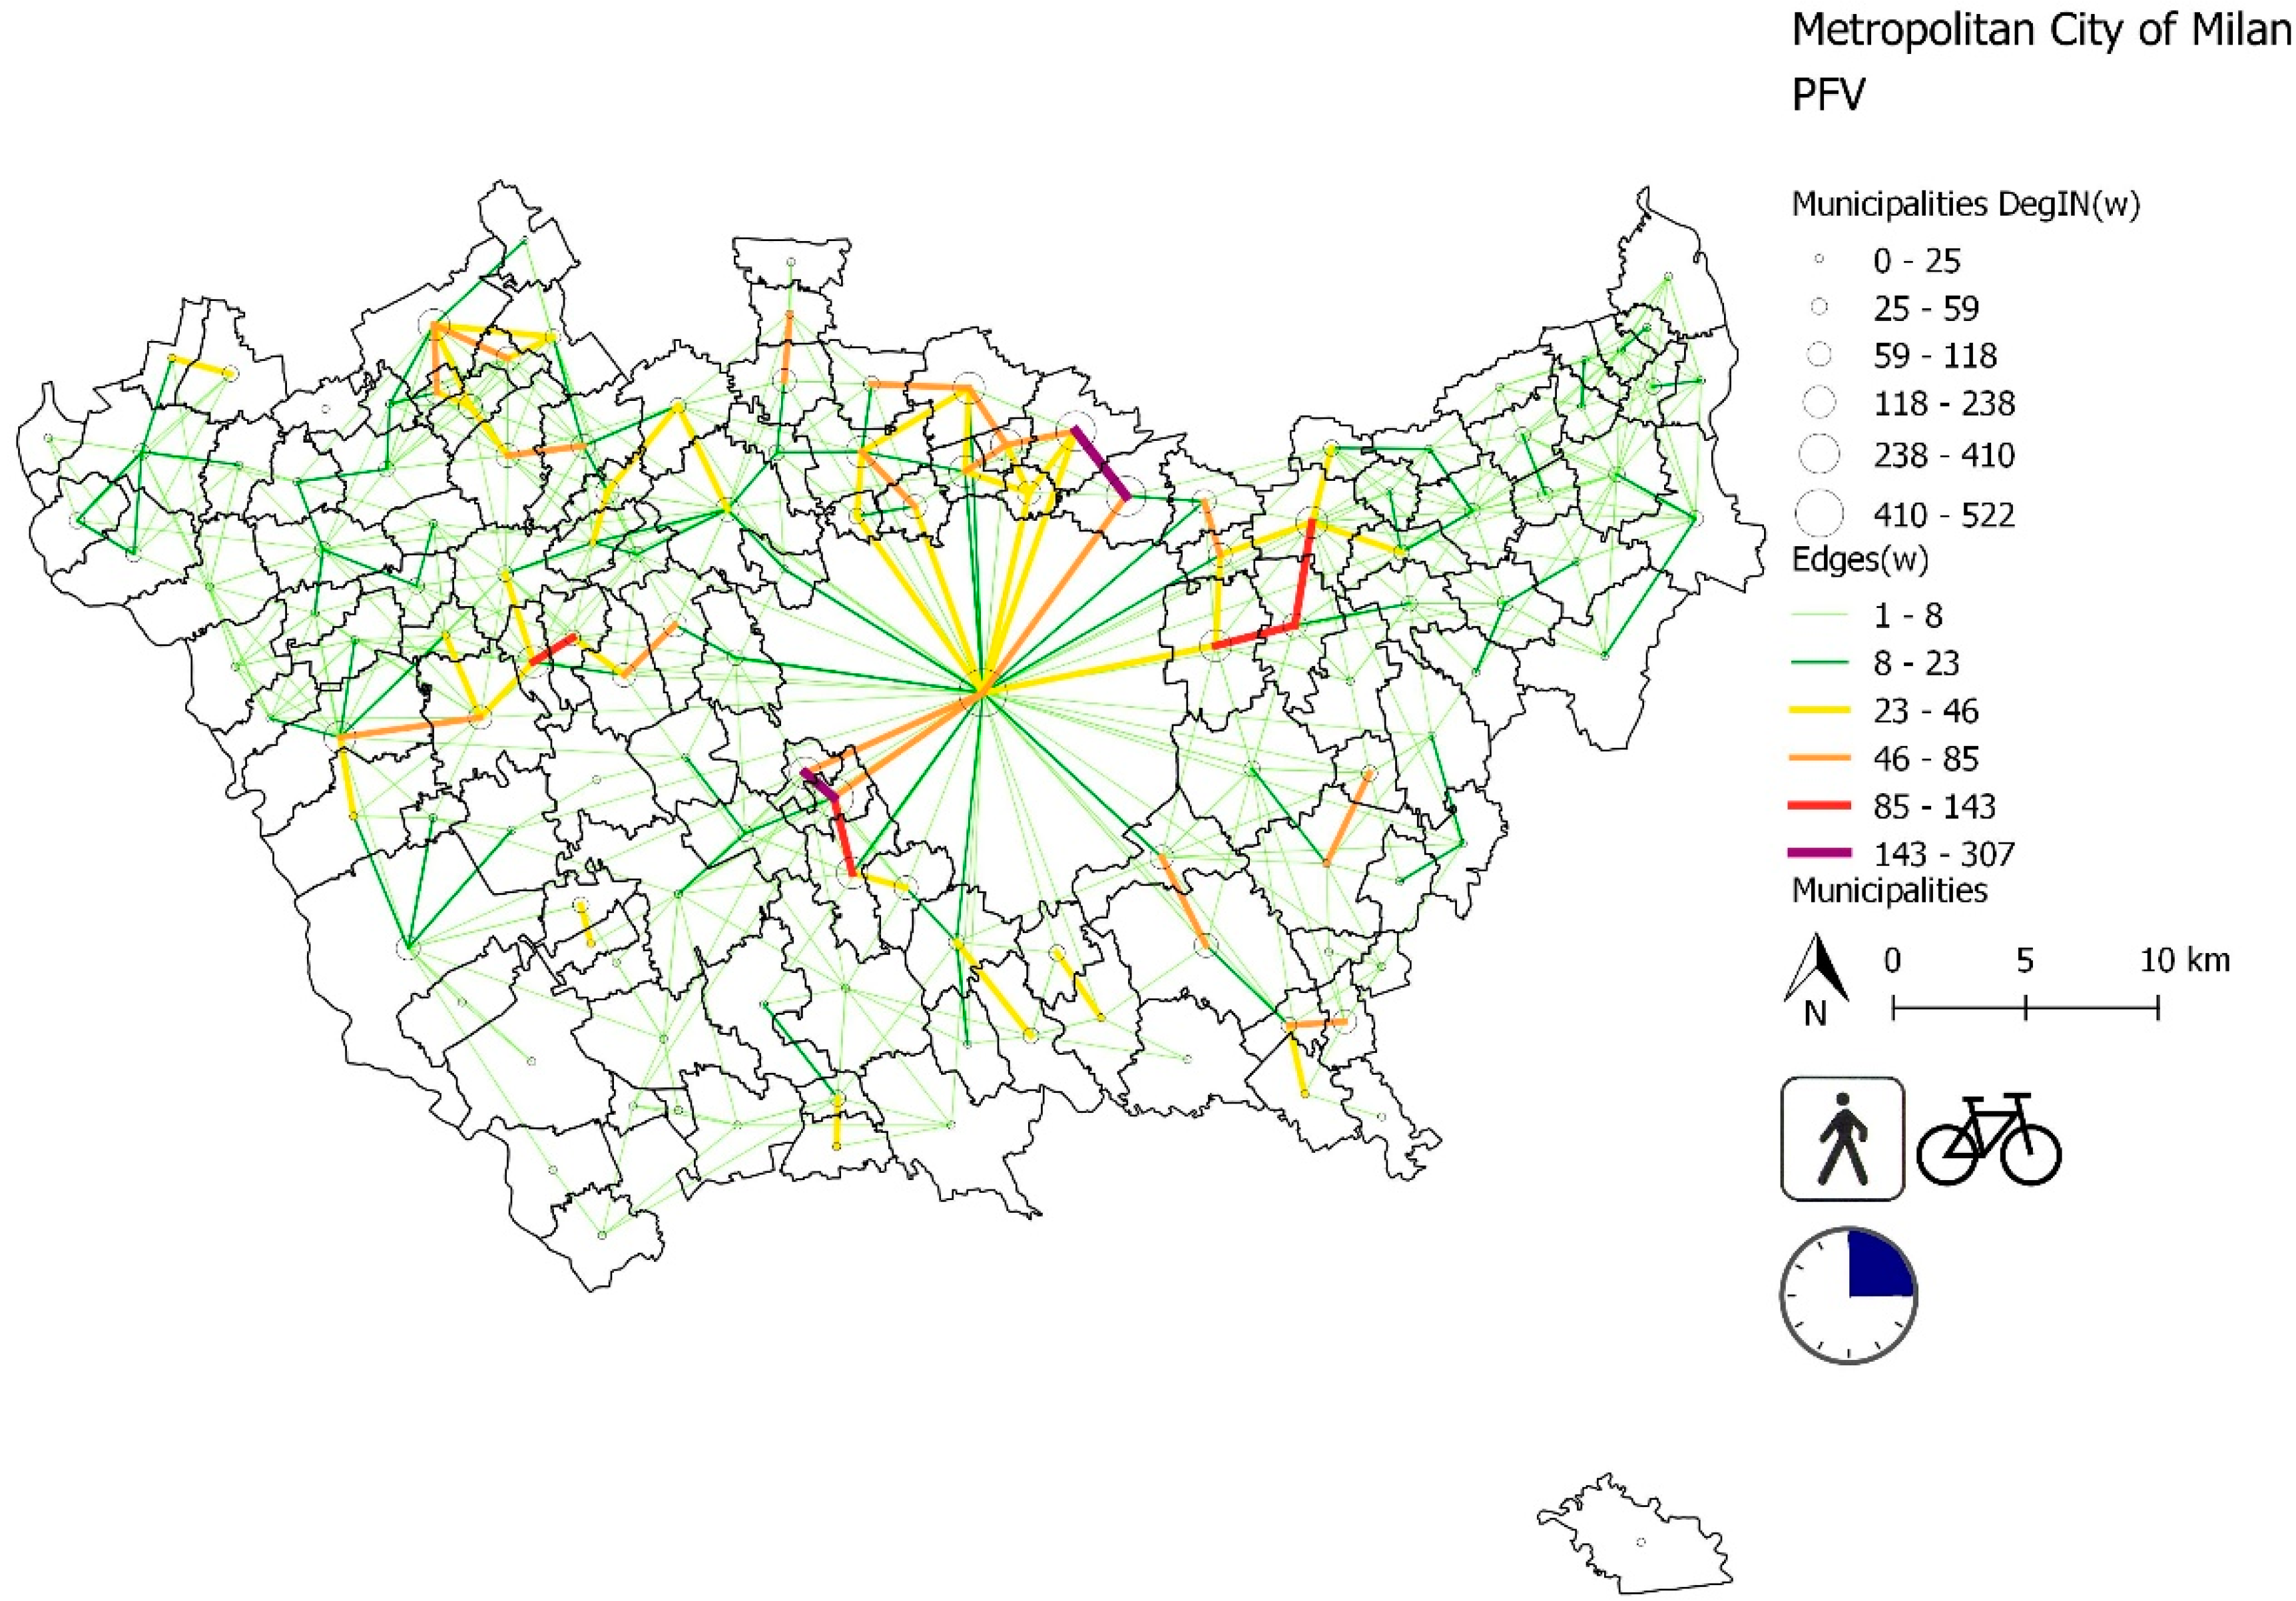
78], probably thanks to a minor distance travelled. Moreover, in the MCM it was observed that commuting flows preferring non-motorized mobility create a larger and more articulated reticular structure.
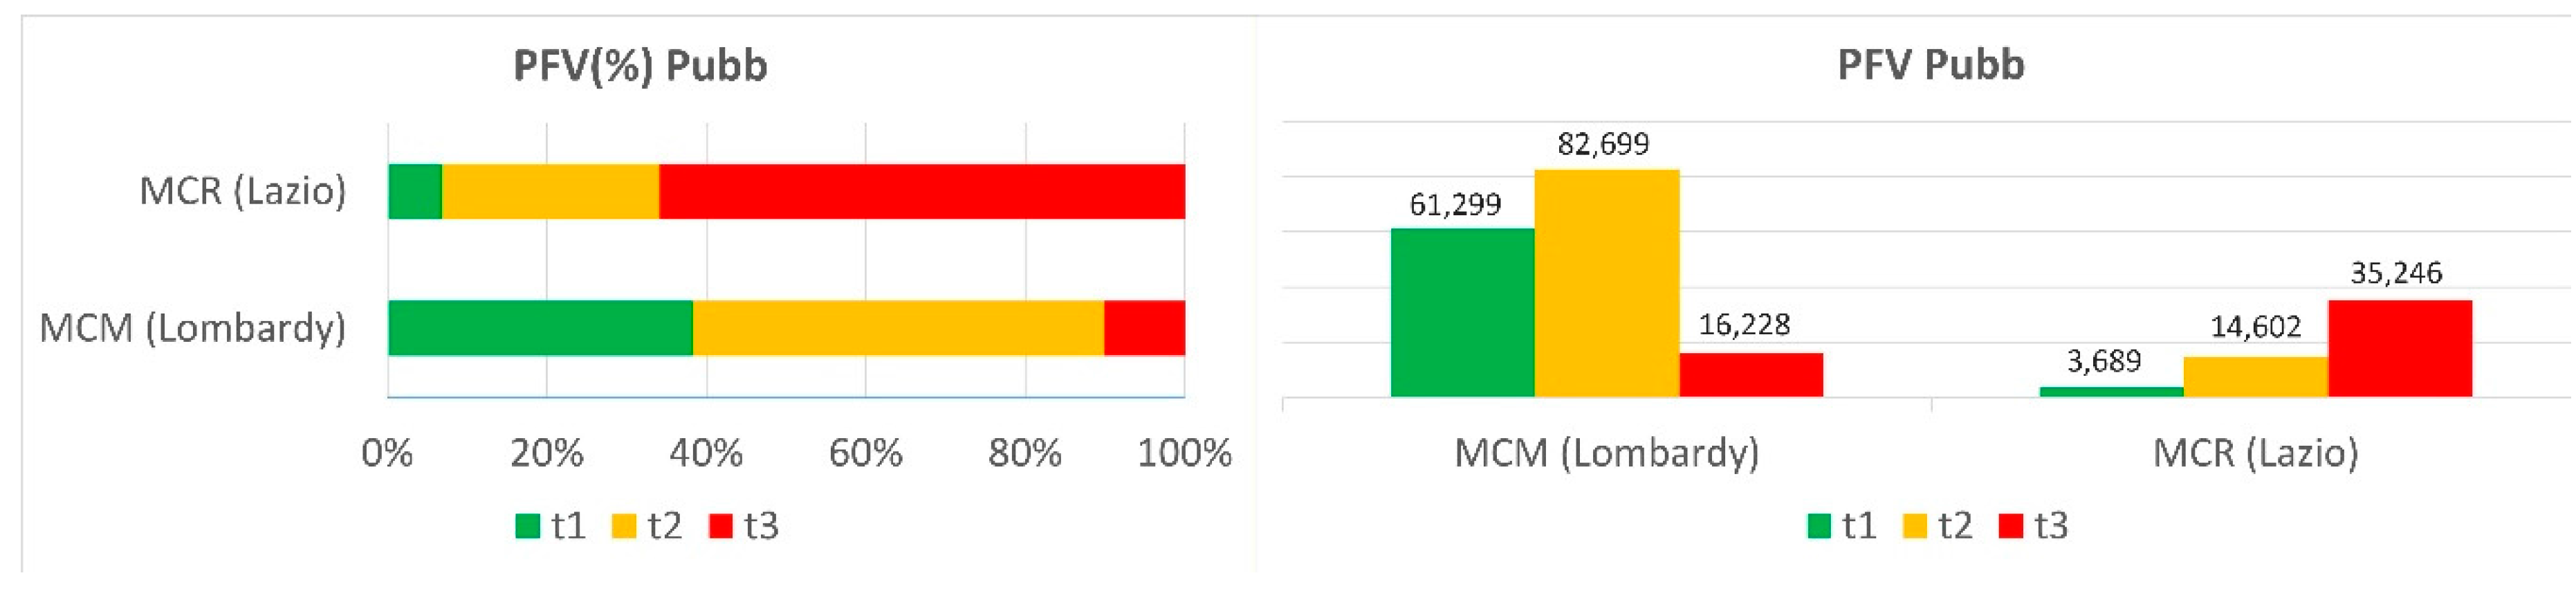
Regarding public transportation, the city of Milan emerges as a powerful attractor. In fact, it attracts almost 70% of metropolitan area DegINw of the “t2” travel time (16 ÷ 30 min).
The density and diameter measurements of the network indicate that this is more compact and dense in the MCM than in the MCR, yet it is essential to interpret these results bearing in mind the time lag of the peaks in the two metropolitan areas.
It is important to note that in the MCM the largest commuter flow occurs in the “t2” travel time (16 ÷ 30 min), whereas which it occurs in the “t3” (31 ÷ 60 min) in the MCR.
It should also be considered that a large number of Roman commuters, almost 25% of the total of all types of flows, take over an hour to reach their destination, while this is only the case for less than 10% of Milanese commuters.

5. Conclusions

In this work, we used graph theory to analyse the commuting flows in two Italian metropolitan areas with the aim to increase the knowledge about them as support for the future develop of transport planning. In particular, in this research, the directionality and intensity of commuter flows have been used to calculate the extent of influence of the metropolitan areas by identifying clusters through CDw and identifying portions (Community) of network, in which the relationships between nodes are maximum and at the same time minimal with nodes of other portions of the network.
The study demonstrated the validity and potentiality of using graph theory for understanding the growing complexity and dominant dynamics that draw contemporary metropolitan landscapes. As already observed in other European and non-European cities [19,79], the metropolitan areas and the large regional systems analysed in this study show an accumulation of resources in mother cities and an important commuter flow that has to travel daily to reach services or workplaces. In line with previous research the analysis describes the ability attraction of cities on the surrounding territories. However, the research results show significant differences between the phenomena that are considered.
We identified the territorial basins of each large urban center, to determine the differences in the behaviour and articulation of flows within the two regional systems. In particular, the analysis highlighted the differences in the morphology and attractiveness of the mother cities of the two metropolitan systems bearing transportation modes and travel times in mind.
This study also highlighted how the modulation of this strength changes, stretching and contracting, over different periods of time. The need to reduce air pollution and damage to the environment and public health and to improve the quality of life, travel and social equity has placed sustainable accessibility and mobility in first position in the most recent policies, both at the national (PON 2014–2020, Strategic Plan for Metropolitan Cities) and European levels (European Policy Agenda, EU Transport White Paper 2001, Urban Mobility Package 2013). In this sense, the future of the sustainability of the metropolises strictly depends on an understanding of the complexity of the phenomenon, to which this study contributes.
Flows analysis is therefore an essential instrument for interpreting territorial models and can be used to foresee present and future settlement processes. The ability to develop investigation tools and methods capable of effectively analysing and measuring problems, dynamics, and changes with regard to mobility becomes strategic.
The findings of our work many have a role in transport planning and in the evaluation of policy aimed to favour more sustainable mobility in the studied areas. In fact, our analysis provides detailed measurements of commuting networks in the MCs of Rome and Milan. Having a solid knowledge of these it is indispensable for the individuation of critical points, goal planning, and prioritising of projects, as well as policies ex post evaluation. Obviously, to do this we need to analyse other aspects and other census variables. The next step might be gaining a deeper understanding of the human motivations and processes behind the patterns identified.
Among others, future research should focus on the following:
  • analysing the offer (infrastructure and mobility systems, hardware and software for urban displacement) and interdependencies—feedback reports with demand. It is evident that the offer in terms of the existing infrastructure network and transport lines influence the flow of traffic; and,
  • identifying concentration flows (and therefore people, means, resources) for prioritising interventions by favouring the use of non-motorized mobility and green transport modes. This is an objective that requires both an assessment of the possibility of creating a network of sustainable capillary connections (pedestrian cycle paths) that can direct the flows towards the public transport network (preferably train) and discourage the use of private vehicles.

Author Contributions

Amedeo Ganciu conceived the work and analyzed the data; Mara Balestrieri designed the paper; both wrote parts in every section; Cristina Imbroglini and Fabrizio Toppetti contributed to collect data.

Conflicts of Interest

The authors declare no conflict of interest.

References

  1. World Commission on Environment and Development (WCED). Our Common Future; Oxford University Press: Oxford, UK, 1987. [Google Scholar]
  2. Huang, L.; Wu, J.; Yan, L. Defining and measuring urban sustainability: A review of indicators. Landsc. Ecol. 2015, 30, 1175–1193. [Google Scholar] [CrossRef]
  3. United Nations Human Settlements Programme (UNHSP). World Cities Report; UNHSP: Nairobi, Kenya, 2016; Available online: http://wcr.unhabitat.org (accessed on 27 November 2017).
  4. Wu, J.; Xiang, W.N.; Zhao, J. Urban ecology in China: Historical developments and future directions. Landsc. Urban Plan. 2014, 125, 222–233. [Google Scholar] [CrossRef]
  5. Batty, M. When all the world’s a city. Environ. Plan. A 2011, 43, 765–772. [Google Scholar] [CrossRef]
  6. Eurostath. Available online: http://ec.europa.eu/eurostat/statistics-explained/index.php (accessed on 22 November 2017).
  7. Ehlers, E.; Krafft, T. Understanding the Earth System-From Global Change Research to Earth System Science. In Understanding the Earth System; Springer: New York, NY, USA; London, UK; Berlin, Germany, 2001; pp. 3–16. [Google Scholar]
  8. Goudie, A.S. The Human Impact on the Natural Environment: Past, Present, and Future; John Wiley & Sons: London, UK, 2013; ISBN 978-1118576588. [Google Scholar]
  9. Bourdeau-Lepage, L.; Huriot, J.M. Megacities vs Global Cities. In Development and Institutions. ERSA Conference Papers; European Regional Science Association: Louvain-la-Neuve, Belgium, 2006; Available online: http://www-sre.wu.ac.at/ersa/ersaconfs/ersa06/papers/894.pdf (accessed on 15 December 2017).
  10. Sohn, J. Are commuting patterns a good indicator of urban spatial structure? J. Transp. Geogr. 2005, 13, 306–317. [Google Scholar] [CrossRef]
  11. Horner, M.W. Spatial Dimensions of Urban Commuting: A Review of Major Issues and Their Implications for Future Geographic Research. Prof. Geogr. 2004, 56, 160–173. [Google Scholar] [CrossRef]
  12. Münter, A.; Volgmann, K. The metropolization and regionalization of the knowledge economy in the multi-core Rhine-Ruhr metropolitan region. Eur. Plan. Stud. 2014, 22, 2542–2560. [Google Scholar] [CrossRef]
  13. Ravetz, A. Remaking Cities (Routledge Revivals): Contradictions of the Recent Urban; Routledge Revivals: New York, NY, USA, 2013; ISBN 0415855950. [Google Scholar]
  14. Scott, A.J.; Storper, M. The Nature of Cities: The Scope and Limits of Urban Theory. Int. J. Urban Reg. Res. 2015, 39, 1–15. [Google Scholar] [CrossRef] [Green Version]
  15. Batty, M. Cities and Complexity; The MIT Press: Cambridge, MA, USA, 2005; ISBN 978-0262524797. [Google Scholar]
  16. Sen, A.; Smith, T. Gravity Models of Spatial Interaction Behavior; Springer: New York, NY, USA; London, UK; Berlin, Germany, 2012; ISBN 3642798802. [Google Scholar]
  17. Fujita, M.; Thisse, J.F. Economics of Agglomeration: Cities, Industrial Location, and Globalization; Cambridge University Press: Cambridge, UK, 2013; ISBN 0521171962. [Google Scholar]
  18. Duranton, G. Delineating metropolitan areas: Measuring spatial labor market networks through commuting patterns. In The Economics of Interfirm Networks; Watanabe, T., Uesugi, I., Ono, A., Eds.; Springer: New York, NY, USA; London, UK; Berlin, Germany, 2015; pp. 107–133. [Google Scholar]
  19. Vasanen, A. Functional Polycentricity: Examining Metropolitan Spatial Structure through the Connectivity of Urban Sub-centres. Urban Stud. 2012, 49, 3627–3644. [Google Scholar] [CrossRef]
  20. Zong, C.; Schläpfer, M.; Müller Arisona, S.; Batty, M.; Ratti, C.; Schmitt, G. Revealing centrality in the spatial structure of cities from human activity patterns. Urban Stud. 2015, 54, 437–455. [Google Scholar] [CrossRef]
  21. De Goei, B.; Burger, M.J.; van Oort, F.G.; Kitson, M. Functional Polycentrism and Urban Network Development in the Greater South East, United Kingdom: Evidence from Commuting Patterns, 1981–2001. Reg. Stud. 2010, 44, 1149–1170. [Google Scholar] [CrossRef]
  22. Van Oort, F.; Burger, M.; Raspe, O. On the Economic Foundation of the Urban Network Paradigm: Spatial Integration, Functional Integration and Economic Complementarities within the Dutch Randstad. Urban Stud. 2010, 47, 725–748. [Google Scholar] [CrossRef]
  23. Burger, M.; Meijers, E. Form Follows Function? Linking Morphological and Functional Polycentricity. Urban Stud. 2012, 49, 1127–1149. [Google Scholar] [CrossRef]
  24. Taubenböck, H.; I.Standfuß, I.; Wurm, M.; Krehl, A.; Siedentop, S. Measuring morphological polycentricity—A comparative analysis of urban mass concentrations using remote sensing data. Comput. Environ. Urban Syst. 2017, 64, 42–56. [Google Scholar] [CrossRef]
  25. Veneri, P. The identification of sub-centres in two Italian metropolitan areas: A functional approach. Cities 2013, 31, 177–185. [Google Scholar] [CrossRef]
  26. Roca Cladera, J.; Marmolejo Duarte, C.R.; Moix, M. Urban Structure and Polycentrism: Towards a Redefinition of the Sub-centre Concept. Urban Stud. 2009, 46, 2841–2868. [Google Scholar] [CrossRef]
  27. Krehl, A. Urban subcentres in German city regions: Identification, understanding, comparison. Pap. Reg. Sci. 2016. [Google Scholar] [CrossRef]
  28. Limtanakool, N.; Dijst, M.; Schwanen, T. A theoretical framework and methodology for characterizing National urban systems on the basis of flows of people: Empirical evidence for France and Germany. Urban Stud. 2007, 44, 2123–2145. [Google Scholar] [CrossRef]
  29. Veneri, P. Urban Polycentricity and the Costs of Commuting: Evidence from Italian Metropolitan Areas. Growth and Change. J. Urban Reg. Policy 2010, 41, 403–429. [Google Scholar] [CrossRef]
  30. Guohun, Z.; Corcoran, J.; Shyy, P.; Pileggi, S.F.; Hunter, J. Analysing journey-to-work data using complex networks. J. Transp. Geogr. 2018, 66, 65–79. [Google Scholar] [CrossRef]
  31. Solomonov, R.; Rapoport, A. Connectivity of random nets. Bull. Math. Biophys. 1951, 13, 107–117. [Google Scholar] [CrossRef]
  32. Erdős, P.; Rényi, A. On random graphs. Publ. Math. Debr. 1959, 6, 290–297. [Google Scholar]
  33. Erdős, P.; Rényi, A. On the evolution of random graphs. Publ. Math. Inst. Hung. Acad. Sci. 1960, 5, 17–60. [Google Scholar]
  34. Szmytkie, R. Application of Graph Theory to the Morphological Analysis of Settlements. Quaest. Geogr. 2017, 36, 65–80. [Google Scholar] [CrossRef]
  35. Mathis, P. (Ed.) Graphs and Networks: Multilevel Modeling; Wiley: Hoboken, NJ, USA, 2013; ISBN 9781848210837. [Google Scholar]
  36. Newman, M.E.J.; Girvan, M. Finding and evaluating community structure in networks. Phys. Rev. E 2004, 69, 1–15. [Google Scholar] [CrossRef] [PubMed]
  37. Boccaletti, S.; Latora, V.; Moreno, Y.; Chavez, M.; Hwang, D.U. Complex networks: Structure and dynamics. Phys. Rep. 2006, 424, 175–308. [Google Scholar] [CrossRef]
  38. Robins, G. A tutorial on methods for the modelling and analysis of social network data. J. Math. Psychol. 2013, 57, 261–274. [Google Scholar] [CrossRef]
  39. Ganciu, A.; Balestrieri, M.; Cicalò, E. Visualising the research on visual landscapes. Graph representation and network analysis of international bibliography on landscape. In Proceedings of the XIV International Forum Le Vie dei Mercanti, Capri, Italy, 16–18 June 2016. [Google Scholar]
  40. Porta, S.; Crucitti, P.; Latora, V. The network analysis of urban streets: A dual approach. Phys. A Stat. Mech. Its Appl. 2006, 369, 853–866. [Google Scholar] [CrossRef]
  41. Cook, E.A. Landscape structure indices for assessing urban ecological networks. Landsc. Urban Plan. 2002, 58, 269–280. [Google Scholar] [CrossRef]
  42. Xie, F.; Levinson, D. Evolving Transportation Networks; Springer: New York, NY, USA; London, UK; Berlin, Germany, 2011; ISBN 978-1-4419-9804-0. [Google Scholar]
  43. Derrible, S.; Keendy, C. Applications of Graph Theory and Network Science to Transit Network Design. J. Transp. Rev. 2011, 31, 495–519. [Google Scholar] [CrossRef]
  44. Linehan, J.; Gross, M.; Finn, J. Greenway planning: Developing a landscape ecological network approach. Landsc. Urban Plan. 1995, 33, 179–193. [Google Scholar] [CrossRef]
  45. Estrada, E.; Bodin, Ö. Using network centrality measures to manage landscape connectivity. Ecol. Appl. 2008, 18, 1810–1825. [Google Scholar] [CrossRef] [PubMed] [Green Version]
  46. Urban, D.L.; Minor, E.S.; Treml, E.A.; Schick, R.S. Graph models of habitat mosaics. Ecol. Lett. 2009, 12, 260–273. [Google Scholar] [CrossRef] [PubMed] [Green Version]
  47. Nijkamp, P.; Reggiani, A.; Tritapepe, T. Modelling inter-urban transport flows in Italy: A comparison between neural network analysis and logit analysis. Transp. Res. Part C Emerg. Technol. 1996, 4, 323–338. [Google Scholar] [CrossRef]
  48. Lo, H.K.; Tung, Y.K. Network with degradable links: Capacity analysis and design. Transp. Res. Part B Methodol. 2003, 37, 345–363. [Google Scholar] [CrossRef]
  49. De Montis, A.; Barthélemy, M.; Chessa, A.; Vespignani, A. The structure of interurban traffic: A weighted network analysis. Environ. Plan. B 2007, 34, 905–924. [Google Scholar] [CrossRef]
  50. Patuelli, R.; Reggiani, A.; Gorman, S.P.; Nijkamp, P.; Bade, F.J. Network analysis of commuting flows: A comparative static approach to German data. Netw. Spat. Econ. 2007, 7, 315–331. [Google Scholar] [CrossRef]
  51. Green, N. Functional polycentricity: A formal definition in terms of social network analysis. Urban Stud. 2007, 44, 2077–2103. [Google Scholar] [CrossRef]
  52. Salas-Olmedo, M.H.; Nogués, S. Analysis of commuting needs using graph theory and census data: A comparison between two medium-sized cities in the UK. Appl. Geogr. 2012, 35, 132–141. [Google Scholar] [CrossRef]
  53. Calafati, A. Cities and Metropolitan Areas in Italy. GSSI Urban Stud. 2013, 1–22. [Google Scholar] [CrossRef]
  54. Banister, D. Cities, mobility and climate change. J. Transp. Geogr. 2011, 19, 1538–1546. [Google Scholar] [CrossRef]
  55. Camagni, R.; Gibelli, M.C.; Rigamonti, P. Urban mobility and urban form: The social and environmental costs of different patterns of urban expansion. Ecol. Econ. 2002, 40, 199–216. [Google Scholar] [CrossRef]
  56. Priemus, H.; Nijkamp, P.; Banister, D. Mobility and spatial dynamics: An uneasy relationship. J. Transp. Geogr. 2001, 9, 167–171. [Google Scholar] [CrossRef]
  57. ISTAT 15° Censimento Generale Della Popolazione. Matrici del Pendolarismo. 2011. Available online: http://dati-censimentopopolazione.istat.it (accessed on 05 November 2017).
  58. Caldarelli, G. Scale-Free Networks: Complex Webs in Nature and Technology; Oxford University Press: Oxford, UK, 2007; ISBN 9780199211517. [Google Scholar]
  59. Bondy, J.A.; Murty, U.S.R. Graph Theory with Applications; Macmillan: London, UK, 1976; Volume 290. [Google Scholar]
  60. Gibbons, A. Algorithmic Graph Theory; Cambridge University Press: Cambridge, UK, 1994. [Google Scholar]
  61. Diestel, R. Graph Theory; Springer: New York, NY, USA; London, UK; Berlin, Germany, 2000; ISBN 978-3-662-53621-6. [Google Scholar]
  62. Wasserman, S.; Faust, K. Social Network Analysis: Methods and Applications; Cambridge University Press: Cambridge, UK, 1994; Volume 8, ISBN 0521387078. [Google Scholar]
  63. Girvan, M.; Newman, M.E.J. Community structure in social and biological networks. Proc. Natl. Acad. Sci. USA 2002, 99, 7821–7826. [Google Scholar] [CrossRef] [PubMed]
  64. Fortunato, S. Community detection in graphs. Phys. Rep. 2010, 486, 75–174. [Google Scholar] [CrossRef]
  65. Fortunato, S.; Barthélemy, M. Resolution limit in community detection. Proc. Natl. Acad. Sci. USA 2007, 104, 36–41. [Google Scholar] [CrossRef] [PubMed]
  66. Blondel, V.D.; Guillaume, J.L.; Lambiotte, R.; Lefebvre, E. Fast unfolding of communities in largenetworks. J. Stat. Mech. Theory E 2008, 10, 10008–10020. [Google Scholar] [CrossRef]
  67. Hall, P.; Pain, K. The Polycentric Metropolis: Learning from the Mega-City Regions in Europe; Earthscan: London, UK, 2006; ISBN 978-1-84407-329-0. [Google Scholar]
  68. Parr, J. The polycentric urban region: A closer inspection. Reg. Stud. 2004, 38, 231–240. [Google Scholar] [CrossRef]
  69. Susilo, Y.O.; Maat, K. The influence of built environment to the trends in commuting, journeys in Netherlands. Transportation 2007, 34, 589–609. [Google Scholar] [CrossRef]
  70. Næss, P. Urban form and travel behavior: Experience from a Nordic context. J. Transp. Land 2012, 5, 21–45. [Google Scholar] [CrossRef]
  71. Balducci, A.; Valeria Fedeli, V.; Francesco Curci, F. (Eds.) Post-Metropolitan Territories: Looking for a New Urbanity; Routledge: London, UK; New York, NY, USA, 2017; ISBN 978-1138650480. [Google Scholar]
  72. Pucci, P. Mobility behaviors in peri-urban areas. The Milan Urban Region case study. Transp. Res. Procedia 2017, 25, 4229–4244. [Google Scholar] [CrossRef]
  73. Kent, J.L. Driving to save time or saving time to drive? The enduring appeal of the private car. Transp. Res. Part A Policy Pract. 2014, 65, 103–115. [Google Scholar] [CrossRef]
  74. Travisi, C.M.; Camagni, C.; Nijkamp, P. Impacts of urban sprawl and commuting: A modelling study for Italy. J. Transp. Geogr. 2010, 18, 382–392. [Google Scholar] [CrossRef]
  75. Gori, S.; Nigro, M.; Petrell, M. The impact of land use characteristics for sustainable mobility: The case study of Rome. Eur. Transp. Res. Rev. 2012, 4, 153–166. [Google Scholar] [CrossRef]
  76. Hickman, R.; Hall, P.; Banister, D. Planning more for sustainable mobility. J. Transp. Geogr. 2013, 33, 210–219. [Google Scholar] [CrossRef]
  77. Dell’Olio, L.; Ibeas, A.; Cecin, P. The quality of service desired by public transport users. Transp. Policy 2011, 18, 217–227. [Google Scholar] [CrossRef]
  78. Handy, S. Methodologies for exploring the link between urban form and travel behavior. Transp. Res. D 1996, 2, 151–165. [Google Scholar] [CrossRef]
  79. Aguilera, A. Growth in commuting distances in French polycentric metropolitan areas: Paris, Lyon and Marseille. Urban Stud. 2005, 42, 1537–1547. [Google Scholar] [CrossRef]
Figure 1. Metropolitan areas in Italy (source: authors’ elaboration).
Sustainability 10 00596 g001
Figure 2. Italian and Case studies metropolitan areas population (source: authors’ elaboration from ISTAT data).
Sustainability 10 00596 g002
Figure 3. Metropolitan areas GDP (source: authors’ elaboration from UNHSP [3]).
Sustainability 10 00596 g003
Figure 4. Partial flow value (PFV) network categories of “transport modes” and “travel time” (source: authors’ elaboration).
Sustainability 10 00596 g004
Figure 5. Graph structure (source: authors’ elaboration).
Sustainability 10 00596 g005
Figure 6. Example of Community Detection with three clusters of nodes (red, blue, yellow elements). On the left modularity (Q) = 0,51, on the wright modularity (Q) = 0,6. (source: authors elaboration).
Sustainability 10 00596 g006
Figure 7. Lombardy Region (Milan) Total Moving Unit Estimator (TMUE), the edges (w) are rappresented by Link (w) (source: authors’ elaboration).
Sustainability 10 00596 g007
Figure 8. Lazio Region (Rome) TMUE the edges (w) are rappresented by Link (w) (source: authors’ elaboration).
Sustainability 10 00596 g008
Figure 9. Regional Cumulative Distribution of Region commuting flows (source: authors’ elaboration).
Sustainability 10 00596 g009
Figure 10. Weight Community Detection in Lombardy Region (Milan) (source: authors’ elaboration).
Sustainability 10 00596 g010
Figure 11. Weight Community Detection in Lazio Region (Rome) (source: authors’ elaboration).
Sustainability 10 00596 g011
Figure 12. TMUE and edges (link) distribution among MCs and Region (source: authors’ elaboration).
Sustainability 10 00596 g012
Figure 13. Milan (MCM) TMUE network (source: authors’ elaboration).
Sustainability 10 00596 g013
Figure 14. Rome (MCR) TMUE network (source: authors’ elaboration).
Sustainability 10 00596 g014
Figure 15. TMUE MCs Cumulative Distribution (source: authors’ elaboration).
Sustainability 10 00596 g015
Figure 16. PFV distribution (%) and value among typology of vehicle into MCs (source: authors’ elaboration).
Sustainability 10 00596 g016
Figure 17. PFV Non-motorized mobility Typology distribution (%) and value among duration of trip (t1, 0 ÷ 15 min; t2, 16 ÷ 30 min; t3 31 ÷ 60 min) into MCs (source: authors’ elaboration).
Sustainability 10 00596 g017
Figure 18. The PFV Non-motorized mobility t1 (0 ÷ 15 min) commuting network of MCM (source: authors’ elaboration).
Sustainability 10 00596 g018
Figure 19. The PFV Non-motorized mobility t2 (16 ÷ 30 min) commuting network of MCR (source: authors’ elaboration).
Sustainability 10 00596 g019
Figure 20. Private Typology distribution (%) and value among duration of trip (t1, 0 ÷ 15 min; t2, 16 ÷ 30 min; t3, 31 ÷ 60 min) into MCs (source: authors’ elaboration).
Sustainability 10 00596 g020
Figure 21. PFV Cumulative Distribution of Private Typology and duration of trip t3 (source: authors’ elaboration).
Sustainability 10 00596 g021
Figure 22. The PFV Private t3 commuting network of MCM (source: authors’ elaboration).
Sustainability 10 00596 g022
Figure 23. The PFV Private t3 commuting network of MCR (source: authors’ elaboration).
Sustainability 10 00596 g023
Figure 24. Public Typology distribution (%) and value among duration of trip (t1, 0 ÷ 15 min; t2, 16 ÷ 30 min; t3, 31 ÷ 60 min) into MCs (source: authors’ elaboration).
Sustainability 10 00596 g024
Figure 25. Cumulative Distribution of Public Typology and duration of trip t2 (16 ÷ 30 min) (source: authors’ elaboration).
Sustainability 10 00596 g025
Figure 26. The PFV Public t2 (16 ÷ 30 min) commuting network of MCM (source: authors’ elaboration).
Sustainability 10 00596 g026
Figure 27. The PFV Public t2 (16 ÷ 30 min) commuting network of MCR (source: authors’ elaboration).
Sustainability 10 00596 g027
Table 1. Database elements (source: authors’ elaboration from National Commuting Matrix NCM).
Field: Destination
ValueNCM Tags
Same municipality of residence01
Different municipality of residence02
International destinations03
Field: transport modes
ValueNCM Tags
Train01
Tram02
Underground03
Urban Bus, trolley bus04
Extra-urban bus05
Company bus or school bus06
Private car (as passenger)07
Private car (as driver)08
Motorcycle, scooter09
Bicycle10
On foot12
Other11
Field: Duration of trip
ValueTags NCM
0 ÷ 15 min01
16 ÷ 30 min02
31 ÷ 60 min03
>60 min04
Table 2. Centrality network measures used (source: authors’ elaboration).
GraphNode MeasureNetwork MeasureClustering Measure
DegwDegINwDegOUTwΔΦCDQ
Region Sustainability 10 00596 i001 Sustainability 10 00596 i001 Sustainability 10 00596 i001 Sustainability 10 00596 i001 Sustainability 10 00596 i001 Sustainability 10 00596 i001 Sustainability 10 00596 i001
AM SUST Sustainability 10 00596 i001 Sustainability 10 00596 i001 Sustainability 10 00596 i001 Sustainability 10 00596 i001 Sustainability 10 00596 i001
AM PFV Sustainability 10 00596 i001 Sustainability 10 00596 i001 Sustainability 10 00596 i001 Sustainability 10 00596 i001 Sustainability 10 00596 i001
Table 3. Network structure of Regional Commuting (source: authors’ elaboration).
NetworkNodesEdgesTMUE
Lombardy (Milan)1544155,9662,743,231
Lazio (Rome)37715,032688,403
Table 4. Density and Diameter of Regional Network (source: authors’ elaboration).
NetworkΔΦ
Lazio (Rome)0.1054
Lombardy (Milan)0.0655
Table 5. Community Detection and Modularity value of Regional Network (source: authors’ elaboration).
NetworkCDwQ
Lazio (Rome)90.623
Lombardy (Milan)220.749
Table 6. Metropolitan commuting network structure (source: authors’ elaboration).
NetworkNodesEdgesTMUE
MCM13410,318632,597
MCR1213395394,480
Table 7. Density and diameter of metropolitan network (source: authors’ elaboration).
NetworkΔΦ
MCM0.5793
MCR0.2344
Table 8. Metropolitan commuting network structure of PFV Private Typology and duration of trip t3 (31 ÷ 60 min) (source: authors’ elaboration).
NetworkNodeEdgeΔΦ
MCM PFV Priv 0313445820.2574
MCR PFV Priv 0312122470.1554
Table 9. Metropolitan commuting network structure of PFV Public Typology and duration of trip t2 (16 ÷ 30 min) (source: authors’ elaboration).
NetworkNodesEdgesΔΦ
MCM PFV Pub 0213421730.1224
MCR PFV Pub 021216530.0458

