Towards the Handling Demand Response Optimization Model for Home Appliances
by
 and
and
Jaclason M. Veras
1, 
Igor Rafael S. Silva
2,
Plácido R. Pinheiro
1,* and
and
Ricardo A. L. Rabêlo
2,* 1
Graduate Program in Applied Informatics, University of Fortaleza (UNIFOR), Fortaleza—CE 60811-905, Brazil
2
Department of Computing, Federal University of Piauí (UFPI), Teresina—PI 64049-550, Brazil
*
Authors to whom correspondence should be addressed.
Sustainability 2018, 10(3), 616; https://doi.org/10.3390/su10030616
Submission received: 25 January 2018
/
Revised: 16 February 2018
/
Accepted: 22 February 2018
/
Published: 27 February 2018
(This article belongs to the Special Issue Sustainable Smart Cities and Smart Villages Research)
Abstract
:The Demand Response (DR) is used by public electric utilities to encourage consumers to change their consumption profiles to improve the reliability and efficiency of the electric power system (EPS) and at the same time to minimize the electricity costs for the final consumers. Normally, DR optimization models only aim to reduce the energy consumption and reduce the final cost. However, this disregards the needs of the consumer. Therefore, proposals which appear excellent in theory are usually impracticable and non-commercial. This paper proposes a real-time Demand Response (DR) optimization model to minimize the electricity costs associated with consumption without compromising the satisfaction or comfort of residential consumers. The proposed DR here considered the different home appliance categories and level of consumer satisfaction for the new load scheduling of the appliances and is much more comprehensive than the other models analyzed. Moreover, it can be applied in any country, under any energy scenario. This model was developed as a nonlinear programming problem subject to a set of constraints. An energy consumption analysis of 10 families for 2015 from five geographic and climatic regions of Brazil was carried out. A computational validation of the model was performed using a genetic algorithm (GA) to determine the programming of residential devices for the time horizon. The computational simulations showed a decrease in the cost of the electricity. Moreover, the results showed that there was no impairment to consumer satisfaction and comfort due to the scheduling of appliances.
1. Introduction
Demand response (DR) is a program that balances the supply and demand of electric power to maximize the reliability and efficiency of the electric power system (EPS). DR programs encourage residential, industrial and commercial consumers to change their way of consuming electricity in line with changes in electricity prices over the time horizon and at times of EPS overload [1,2,3].
Chanana and Kumar [4] related that utilities are normally only concerned with industrial and commercial consumers when it comes to DR programs. Setlhaolo et al. [5] explained that this is because DR is successful with such consumers, as it reduces the cost and consumption of electricity significantly. However, this does not happen so easily with residential consumers, who usually have specific needs for different spaces, which requires making several consumption profiles for one resident.
One of the obstacles to set up a DR in a residential environment is the need for manual intervention by the consumer for programming residential appliances along the time horizon [5]. However, due to lack of time, knowledge and commitment, the consumers are not usually willing to participate actively in such programs linked to the EPS, and therefore to set up a DR program in a residential scenario is more complex.
However, Chanana and Kumar [4] emphasized that, due to the technological advances that have taken place in the last decades that have improved the Advanced Metering Infrastructures (AMIs), the Home Area Networks (HANs) and the Grid Automation and Distributed Intelligence (GADI), it has become possible to include residential consumers in DR programs.
Considering these advances, other research groups have taken up the challenge to make DR programs a viable alternative for residential customers. Pop et al. [6] proposed a blockchain based architecture for distributed management, control, and validation of DR programs in low/medium voltage smart grids, thus assuring high reliability and decentralized operations by implementing trackable and tamper-proof energy flexibility transactions as well as near real time DR validation. To validate the proposal, a simulation based prototype was implemented using the Ethereum platform. The results showed that their blockchain based distributed demand side management can be used to match energy demand and production at a smart grid level, and the demand response signal is followed with high accuracy, while the amount of energy flexibility needed for convergence is reduced. However, the proposal does not consider multi-stakeholder markets (DSOs, TSOs, retailers as competitors or cooperators for the same energy flexibility).
Brusco et al. [7] proposed a new energy box (EB) to solve the problem of communication between the consumer and the aggregator in the face of the interaction challenges of interaction between an EB and an energy management system (HEMS). In this sense, the article presents two prototype, the low-EB that uses Arduino MEGA 2560, and the second (high-EB) that uses Raspberry Pi3. The results of the simulations showed that the two prototypes are relevantly cost-effective and effectively are able to serve attend demand response programs in cloud-based architectures. However, the authors restricts themselves to only evaluating one residential unit and nine types of apparatuses: internal and external lightings, a personal computer, a TV set, a refrigerator, an air-conditioning system, a washing machine, a tumble dryer, a dishwasher and an electric vehicle.
Wang and Paranjape [8] presented a multiagent system to manage residential DR to reduce the peak-to-average ratio (PAR) and the cost of electricity associated with consumption. The optimal control of electricity consumption is developed into a convex programming problem to minimize the cost of electricity under real-time pricing. However, the proposal only considered the level of satisfaction and comfort of the consumers for the recharging schedules of electric vehicles.
Ashabani and Gooi [9] proposed a multi-objective autonomous intelligent load control using a power electronic interface and a hybrid DC/AC grid concept. The objective is to introduce voltage hopper technology to provide autonomous and automated grid ancillary services and load control without the need of a supervisory/centralized controller. To validate the effectiveness of the proposed control and management strategy the building system was implemented and simulated in an interfaced dSPACE/OPAL-RT real-time simulator. The proposal has many advantages such as autonomous and automatic load control and grid frequency regulation; centralized regulation signal-based demand control; grid support; continuous/adaptive power control of critical and non-critical AC loads, DC loads, and HVAC systems; battery energy storage systems (BESSs); and Plug-in Electric Vehicles (PEVs). However, the results of the computational simulations showed that the proposal did not consider the simultaneous use of different categories of residential appliances nor the level of satisfaction and comfort of the consumers faced with this new optimized scheduling.
Guerrero-Martinez et al. [10] presented a smart multi-converter system for smart grid applications with a Hybrid Energy Storage System (HESS). The overall aim is to globally optimize the energy billing of the whole community, minimize losses and obtain the highest efficiency possible from the generation and storage units available in the community. The proposed multi-converter topology was simulated using the library components of the Simscape Power SystemsTM MATLAB/Simulink. The simulation and experimental tests demonstrated that this multi-converter presents several improvements compared with traditional converters: simultaneously it is able to track an active power set-point with high power quality; operate PV modules with a MPPT algorithm; and manage energy storage based on a hybrid configuration, composed of batteries and supercapacitors; this latter ability enables it to improve the efficiency and lifetime of the storage elements.
Croce et al. [11] proposed Overgrid, a fully distributed peer-to-peer (P2P) architecture designed to automatically control and implement distributed demand response (DR) schemes in a community of smart buildings with energy generation and storage capabilities. Thus, to implement the Overgrid service architecture, the authors developed, in Java, the software modules responsible for the distributed signaling mechanisms between the nodes by exploiting the open source library for gossip protocols called JavaGossip, which works on UDP transport packets. The results showed that the system is quite robust in terms of topological changes and message losses, while the adaption times are compatible with the typical times expected for DR mechanisms. In addition, adaptation to larger or smaller scale systems is possible. However, the proposal does not contemplate some aspects, such as aggregate buildings with complementary behaviors, capable of operating power consumption modulation all year round; prioritization mechanisms for power reduction; and energy storage to improve the integration of renewable source production.
Javaid et al. [12] proposed a hybrid scheme named GAPSO for residential load scheduling, to optimize the desired objective function of minimizing the electricity cost and user discomfort while taking into account the peak energy consumption. To alleviate the complexity of the problem, a multi-dimensional knapsack is used to ensure that the electricity load will not escalate during peak hours. Thus, the GAPSO scheme was implemented and its performance compared against a traditional dynamic programming (DP) technique and two heuristic optimization techniques: genetic algorithm (GA) and binary particle swarm optimization (BPSO) for residential load management. The authors formulated the binary optimization problem through a multiple knapsack problem (MKP). The results of the simulation showed that the proposed hybrid scheme, GAPSO, performed better in terms of cost and occupant discomfort minimization along with reduction of peak power consumption compared to its counterpart schemes GA and BPSO. However, the authors did not take into account, in the performance analysis for the management of residential loads, the category that includes heating, ventilation, and air conditioning (HVAC) appliances. Thus, the devices with high load consumption were not analyzed.
Roh and Lee [13] presented an algorithm for residential load scheduling to control the operational time and electric energy consumption of each device. The proposal was developed as a mixed integer nonlinear programming (MINLP) problem. The authors used the Benders decomposition approach to solve the problem with low computational complexity. However, the proposal restricts only one single residence.
Ma et al. [14] presented a minimization of electricity consumption cost and user discomfort are considered as objective functions. Time flexible and power flexible appliances are considered for the efficient use of energy. The scheduling problem is formulated as convex optimization and electricity price is defined by the utility on a day-ahead basis. The results of the simulations showed that the proposed technique achieved a desired trade-off between both parameters of the objective functions. However, by increasing the size of the problem, the computational complexity also increases.
Jovanovic et al. [15] proposed a new demand response scheduling framework for an array of households, which are grouped into different categories based on socio-economic factors, such as the number of occupants, family decomposition and employment status. The proposal takes the preferences of participating households into account and aims to minimize the overall production cost and, in parallel, to lower the individual electricity bills. The proposal was mathematically designed as a mixed integer programming problem. The model was implemented using IBM ILOG CPLEX and executed using the default solver settings. The computational simulations showed that coupling the preference levels of the consumers with the associated job descriptions can be beneficial, for both the customer and the utility company. The results also showed that the reduction in the operations of the utility company can also be reflected in customer bills by means of incentives. A significant level of savings in production costs can be achieved while maintaining a high degree of satisfaction for the participating households. In addition, further savings can be achieved by allowing a higher level of maximal dissatisfaction for households. However, the work presented does not consider the different categories (interruptible and deferrable, uninterruptible and deferrable, uninterruptible and non-deferrable) of home appliances.
Vivekananthan et al. [16] proposed an algorithm for a Home Energy Management Scheduler (HEMS) to manage the consumption of residential electrical energy in order to reduce the cost of electricity. The proposal applied stochastic dynamic programming to manage the residential appliances. However, the proposal only evaluated the dynamic programming of seven residential appliances and did not consider the impact of modifying the programming of the appliances on the satisfaction and comfort of the consumers.
Samadi et al. [17] proposed two interactive algorithms based on the stochastic approximation technique to minimize peak-to-average ratio (PAR) in aggregate load demand. However, the results of the computational simulations show that the algorithms do not consider the simultaneous use of different categories of residential appliances and the level of satisfaction and comfort of the consumers faced with the optimized scheduling of such residential appliances.
Zhou et al. [18] proposed an approach to manage the consumption of residential electricity in real time. The proposal was planned to deal with complex operational environments and consequently reduce the cost of electricity associated with consumption. However, the proposal only evaluated electric water heaters, air conditioners, clothes dryers, electric vehicles, photovoltaic cells, critical loads, and battery systems without considering the other different categories of residential appliances.
Nair and Rajasekhar [19] proposed a DR algorithm based on the principles of multi-integer linear programming to manage residential energy consumption. The proposal aimed to modify the residential electricity consumption profiles considering the daily price of electricity and the preferences of consumers regarding the use of residential appliances. However, the proposal restricted itself to evaluating only five consumers with a single standard of consumption and seven residential appliances.
Zhao et al. [20] proposed an approach to manage residential loads in order to reduce the cost of electricity and the peak-to-average ratio (PAR) by scheduling the operations of apparatuses. The proposal was developed as a nonlinear programming problem. However, it only evaluated nine types of residential appliances. Moreover it only considered sixteen operations per planning horizon considered as a maximum for all the parameters (the time to start and end the operations of the devices, and the time interval of the operations) which must be programmed by consumers.
Chen et al. [21] presented an algorithm to schedule the operation of home appliances to minimize the cost of electricity based on real-time pricing. The proposal applied the stochastic scheduling technique based on the deterministic linear programming to deal with the uncertainties regarding the consumption of electric energy and the time of operation of the residential appliances. However, the proposal does not take into account the different categories of residential appliances and individualized loads.
Wang et al. [22] presented an algorithm based on mixed integer nonlinear programming to schedule the residential loads in relation to the use of the devices. The proposed system was able to schedule residential loads and reduce the electricity costs and is based on the characteristics of the thermal dynamics of thermostatically controlled loads by combining the operations of the algorithm and the particularities of the appliance commitment problem. However, the proposal restricted itself to evaluating only the dynamic programming of thermal devices, such as electric water heaters, without considering the other categories.
Logenthiran et al. [23] proposed an approach to simultaneously manage different categories of residential devices. The proposal was developed mathematically as a nonlinear programming problem. The proposal aimed to program the operations of the devices using the load shifting so that the final load consumption curve was as close as possible to the one defined by the utility and which would satisfy the desired management strategy. However, the proposal does not include the different categories of residential appliances.
Chen et al. [24] presented a real-time DR model to automatically schedule the operation of residential appliances of the final consumers. The model was developed mathematically as an integer linear programming problem. However, the results of the computational simulations show that the proposal is limited to evaluating the programming of only six residential apparatuses without considering the different categories of these apparatuses.
Pipattanasomporn et al. [2] presented an algorithm to manage the residential loads, to reduce the total consumption of electric energy considering the preferences of the consumers. In addition, the authors presented a simulation tool that was developed to simulate DR events to exemplify the applicability of the proposed algorithm. However, the proposal restricts itself to evaluating only the air conditioners, water heaters, clothes dryers and electric vehicles without considering the different categories of residential appliances.
Conejo et al. [25] proposed a real-time DR model developed as a linear programming problem, using the robust optimization technique to model changes in the price of electricity. The aim of the proposal is to adjust load levels in response to hourly electricity price changes, leading the residential consumer to use as little electricity as possible but not considering the inconvenience caused to him. The proposal also does not consider the different categories of residential appliances and the individualized representation of loads, which implies an optimal solution to the problem that is not feasible in a real scenario.
Along these lines of the above mentioned works this study presents a mathematically developed DR optimization model as a nonlinear programming problem that aims to determine the optimum programming of residential appliances. The purpose of the proposal is to reduce the cost associated with the consumption of electric energy taking into account the satisfaction and comfort of end consumers and the various restrictions associated with energy consumption such as minimum and maximum limits of the load for each time interval; ramp limits; minimum consumption related to the time horizon; and operational restrictions of the residential appliance categories. Genetic Algorithms (GA) [26] were used to specify the operation of each home appliance at each time interval.
The contributions related to the use of the model presented in this work include: (a) the definition of an optimized scheduling for the operation of the different categories of residential apparatuses taking into account time horizons with variable sizes; (b) the representation of various aspects such as geographic location, climate and temperature, consumer preferences and the hourly price of electricity and its implications on residential energy consumption; and (c) assessing the level of satisfaction and comfort of the final consumers to enable them to decide whether to join the DR program.
This work is arranged as follows. Section 2 presents the problem definition and the DR optimization model. Section 3 describes the optimized programming of residential appliances by the genetic algorithm. Section 4 presents a case study that shows the test scenario and the numerical results obtained in the computational simulation that applies the proposed model to minimize the cost of electricity associated with consumption. Section 5 explains the main contributions of this work and future research projects.
2. Problem Definition and Optimization Model
The operation of different categories of residential appliances needs to be managed so that the total cost of electricity can be minimized by considering the variations of electric energy prices as a function of the time interval. Therefore, there is a need for a residential load scheduling method that requires little attention from the consumers in their configuration and maintenance, allowing the comparison of the costs and benefits of different operating schedules of household appliances. Consequently, the planning of loads must be done automatically, for example, using optimization techniques.
The model proposed in this work aims to optimize the operation schedule of each residential appliance i, where in a time interval t, where , taking into account the power (in kW) and the electric energy consumption (in kWh) of each residential appliance per time interval t. In addition, the proposal presented considers the scheduling of loads individually for each residential appliance and the price of electricity in the time interval t. Thus, the total cost of electricity in the time horizon T is given by:
where N represents the number of residential appliances; corresponds to the vector with an energy consumption of a home appliance i when it is in operation; T indicates the time horizon; corresponds to the price of electricity in the interval of time t; and (Diary Setup of Appliances) corresponds to the load scheduling matrix with the following configuration:
Equation (1) presents the objective function used in this work, which aims to program the operation of each residential appliance in the time horizon, and thus minimize the cost of electricity associated with electric energy consumption. Several constraints are applied to Equation (1):
Constraint 1 (Equation (2)) establishes that the load must be within the limits set for each time interval, denoted by and , respectively.
where is the vector with the power (in kW) of each home appliance i.
Constraints 2 (Equation (3)) and 3 (Equation (4)) determine that the load variation of two consecutive time intervals must be between the minimum () and maximum () limits.
where / are the Up/Down demand ramping limits.
Constraint 4 (Equation (5)) states that the minimum consumption of electricity related to the time horizon, stipulated by the residential consumer, is fulfilled.
where is the minimum energy consumption demanded by the consumer in the time horizon T.
Constraints 1–4 relate the common characteristics of energy consumption. In this work, the home appliances are categorized into three types, based on their operational characteristics [24]: interruptible and deferrable (), uninterruptible and deferrable () and uninterruptible and non-deferrable (). “Uninterruptible” and “Interruptible” are related to a task that can, or not, be stopped until finished. “Non-deferrable” and “Deferrable” determine if the task must start at the first time slot of the operational window, or not. Based on these definitions, it is possible to specify the constraints that deal with the different categories of residential appliances , and .
Constraint 5 (Equation (6)) specifies that the start time of categories home appliances may vary over the time horizon T as long as the required time is fulfilled.
Constraint 6 (Equation (7)) establishes that the start time of type residential appliance may be delayed in the time horizon T but, once its operation has started, it cannot be interrupted for the time required by the consumer.
Finally, Constraint 7 (Equation (8)) assures that the operation between the start () and end () times, as determined by the consumers for the home appliances of type , is uninterrupted for the required time over the horizon of time T.
where () is equivalent to the start time of the operation of appliance i; () corresponds the final time of the operation of appliance i; is the required time for appliance i to finish its operation; , and are the set of appliances of the categories: interruptible and deferrable, uninterruptible and deferrable, uninterruptible and non-deferrable, respectively; and q is the initial time slot of the interval that will be verified if the category residential appliances were used without interruption.
Besides that, the proposed DR optimization model considers how the operating schedule of the residential appliances can interfere with the satisfaction and comfort of the final consumers via inconvenience values. Thus, Equation (9) aims to evaluate how the optimized scheduling of residential loads modifies the satisfaction/comfort of the final consumers. Therefore, Equation (9) compares the real energy consumption () in the time interval t for the home appliance i of the family, which is analyzed through the Load Profile Generation (LPG) tool [27], and the consumption obtained by the optimization techniques () used in the computational simulations. The inconvenience value checks the difference between the actual consumption and the suggested consumption for each time interval and for each device under consideration, and shows how much the consumption suggested by the optimization technique distances itself from the actual consumption pattern of the family under analysis. Assuming that the solution considered optimal will affect the normal use of residential appliances minimally, besides reducing the final price, then the smaller the difference between the normal family consumption and the proposed optimized one, the better the solution will be. Thus, the matrix can be defined as follows:
The is the load scheduling suggested by various DR models.
The inconvenience value calculation is shown in Equation (9) and it is assumed that both and are in the form of a binary matrix (made up of only 1s and 0s) to indicate which home appliances are in operation at each time interval.
Based on this assumption, the calculation of the inconvenience associated with a home appliance operation scheduling allows the consumer to decide whether or not to join the DR program.
3. Optimal Scheduling of Home Appliances Through a Genetic Algorithm
The DR optimization model proposed in this work was based on the load shifting technique that modifies the pattern of residential electricity consumption over the time horizon [28]. Thus, the demand usually required in peak periods was shifted to another time of lowerl daily consumption without overloading the system during peak consumption; consequently, the consumer maintained the same totaperiods.
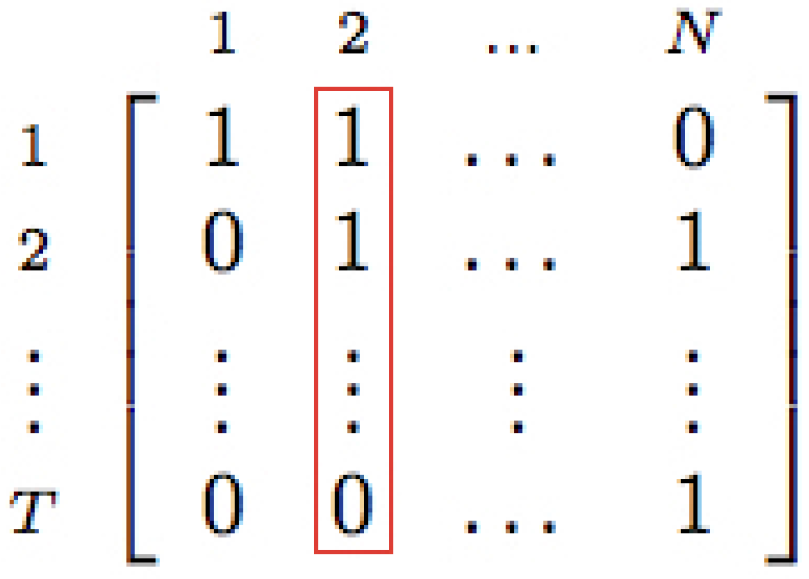
The genetic algorithm (GA) was used in the optimization process to manage the different categories of residential appliances and reduce the energy consumption costs of residential consumers. The GA chromosomes represent the solution of the problem and, in this study, are structured as a DSA matrix. The matrix , shown in the Figure 1, is a binary matrix, whose elements and , indicate whether a particular home appliance i is in operation at the time interval t. In Figure 1, the index home appliances two is on at the time intervals 1 and 2 and is off in the interval T.
The size of the chromosome in the matrix is directly related to the time horizon T and to the number of residential devices N. Therefore, the size of the chromosome () is given by:
The GA optimization process consists of several steps shown in Figure 2 and detailed below:
- (1)
- Initialize Population: The initialization is carried out randomly with a uniform distribution of the chromosome population that represents easy solutions.
- (2)
- Evaluate each chromosome in the population: Evaluates the population of chromosomes from the fitness values obtained in Equation (11) to define an ancestor (father) among the selected chromosomes.
- (3)
- Elitism: Maintains the good solutions that are already part of the chromosome population, conserving a quantity () of the chromosomes already existing in the new population, produced in each generation.
- (4)
- Selection: Uses the tournament selection method to randomly define a number () of chromosomes (parents) of the population, reevaluated according to the fitness values of Equation (11).
- (5)
- Crossover: Determines the cutoff point, in which the parents selected in Step 4 are divided into a randomly selected point, which in this study is the column index () that divides the DSA matrix and divides the chromosome into two parts (P1 and P2).
- (6)
- Mutation: Occurs every time a child is generated and there is an inversion of all bits (1s and 0s) of the randomly selected column of the DSA matrix.
- (7)
- Next Generatio: Produces a new population of chromosomes.
- (8)
- Optimum Scheduling of Appliances: Finalizes the GA optimization process when the stopping criterion (maximum number of generations) is reached, providing the ideal configuration of the operation of the N residential devices along the time horizon T.
4. Case Study
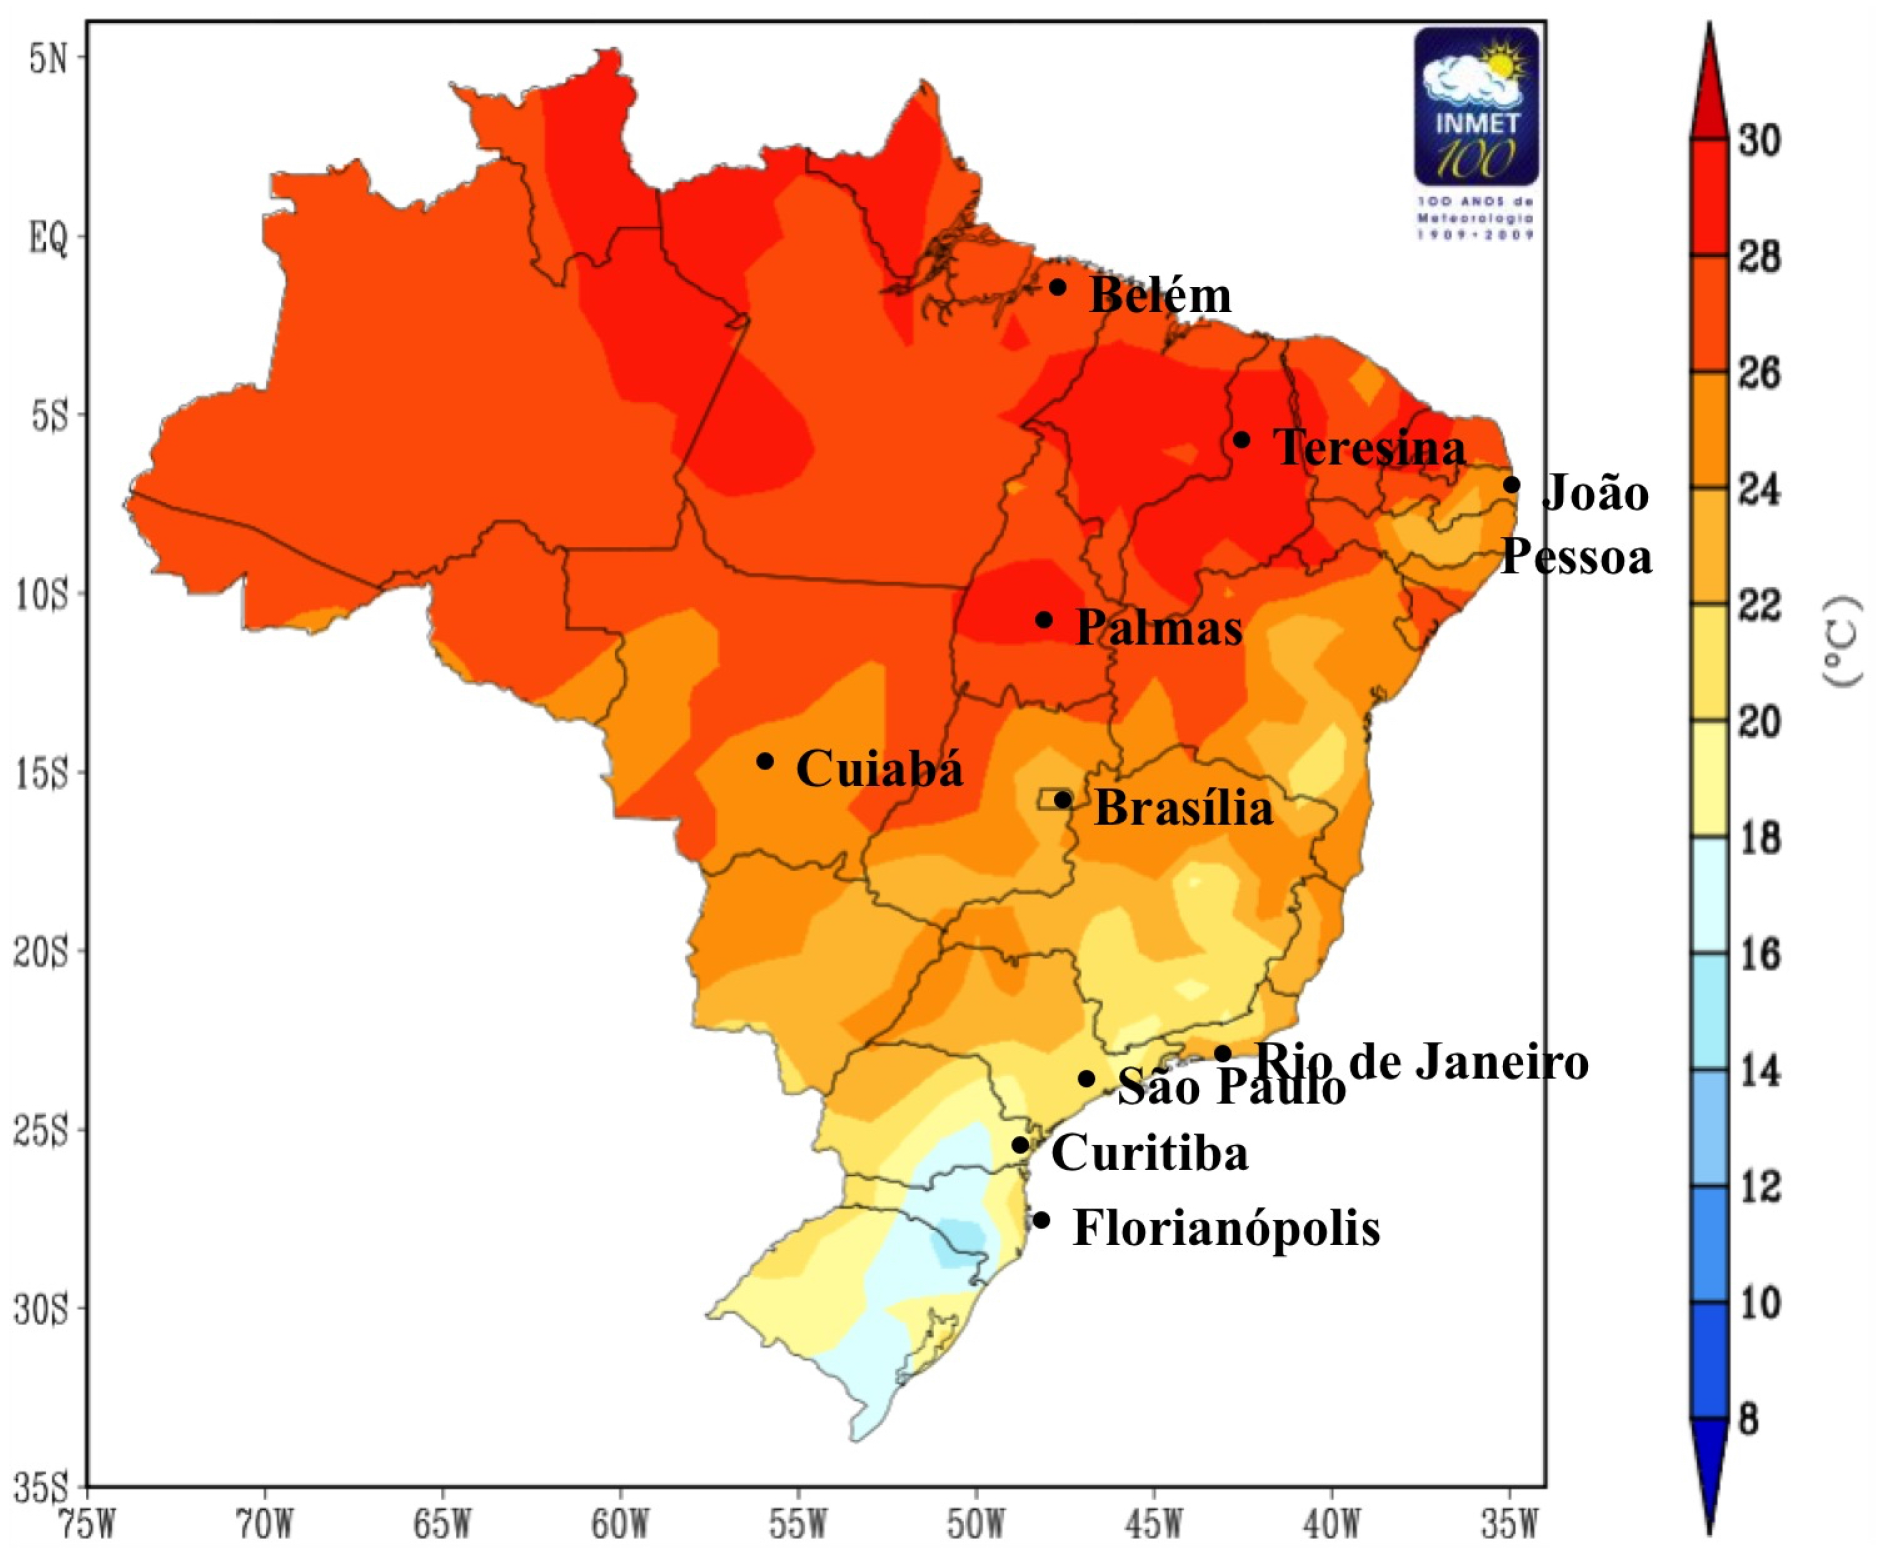
In the GA optimization process, several residential load consumption patterns were developed using the LPG tool [27]. The computational simulations considered the preferences of the consumers in terms of their home appliances, the price of electric energy per hour and the diversity of geographic information based on the location, the climate and their respective implications for each region of Brazil, as illustrated in Figure 3.
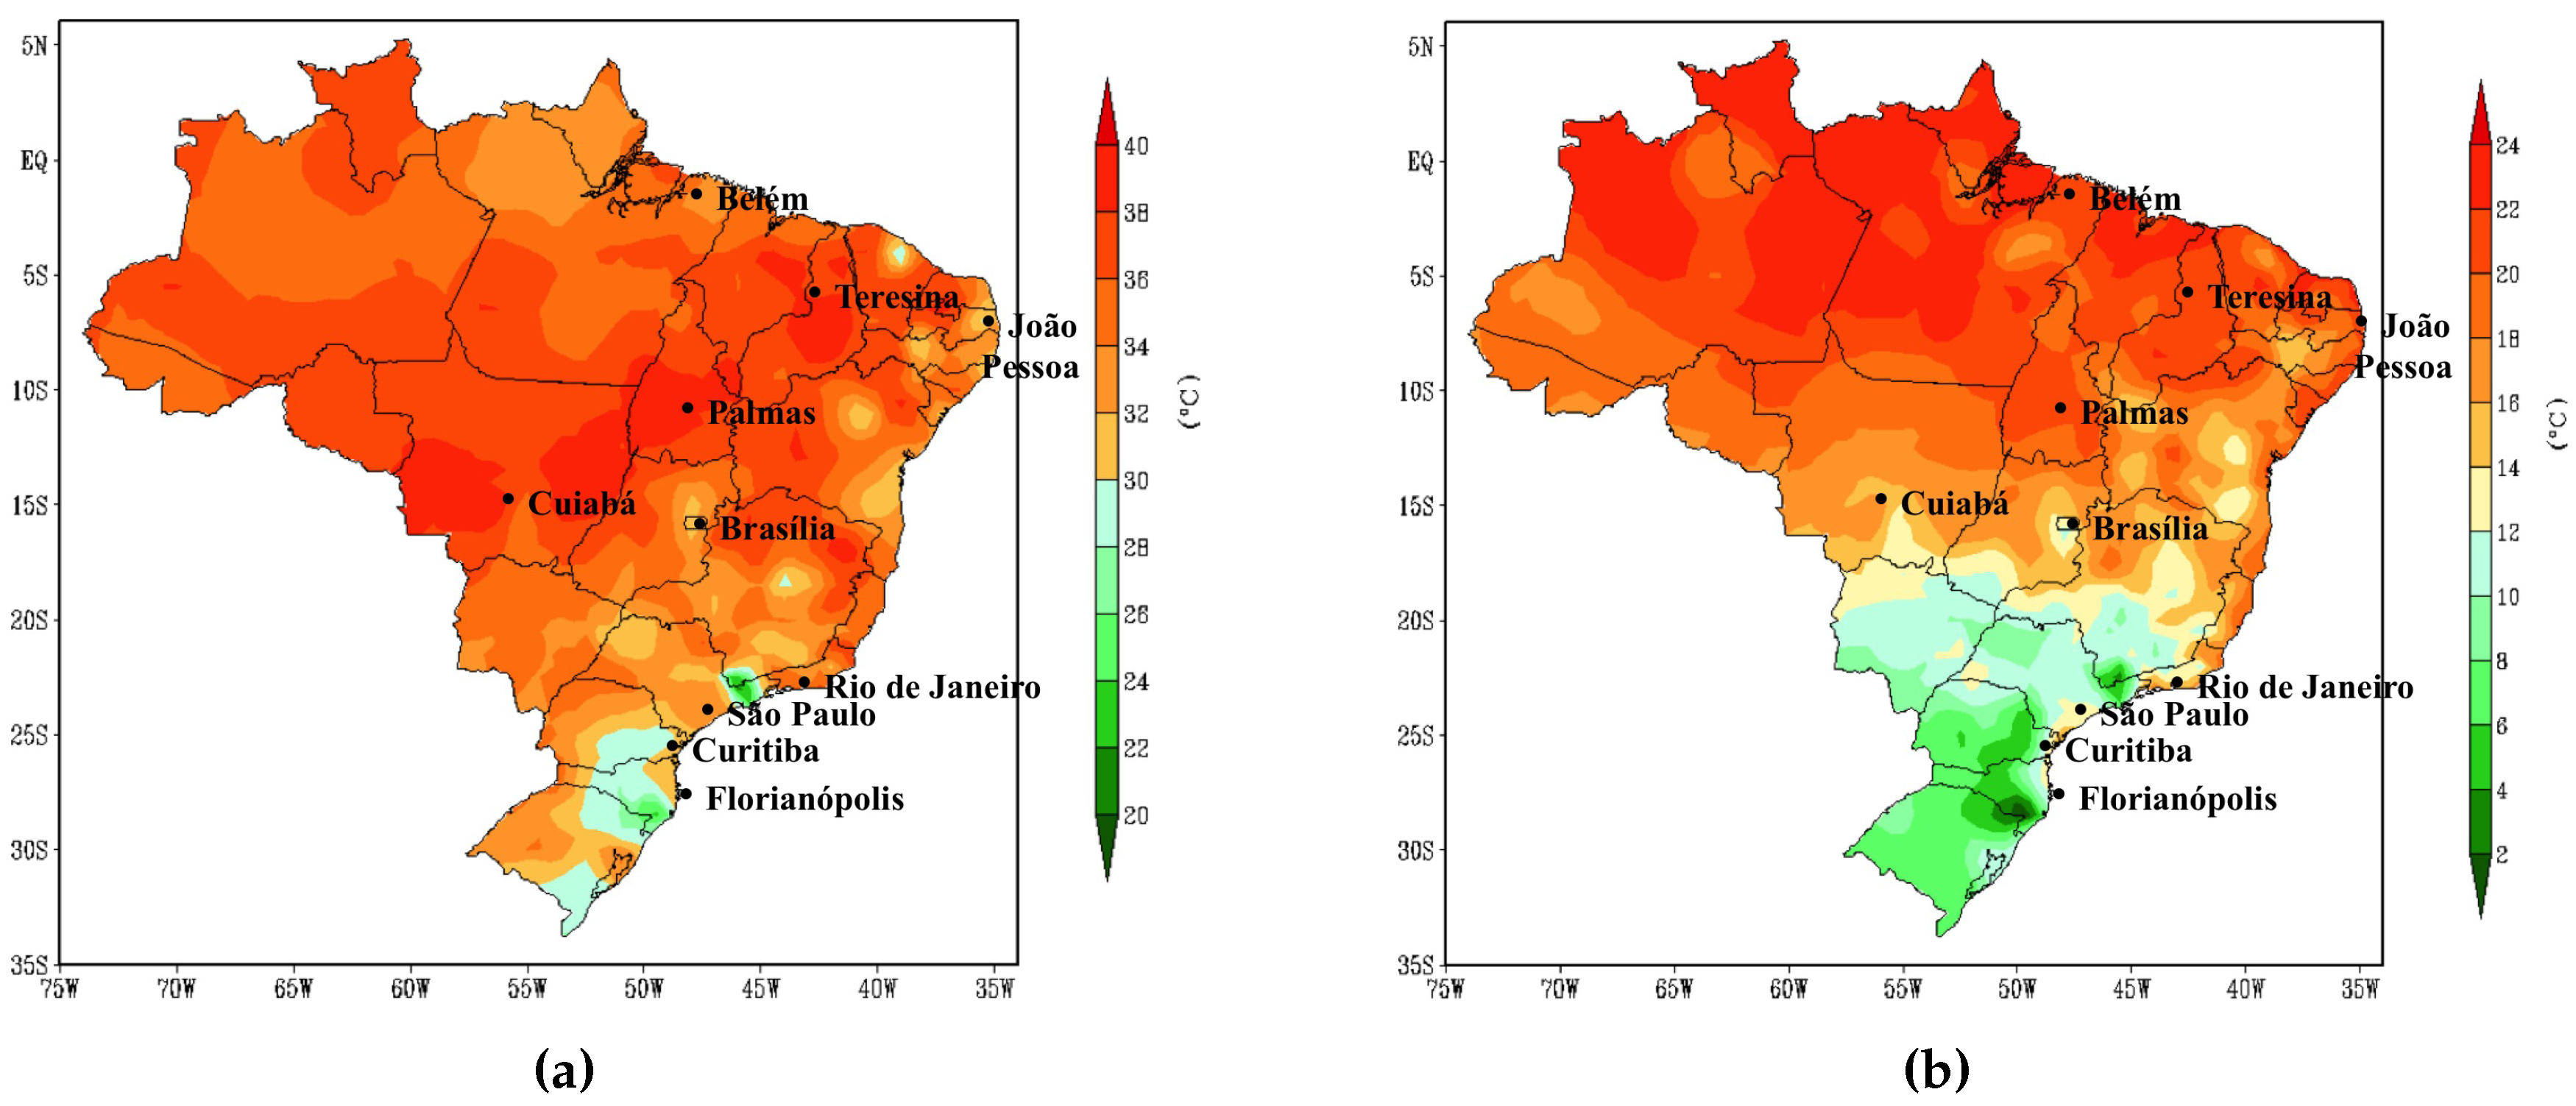
Figure 4 shows the average of the maximum and minimum temperature for the year 2016 [29]. Thus, it is possible to observe that given the dimensionality of Brazil there are several temperature values for each region throughout the year causing different profiles of family behavior in relation to the daily routine.
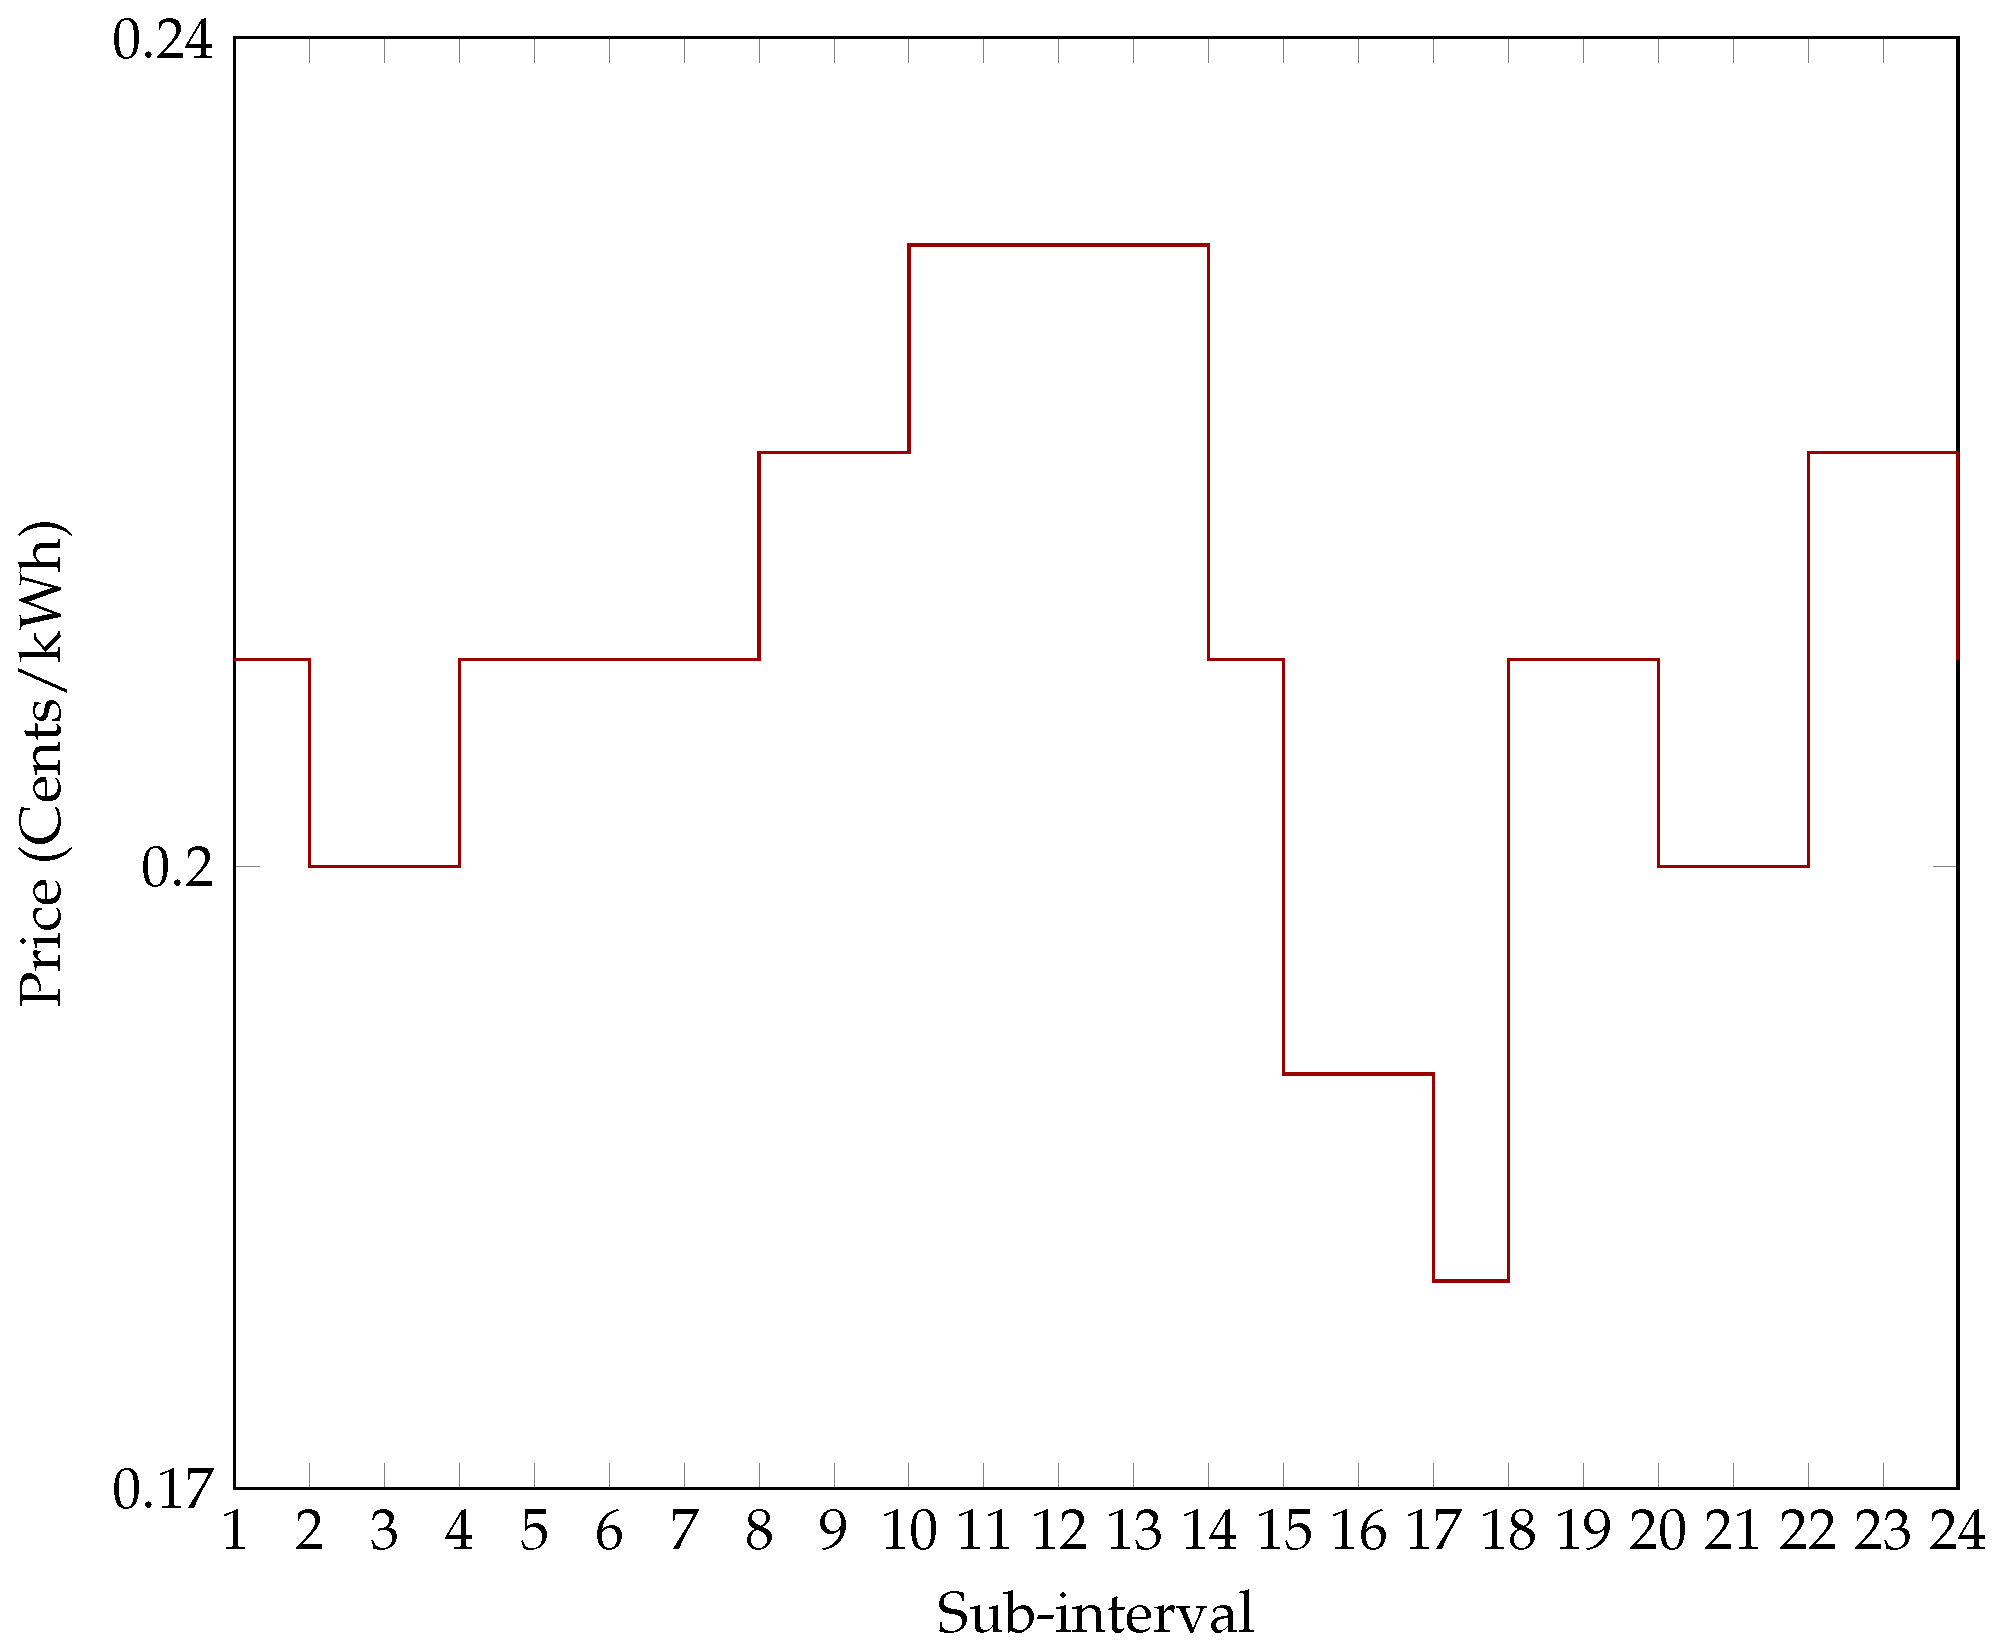
In addition, the dynamic electricity price provided by the Iberian Electricity Market (OMIE) of Portugal [30] was adopted, since Brazil still does not use dynamic charging and, consequently, there is no DR program based on the price in real time in Brazil. However, the GA optimization process allows the inclusion of price information from various types of analyzes (the prediction or the historical record of prices). Consequently, it is not restricted to the use of electricity prices of any specific country or locality, which is the price information is only considered as an input parameter. Figure 5 shows the price for unit power consumption at each sub-interval based on daily values of OMIE for one of the most energy-intensive days (3 July 2015) of Profile I in the city of Teresina-PI.
4.1. Test Scenario
The computational simulations were applied to 10 families, each with two working adults and two adolescents. The families were resident in 10 Brazilian cities (Belém (PA), Palmas (TO), Brasília (DF), Cuiabá (MT), João Pessoa (PB), Teresina (PI), Rio de Janeiro (RJ), São Paulo (SP), Curitiba (PR) and Florianópolis (SC)) located in the five different regions of the country, respectively: North, Central West, Northeast, Southeast and South. These different regions present different climatic characteristics; for example, in the South and Southeast regions, there are certain times of the year when the temperatures are low and at these times the residents do not use air conditioners with such frequency, while the North and Northeast regions have a subtropical climate that is divided into dry and rainy periods, with high temperatures throughout the year. Consequently, these residents use air conditioners much more frequently. Thus, the families selected for the computational simulations have different patterns of electric energy consumption.
The time horizon T was for 240 days, with discretization per hour. Each interval of the horizon corresponds to an hour and contemplates the day with the largest and least consumption of electric energy per month for each family between 1 January 2015 and 31 December 2015, totalling a horizon with a size equal to 5760, according to the consumption standard provided by LPG. Each family was considered to have 29 appliances in their residence. Table 1 presents the residential appliances used in the computational simulations classified according to their respective categories (interruptible and deferrable (), uninterruptible and deferrable () and uninterruptible and non-deferrable ()) An “interruptible” task may be stopped/interrupted before it finishes while an “uninterruptible” task may not be stopped/interrupted before it finishes. The term “non-deferrable” means that the task must start at the first time slot of the operational window, while “deferrable” means that this is not obligatory [24].
In the GA optimization process, a population of 500 chromosomes was used. Therefore, each chromosome (potential solution of the problem) stores a DSA matrix that, for this experiment, has a size of 5760 × 290, which corresponds to 1,670,400 elements of the matrix.
The one-point crossover of the genetic operators and binary mutation are used to create new chromosome populations based on the existing population. The crossover and mutation rates of 0.6 and 0.01, respectively, were found experimentally. Moreover, a rate of 0.1 was used in the elitism technique; therefore 10% of the current population is kept for the following generation. The reproduction chromosomes for the selection method were defined using a size 3 tournament, thus allowing new children to be generated for the population. The algorithm ends when 500 generations (maximum number allowed) is reached, and provides the optimal scheduling of N home appliances over the time horizon T. All these parameters used in the computational simulations involving the GA were obtained through a control mapping with the possible configuration values and, in this way, showed that this configuration can solve the DR problem exemplified in this work.
In addition, some parameters such as Maximum demand for time interval (), Minimum demand for time interval (), Ramping down limit () and Ramping up limit () with values of 3 kW, 0 kW, 1 kWh and 1 kWh, respectively. In addition, each city has a different mdc parameter as each family had a consumption based on the geographic locations with their respective climates and temperatures.
4.2. Simulation Results and Discussion
The computational simulations included two versions of the DR proposed model: a full one and a relaxed version called Proposed Model (WT). The proposed model-WT used by the authors does not contemplate the particularities of operation of the different categories of residential appliances, as the full version of the proposed optimization model, presented in Section 2, does. However, both were used to analyze the impact of the operating characteristics of the different categories of residential appliances on reducing the cost and consumption of electricity as well as the level of satisfaction and comfort of the end consumers with the optimized programming for residential apparatuses. In addition, the optimization models proposed in [23,25] were also used for comparison.
The impact of DR, as well as the application of the proposed DR optimization model was demonstrated though three aspects: the consumption of electric energy; the cost of electricity associated with consumption; and, the level of satisfaction and comfort of the final consumers. The results of the computational simulations show a reduction in the electric energy consumption of each family with the inclusion of the DR program. Table 2 and Figure 6 show a comparison of the electric energy consumption of each family in each city, according to the LPG tool, as well as the values obtained through the GA optimization process using the formulations analyzed in this work.
The models proposed in Conejo et al. [25] and Logenthiran et al. [23] with the GA optimization process to manage the operation of the residential appliances obtained, in the city of Curitiba (PR), for example, a reduction in consumption from 442.10 kWh to 248.43 kWh and 299.64 kWh resulting in a decrease of approximately 43.81% and 32.22%, respectively. On the other hand, the model proposed in this work with the GA optimization technique and its relaxed version obtained in the city Curitiba (PR), a decrease in the consumption from 442.10 kWh to 405.47 kWh and 298.23 kWh totalling a reduction of approximately 8.29% and 32.54%, respectively.
However, the models proposed in Conejo et al. [25] and Logenthiran et al. [23], and the Proposed Model (WT) presented in this work do not consider the different categories of residential appliances, which implies an optimal solution to the problem, but which, when implemented, is not accepted as a practical and feasible solution. This reduction in consumption can result in increased dissatisfaction and discomfort of the final consumers because the different characteristics of each residential apparatus according to the real need of the consumer were not considered in the programming.
In addition, Table 3 shows a comparison of the electric energy consumption of residential appliances every hour in kWh, without DR (base consumption) and with DR guided by the proposed model. The proposed model shifts the load to times when the electricity price is lower (off-peak). For example, the microwave of the family living in Teresina (PI) operates without DR between 14 h and 18 h and with the performance of the proposed model (with DR) its operation is shifted to the time interval between 15 h and 19 h. The performance of the proposed model in comparison to the base consumption shows a satisfactory reduction in the total cost; the total cost of the microwave without the DR reaches R$ 1.14, while with the DR of the proposed model the cost is R$ 1.08, making a saving of R$ 0.06.
Another analysis (Table 4) was carried out to evaluate the impact of the formulations presented in this work to reduce the cost of electricity to final consumers. The models developed by the authors in Conejo et al. [25], Logenthiran et al. [23] and the Proposed Model (WT) obtained the largest reductions in the cost of electricity in the city of Rio de Janeiro (RJ) from R$ 107.13 to R$ 62.07, R$ 73.54 and R$ 73.20, totalling a decrease of 42.06%, 31.35% and 31.67%, respectively, in the final cost of electric energy. The DR optimization model proposed in this study obtained in the city of Rio de Janeiro (RJ) a reduction in the cost of electricity from R$ 107.13 to R$ 99.44, which is a drop of 7.18% in the final cost of electricity.
However, in addition to the reduction of electricity consumption, this significant reduction of cost is only possible in the formulations developed by Conejo et al. [25], Logenthiran et al. [23] and the Proposed Model (WT) because they do not consider the particularities of the different categories of residential appliances, and therefore allow a greater reduction of the cost of electricity to be achieved. Thus, Figure 7 presents a synthesis of the electricity costs associated to the consumption of electric energy of each family according to the LPG tool for the models created in Conejo et al. [25] and Logenthiran et al. [23] and the model proposed in this work.
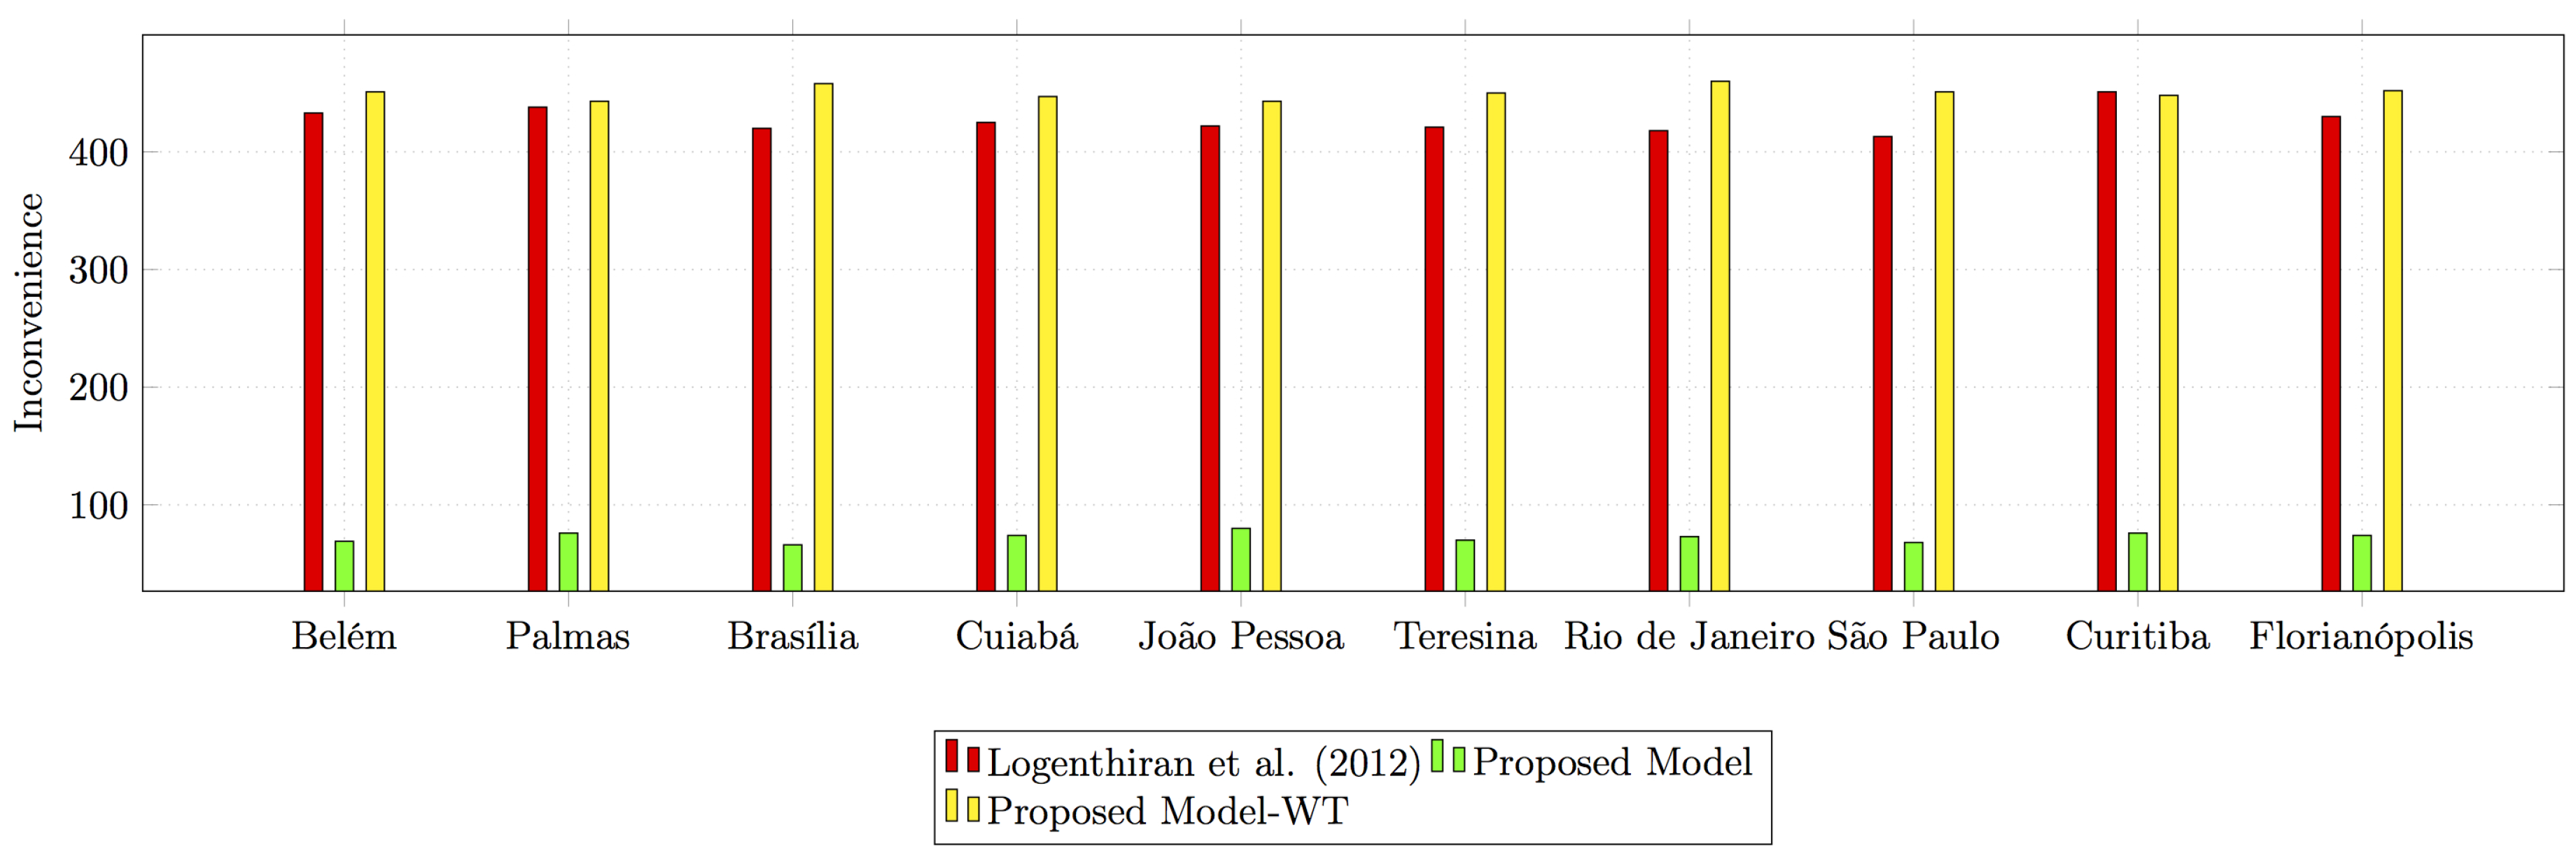
Another analysis was the evaluation of the impact of the inconvenience, defined in Equation (9), which demonstrates how the change in the profile of using residential devices can interfere with the satisfaction and comfort of the final consumers. The results of the computational simulations show that, for example, in Brasília (DF), the model proposed in this study obtained a value of 62 for the level of inconvenience while the Proposed Model (WT) version and the formulation presented by the authors Logenthiran et al. [23] had values of 452 and 418, respectively. Table 5 gives a summary of all the values referring to the level of inconvenience of each family.
Table 5 shows that the proposed DR optimization model had lower inconvenience values than the Proposed Model (WT) version and the model presented by the authors Logenthiran et al. [23]. That is, the model in this study does not cause any significant level of dissatisfaction and discomfort to the final consumers in the face of changing the use of the devices over a time horizon.
The formulations applied by Logenthiran et al. [23] and Proposed Model (WT), Figure 8, caused high levels of inconvenience as they did not differentiate the residential appliance categories in their formulation, while the model proposed in this paper took into account the different particulars of the categories of residential appliances, and consequently managed to reach the very low level of inconvenience.
Inconvenience was not evaluated by the authors in Conejo et al. [25] because the structure of the formulation did not contemplate the load demand per device for each time interval, thus making such an analysis impossible.
The results of the computational simulations show that the GA optimization process using the model proposed in this work managed to effectively manage the different categories of apparatuses in the ten residences. Thus, the proposed model is able to reduce the cost associated with the consumption of electric energy and the level of inconvenience of the families when considering the preferences of the consumers in relation to the use of the residential apparatuses. In addition, the price variation of the electricity in real time and the different geographic locations, climates and temperatures and their respective implications in each region of Brazil were considered by the proposed model.
5. Conclusions
This article presented a DR optimization model that minimizes the cost of electricity associated with consumption for residential consumers. To achieve this cost reduction associated with consumption without harming the satisfaction and comfort of the residential consumer (confirmed by the inconvenience values), the technique of load shifting and the application of a genetic algorithm to manage the programming of the apparatuses based on the price of electric energy in real time and in the operational particularities of the different categories of apparatus was used.
Generally, consumer satisfaction and comfort are not contemplated when developing a DR model, since the main objective of most RD studies is only to minimize the costs. This fact is clearly seen when the model proposed in this work is compared with the other authors and the relaxed version of the proposed model, which achieved significant cost reductions, but did not consider the needs presented in the profile of each consumer and/or the particularities of the different categories of home appliances.
The goal of most DR optimization models is to reduce energy consumption and the final electric bill. However, most models, despite seeming very good in theory are usually unfeasible and not commercially viable as they do not consider the needs of the clients. The DR presented in this paper takes into account the different categories of domestic appliances and consumer satisfaction related to the innovative load scheduling of their domestic equipment, besides the proposed DR is more wide-ranging than the other models. Furthermore, this model is adaptable to all countries and under any energy setup.
The proposal for future research work includes the setting up of multi-objective evolutionary algorithms to evaluate the performance of the proposed model, which consider the inconvenience related to the satisfaction and comfort of residential consumers and maintain the minimization of the cost of electricity associated with consumption. In addition, statistical techniques will be applied to analyze and validate the research.
Acknowledgments
The first author thanks the Coordination of Improvement of Higher Education Personnel (CAPES) for the PROSUP/PRODAD scholarship for the tuition fees of the PhD course in Applied Informatics at the University of Fortaleza (UNIFOR) and also the Foundation for Research Support of the State of Piauí (FAPEPI) for the financial support to publish a scientific article. The third author thanks the National Council for Technological and Scientific Development (CNPq) for the PIBIC scholarships linked to the Federal University of Piauí (UFPI).
Author Contributions
All the authors contributed equally to the work presented in this article. J.M.V. and I.R.S.S. conceived and designed the DR model and wrote the article. P.R.P. and R.A.L.R. helped with guidelines, analyzing the results and conducting research on the thematic approach in this study. All authors read and approved the final manuscript.
Conflicts of Interest
The authors declare no conflict of interest.
References
- Ozturk, Y.; Jha, P.; Kumar, S.; Lee, G. A personalized home energy management system for residential demand response. In Proceedings of the IEEE Fourth International Conference Power Engineering, Energy and Electrical Drives (POWERENG’13), Istanbul, Turkey, 13–17 May 2013; pp. 1241–1246. [Google Scholar]
- Pipattanasomporn, M.; Kuzlu, M.; Rahman, S. An algorithm for intelligent home energy management and demand response analysis. IEEE Trans. Smart Grid 2012, 3, 2166–2173. [Google Scholar] [CrossRef]
- Vardakas, J.S.; Zorba, N.; Verikoukis, C.V. A survey on demand response programs in smart grids: Pricing methods and optimization algorithms. IEEE Commun. Surv. Tutor. 2015, 17, 152–178. [Google Scholar] [CrossRef]
- Chanana, S.; Kumar, A. Demand response by dynamic demand control using frequency linked real-time prices. Int. J. Energy Sect. Manag. 2010, 4, 44–58. [Google Scholar] [CrossRef]
- Setlhaolo, D.; Xia, X.; Zhang, J. Optimal scheduling of household appliances for demand response. Electr. Power Syst. Res. 2014, 116, 24–28. [Google Scholar] [CrossRef]
- Pop, C.; Cioara, T.; Antal, M.; Anghel, I.; Salomie, I.; Bertoncini, M. Blockchain Based Decentralized Management of Demand Response Programs in Smart Energy Grids. Sensors 2018, 18, 162. [Google Scholar] [CrossRef] [PubMed]
- Brusco, G.; Burgio, A.; Menniti, D.; Pinnarelli, A.; Sorrentino, N.; Scarcello, L. An Energy Box in a Cloud-Based Architecture for Autonomous Demand Response of Prosumers and Prosumages. Electronics 2017, 6. [Google Scholar] [CrossRef]
- Wang, Z.; Paranjape, R. Optimal residential demand response for multiple heterogeneous homes with real-time price prediction in a multiagent framework. IEEE Trans. Smart Grid 2017, 8, 1173–1184. [Google Scholar] [CrossRef]
- Ashabani, M.; Gooi, H.B. Multiobjective Automated and Autonomous Intelligent Load Control for Smart Buildings. IEEE Trans. Power Syst. 2017. [Google Scholar] [CrossRef]
- Guerrero-Martinez, M.A.; Milanes-Montero, M.I.; Barrero-Gonzalez, F.; Miñambres-Marcos, V.M.; Romero-Cadaval, E.; Gonzalez-Romera, E. A Smart Power Electronic Multiconverter for the Residential Sector. Sensors 2017, 17. [Google Scholar] [CrossRef] [PubMed]
- Croce, D.; Giuliano, F.; Tinnirello, I.; Galatioto, A.; Bonomolo, M.; Beccali, M.; Zizzo, G. Overgrid: A fully distributed demand response architecture based on overlay networks. IEEE Trans. Autom. Sci. Eng. 2017, 14, 471–481. [Google Scholar] [CrossRef]
- Javaid, N.; Ahmed, F.; Ullah, I.; Abid, S.; Abdul, W.; Alamri, A.; Almogren, A.S. Towards Cost and Comfort Based Hybrid Optimization for Residential Load Scheduling in a Smart Grid. Energies 2017, 10, 1546. [Google Scholar] [CrossRef]
- Roh, H.T.; Lee, J.W. Residential Demand Response Scheduling With Multiclass Appliances in the Smart Grid. IEEE Trans. Smart Grid 2016, 7, 94–104. [Google Scholar] [CrossRef]
- Ma, K.; Yao, T.; Yang, J.; Guan, X. Residential power scheduling for demand response in smart grid. Int. J. Electr. Power Energy Syst. 2016, 78, 320–325. [Google Scholar] [CrossRef]
- Jovanovic, R.; Bousselham, A.; Bayram, I.S. Residential demand response scheduling with consideration of consumer preferences. Appl. Sci. 2016, 6. [Google Scholar] [CrossRef]
- Vivekananthan, C.; Mishra, Y.; Li, F. Real-time price based home energy management scheduler. IEEE Trans. Power Syst. 2015, 30, 2149–2159. [Google Scholar] [CrossRef]
- Samadi, P.; Mohsenian-Rad, H.; Wong, V.W.; Schober, R. Real-time pricing for demand response based on stochastic approximation. IEEE Trans. Smart Grid 2014, 5, 789–798. [Google Scholar] [CrossRef]
- Zhou, S.; Wu, Z.; Li, J.; Zhang, X.p. Real-time energy control approach for smart home energy management system. Electr. Power Compon. Syst. 2014, 42, 315–326. [Google Scholar] [CrossRef]
- Nair, A.G.; Rajasekhar, B. Demand response algorithm incorporating electricity market prices for residential energy management. In Proceedings of the IEEE 3rd International Workshop on Software Engineering Challenges for the Smart Grid, Hyderabad, India, 1 June 2014; pp. 9–14. [Google Scholar]
- Zhao, Z.; Lee, W.C.; Shin, Y.; Song, K.B. An optimal power scheduling method for demand response in home energy management system. IEEE Trans. Smart Grid 2013, 4, 1391–1400. [Google Scholar] [CrossRef]
- Chen, X.; Wei, T.; Hu, S. Uncertainty-aware household appliance scheduling considering dynamic electricity pricing in smart home. IEEE Trans. Smart Grid 2013, 4, 932–941. [Google Scholar] [CrossRef]
- Wang, C.; Zhou, Y.; Wang, J.; Peng, P. A novel traversal-and-pruning algorithm for household load scheduling. Appl. Energy 2013, 102, 1430–1438. [Google Scholar] [CrossRef]
- Logenthiran, T.; Srinivasan, D.; Shun, T.Z. Demand side management in smart grid using heuristic optimization. IEEE Trans. Smart Grid 2012, 3, 1244–1252. [Google Scholar] [CrossRef]
- Chen, Z.; Wu, L.; Fu, Y. Real-time price-based demand response management for residential appliances via stochastic optimization and robust optimization. IEEE Trans. Smart Grid 2012, 3, 1822–1831. [Google Scholar] [CrossRef]
- Conejo, A.J.; Morales, J.M.; Baringo, L. Real-time demand response model. IEEE Trans. Smart Grid 2010, 1, 236–242. [Google Scholar] [CrossRef]
- Holland, J.H. Adaptation in Natural and Artificial Systems. Ph.D. Thesis, University of Michigan, Cambridge, MA, USA, 1975. [Google Scholar]
- Pflugradt, N.D. Modellierung von Wasser und Energieverbräuchen in Haushalten. Master’s Thesis, Technische Universitat Chemnitz, Chemnitz, Germany, 2016. [Google Scholar]
- Deng, R.; Yang, Z.; Chow, M.Y.; Chen, J. A survey on demand response in smart grids: Mathematical models and approaches. IEEE Trans. Ind. Inform. 2015, 11, 570–582. [Google Scholar] [CrossRef]
- INMET. Panorama Geral das Condições Meteorológicas e os Principais Eventos Extremos Significativos Ocorridos no Brasil. 2016. Available online: http://www.inmet.gov.br/portal/notas_tecnicas/Panorama-Geral-2016-Brasil.pdf. (accessed on 15 July 2017).
- OMIE. Electricity Market Price. 2016. Available online: \unhbox\voidb@x\hbox{http://www.omie.es/files/flash/Resultados}Mercado.swf. (accessed on 7 October 2016).
Figure 1.
DSA matrix with T rows and N columns.

Figure 2.
Flowchart genetic algorithm for optimal scheduling of home appliances.

Figure 3.
Average temperatures (°C) for 2016. Source: [29].
Figure 3.
Average temperatures (°C) for 2016. Source: [29].

Figure 4.
Temperatures (°C) for 2016 by cities: (a) average annual maximum temperature; and (b) average annual minimum temperature. Source: [29].
Figure 4.
Temperatures (°C) for 2016 by cities: (a) average annual maximum temperature; and (b) average annual minimum temperature. Source: [29].

Figure 5.
Price for unit power consumption.

Figure 6.
Electricity consumption by city.
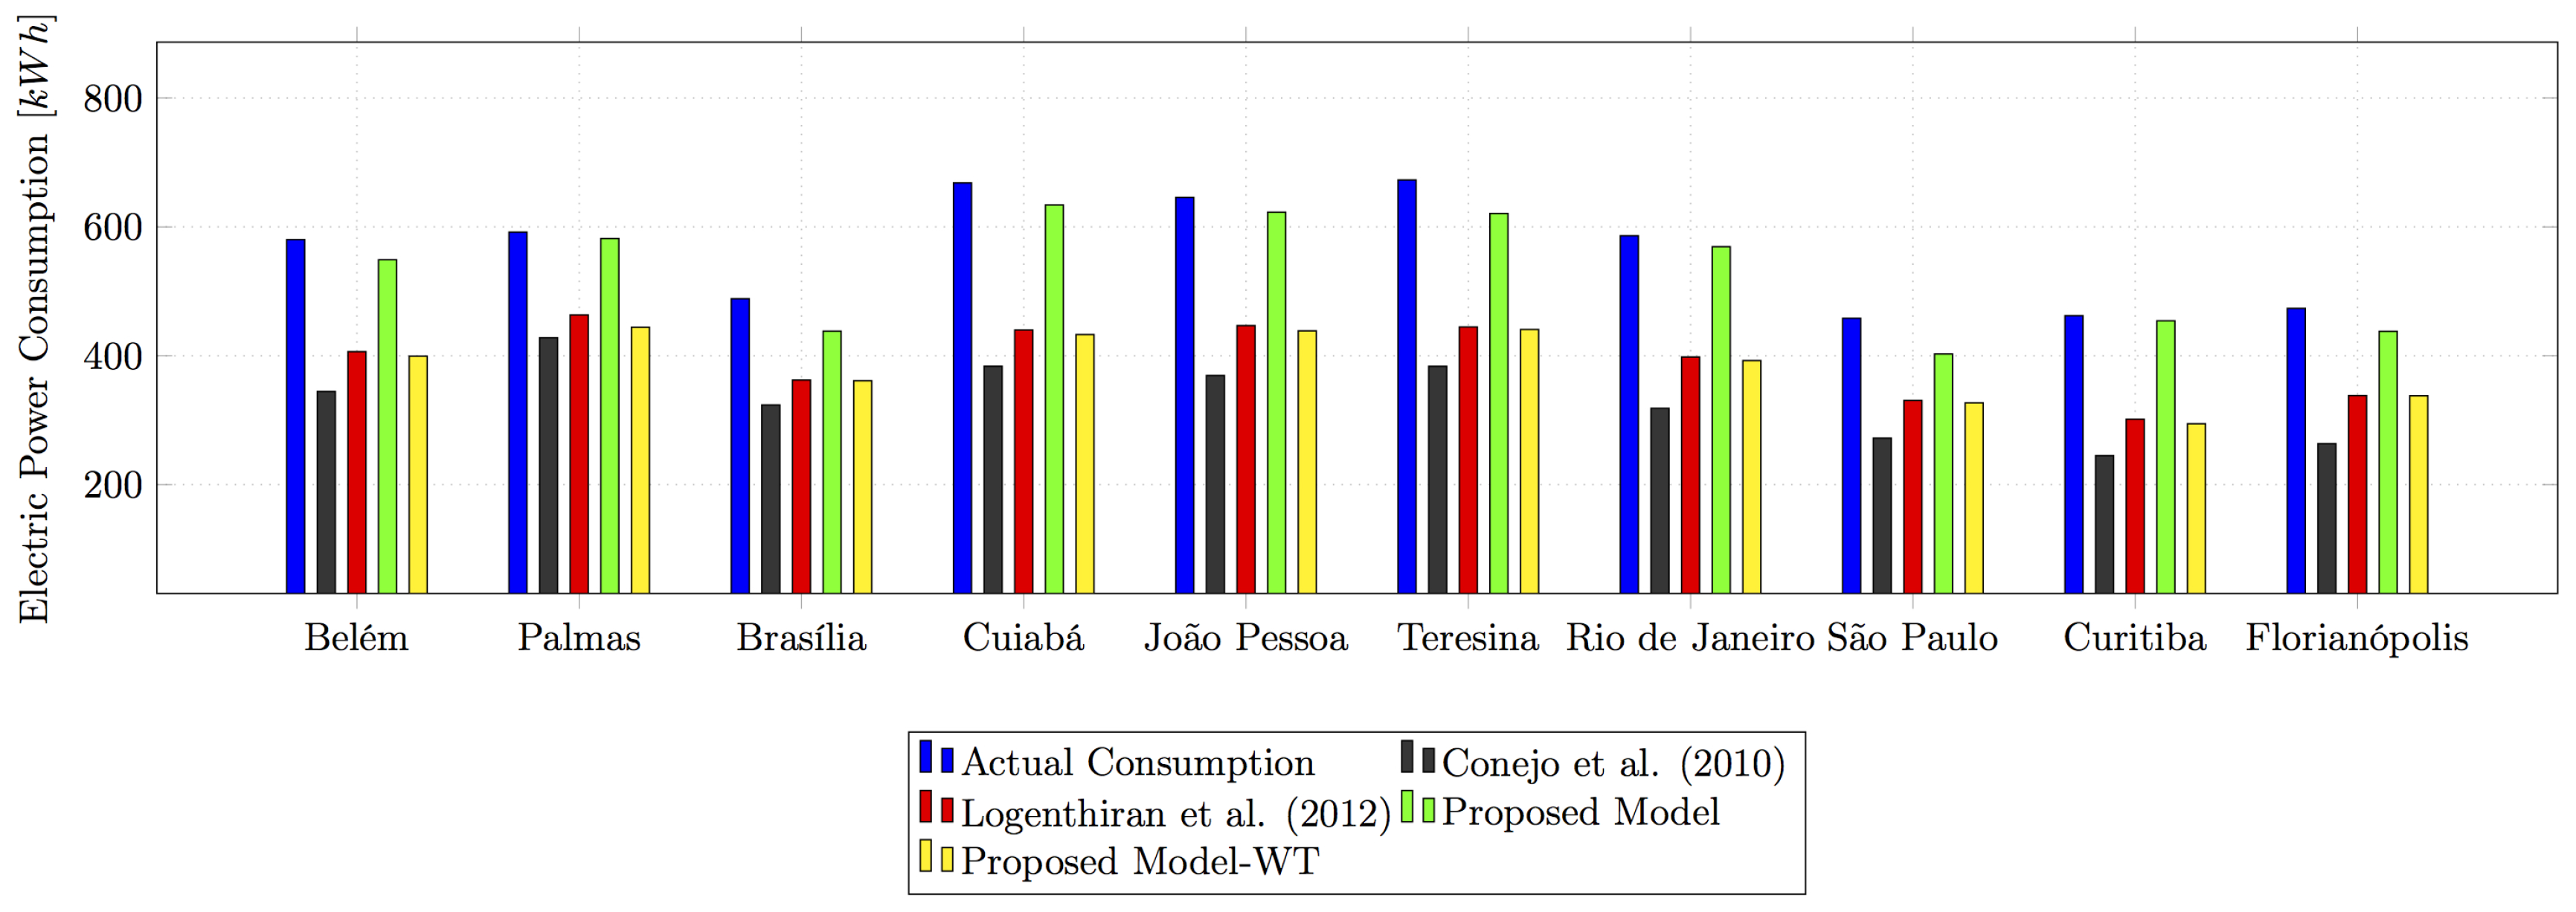
Figure 7.
Cost of electricity by city.
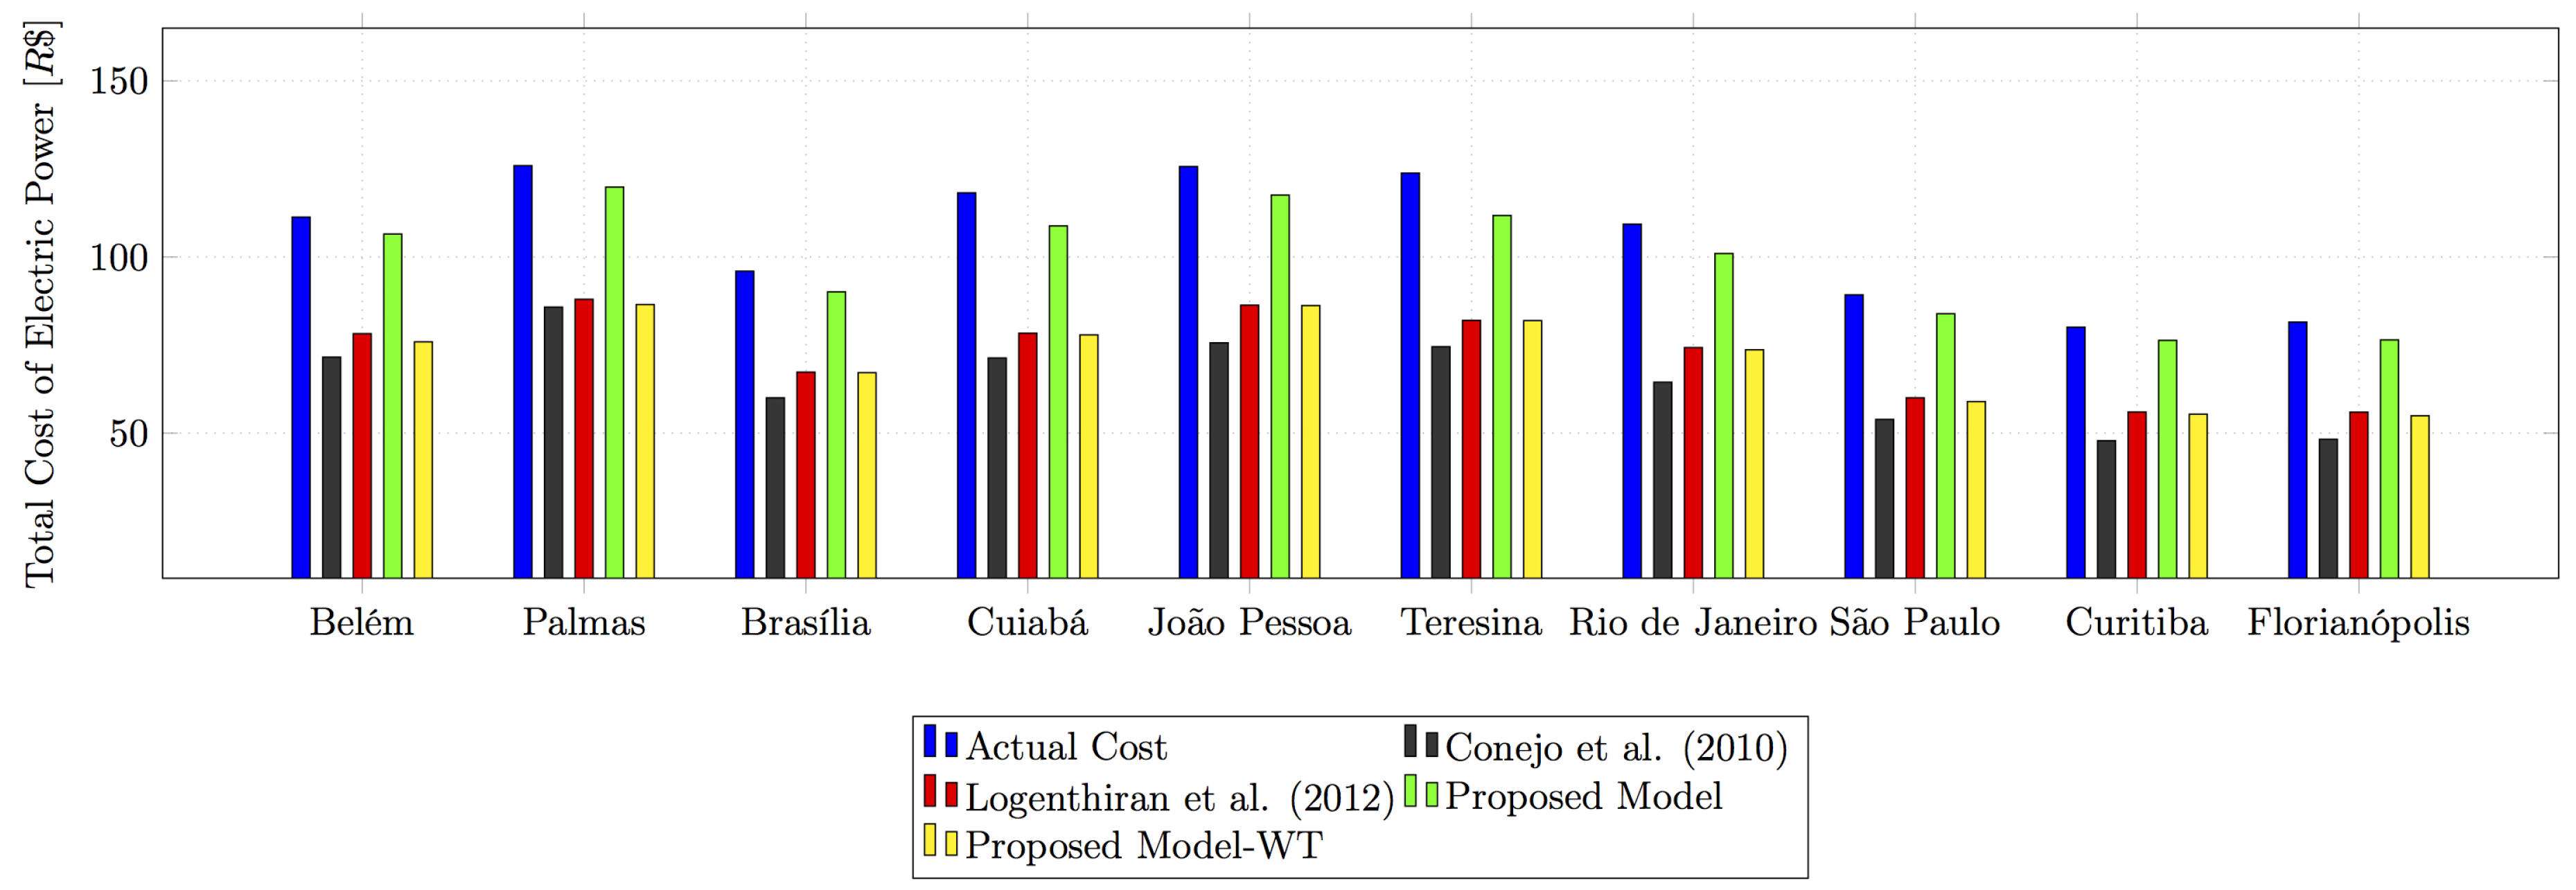
Figure 8.
Level of inconvenience by city.

Table 1.
Home appliance categories.
| Categories | Home Appliances |
|---|---|
| 100 W lamp, 20 W lamp, 60 W lamp, Satelite receptor, TV, Mobile charger, Microsoft Xbox 360, Digital signal receptor, Energy saving lamp, Laptop, CD/DVD Player, Computer, Router, Computer Monitor, Kitchen radio. | |
| Home wine cellar, Steam iron, Hair dryer, Electric stove, Microwave, Electric oven, Juicer, Washing machine, Sandwich maker, Coffee maker. | |
| Air Conditioner, Refrigerator, Freezer, Clothes dryer. |
Table 2.
Electric energy consumption.
| Cities | Without DR (kWh) | With DR (kWh) | Reduction (%) | ||||||
|---|---|---|---|---|---|---|---|---|---|
| [25] | [23] | Proposed Model | Proposed Model (WT) | [25] | [23] | Proposed Model | Proposed Model (WT) | ||
| Belém | 573.85 | 334.74 | 403.40 | 545.51 | 401.25 | 41.67% | 29.70% | 4.94% | 30.08% |
| Palmas | 651.74 | 442.73 | 457.54 | 618.89 | 455.03 | 32.07% | 29.80% | 5.04% | 30.18% |
| Brasília | 498.59 | 305.19 | 359.62 | 486.21 | 357.72 | 38.79% | 27.87% | 2.48% | 28.25% |
| Cuiabá | 657.98 | 377.69 | 444.85 | 602.00 | 442.97 | 42.60% | 32.39% | 8.51% | 32.68% |
| João Pessoa | 639.47 | 371.86 | 442.43 | 598.68 | 440.19 | 41.85% | 30.81% | 6.38% | 31.16% |
| Teresina | 659.93 | 372.96 | 441.75 | 597.32 | 439.81 | 43.48% | 33.06% | 9.49% | 33.36% |
| Rio de Janeiro | 580.18 | 326.33 | 396.99 | 573.05 | 395.28 | 43.75% | 31.57% | 1.23% | 31.87% |
| São Paulo | 463.71 | 275.04 | 325.73 | 440.38 | 323.89 | 40.69% | 29.76% | 5.03% | 30.15% |
| Curitiba | 442.10 | 248.43 | 299.64 | 405.47 | 298.23 | 43.81% | 32.22% | 8.29% | 32.54% |
| Florianópolis | 467.94 | 276.30 | 336.35 | 455.19 | 334.89 | 40.95% | 28.12% | 2.72% | 28.43% |
Table 3.
Comparison of home appliance operation without and with optimization (in kWh).
| Cities | Home Appliances | DR | 01:00 | 02:00 | 03:00 | 04:00 | 05:00 | 06:00 | 07:00 | 08:00 | 09:00 | 10:00 | 11:00 | 12:00 | 13:00 | 14:00 | 15:00 | 16:00 | 17:00 | 18:00 | 19:00 | 20:00 | 21:00 | 22:00 | 23:00 | 24:00 | Total Cost (R$) |
|---|---|---|---|---|---|---|---|---|---|---|---|---|---|---|---|---|---|---|---|---|---|---|---|---|---|---|---|
| Brasília | Computer | Without | 0.3 | 0 | 0 | 0 | 0.3 | 0.3 | 0.3 | 0 | 0 | 0 | 0 | 0 | 0 | 0 | 0 | 0 | 0.3 | 0.3 | 0 | 0.3 | 0 | 0 | 0 | 0.3 | 0.34 |
| With | 0.3 | 0.3 | 0.3 | 0.3 | 0.3 | 0.3 | 0.3 | 0 | 0 | 0 | 0 | 0 | 0 | 0 | 0 | 0 | 0 | 0 | 0 | 0 | 0 | 0 | 0 | 0.3 | 0.32 | ||
| Microwave | Without | 0 | 0 | 0 | 0 | 0 | 0 | 0 | 0 | 0 | 2 | 2 | 2 | 2 | 2 | 0 | 0 | 0 | 0 | 0 | 0 | 0 | 0 | 0 | 0 | 1.48 | |
| Wiith | 0 | 2 | 2 | 2 | 2 | 2 | 0 | 0 | 0 | 0 | 0 | 0 | 0 | 0 | 0 | 0 | 0 | 0 | 0 | 0 | 0 | 0 | 0 | 0 | 1.32 | ||
| Oven | Without | 0 | 0 | 0 | 0 | 0 | 0 | 0 | 0 | 0 | 0 | 0 | 1.5 | 1.5 | 1.5 | 1.5 | 0 | 0 | 0 | 0 | 0 | 0 | 0 | 0 | 0 | 0.84 | |
| With | 0 | 0 | 1.5 | 1.5 | 1.5 | 1.5 | 0 | 0 | 0 | 0 | 0 | 0 | 0 | 0 | 0 | 0 | 0 | 0 | 0 | 0 | 0 | 0 | 0 | 0 | 0.78 | ||
| Stove | Without | 0 | 0 | 0 | 0 | 0 | 0 | 0 | 0 | 0 | 0 | 0 | 3 | 3 | 3 | 3 | 0 | 0 | 0 | 0 | 0 | 0 | 0 | 0 | 0 | 1.68 | |
| With | 0 | 0 | 3 | 3 | 3 | 3 | 0 | 0 | 0 | 0 | 0 | 0 | 0 | 0 | 0 | 0 | 0 | 0 | 0 | 0 | 0 | 0 | 0 | 0 | 1.56 | ||
| Washing Machine | Without | 0 | 0 | 0 | 0 | 1 | 1 | 1 | 1 | 1 | 0 | 0 | 0 | 0 | 0 | 0 | 0 | 0 | 0 | 0 | 0 | 0 | 0 | 0 | 0 | 0.66 | |
| With | 0 | 1 | 1 | 1 | 1 | 1 | 0 | 0 | 0 | 0 | 0 | 0 | 0 | 0 | 0 | 0 | 0 | 0 | 0 | 0 | 0 | 0 | 0 | 0 | 0.66 | ||
| Energy Price (R$/kWh) | 0.22 | 0.21 | 0.20 | 0.20 | 0.20 | 0.20 | 0.22 | 0.26 | 0.27 | 0.27 | 0.27 | 0.27 | 0.28 | 0.28 | 0.27 | 0.27 | 0.26 | 0.26 | 0.26 | 0.24 | 0.26 | 0.27 | 0.24 | 0.21 | – | ||
| Teresina | Computer | Without | 0 | 0 | 0 | 0 | 0 | 0 | 0.3 | 0.3 | 0.3 | 0 | 0 | 0 | 0 | 0 | 0 | 0 | 0 | 0.3 | 0.3 | 0.3 | 0.3 | 0.3 | 0 | 0 | 0.33 |
| With | 0 | 0 | 0 | 0 | 0 | 0.3 | 0.3 | 0.3 | 0 | 0 | 0 | 0 | 0 | 0 | 0 | 0.3 | 0.3 | 0.3 | 0.3 | 0.3 | 0 | 0 | 0 | 0 | 0.28 | ||
| Microwave | Without | 0 | 0 | 0 | 0 | 0 | 0 | 0 | 0 | 0 | 0 | 0 | 0 | 0 | 2 | 2 | 2 | 2 | 2 | 0 | 0 | 0 | 0 | 0 | 0 | 1.14 | |
| With | 0 | 0 | 0 | 0 | 0 | 0 | 0 | 0 | 0 | 0 | 0 | 0 | 0 | 0 | 2 | 2 | 2 | 2 | 2 | 0 | 0 | 0 | 0 | 0 | 1.08 | ||
| Oven | Without | 0 | 0 | 0 | 0 | 0 | 0 | 0 | 0 | 0 | 0 | 0 | 0 | 0 | 1.5 | 1.5 | 1.5 | 1.5 | 0 | 0 | 0 | 0 | 0 | 0 | 0 | 0.71 | |
| With | 0 | 0 | 0 | 0 | 0 | 0 | 0 | 0 | 0 | 0 | 0 | 0 | 0 | 0 | 0 | 1.5 | 1.5 | 1.5 | 1.5 | 0 | 0 | 0 | 0 | 0 | 0.62 | ||
| Stove | Without | 0 | 0 | 0 | 0 | 0 | 0 | 0 | 0 | 0 | 0 | 0 | 0 | 0 | 3 | 3 | 3 | 3 | 0 | 0 | 0 | 0 | 0 | 0 | 0 | 1.41 | |
| With | 0 | 0 | 0 | 0 | 0 | 0 | 0 | 0 | 0 | 0 | 0 | 0 | 0 | 0 | 0 | 3 | 3 | 3 | 3 | 0 | 0 | 0 | 0 | 0 | 1.23 | ||
| Washing Machine | Without | 0 | 0 | 0 | 0 | 1 | 1 | 1 | 1 | 1 | 0 | 0 | 0 | 0 | 0 | 0 | 0 | 0 | 0 | 0 | 0 | 0 | 0 | 0 | 0 | 0.66 | |
| With | 0 | 1 | 1 | 1 | 1 | 1 | 0 | 0 | 0 | 0 | 0 | 0 | 0 | 0 | 0 | 0 | 0 | 0 | 0 | 0 | 0 | 0 | 0 | 0 | 0.66 | ||
| Energy Price (R$/kWh) | 0.18 | 0.14 | 0.13 | 0.13 | 0.13 | 0.13 | 0.13 | 0.13 | 0.14 | 0.15 | 0.16 | 0.15 | 0.14 | 0.14 | 0.13 | 0.11 | 0.09 | 0.10 | 0.11 | 0.13 | 0.16 | 0.19 | 0.18 | 0.16 | – | ||
Table 4.
Total cost of electric energy.
| Cities | Without DR (R$) | With DR (R$) | Reduction (%) | ||||||
|---|---|---|---|---|---|---|---|---|---|
| [25] | [23] | Proposed Model | Proposed Model (WT) | [25] | [23] | Proposed Model | Proposed Model (WT) | ||
| Belém | 109.46 | 69.45 | 77.00 | 104.13 | 76.59 | 36.55% | 29.65% | 4.87% | 30.03% |
| Palmas | 122.89 | 83.86 | 86.84 | 117.47 | 86.36 | 31.76% | 29.34% | 4.41% | 29.73% |
| Brasília | 93.70 | 58.78 | 65.86 | 89.06 | 65.52 | 36.80% | 29.18% | 4.24% | 29.55% |
| Cuiabá | 115.81 | 69.19 | 79.30 | 107.29 | 78.95 | 40.26% | 31.53% | 7.36% | 31.83% |
| João Pessoa | 122.70 | 73.7 | 85.26 | 115.36 | 84.82 | 39.93% | 30.51% | 5.98% | 30.87% |
| Teresina | 120.87 | 72.57 | 81.79 | 110.57 | 81.43 | 39.96% | 32.33% | 8.52% | 32.63% |
| Rio de Janeiro | 107.13 | 62.07 | 73.54 | 99.44 | 73.20 | 42.06% | 31.35% | 7.18% | 31.67% |
| São Paulo | 87.87 | 52.76 | 61.06 | 82.56 | 60.71 | 39.96% | 30.51% | 6.04% | 30.91% |
| Curitiba | 79.37 | 46.68 | 53.26 | 72.04 | 53.01 | 41.19% | 32.90% | 9.24% | 33.21% |
| Florianópolis | 79.35 | 46.33 | 54.64 | 73.95 | 54.42 | 41.61% | 31.14% | 6.81% | 31.42% |
Table 5.
Inconvenience by cities.
| Cities | Inconvenience | ||
|---|---|---|---|
| [23] | Proposed Model | Proposed Model (WT) | |
| Belém | 429 | 66 | 440 |
| Palmas | 435 | 73 | 438 |
| Brasília | 418 | 62 | 452 |
| Cuiabá | 422 | 70 | 440 |
| João Pessoa | 418 | 78 | 440 |
| Teresina | 419 | 66 | 445 |
| Rio de Janeiro | 414 | 70 | 456 |
| São Paulo | 410 | 64 | 447 |
| Curitiba | 447 | 71 | 441 |
| Florianópolis | 426 | 71 | 444 |
© 2018 by the authors. Licensee MDPI, Basel, Switzerland. This article is an open access article distributed under the terms and conditions of the Creative Commons Attribution (CC BY) license (http://creativecommons.org/licenses/by/4.0/).
Share and Cite
MDPI and ACS Style
Veras, J.M.; Silva, I.R.S.; Pinheiro, P.R.; Rabêlo, R.A.L. Towards the Handling Demand Response Optimization Model for Home Appliances. Sustainability 2018, 10, 616. https://doi.org/10.3390/su10030616
AMA Style
Veras JM, Silva IRS, Pinheiro PR, Rabêlo RAL. Towards the Handling Demand Response Optimization Model for Home Appliances. Sustainability. 2018; 10(3):616. https://doi.org/10.3390/su10030616
Chicago/Turabian StyleVeras, Jaclason M., Igor Rafael S. Silva, Plácido R. Pinheiro, and Ricardo A. L. Rabêlo. 2018. "Towards the Handling Demand Response Optimization Model for Home Appliances" Sustainability 10, no. 3: 616. https://doi.org/10.3390/su10030616
Note that from the first issue of 2016, this journal uses article numbers instead of page numbers. See further details here.