Investigation on Performance of a Modified Breakwater-Integrated OWC Wave Energy Converter

Department of Civil Engineering, National Chung Hsing University, Taichung 402, Taiwan
*
Author to whom correspondence should be addressed.
Sustainability 2018, 10(3), 643; https://doi.org/10.3390/su10030643
Submission received: 19 January 2018
/
Revised: 23 February 2018
/
Accepted: 26 February 2018
/
Published: 28 February 2018
(This article belongs to the Special Issue Wave Energy Technologies: A Sustainable Energy Source)
Abstract
:The hydrodynamic performance of the wave power extraction of an innovative modified breakwater-integrated Oscillating Water Column (OWC) wave energy converter is both numerically and experimentally presented in this study. The modified OWC device comprises a non-conventional perforated wall in front of a typical OWC chamber. The air-water two-fluid model, considering the fluid compressibility involved in FLOW-3D solver, is employed for the numerical simulations of the hydrodynamic characteristics of the OWC devices. The numerical simulations of the hydrodynamic performance of the OWC device are first validated by the experimental measurements with a scaled model. The effects of the geometry of the OWC chamber on the hydrodynamic efficiency are then discussed by numerical simulations using a full-scale OWC device under regular waves. The numerical and experimental results show that the present modified device can form a U-type flow pattern by the oscillating water column, thus developing better performance in extracting pneumatic power, when compared with the typical OWC device which does not have the perforated front wall. The results indicate that the present modified OWC device can not only promote the efficiency of the pneumatic power extraction, but can also reduce the wave force acting on the structure.
1. Introduction
In Taiwan, more than 80% of electricity comes from thermal power generation, and fossil fuels are dependent on imports. The authorities are now actively promoting energy-policy in order to mitigate greenhouse gas emissions. On the other hand, Taiwan is surrounded by the sea where the ocean power generation, including wave power, tidal power and ocean-current power, is a natural and worthwhile development for renewable energy options. Of these, strong seasonal winds create considerable wave power potential that may contribute significantly to electrical energy if they are extensively exploited.
A large number of techniques of wave energy converter (WEC) have been proposed, in which the Oscillating Water Column (OWC) device has been the most studied and implemented. The OWC device basically consists of a chamber with submerged open wall and an air-duct connecting the air chamber to a turbine. The incident wave motion through the submerged open can cause water column oscillation in the confined chamber, and then the OWC exhales and inhales air to drive a self-rectifying turbine coupled to a power generator. So far, the prototypes for OWC wave energy converters have largely been deployed into the sea [1]. Among the various types of OWC device, Falcão and Henriques [1] pointed out that the integration of an OWC device into a breakwater (known as a breakwater-integrated OWC) has several advantages, such as access for construction, and the fact that operation and maintenance of the wave energy plant has become much easier. The breakwater-integrated OWC has been constructed successfully in Sakata harbor in Japan [2,3], Mutriku port in Spain [4], and Civitavecchia harbor in Italy [5], among other locations. In recent, by means of large-scale experiments under random waves, Viviano et al. [6] showed that the OWC wave energy converter can be integrated into vertical wall breakwaters to serve as a wave absorber for reducing wave reflection. Naty et al. [7] demonstrated that the OWC system integrated into coastal structures is an economic feasible proposal for the Mediterranean port. There are other WEC devices integrated with the breakwaters proposed for overtopping wave energy conversion [8,9,10]. Nevertheless, there are about three to four typhoons in average a year attacking Taiwan’s coast, and the typical OWC device without any protective equipment may suffer large wave force when the storm waves impact on it. An improvement of a breakwater-integrated OWC device involving a non-conventional perforated front wall is thus proposed in this paper. Compared with the impermeable structure, wave force acting on the porous structures is relatively reduced [11,12,13]. Therefore, the present modified OWC device is anticipated to work for not only promoting the efficiency of the WEC in general, but also enduring the large wave force impact on the structure during storms.
The hydrodynamic performance of OWC devices has been examined analytically in a number of studies since the 1970s. Evans [14] presented an approximate analytical solution based on a potential theory for the efficiency of an OWC device consisting of two submerged plates. Evans and Porter [15] then investigated the typical OWC device in finite depth water using the linear wave theory. Large circular OWC devices installed at the tip of a breakwater [16], along a straight coast [17], and at a coastal corner [18] were investigated analytically by the linearized theories of wave radiation and diffraction.
As a result of the significant development of computational fluid dynamics (CFD), numerous works have successfully implemented numerical simulations for the hydrodynamics of OWC devices. Zhang et al. [19] presented a numerical model based on a level-set immersed boundary method to simulate the hydrodynamic performance of the OWC device with different drafts of the front wall of the chamber. Based on Fluent CFD software, Liu et al. [20] investigated the nozzle effects of the chamber-duct system on relative amplitudes of the free water surface in the chamber and air flow rate in the duct. Also, by using Fluent code, EI Marhani et al. [21] simulated the flow characteristics in the components of an OWC system. Iturrioz et al. [22] developed a simplified time-domain model to investigate the hydrodynamic appearances and efficiency of a fixed detached OWC with different aperture sizes. López et al. [23] studied the optimum turbine-chamber coupling for a given OWC employing STAR-CCM+ code based on RANS equations. Ning et al. [24,25] investigated the hydrodynamic performance of OWC devices based on a time-domain higher-order boundary element method. Iturrioz et al. [26] employed OpenFOAM for the three-dimensional simulation of an OWC, which was validated by the laboratory measurements. Based on Fluinco model, Torres et al. [27] studied the turbine power output of an OWC device by using a hydrodynamic-aerodynamic coupled model. Elhanafi et al. [28] also applied STAR-CCM+ code to investigate the impacts of scaling and air compressibility on the OWC performance. Kuo et al. [29] employed FLOW-3D to simulate the interaction behavior between air and water for an OWC caisson breakwater. Crespo et al. [30] applied a smoothed particle hydrodynamics (SPH) code for simulating a floating OWC moored to the seabed.
As for the physical models of OWC, Sarmento [31] performed experiments to validate the oscillating surface pressure theory of Sarmento and Falcão [32]. Tseng et al. [33] conducted model tests to investigate the energy-conversion efficiency of a shoreline wave-power system. Boccotti et al. [34] performed a small-scale field experiment on a breakwater embodying an OWC chamber with a small opening. Morris-Thomas et al. [35] experimentally studied the wave interaction with the OWC chamber and the power take-off efficiency. He et al. [36] carried out experiments on the hydrodynamic performance of a floating breakwater with OWC chambers. López et al. [37] experimentally investigated the flow fields in an OWC by means of particle imaging velocimetry. Several studies of physical tests were carried out as well to validate numerical or theoretical solutions [28,29,38,39].
The objective of this study is to propose a modified breakwater-integrated OWC and to investigate the hydrodynamic performance by using experiments and numerical simulations. The configuration of the present modified OWC is illustrated in Section 2. The 3D CFD modeling and the definition of the hydrodynamic efficiency are presented in Section 3 and Section 4, respectively. Section 5 illustrates the experiments and validations of the numerical simulations. Then the effects of the geometry of the OWC device on the hydrodynamic efficiency are discussed in Section 6. The comparisons of the hydrodynamic efficiency between the present and typical OWC devices are demonstrated in Section 7. Finally, the main conclusions of this study are presented in Section 8.
2. Configuration of the Modified OWC
The present study proposes a modified breakwater-integrated OWC device which is anticipated to be installed into the caisson breakwater of Taichung Harbor in Taiwan, where a 1330 m long breakwater was extended in 2003 to defend against strong seasonal wind waves, in which the average significant wave height and wave period in winter are 2.2 m and 7.0 s, respectively. The vertical caisson breakwater is mounted on a low rubble mound foundation, in which the upright part is designed to endure the impact of large force by the storm waves. The significant wave height and period of storm waves could reach 5.7 m and 9.5 s respectively according to the history records [40]. The present modified OWC device could be incorporated into the existing caisson to capture wave power and to be capable of protecting the original breakwater. The expansion plan of Taichung Harbor [41] is now undergoing development, and the present OWC device is also expected to be integrated into the new breakwaters.
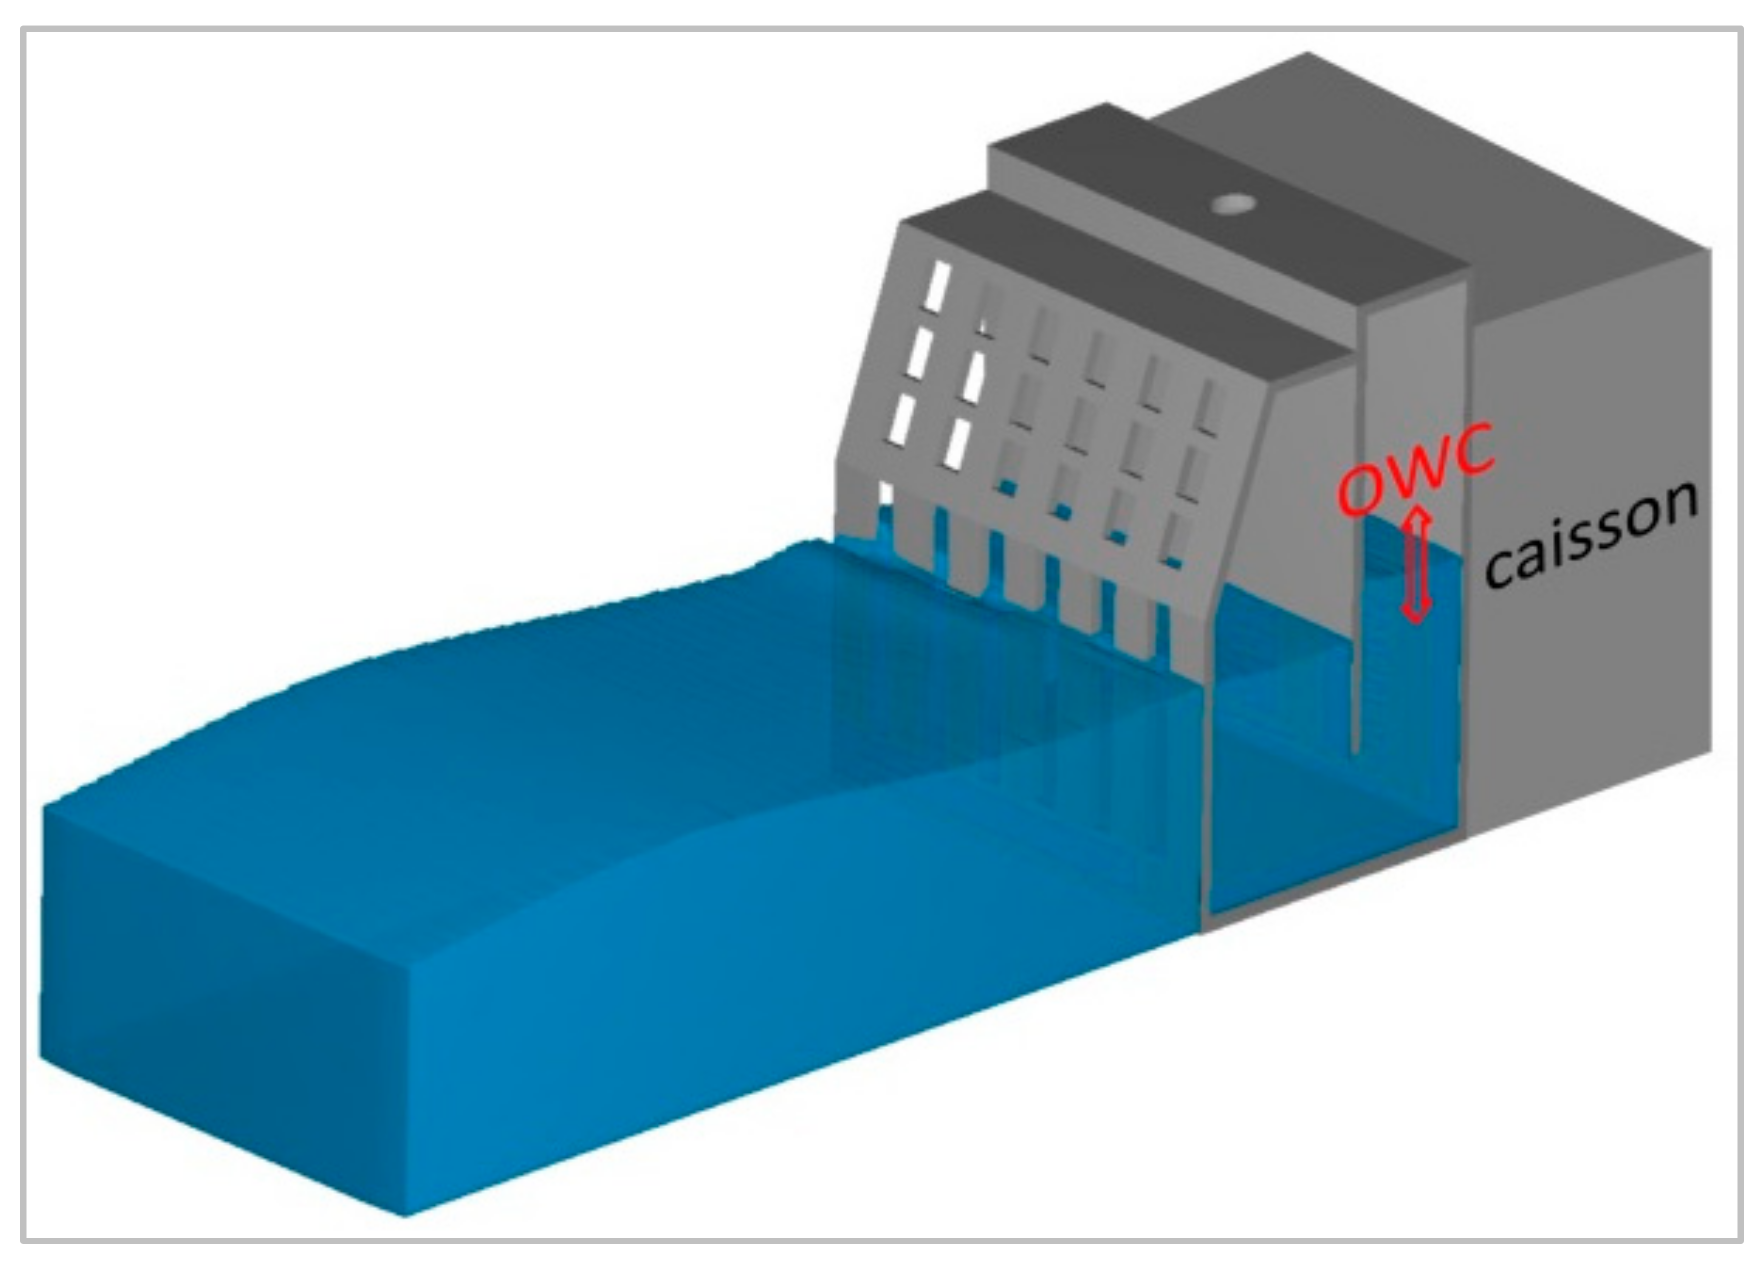
Figure 1 illustrates the 3D sketch of the configuration of the present modified breakwater-integrated OWC device, which comprises a perforated front wall, an OWC chamber, and a caisson breakwater. The perforated front wall consists of a vertical slot part below the water level and a sloping-slot part above the water level. The incident wave energy transmits through the perforated front wall and the submerged open wall into the OWC chamber, and causes an oscillating water column in the chamber. The oscillating water column inside the chamber then alternately compresses and decompresses the trapped air to flow through a circular orifice on the roof of the chamber. It is noted that, under the storm surge situation, the sloping-slot part is expected to dissipate energy of storm waves and reduce the wave impact directly on the OWC chamber and caisson breakwater.
The major difference between the present modified OWC device and the typical OWC device is the modified device has a perforated front wall in front of the OWC chamber (named as the present OWC device hereafter) but the typical one does not have the perforated front wall (named as the typical OWC device hereafter). Figure 2 shows the sketches of the present and typical OWC devices.
3. 3D CFD Modelling
Elhanafi et al. [28] indicated that the air must be modelled as a compressible fluid in a full-scale OWC device but the air compressibility can be ignored for a small model scale. To simulate this two-fluid problem including air and water behaviors inside the OWC chamber considering the fluid compressibility, the 3D CFD model FLOW-3D [42] is applied in the present study. FLOW-3D provides exclusively the FAVOR (fractional area/volumes obstacle representation) technique [43] to efficiently represent the complex obstacle and uses the true Volume of Fluid (VOF) method [44] to track the fluid interfaces. The three-dimensional mass continuity equation and the momentum equation are represented by
where the subscripts of i and j = 1, 2, 3 represent x-, y- and z-directions, xi and xj represent Cartesian coordinates, ui and uj are the ensemble-averaged velocity components in subscript direction, t is the time, p is the ensemble-averaged pressure intensity, ρ is the fluid density, gi is the gravitational acceleration, μ is the absolute viscosity, VF is the fractional volume open to the flow, A is the fraction area for the subscript direction, and is the Reynolds stresses term. The above equations are identical to Reynolds-averaged Navier-Stokes (RANS) equations as VF and A are equal to 1. In the current numerical simulation, the Renormalization Group method (RNG turbulent model) is implemented to model the Reynolds stresses term. The RNG model was originally derived by Yokhot and Orszag [45] based on k-ε turbulent model and improved by Yakhot et al. [46] with scale expansions for the Reynolds stress and production of dissipation terms. Speziale and Thangam [47] indicated that the RNG model can be a useful turbulence model for scientific calculations and practical engineering. The reliability of RNG model has been demonstrated for a wider class of wave-structure interaction problems [48,49].
The internal energy equation has to be included when the air flow inside the chamber is considered as a compressible flow. It is expressed as
where I is the macroscopic mixture internal energy.
In the numerical simulations, the incident wave conditions were generated at the inlet boundary based on the nonlinear waves by using Fenton’s Fourier approximation method [50]. No-slip boundary conditions are imposed on all solid surfaces of the assigned structure. The outflow boundary is treated by the continuative boundary, in which the boundary condition consists of zero normal derivatives at the boundary for all quantities. Tangential stresses at free surfaces are zero because of vanishing velocity derivatives across the surface. Regarding to the turbulence condition at wall boundaries, FLOW-3D specified values of turbulent kinetic energy and turbulent dissipation at mesh locations adjacent to wall boundaries based on a log-law-of-the-wall velocity profile. FLOW-3D used the finite difference approximation for discretizing each equations and executed numerical computations by associating with FAVOR technique and true volume of fluid method. More detailed information on the numerical schemes associated with FAVOR technique can be found in the FLOW-3D manual [42].
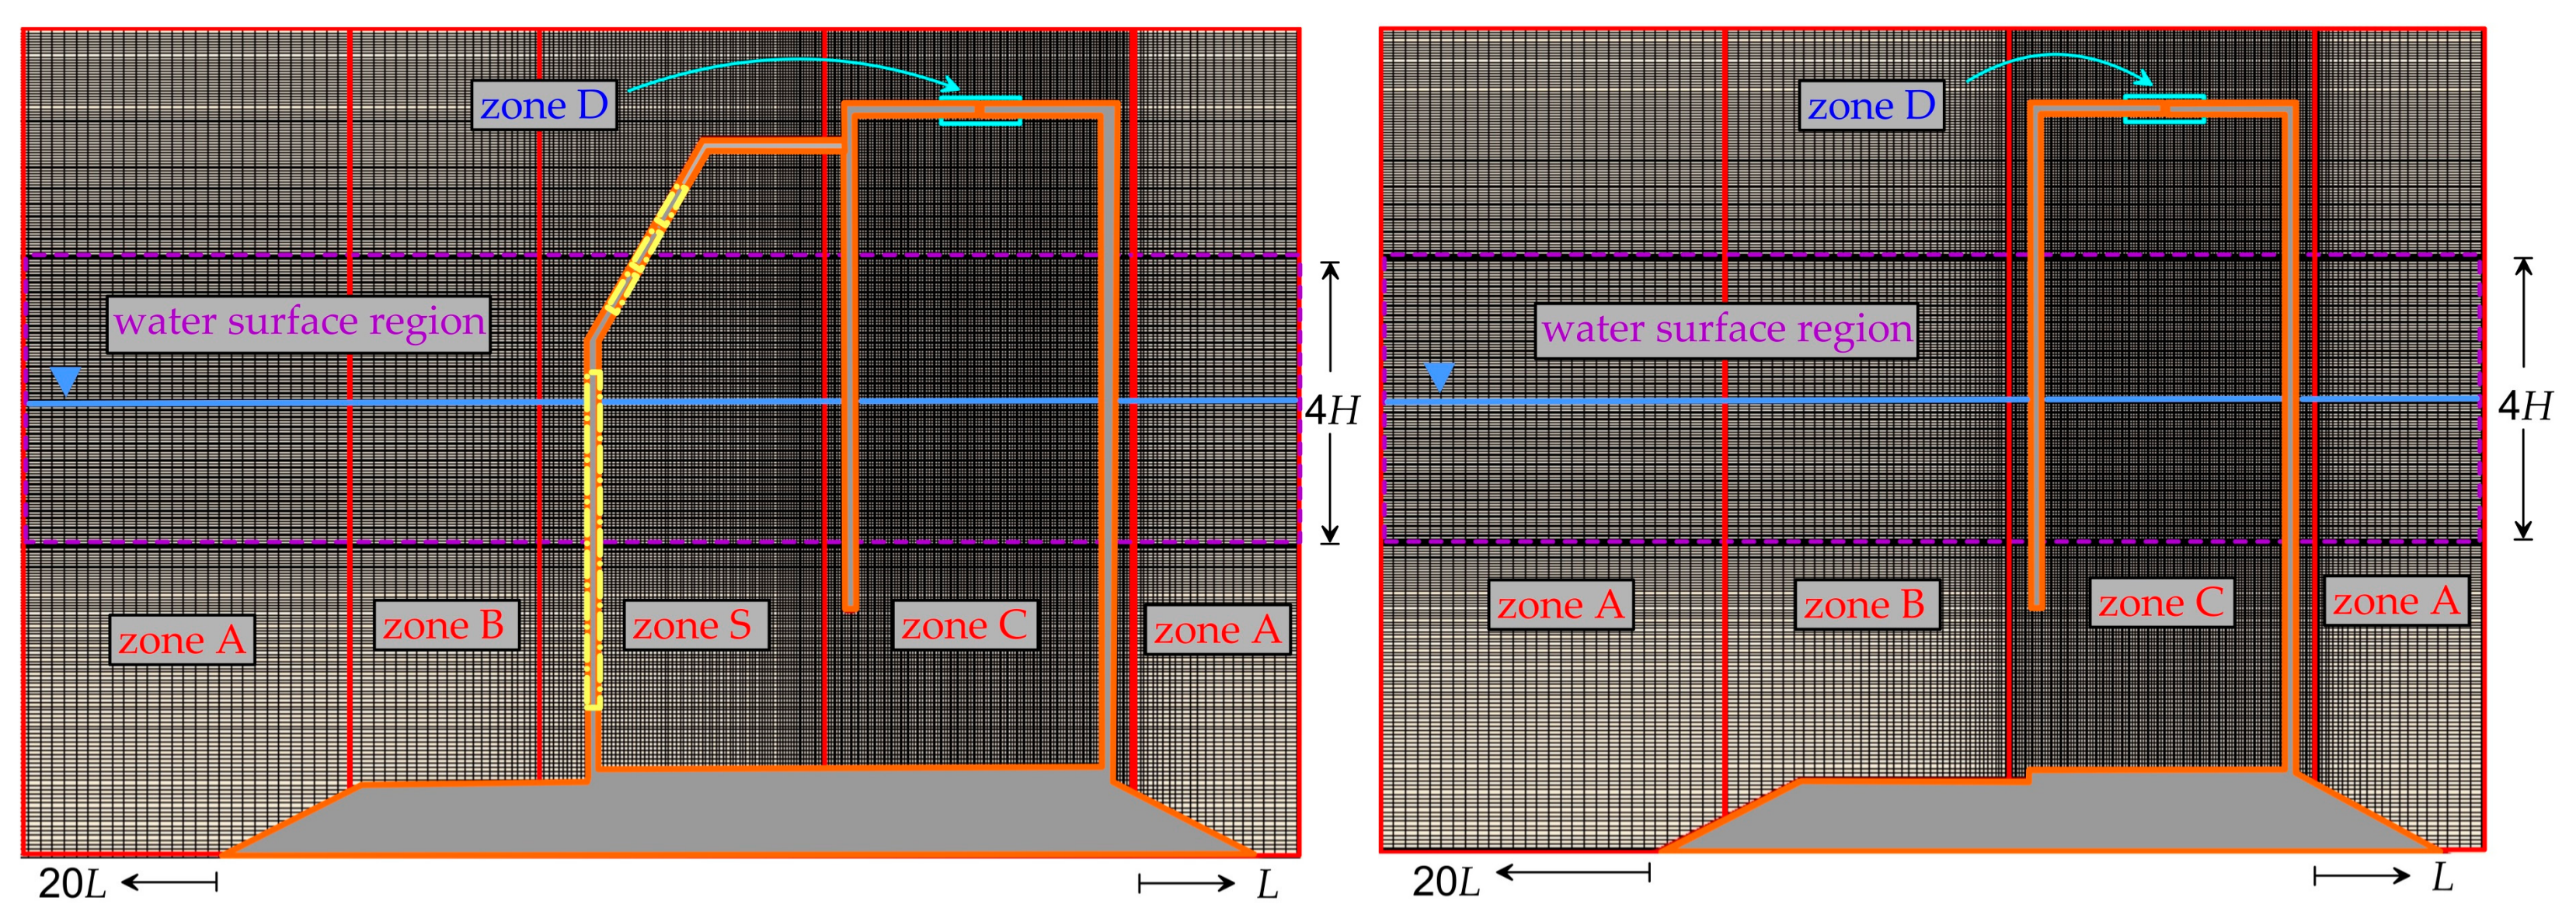
The computational meshes are performed using the mesh generator in FLOW-3D which is capable of generating intricate meshes. After appropriate numerical convergence tests, seven mesh blocks and six mesh blocks are respectively performed for the present and typical OWC devices, as shown in Figure 3 and Table 1, in which the mesh at the zones of free surface and OWC devices are refined. The fluid domain before the assigned structure has a length of 20 L (L is the considered wavelength) to sufficiently collect the data length with eight wave periods without getting undesired data due to the wave reflection affecting the incoming wave.
4. OWC Hydrodynamic Efficiency
The average pneumatic power extracted by an OWC device per unit width during one wave period can be calculated by
where Δp(t) is the instantaneous air pressure inside the chamber, q(t) is the instantaneous flowrate through the orifice, PE is the instantaneous pneumatic power, T is the wave period, and w is the width of the OWC chamber.
The hydrodynamic efficiency, or conversion efficiency, is generally defined by the ratio of average pneumatic power and the average incident wave power [23,24,25,26,27,28,29,35,38], given using
where Pw is the time-average energy flux of the incident wave per unit width, that is, wave power, which is defined as the product of the wave energy density and the group velocity.
Considering the velocity profile over the flow cross-sectional area is non-uniform distribution, the flowrate in Equation (4) can be defined by
where Ao is the area of the orifice, is the air velocity profile at the orifice, is the air velocity at the center of the orifice, and Cc is a constant.
If the flowrate is represented by using the velocity at the center of the orifice, the value of constant Cc has to be determined prior. The numerical results of the representative velocity distribution across the orifice is shown in Figure 4 using the experimental condition (shown in Table 2) of incident wave height Hi = 0.0345 m, wave period T = 0.875 s and water depth h = 0.21 m. As indicated in this figure, the computed velocity profile of the air flow in the orifice is in good correlation with the empirical power-law representation for a typical turbulent flow [51] by using
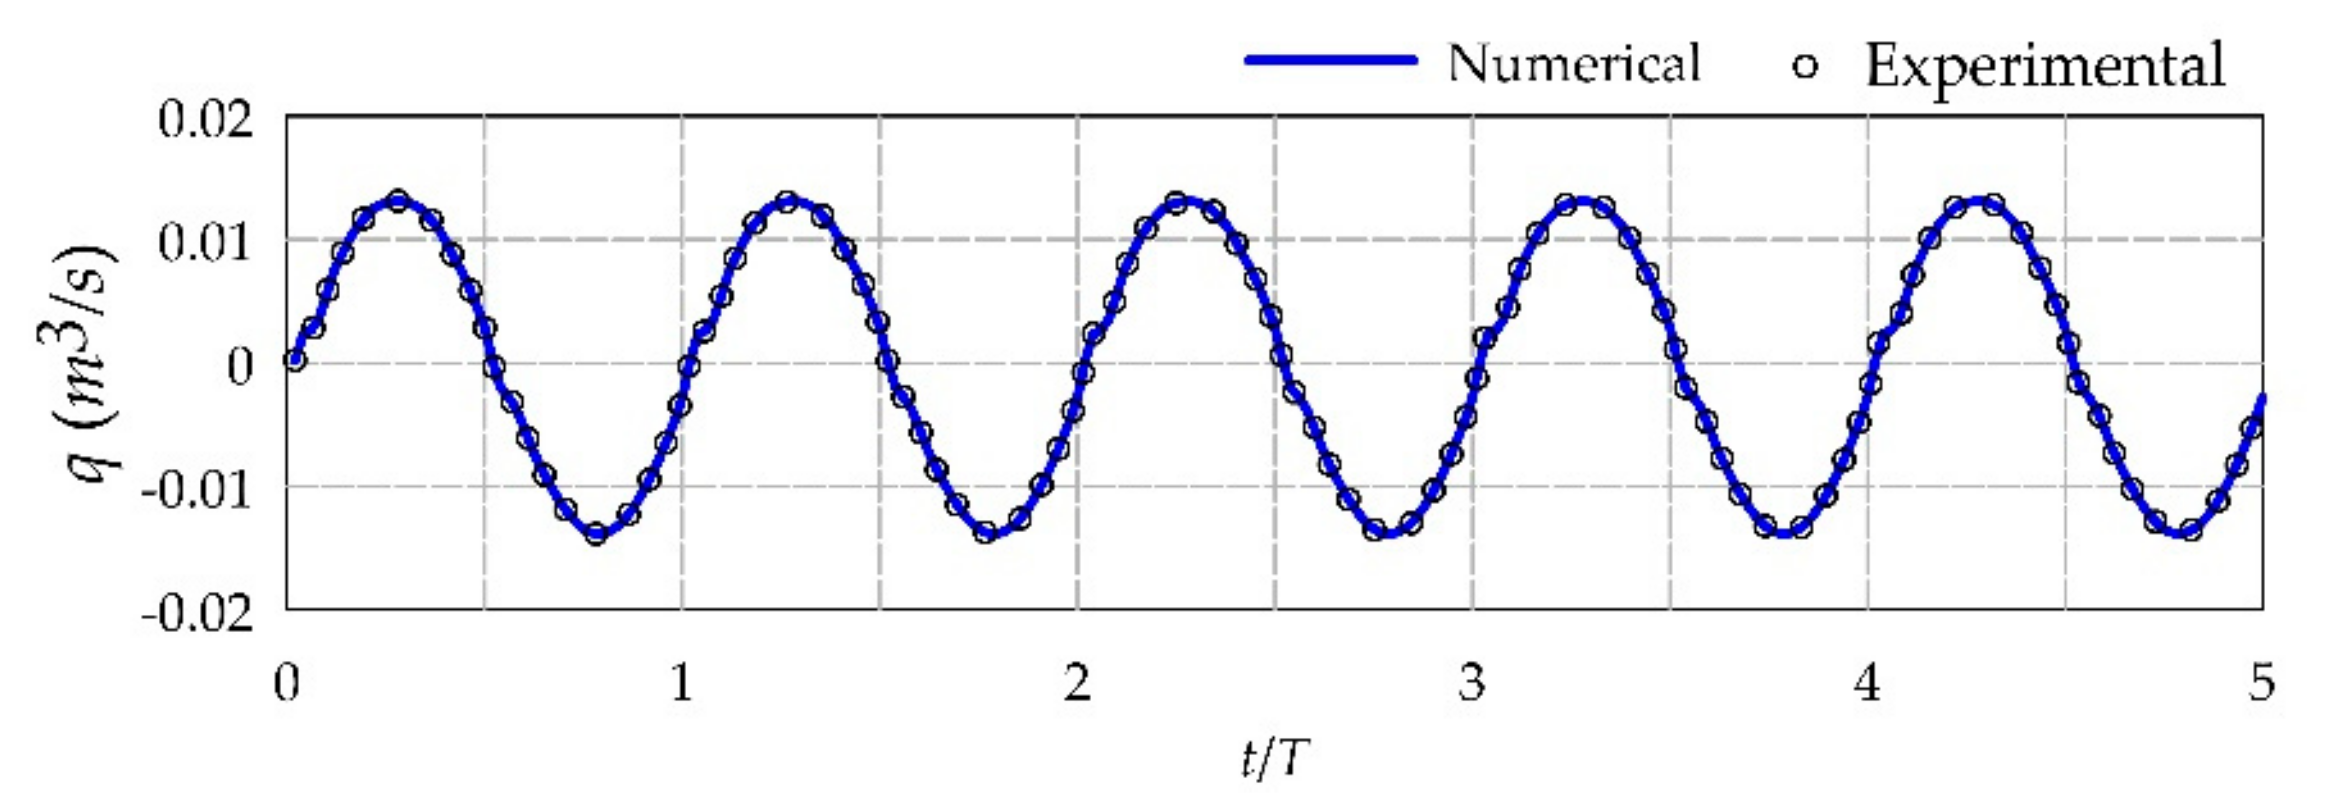
in which n = 7, that is the well-known one-seventh power law, where R is the radius of the circular orifice and r is the radial coordinate. As a result, the constant Cc = 0.82 is obtained. Figure 5 depicts that the numerical result is in good agreement with the experimental result of the flowrate through the orifice, which is obtained using for experimental measurement and using for numerical simulation. The positive and negative values of the flowrate mean the quantities of air exhalation and inhalation through the orifice, respectively.
5. Experiments and Validations
5.1. Experiments
The experiment on the hydrodynamic performance of the modified OWC device was conducted in the 15 m long, 50 cm wide and 60 cm deep wave flume. The situation of the typical OWC device was also performed in experiments. The flume is equipped with a piston-type regular wave generator at one end and a wave-absorber at the other end. Both sides of the flume are bounded by strengthened glass to allow observation of the flow patterns. The sketch of experimental set-up is shown in Figure 6. Two capacitance-type wave gauges with resolution of 0.1 mm were used to measure the water surface profiles, in which the gauge G1 was situated 2.5 m from the wavemaker to confirm the incident wave condition and the gauge G2 was probed inside the OWC chamber to measure the wave profile of the oscillating water column. The instantaneous air flow velocity at the orifice was measured by using two Pitot tubes. The Pitot tubes were connected with an ALMEMO® (Ahlborn GmbH, Holzkirchen, Germany) measuring connector and data acquisition system to read the instantaneous air dynamic pressure with resolution of 0.1 Pa. The air velocity was then obtained directly by means of the ALMEMO® View software which includes programming for automatic atmospheric pressure compensation. The data records of all measurements were taken with eight wave periods and implemented before the incoming wave was affected by the undesired wave reflection from the assigned structure.
In addition, the technique of flow visualization by means of an argon-ion laser beam (2.5 W, 514 nm for steady work) and a high-speed CCD camera was employed to observe the flow patterns of the OWC. The laser beam was guided by using three aluminum-coated mirrors (reflectivity over than 97%) to the sheet optic to produce a fan-shaped laser sheet. During the experiments, titanium dioxide particles were evenly distributed into the observation area, where they were illuminated by the laser sheet.
In order to visualize the flow characteristics, the models of OWC device in experiments were made of acrylic board with 1 cm thickness. The porosity of the perforated front wall (λ) used in experiments is 25%. The seasonal wave conditions of Taichung Harbor were considered in experiments. Using the model scale of 1:64 based on Froude’s similitude law, the incident wave height H = 0.0345 m with wave periods T = 0.875 s was performed in experiments. The water depth in experiments was set h = ho = 0.21 m (kho = 1.28, k is the wave number), that is, the foundation was not placed below the OWC device. The experimental conditions are listed in Table 2.
5.2. Validations
5.2.1. Hydrodynamic Performance Parameters
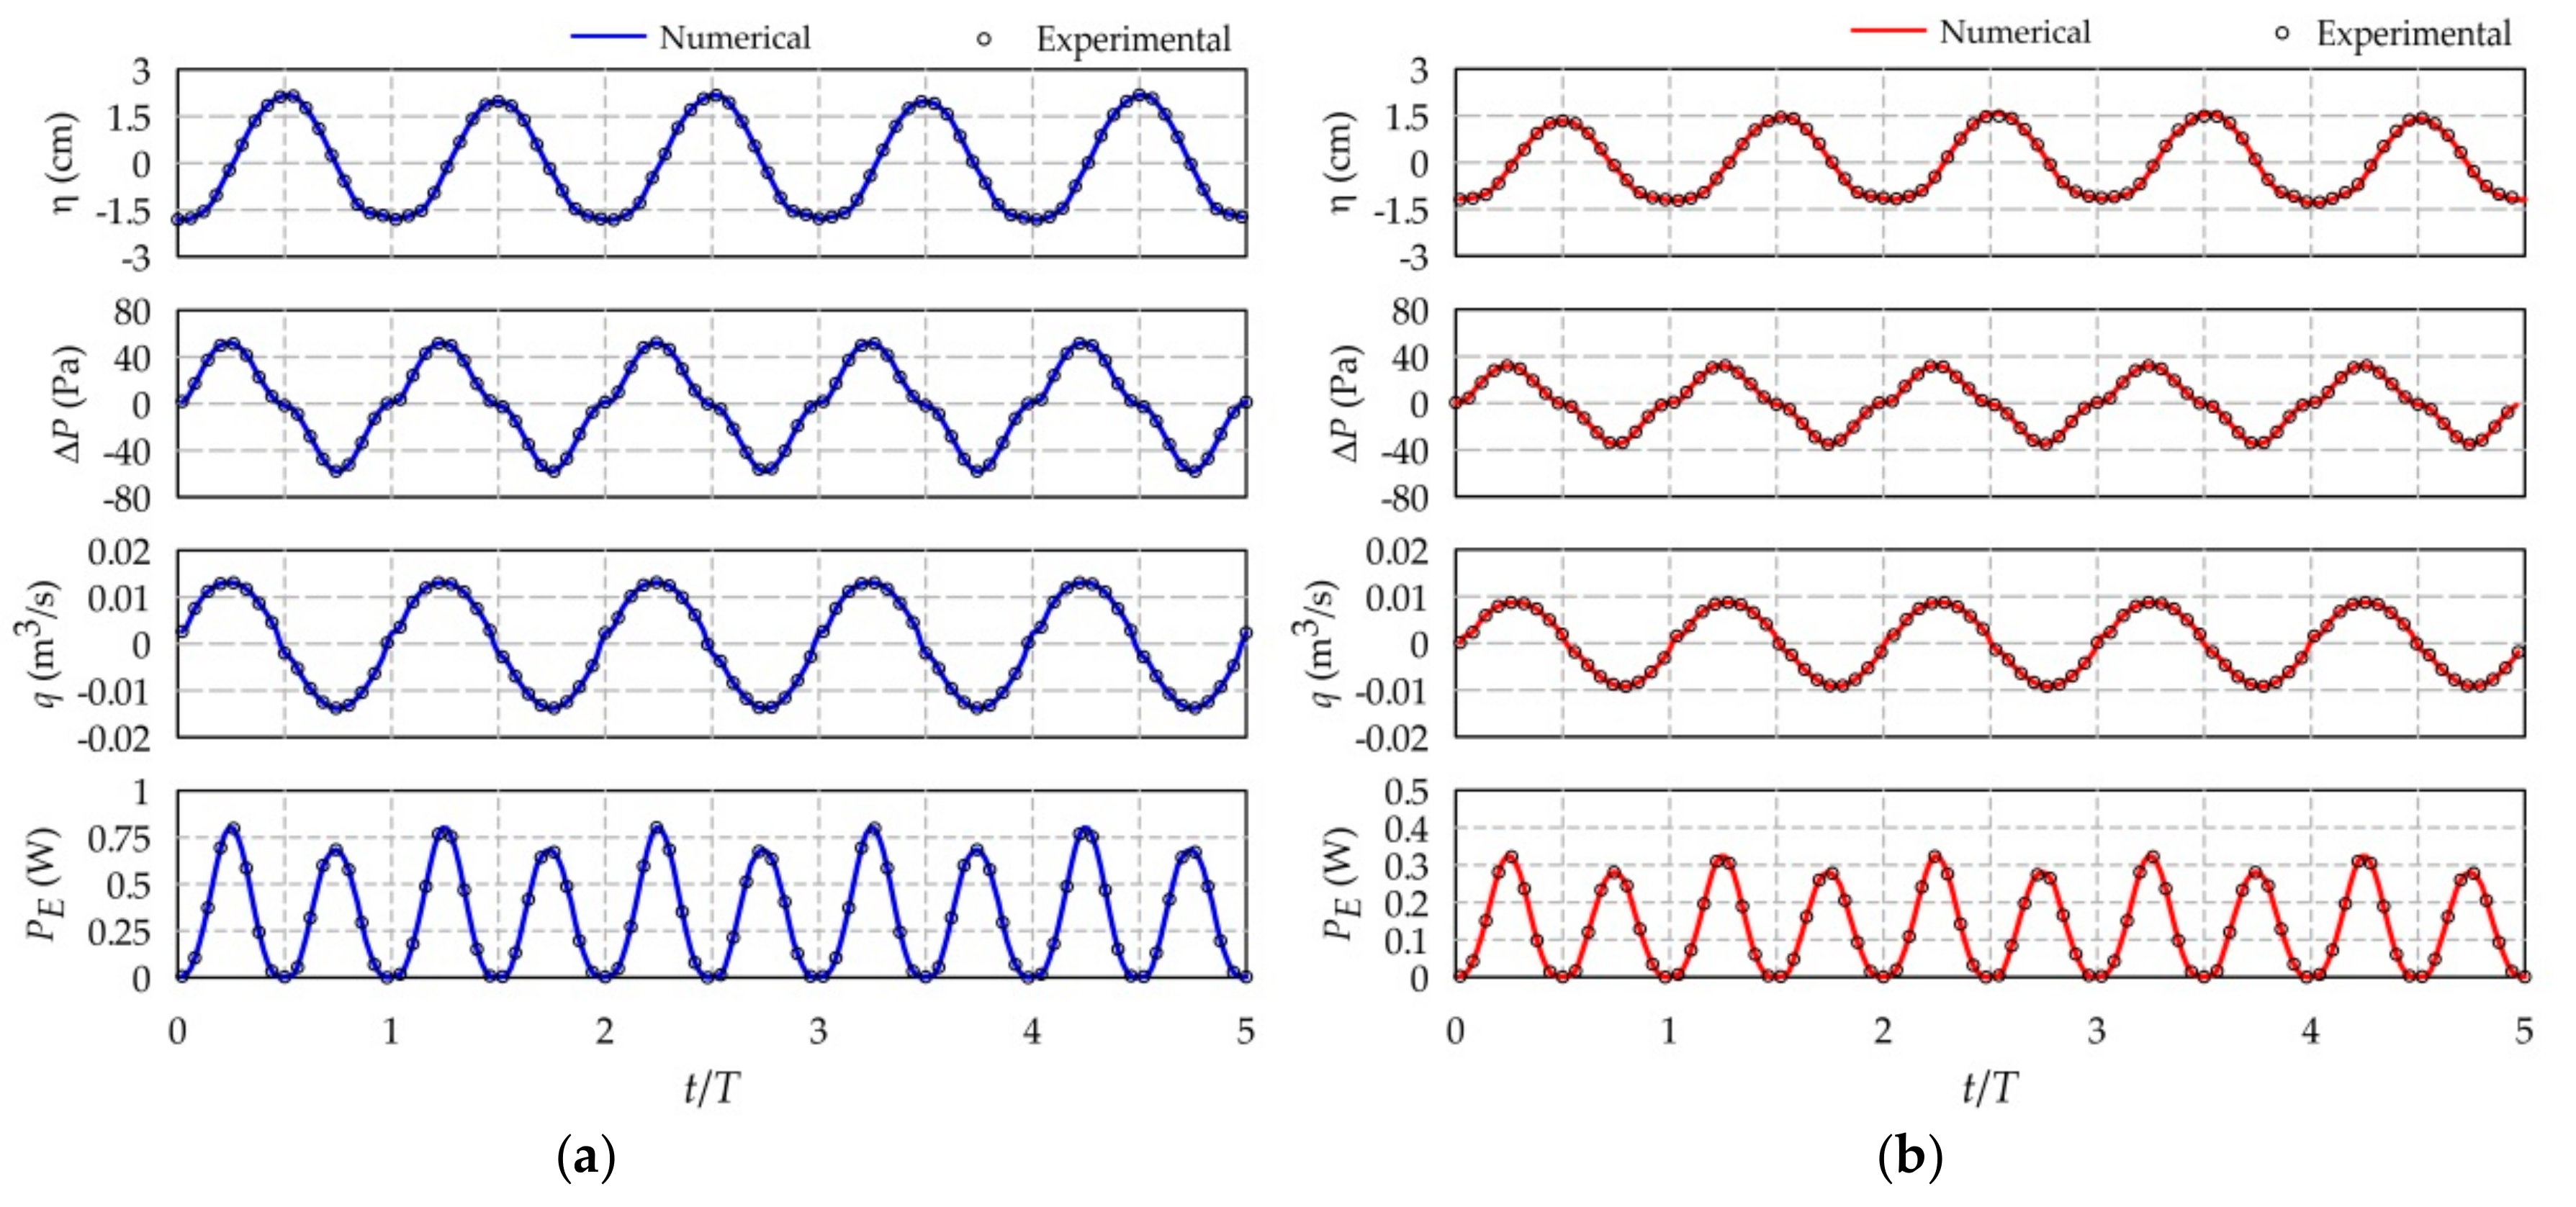
The numerical model is first validated using experimental measurements for both present and typical OWC devices for the following hydrodynamic performance parameters; they are the water surface elevation (η) of OWC, the air pressure (∆p), the air flowrate (q) through the orifice, and the instantaneous pneumatic power (PE). Figure 7 shows that the numerical results are in good agreement with the experimental measurements of the time series of all performance parameters for both OWC devices. Noting that the wave condition conducted in the experiment for both OWC devices is the same, the only difference in the geometry is that the present OWC device has a perforated front wall but the typical device does not have it. The results demonstrate that the present OWC device has better performance than the typical OWC device under the same wave condition.
It can be seen from Figure 7 that there are double peaks in the time series of the pneumatic power during a period of OWC; they occur when the free surface of OWC is just ascending and descending from the mean water level, respectively. It is also found that the device extracting the pneumatic power during the air exhalation stage (air extruding the chamber) is slightly larger than during the inhalation stage (air entering the chamber), which is similar to previous studies [19,21,29]. It may be caused by the effect a nonlinear free surface profile of OWC which has a steeper crest and a flatter trough. Based on Equation (5), the hydrodynamic efficiency are ξ = 72 % and 38% of present and typical OWC devices, respectively, for the experimental conditions with kho = 1.285, hb/h = 0.43, ε = 1% and λ = 25%.
As indicated in Elhanafi et al. [28], the air compressibility has no effect in the small-scale model of OWC device, but it needs to be included in the full-scale model. Therefore, in the next Section, the full-scale model is employed in the numerical simulations to investigate the influence of the geometry of the OWC device on the hydrodynamic performance. More detailed information on the scaling and air compressibility effects on OWC device can be found in Elhanafi et al. [28].
5.2.2. Flow Patterns
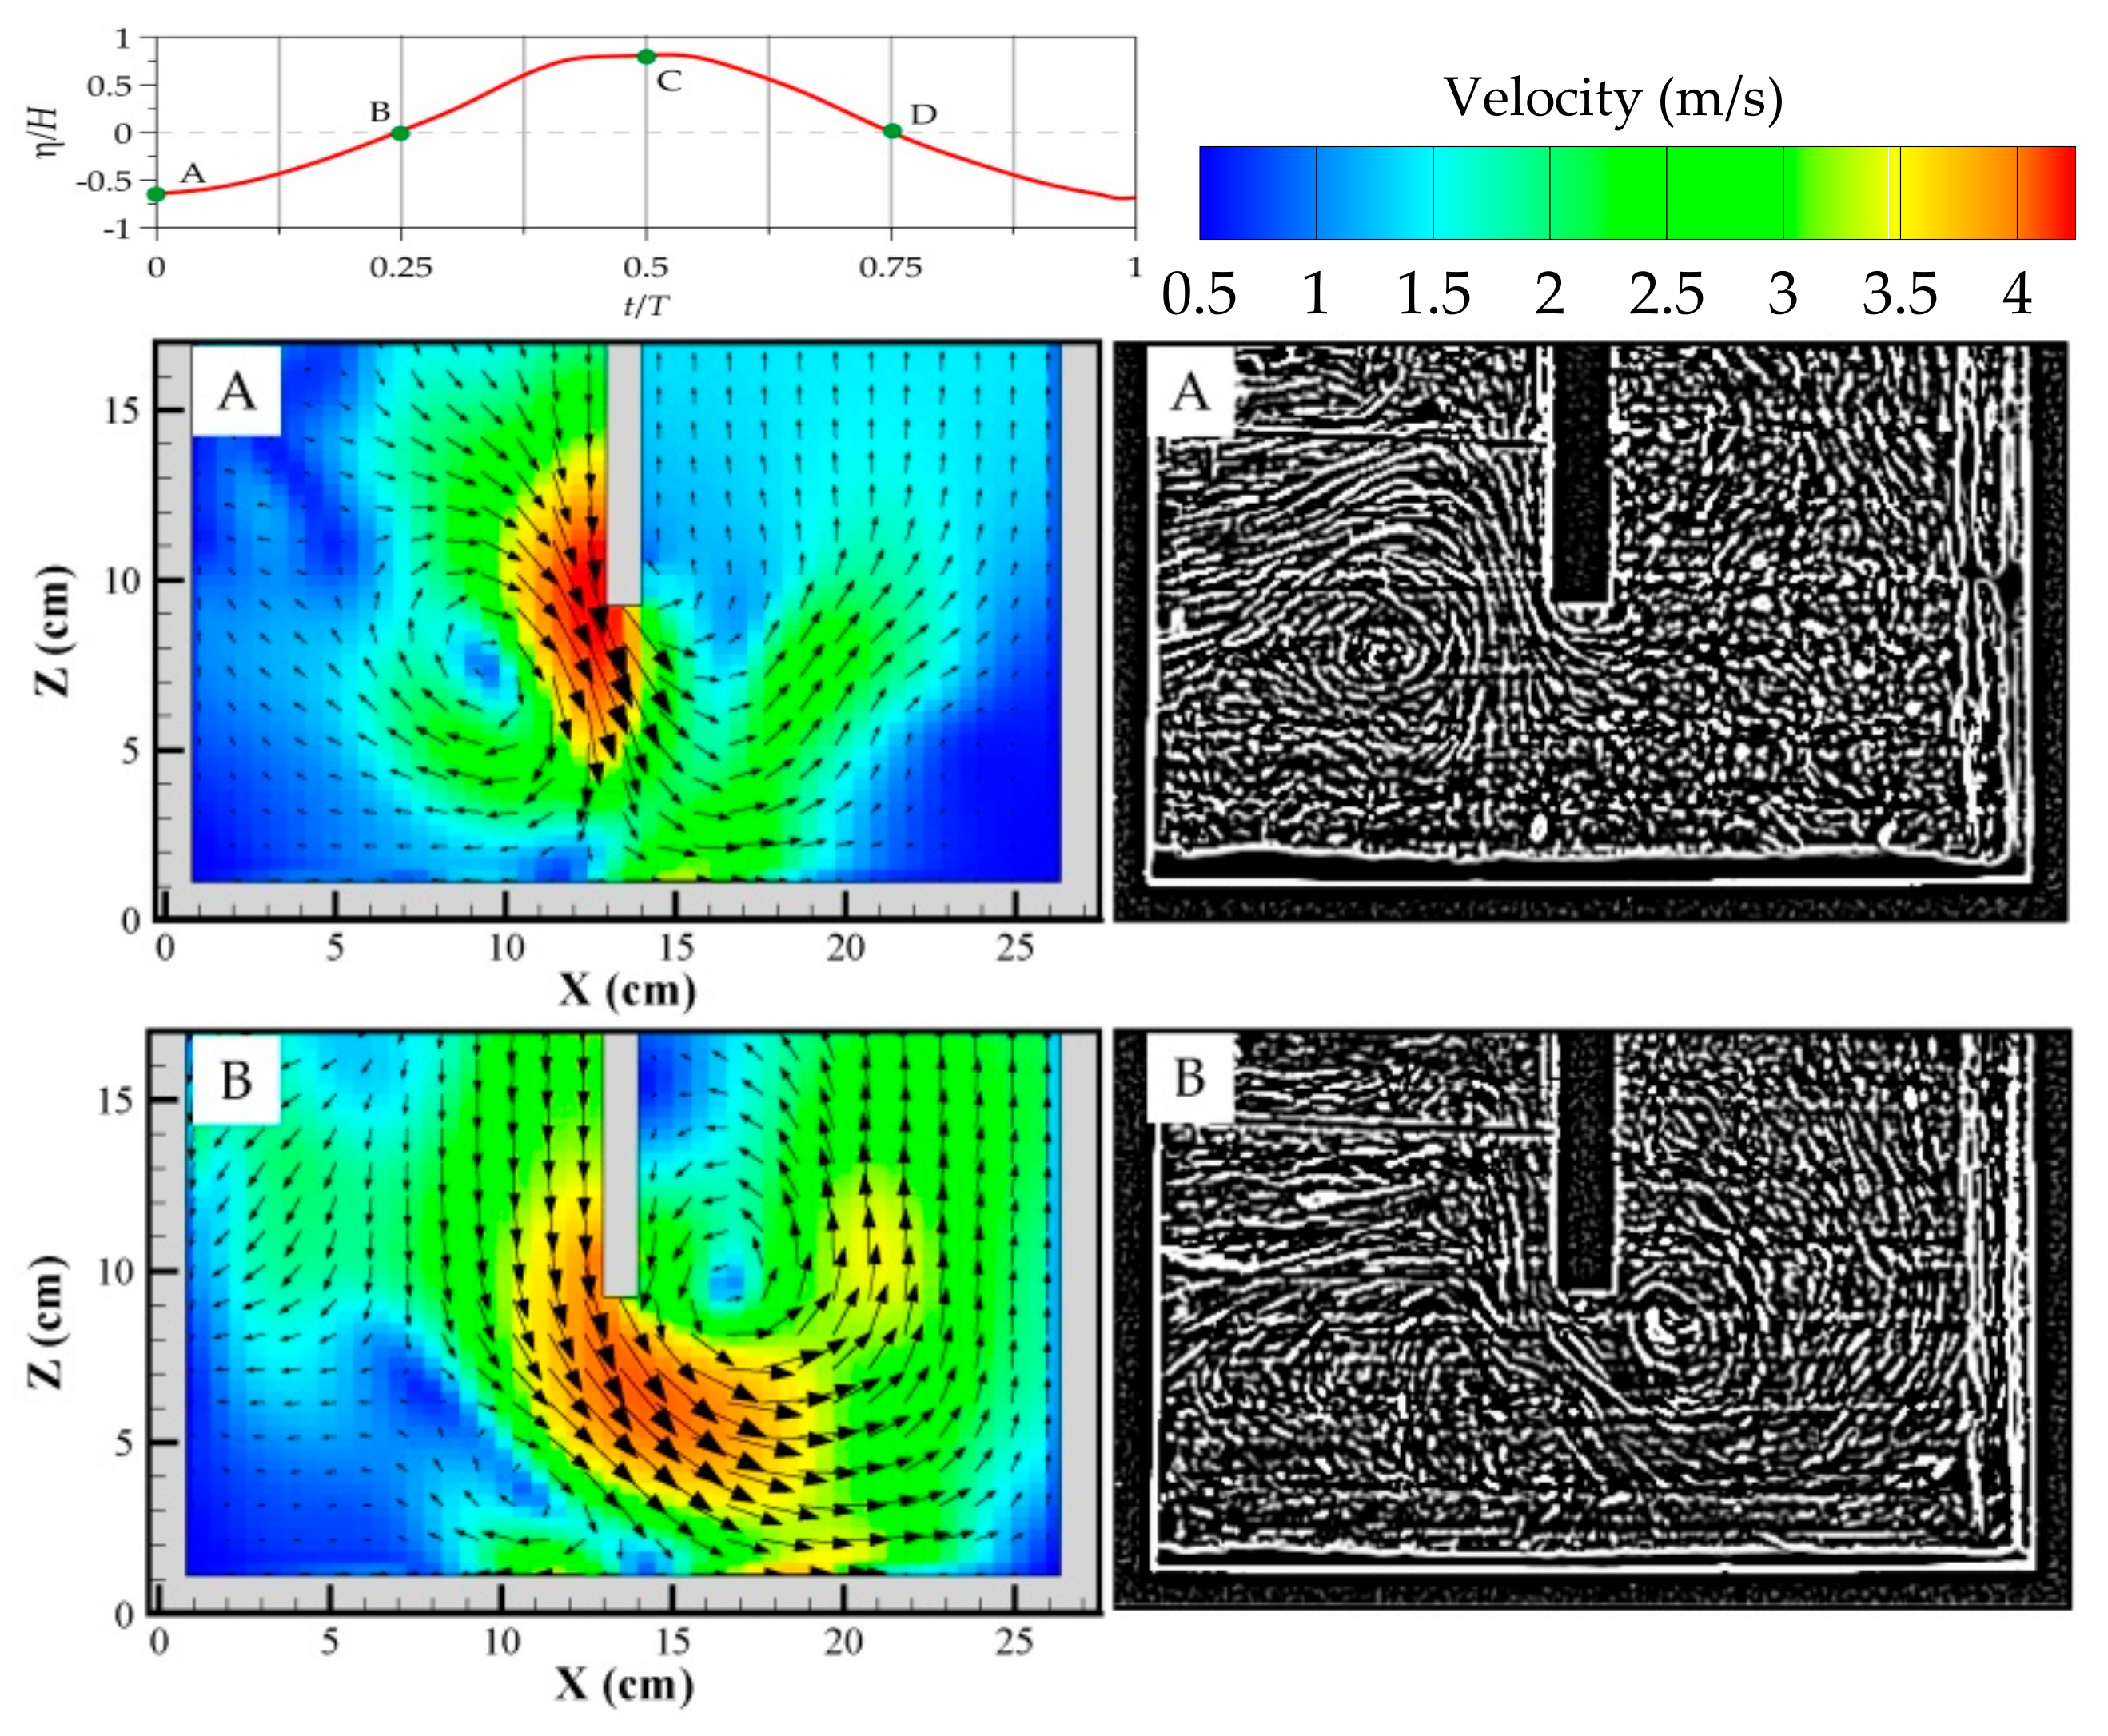
Figure 8 shows the snapshots of water flow fields in the vicinity of the entrance of the present OWC chamber during the air exhalation and inhalation stages. The top graph indicates the timing of phases A to D with regard to the free surface elevation inside the OWC chamber. Good agreement of the flow patterns is found between the numerical simulations and experimental observations. It can be seen that, during the air exhalation stage, the clockwise lower vortex forms as the water starts to flow in the OWC chamber (phase A; t/T = 0) and then it develops the counter-clockwise upper vortex as the water flow passes through the submerged open wall (phase B; t/T = 0.25). During the air inhalation stage, the counter-clockwise lower vortex forms as the free surface of the OWC starts to descend from the highest level (phase C; t/T = 0.5) and then it develops the clockwise upper vortex at the left side of the open wall (phase D; t/T = 0.75).
6. Effects of Chamber Geometry on Hydrodynamic Efficiency
The above validations demonstrate that the present CFD model is capable of simulating accurately the hydrodynamic characteristics of the OWC devices. The following simulations are conducted for the effects of the geometry of OWC device on the hydrodynamic efficiency by considering the full-scale model. The conditions of incident wave and geometry of the chamber for the numerical simulations are shown in Table 3. Noted that the wave conditions considered in the simulations are based on the situation of seasonal waves at Taichung Harbor stated in Section 2.
6.1. Effect of the Chamber Breadth
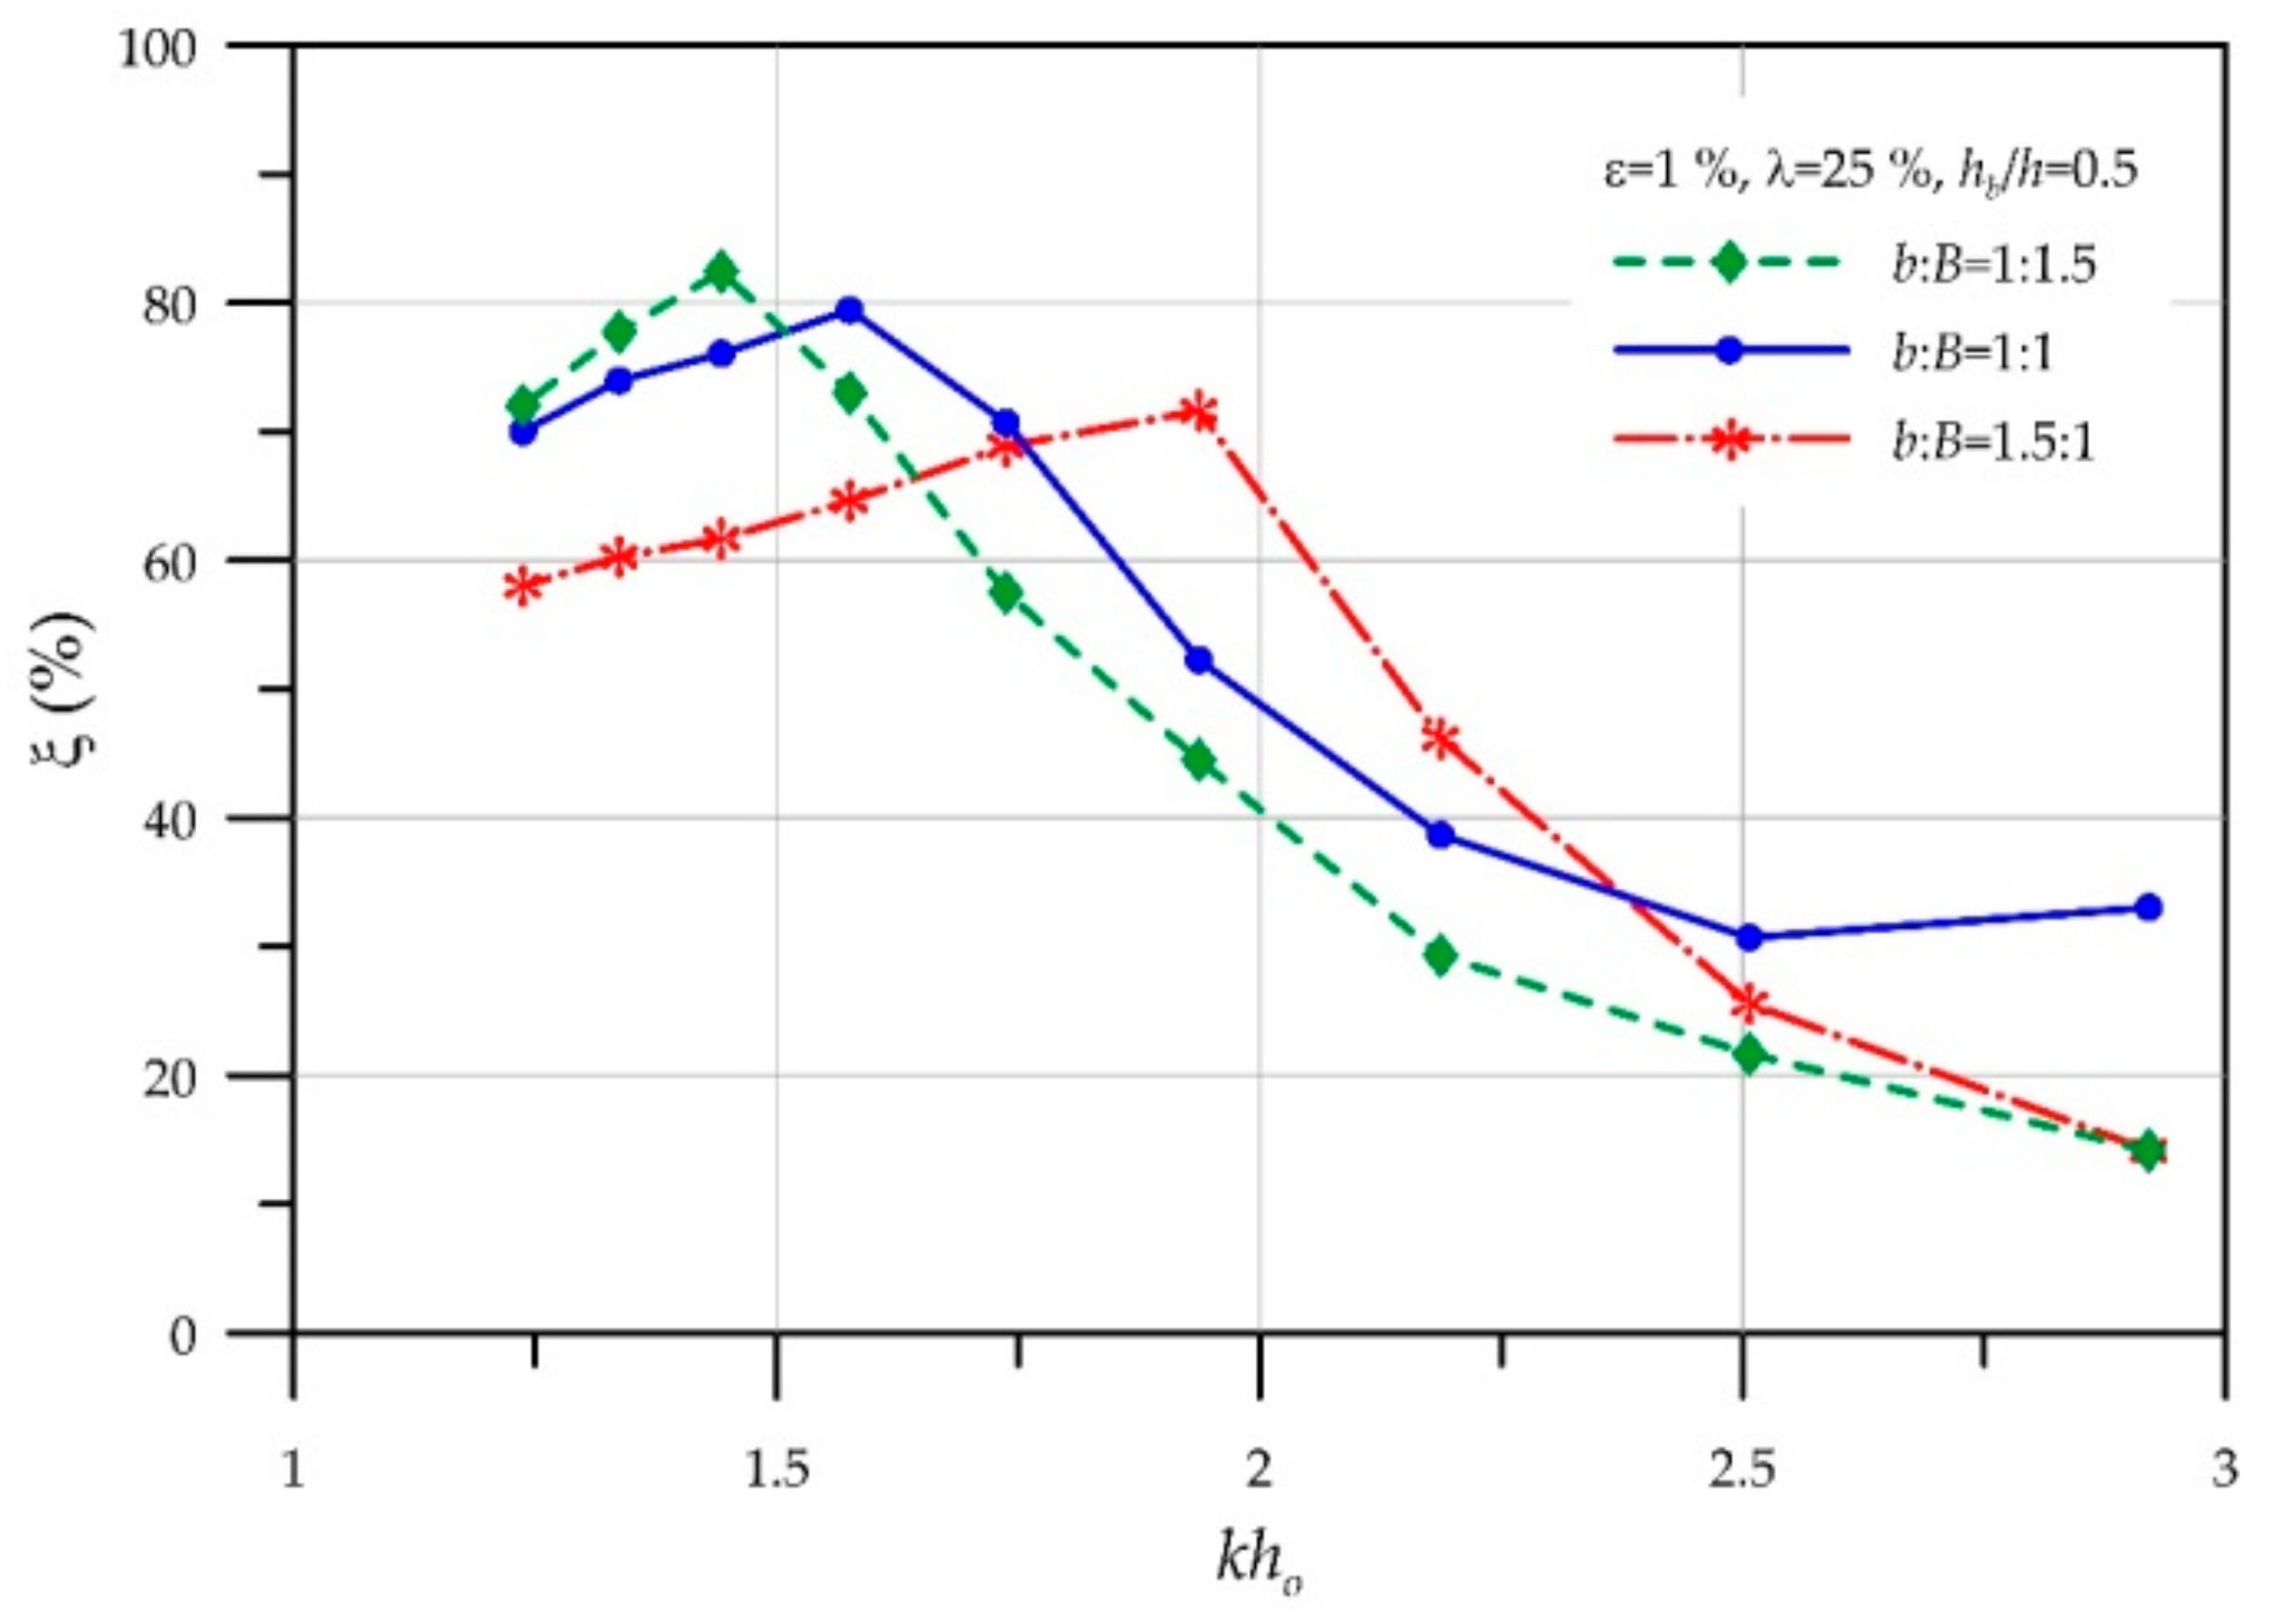
Figure 9 shows the effects of the OWC chamber breadths on the hydrodynamic efficiency (ξ) by considering the same total breadth of b + B = 21 m with three different ratios of b:B = 1:1.5, 1:1 and 1.5:1. In this figure, the geometry conditions of hb/h = 0.5, ε = 1% and λ = 25% are used, where hb/h is the relative opening height of the front submerged wall, λ is the porosity of the perforated front wall, and ε is the orifice opening ratio defined by ε = Ao/A (Ao is the orifice area and A is the cross-sectional area of the air chamber). The results show that the breadth of OWC chamber (B) has a significant influence on the hydrodynamic efficiency of the present OWC device. It can be seen that the hydrodynamic efficiency increases with the increase of the breadth of B in the low frequency region (i.e., smaller kho, k is the wave number), but follows an opposite tendency in the high frequency region. The maximum hydrodynamic efficiency occurs at kho = 1.44 for b:B = 1:1.5, at kho = 1.58 for b:B = 1:1, and at kho = 1.94 for b:B = 1.5:1, corresponding to the maximum value of 82%, 80% and 72%, respectively. It indicates that the resonant frequency decreases with the increase of the breadth (B) of the OWC chamber. Ning et al. [39] indicated that the reason is due to the fact that the inertia of the OWC water column increases with the chamber breadth. Figure 10 illustrates the variations of incident wave power Pw and pneumatic power Pair against the relative water depth kho, which shows that the values of Pw and Pair are the closest at the resonant frequency of kho = 1.44, 1.5 and 1.94 for b:B = 1:1.5, 1:1 and 1.5:1, respectively.
Figure 11 shows the comparison of the time variation of the performance parameters: the water surface elevation (η) of OWC, the air pressure (∆p), the air flowrate (q) through the orifice and the instantaneous pneumatic power (PE) at kho = 1.58 for b:B = 1:1.5, 1:1 and 1.5:1. It can be seen that they have the same characteristics of variations but the significant numeric deviation occurs at the peaks of the time variation of pneumatic power.
6.2. Effect of Opening Height of Submerged Wall
The hydrodynamic efficiency obtained from different relative opening heights (hb/h) of the front submerged wall of OWC chamber is demonstrated in Figure 12 for kho = 1.58 using b:B = 1:1, ε = 1%, and λ = 25%. The results show that the hydrodynamic efficiency can be larger than 80% if hb/h ranges between 0.5 and 0.7. It can be seen that the smaller and larger entrances of the submerged open wall could not produce higher pneumatic power. Referring to Delauré and Lewis [38], narrower open of the front submerged wall increases hydrodynamic damping due to vortex shedding by the flow contraction thus reduces the hydrodynamic efficiency. On the other hand, the opening of the submerge wall should not too large to decrease the mass of water column in the chamber that also reduces the pneumatic power.
6.3. Effect of Orifice Scale
Figure 13 illustrates that the hydrodynamic efficiency is affected by different opening areas of the air orifice on the roof of the OWC chamber. The orifice scale is described by the opening ratio defined by ε = Ao/A, in which Ao is the orifice area and A is the cross-sectional area of the air chamber. Five opening area ratios varied from 0.5% to 1.5% (i.e., the diameters of the circular orifice are varied from 0.82 m to 1.41 m) are simulated for kho = 1.58 using b:B = 1:1, hb/h = 0.5, and λ = 25%. The result show that the hydrodynamic efficiency first increases to the maximum value then decreases with the increase of the opening ratio; this tendency is similar to the experimental results obtained by Ning et al. [39]. Figure 13 depicts that the hydrodynamic efficiency can reach 83% and 80% as ε = 0.7% and 1.0%, respectively.
6.4. Effect of Porosity of Perforated Front Wall
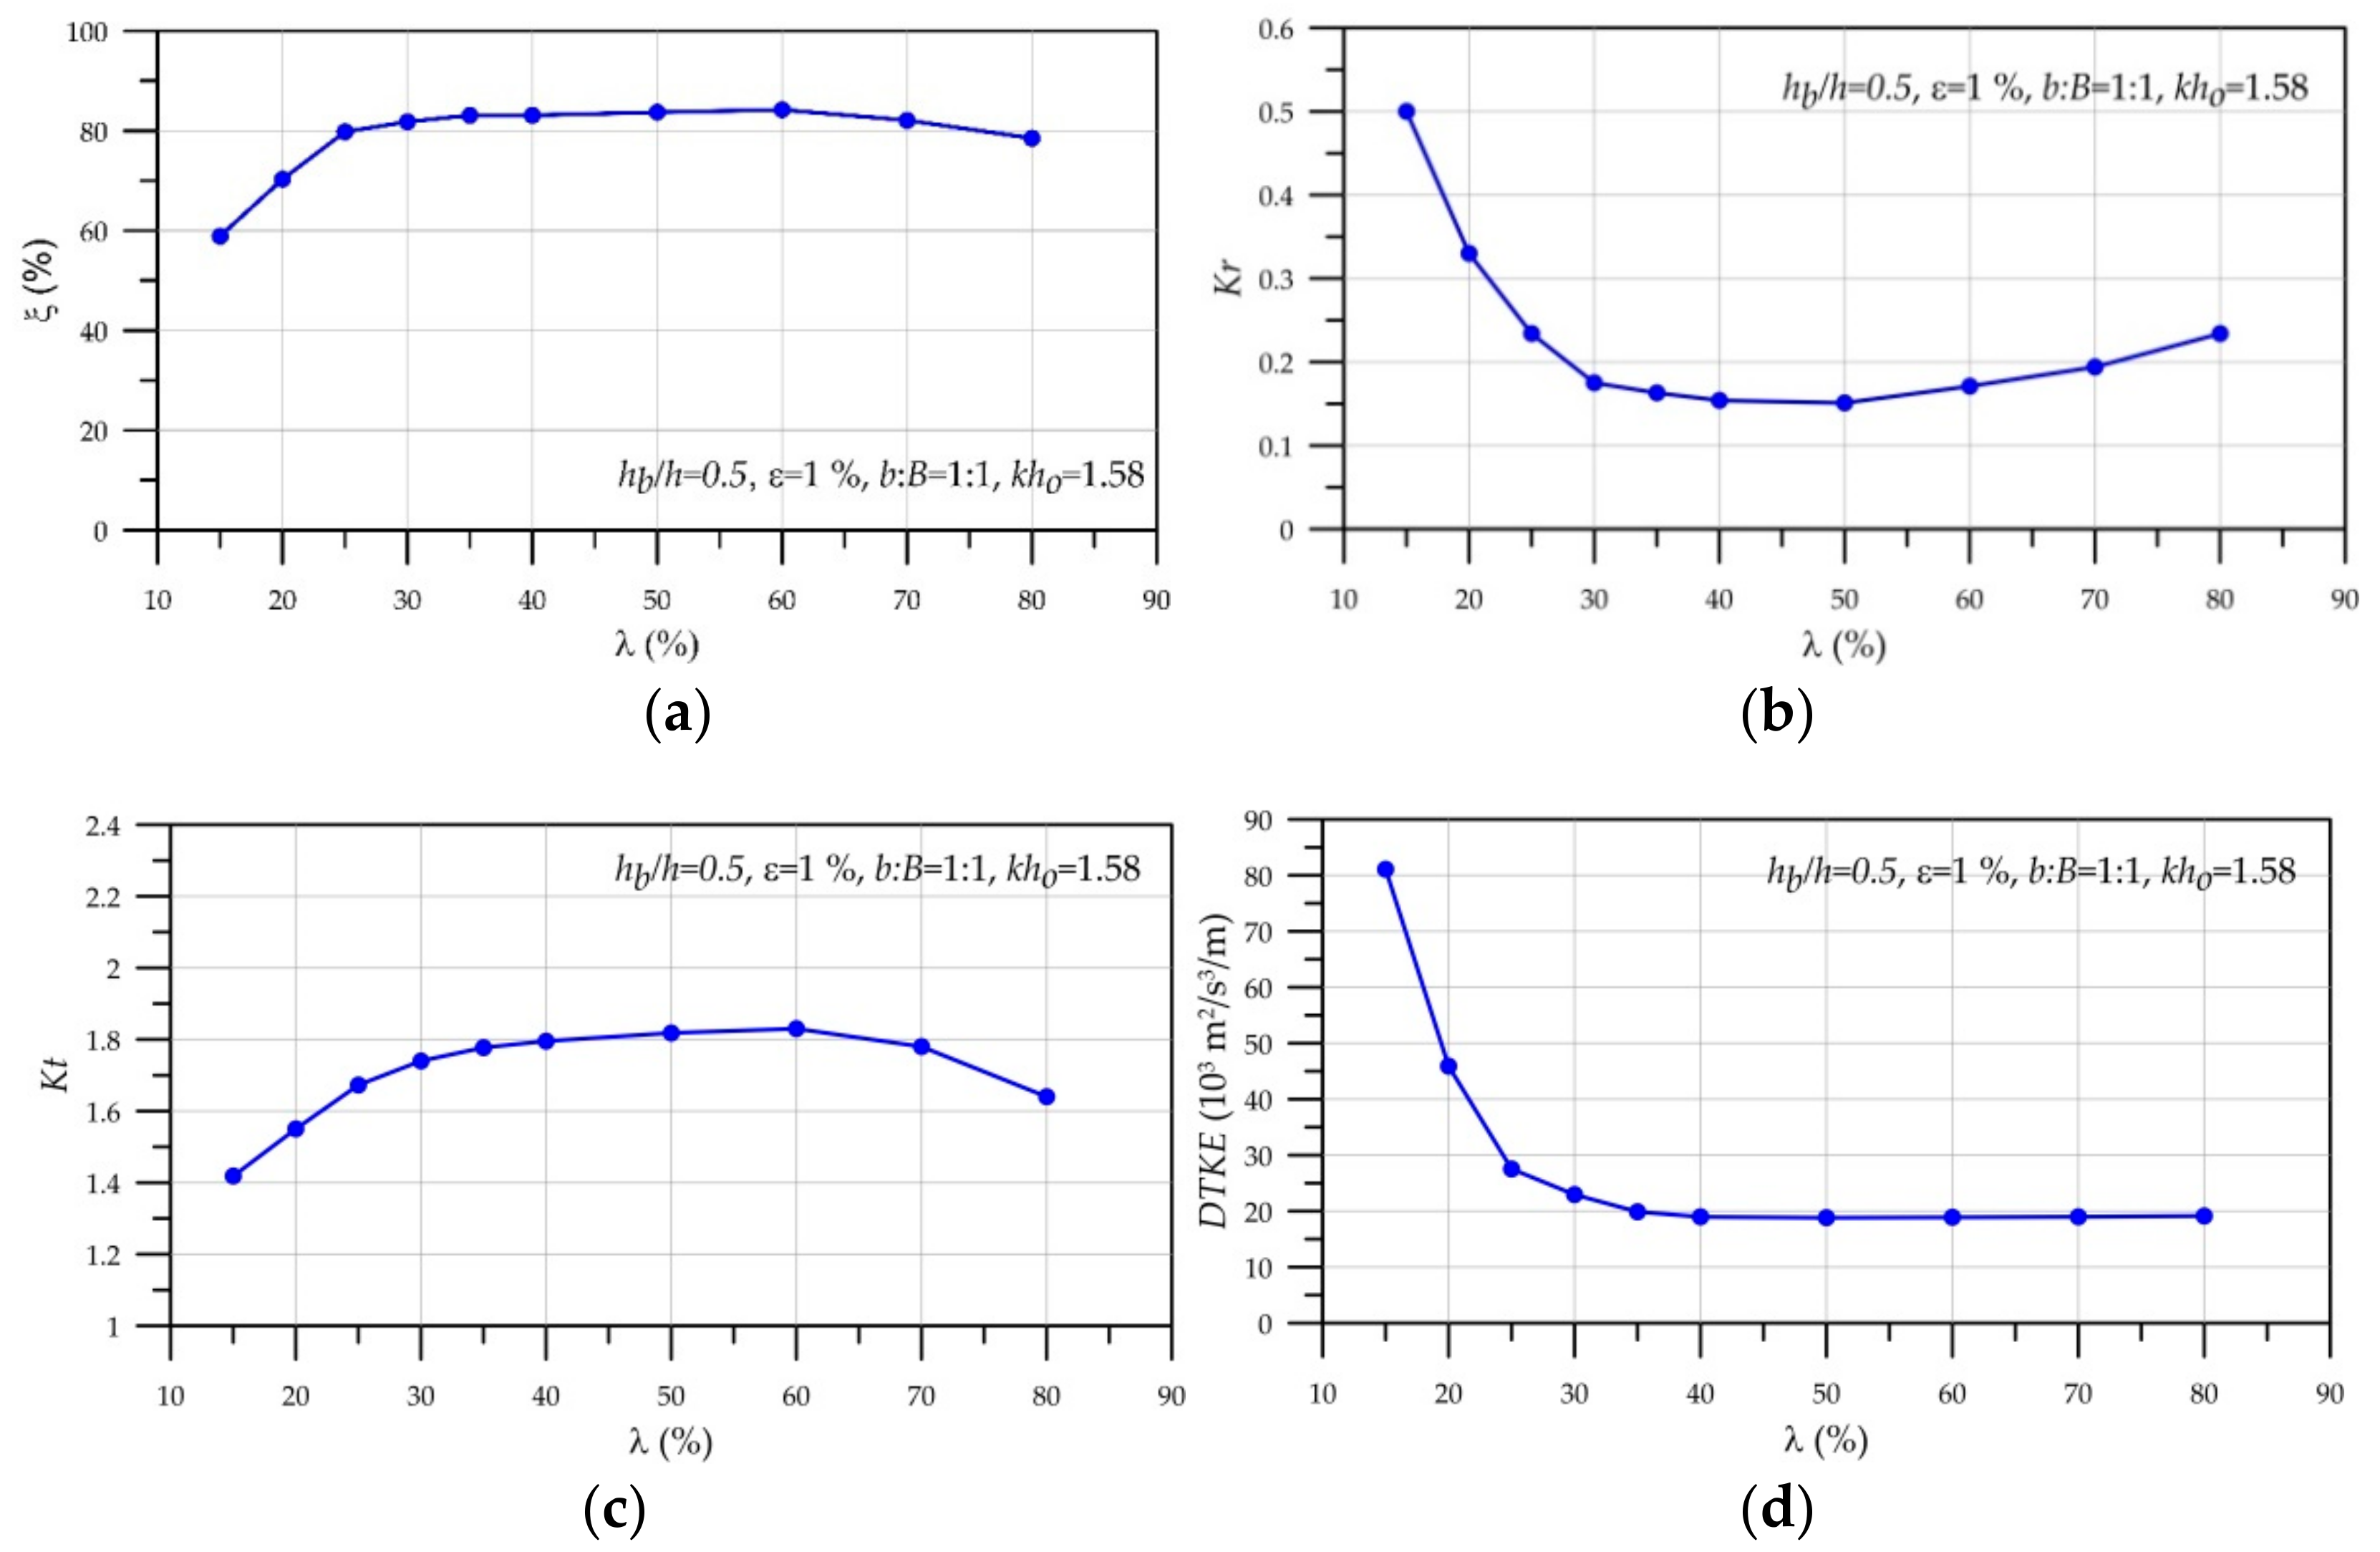
Figure 14a depicts the hydrodynamic efficiency obtained from different porosities (λ = 15–80%) of perforated front wall of the present OWC device for kho = 1.58 using b:B = 1:1, hb/h = 0.5, and ε = 1%. The simulated results show that the hydrodynamic efficiency ξ almost linearly increases from 59% to 80 % as the porosity λ varies from 15% to 25%, then ξ slightly increases to a maximum value of 84% as λ increases to 60% and hereafter ξ decreases to 78% as λ increases to 80%.
Figure 14b,c shows the variations of wave reflection coefficient Kr from the OWC device and wave amplification coefficient Kt of the oscillating water column inside the OWC chamber versus different porosities λ, in which the wave amplification coefficient is defined by the ratio of the oscillating height of water column and the incident wave height. The reflection coefficient is estimated by using the two-point method developed in Goda and Suzuki [52]. It is clearly observed that the variation of the hydrodynamic efficiency is inversely related to the wave reflection coefficient and is positively proportional to the wave amplification coefficient. This tendency is similar in Elhanafi et al. [53]. The wave reflection comes from the combination effects of the perforated front wall, the front wall of the OWC chamber, and the OWC chamber itself. The results show that the wave reflection coefficient Kr decreases swiftly from 0.5 to 0.17 as the porosity λ varies from 15% to 30% and the minimum Kr = 0.15 occurs at λ = 50%; after that, Kr slightly increases to 0.23 at λ = 80%. Over all, the wave reflection coefficients are smaller than 0.2 as λ = 30% to 60%, due to the existence of the perforated front wall. On the other hand, the wave amplification coefficient Kt is larger than 1.4 for all conditions at kho = 1.58.
Figure 14d demonstrated the overall dissipation of turbulent kinetic energy (DTKE) per unit time of the OWC device using different porosities of the perforated front wall. The DTKE was obtained directly from the RNG turbulent model described in Section 3. The result illustrates that the higher DTKE leads to a smaller hydrodynamic efficiency, which is similar to the conclusion indicated in Elhanafi et al. [53], that the energy extraction coefficient trend is contrary to the energy losses coefficient.
7. Comparisons of Present and Typical OWC Devices
Finally, we compare the hydrodynamic performance between the present and typical OWC devices under the same incident wave conditions shown in Table 3. Both the OWC devices use the same breadth of OWC chamber, orifice area and submerged opening height using B = 10.5 m, ε = 1%, and hb/h = 0.5. The perforated front wall of the present OWC device employs b = 10.5 m and λ = 25%. Figure 15 shows the variation of hydrodynamic efficiency against the relative water depth, which demonstrates that the resonant frequency occurs at kho = 1.58 for both OWC devices. It can be seen that the present OWC device has better hydrodynamic performance than the typical OWC device. The maximum values of the hydrodynamic efficiency are obtained by 80% and 59% of the present and typical OWC devices respectively. The time variations of the performance parameters are shown in Figure 16, which shows that the present OWC device has larger quantities than the typical device.
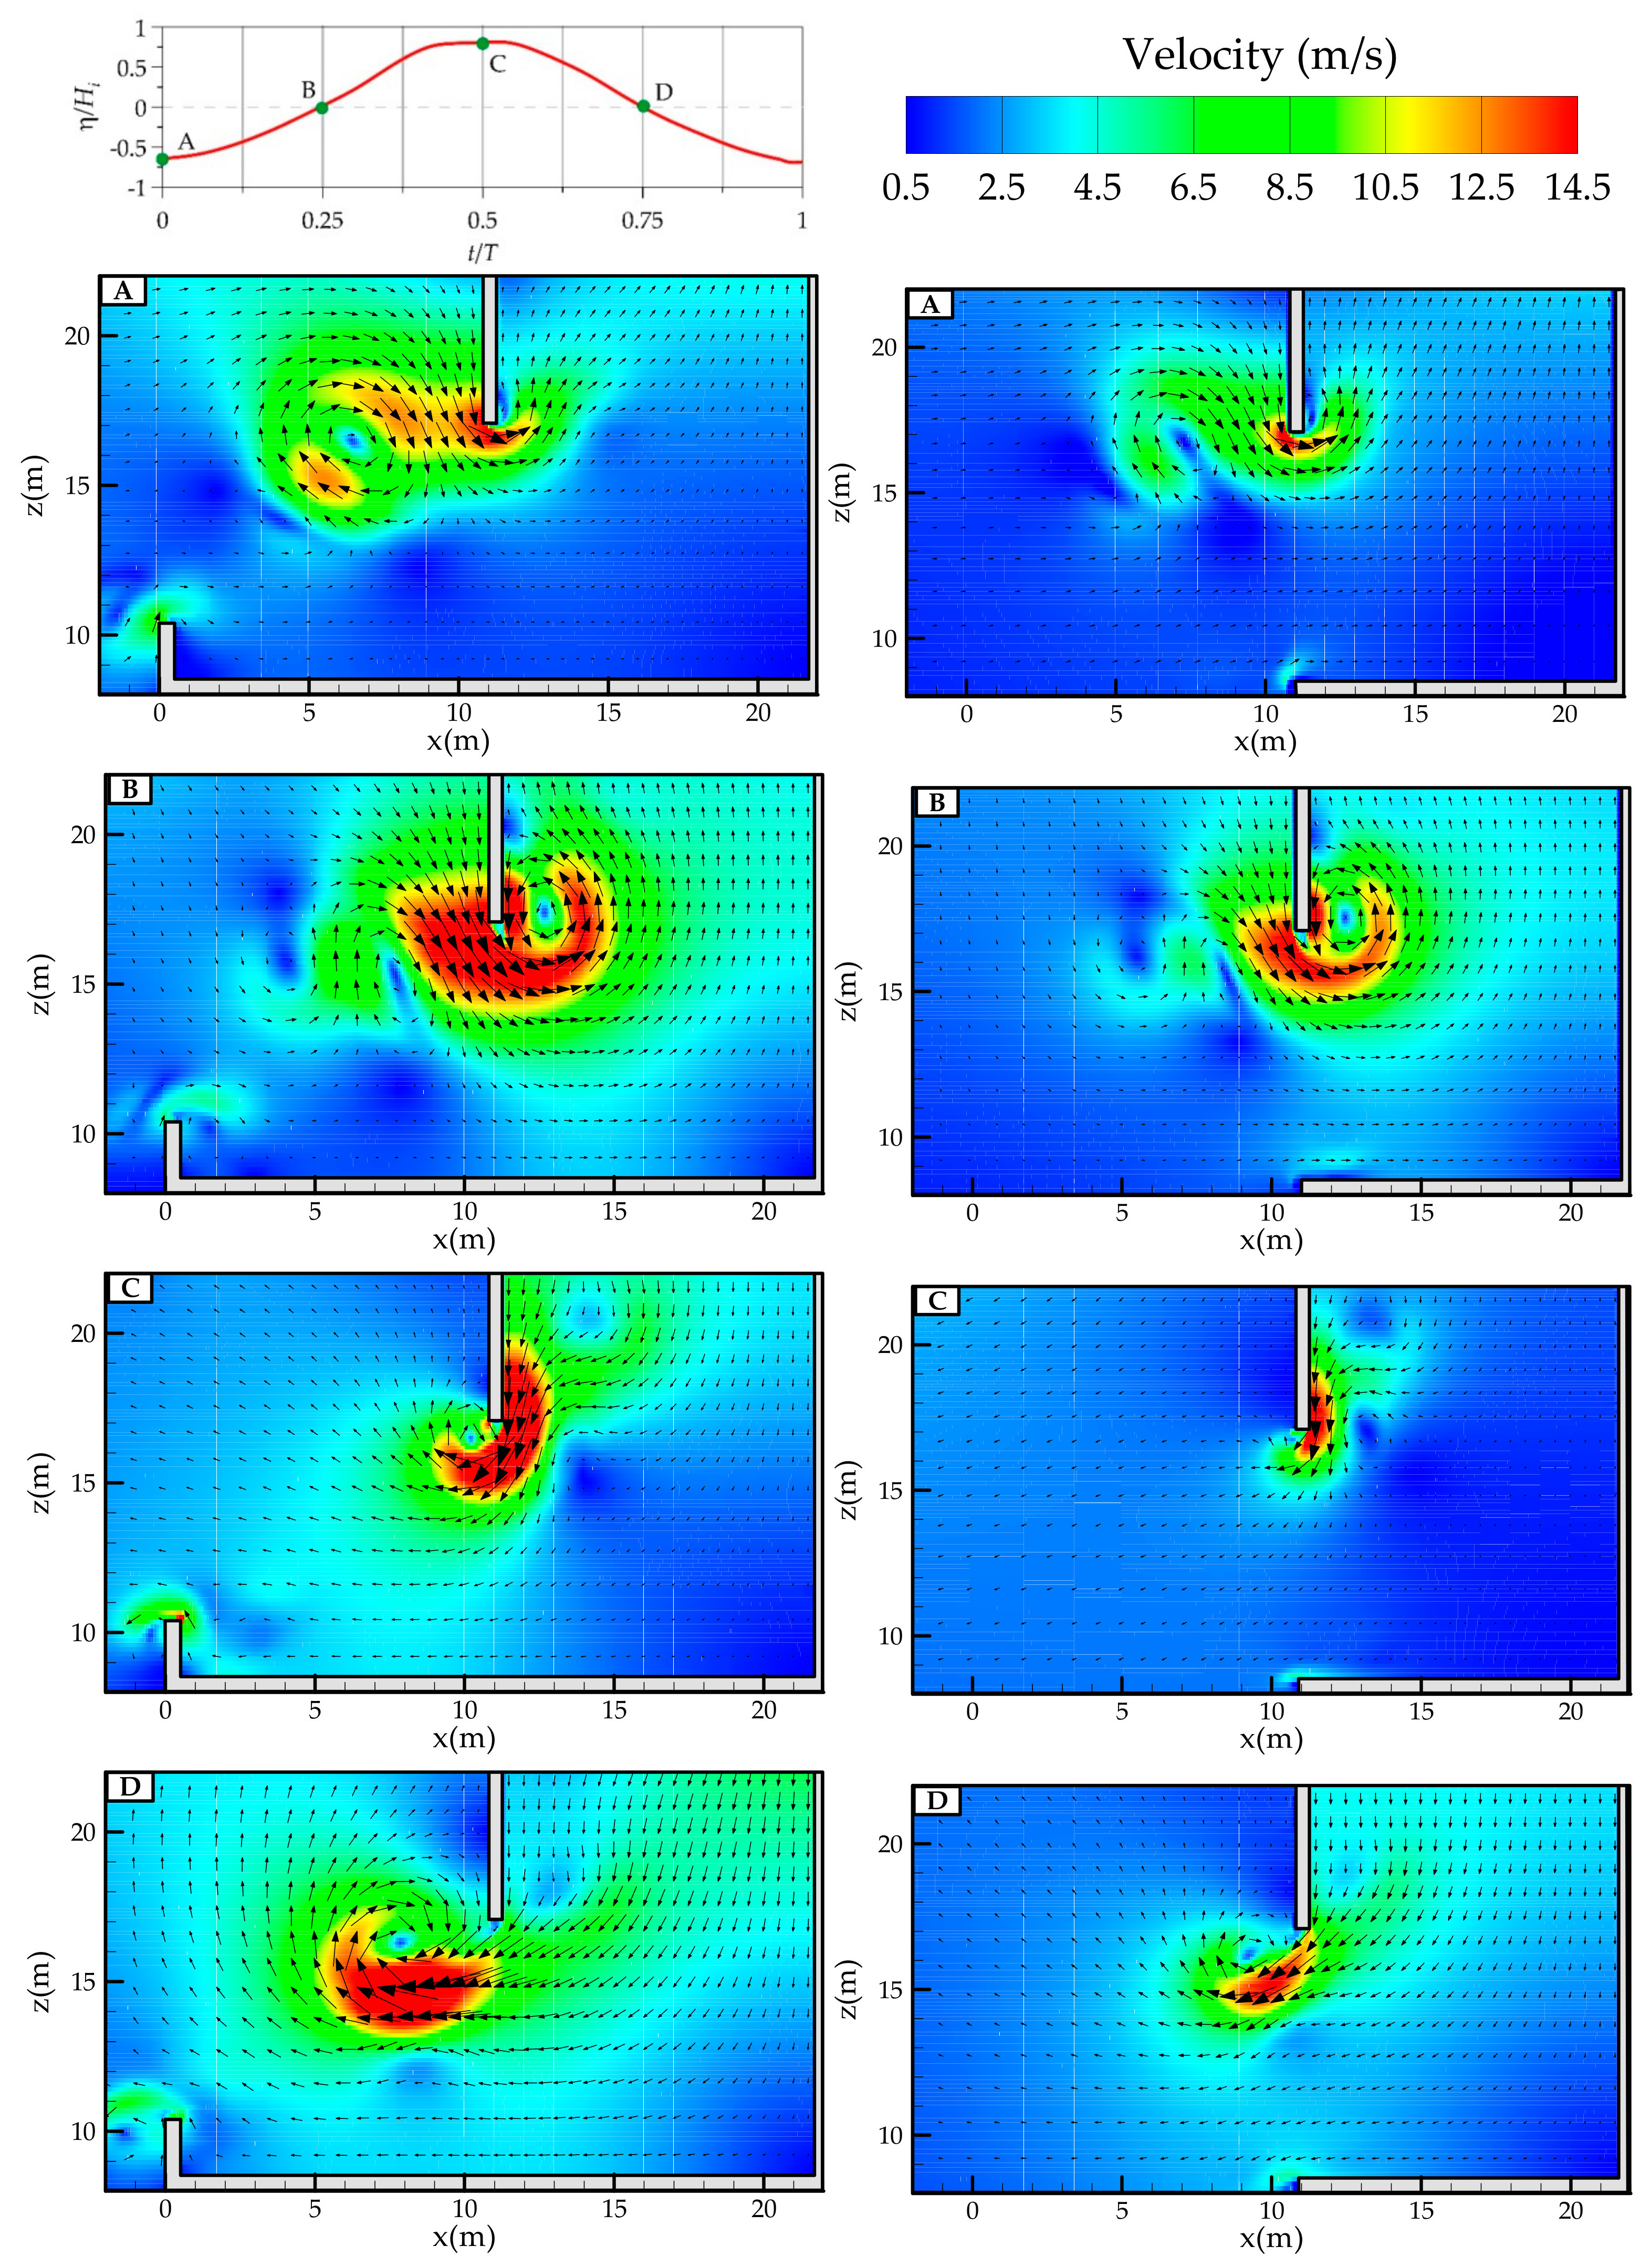
Figure 17 illustrates the snapshots of flow field in the vicinity of the entrance of the submerged open wall of both OWC devices with four frames including in-flow stage (phases A and B) and out-flow stage (phases C and D). Like Figure 8, the flow fields show that the U-type flow pattern forms by the oscillating water column in the present OWC device, thus causing larger flow intensity through the submerged open wall. The occurrence of U-type flow is because the water outflow at the descending stage of the water column is partly bounded by the perforated front wall. On the contrary, because the flow energy almost disappears at the outer region when the water flows out the chamber of the typical OWC device, the U-type flow pattern could not be formed. Consequently, the present OWC device has a better performance of the pneumatic power extraction, even though it has larger dissipation of turbulent kinetic energy (as shown in Figure 18).
Figure 19 shows the comparisons of the synthesized surface elevation probed at antinode in front of the present and typical OWC devices, in which the surface profiles of the incident wave for both devices are reconstructed by using inverse FFT based on the method of Goda and Suzuki [52]. The wave reflection coefficients from the present and typical OWC devices are obtained by Kr = 0.23 and 0.58, respectively, which demonstrates that the present OWC device can reduce the wave reflection due to the existence of the perforated front wall.
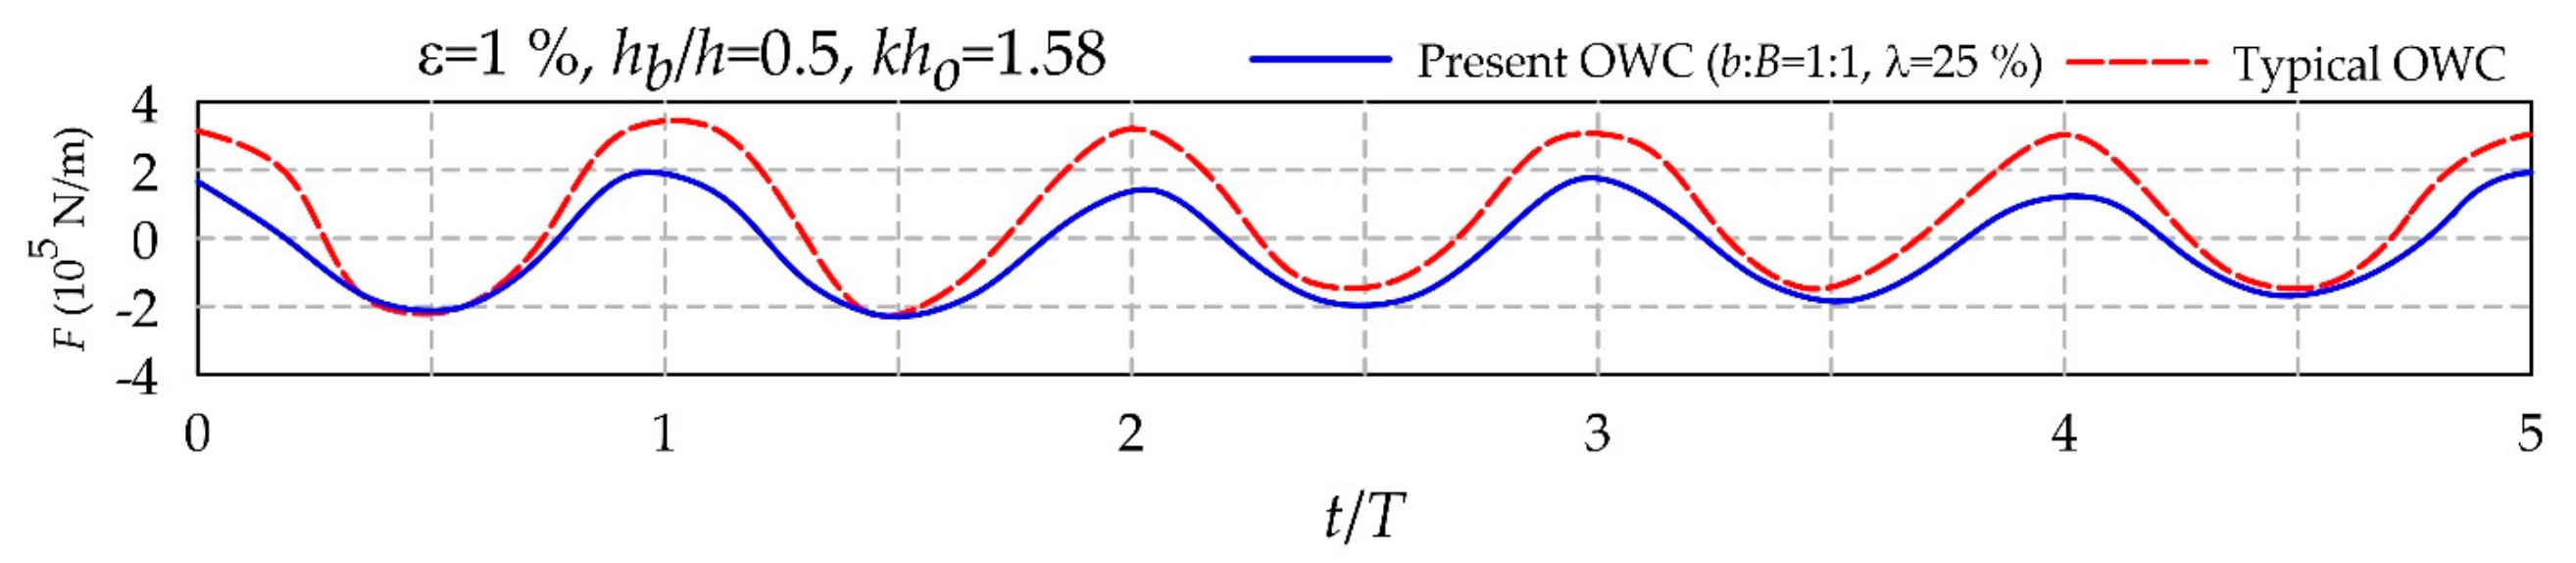
The net horizontal forces acting on the submerged open wall per unit width of the present and typical OWC devices are compared in Figure 20. The positive and negative force values represent the net force directing on +x and −x direction, respectively. Due to the effect of the perforated front wall, the results demonstrate that the present OWC device has smaller wave force acting on the submerged open wall. The maximum net forces on the wall are obtained by 1.8 × 10⁵ N/m of the present OWC device and 3.5 × 10⁵ N/m of the typical OWC device.
Based on the above comparisons of the hydrodynamic properties of the OWC devices, the results indicate that the present modified OWC device can not only promote the efficiency of the pneumatic power extraction, but also can reduce the wave force acting on the structure.
8. Conclusions
This study proposes an innovative modified breakwater-integrated OWC wave energy converter for the purpose of efficiently extracting the wave power and being capable of reducing the wave force on the structure. The present modified OWC device consists of a composite perforated front wall and a vertical submerged open OWC device, which is connected to a caisson breakwater. Both numerical simulation and experimental investigation are carried out to examine the hydrodynamic performance of both the present and the typical OWC devices, the typical OWC device being the model without the perforated front wall. The 3D numerical model based on RANS equations using FLOW-3D solver and considering the fluid compressibility was adopted to investigate the hydrodynamic performance of the OWC devices. The numerical simulations using model scale of OWC device for the hydrodynamic performance parameters are found in good agreement with the experimental measurements including water surface elevation of OWC, the air pressure inside the chamber, the air flowrate through the orifice, and the instantaneous extracted pneumatic power. The simulated flow patterns in the OWC device also agree well with the experimental observations. The vortex shedding can be found near the lip of the submerged open wall as water flow passes through the submerged open wall due to the water column oscillating in the chamber.
By considering full-scale conditions in the numerical simulations, the effects of geometry of the present OWC device, including the breadth, air orifice scale, opening height of the entrance, and the porosity of the perforated front wall of the OWC chamber, are discussed. The simulated results show that the breadth of OWC chamber (B) has a significant influence on the hydrodynamic efficiency. It is found that the resonant frequency decreases with the increase of the breadth of the OWC chamber. At a resonant frequency condition, like kho = 1.58, the hydrodynamic efficiency of the extracted pneumatic power can be larger than 80% using appropriate opening height of the submerged entrance. The smaller and larger entrances of the submerged open wall could not produce higher pneumatic power. The effect of the air orifice area ratio is also discussed, from which the hydrodynamic efficiency can reach 83% as air orifice area ratio is 0.7%. Regarding to the effect of the porosity of the perforated front wall, it is found that the hydrodynamic efficiency can be larger than 80% as the porosity of the perforated front wall is in range of 25–70%. The present results also demonstrates that the variation of the hydrodynamic efficiency is inversely related to the wave reflection coefficient and the overall dissipation of turbulent kinetic energy.
The comparison of hydrodynamic performance between the present and typical OWC devices under the same incident wave condition is investigated in this paper as well. It is found that the U-type flow pattern forms in the present OWC device lead to better performance for extracting pneumatic power. It is also found that the present OWC device results in less wave force acting on the submerged open wall and less wave reflection from the device when compared to the typical OWC device. This research demonstrates that the present modified OWC device can not only promote the efficiency of the pneumatic power extraction, but can also reduce the wave force acting on the structure.
For guidelines on the structure designs, it is suggested that the wave force on the structure of the OWC device impacted by the storm wave conditions should be implemented in the further study.
9. Patents
The OWC device presented in this paper is based on the document of Invention Patent No. I515362 in Taiwan, which was registered by Ching-Piao Tsai.
Acknowledgments
The authors wish to gratefully acknowledge the support from Ministry of Science and Technology of Taiwan under Grant No. MOST 105-2221-E-005-042.
Author Contributions
Ching-Piao Tsai conceived and supervised this study, and drafted the paper; Chun-Han Ko conducted the experiments and simulations; Ying-Chi Chen joined to analyze the data.
Conflicts of Interest
The authors declare no conflict of interest.
References
- Falcão, A.F.O.; Henriques, J.C.C. Oscillating-water-column wave energy converters and air turbines: A review. Renew. Energy 2015, 85, 1391–1424. [Google Scholar] [CrossRef]
- Ohneda, H.; Igarashi, S.; Shinbo, O.; Sekihara, S.; Suzuki, K.; Kubota, H. Construction procedure of a wave power extracting caisson breakwater. In Proceedings of the 3rd Symposium on Ocean Wave Energy Utilization, Tokyo, Japan, 22–23 January 1991. [Google Scholar]
- Suzuki, M.; Arakawa, C.; Takahashi, S. Performance of wave power generating system installed in breakwater at Sakata port in Japan. In Proceedings of the 14th International Offshore and Polar Engineering Conference, Toulon, France, 23–28 May 2004. [Google Scholar]
- Torre-Enciso, Y.; Ortubia, I.; de Aguileta Lopez, L.I.; Marques, J. Mutriku wave power plant: From the thinking out to the reality. In Proceedings of the 8th European Wave Tidal Energy Conference, Uppsala, Sweden, 7–10 September 2009. [Google Scholar]
- Arena, F.; Romolo, A.; Malara, G.; Ascanelli, A. On design and building of a UOWC wave energy converter in the Mediterranean sea. In Proceedings of the 32nd International Conference on Ocean, Offshore and Arctic Engineering, Nantes, France, 9–14 June 2013. [Google Scholar]
- Viviano, A.; Naty, S.; Foti, E.; Bruce, T.; Allsop, W.; Vicinanza, D. Large-scale experiments on the behaviour of a generalised Oscillating Water Column under random waves. Renew. Energy 2016, 99, 875–887. [Google Scholar] [CrossRef]
- Naty, S.; Viviano, A.; Foti, E. Wave energy exploitation system integrated in the coastal structure of a mediterranean port. Sustainability 2016, 8, 1342. [Google Scholar] [CrossRef]
- Vicinanza, D.; Margheritini, L.; Kofoed, J.P.; Buccino, M. The SSG wave energy converter: Performance, status and recent developments. Energies 2012, 5, 193–226. [Google Scholar] [CrossRef]
- Iuppa, C.; Contestabile, P.; Cavallaro, L.; Foti, E.; Vicinanza, D. Hydraulic performance of an innovative breakwater for overtopping wave energy conversion. Sustainability 2016, 8, 1226. [Google Scholar] [CrossRef]
- Contestabile, P.; Iuppa, C.; Di Lauro, E.; Cavallaro, L.; Andersen, T.L.; Vicinanza, D. Wave loadings acting on innovative rubble mound breakwater for overtopping wave energy conversion. Coast. Eng. 2017, 122, 60–74. [Google Scholar] [CrossRef]
- Liu, Y.; Li, Y.C.; Teng, B.; Jiang, J.J.; Ma, B.L. Total horizontal and vertical forces of irregular waves on partially perforated caisson breakwaters. Coast. Eng. 2008, 55, 537–552. [Google Scholar] [CrossRef]
- Huang, J.; Li, Y.; Liu, Y. Hydraulic performance and wave loadings of perforated/slotted coastal structures: A review. Ocean Eng. 2011, 38, 1031–1053. [Google Scholar] [CrossRef]
- Chandrasekaran, S.; Madhavi, N.; Sampath, S. Force reduction on ocean structures with perforated members. Adv. Struct. Eng. 2015, 647–661. [Google Scholar] [CrossRef]
- Evans, D.V. The oscillating water column wave energy device. J. Inst. Math. Appl. 1978, 22, 423–433. [Google Scholar] [CrossRef]
- Evans, D.V.; Porter, R. Hydrodynamic characteristics of an oscillating water column device. Appl. Ocean Res. 1955, 17, 155–164. [Google Scholar] [CrossRef]
- Martin-Rivas, H.; Mei, C.C. Wave power extraction from an oscillating water column at the tip of a breakwater. J. Fluid Mech. 2008, 626, 395–414. [Google Scholar] [CrossRef]
- Martin-Rivas, H.; Mei, C.C. Wave power extraction from an oscillating water column along a straight coast. Ocean Eng. 2009, 36, 426–433. [Google Scholar] [CrossRef]
- Lovas, S.; Mei, C.C.; Liu, Y. Oscillating water column at a coastal corner for wave power extraction. Appl. Ocean Res. 2010, 32, 267–283. [Google Scholar] [CrossRef]
- Zhang, Y.; Zou, Q.P.; Greaves, D. Air-water two phase flow modeling of hydrodynamic performance of an oscillating water column device. Renew. Energy 2012, 41, 159–170. [Google Scholar] [CrossRef]
- Liu, Z.; Hyun, B.S.; Hong, K.Y. Application of numerical wave tank to OWC air chamber for wave energy conversion. In Proceedings of the 18th International Offshore and Polar Engineering Conference, Vancouver, BC, Canada, 6–11 July 2008. [Google Scholar]
- EI Marhani, A.; Castro Ruiz, F.; Rodriguez, M.A.; Parra Santos, M.T. Numerical modeling in wave energy conversion systems. Energy 2008, 33, 1246–1253. [Google Scholar]
- Iturrioz, A.; Guanche, R.; Armesto, J.A.; Alves, M.A.; Vidal, C.; Losada, I.J. Time-domain modeling of a fixed detached oscillating water column towards a floating multi-chamber device. Ocean Eng. 2014, 76, 65–74. [Google Scholar] [CrossRef]
- López, I.; Pereiras, B.; Castro, F.; Iglesias, G. Optimisation of turbine-induced damping for an OWC wave energy converter using a RANS-VOF numerical model. Appl. Energy 2014, 127, 105–114. [Google Scholar] [CrossRef]
- Ning, D.Z.; Shi, J.; Zou, Q.P.; Teng, B. Investigation of hydrodynamic performance of an OWC wave energy device using a fully nonlinear HOBEM. Energy 2015, 83, 177–188. [Google Scholar] [CrossRef]
- Ning, D.Z.; Wang, R.Q.; Chang, C.W. Numerical simulation of a dual-chamber oscillating water column wave energy converter. Sustainability 2017, 9, 1599. [Google Scholar] [CrossRef]
- Iturrioz, A.; Guanche, R.; Lara, J.L.; Vidal, C.; Losada, I.J. Validation of OpenFOAM® for oscillating water column three-dimensional modeling. Ocean Eng. 2015, 107, 222–236. [Google Scholar] [CrossRef]
- Torres, F.R.; Teixeira, P.R.F.; Didier, E. Study of the turbine power output of an oscillating water column device by using a hydrodynamic-aerodynamic coupled model. Ocean Eng. 2016, 125, 147–154. [Google Scholar] [CrossRef]
- Elhanafi, A.; Macfarlane, G.; Fleming, A.; Leong, Z. Scaling and air compressibility effects on a three-dimensional offshore stationary OWC wave energy converter. Appl. Energy 2017, 189, 1–20. [Google Scholar] [CrossRef]
- Kuo, Y.S.; Chung, C.Y.; Hsiao, S.C.; Wang, Y.K. Hydrodynamic characteristics of oscillating water column caisson breakwaters. Renew. Energy 2017, 103, 439–447. [Google Scholar] [CrossRef]
- Crespo, A.J.C.; Altomare, C.; Domínguez, J.M.; González-Cao, J.; Moncho Gómez-Gesteira, M. Towards simulating floating offshore oscillating water column converters with smoothed particle hydrodynamics. Coast. Eng. 2017, 126, 11–16. [Google Scholar] [CrossRef]
- Sarmento, A.J.N.A. Wave flume experiments on two dimensional oscillating water column wave energy devices. Exp. Fluids 1992, 12, 286–292. [Google Scholar] [CrossRef]
- Sarmento, A.J.N.A.; Falcão, A.F.O. Wave generation by an oscillating surface-pressure and its application in wave-energy extraction. J. Fluid Mech. 1985, 150, 467–485. [Google Scholar] [CrossRef]
- Tseng, R.S.; Wu, R.H.; Huang, C.C. Model study of a shoreline wave-power system. Ocean Eng. 2000, 27, 801–821. [Google Scholar] [CrossRef]
- Boccotti, P.; Filianoti, P.; Fiamma, V.; Arena, F. Caisson breakwaters embodying an OWC with a small opening-part II: A small-scale field experiment. Ocean Eng. 2007, 34, 820–841. [Google Scholar] [CrossRef]
- Morris-Thomas, T.M.; Irvin, R.J.; Thiagarajan, K.P. An investigation into the hydrodynamic efficiency of an oscillating water column. J. Offshore Mech. Arct. Eng. 2007, 129, 273–278. [Google Scholar] [CrossRef]
- He, F.; Huang, Z.; Law, A.W.K. An experimental study of a floating breakwater with asymmetric pneumatic chambers for wave energy extraction. Appl. Energy 2013, 106, 222–231. [Google Scholar] [CrossRef]
- López, I.; Castro, A.; Iglesias, G. Hydrodynamic performance of an oscillating water column wave energy converter by means of particle imaging velocimetry. Energy 2015, 83, 89–103. [Google Scholar] [CrossRef]
- Delauré, Y.M.C.; Lewis, A. 3D hydrodynamic modelling of fixed oscillating water column wave power plant by a boundary element methods. Ocean Eng. 2003, 30, 309–330. [Google Scholar] [CrossRef]
- Ning, D.Z.; Wang, R.Q.; Zou, Q.P.; Teng, B. An experimental investigation of hydrodynamics of a fixed OWC wave energy converter. Appl. Energy 2016, 168, 636–648. [Google Scholar] [CrossRef]
- Chiu, Y.F.; Su, C.H.; Tseng, H.M. Oceanographically Observation Data—Annual Report 2013 (Taichung Harbor); Report No. MOTC-IOT-103-H2DA001e-H3; Institute of Transportation, Ministry of Transportation and Communications: Taipei, Taiwan, 2013. [Google Scholar]
- Taiwan International Ports Corporation, Ltd. The Forty-Year Master Planning of Taichung Harbor; Ministry of Transportation and Communications: Taipei, Taiwan, 2017. [Google Scholar]
- Flow Science, Inc. FLOW-3D User Manual; Flow Science, Inc.: Sante Fe, NM, USA, 2012. [Google Scholar]
- Hirt, C.W. Volume-fraction techniques: Powerful tools for wind engineering. J. Wind Eng. Indust. Aero. 1993, 46–47, 327–338. [Google Scholar] [CrossRef]
- Hirt, C.W.; Nichols, B.D. Volume of fluid (VOF) method for dynamics of free boundaries. J. Comp. Phys. 1981, 39, 201–225. [Google Scholar] [CrossRef]
- Yakhot, V.; Orszag, S.A. Renormalization group analysis of turbulence. J. Sci. Comput. 1986, 1, 3–51. [Google Scholar] [CrossRef]
- Yakhot, V.; Orszag, S.A.; Thangam, S.; Gatski, T.B.; Speziale, C.G. Development of turbulence models for shear flows by a double expansion technique. Phys. Fluids A 1992, 4, 1510–1520. [Google Scholar] [CrossRef]
- Speziale, C.G.; Thangam, S. Analysis of an RNG based turbulence model for separated flows. Int. J. Eng. Sci. 1992, 30, 1379–1388. [Google Scholar] [CrossRef]
- Choi, B.H.; Kim, D.C.; Pelinovsky, E.; Woo, S.B. Three-dimensional simulation of tsunami run-up around conical island. Coast. Eng. 2007, 54, 618–629. [Google Scholar] [CrossRef]
- Tsai, C.P.; Chen, Y.C.; Sihombing, T.O.; Lin, C. Simulations of moving effect of coastal vegetation on tsunami damping. Nat. Hazards Earth Syst. Sci. 2017, 17, 693–702. [Google Scholar] [CrossRef]
- Rienecker, M.M.; Fenton, J.D. A Fourier approximation method for steady water waves. J. Fluid Mech. 1981, 104, 119–137. [Google Scholar] [CrossRef]
- Munson, B.R.; Okiishi, T.H.; Huebsh, W.W.; Rothmayer, A.P. Fluid Mechanics, 7th ed.; John Wiley & Sons Singapore Pte Ltd.: Singapore, 2013. [Google Scholar]
- Goda, Y.; Suzuki, Y. Estimation of incident and reflection waves in random wave experiments. In Proceedings of the 15th International Conference Coastal Engineering, Honolulu, HI, USA, 11–17 July 1976. [Google Scholar]
- Elhanafi, A.; Fleming, A.; Macfarlane, G.; Leong, Z. Numerical energy balance analysis for an onshore oscillating water column wave energy converter. Energy 2016, 116, 539–557. [Google Scholar] [CrossRef]
Figure 1.
The 3D sketch of the present breakwater-integrated Oscillating Water Column (OWC) device.

Figure 2.
The geometry of (a) present OWC device (b) typical OWC devices.
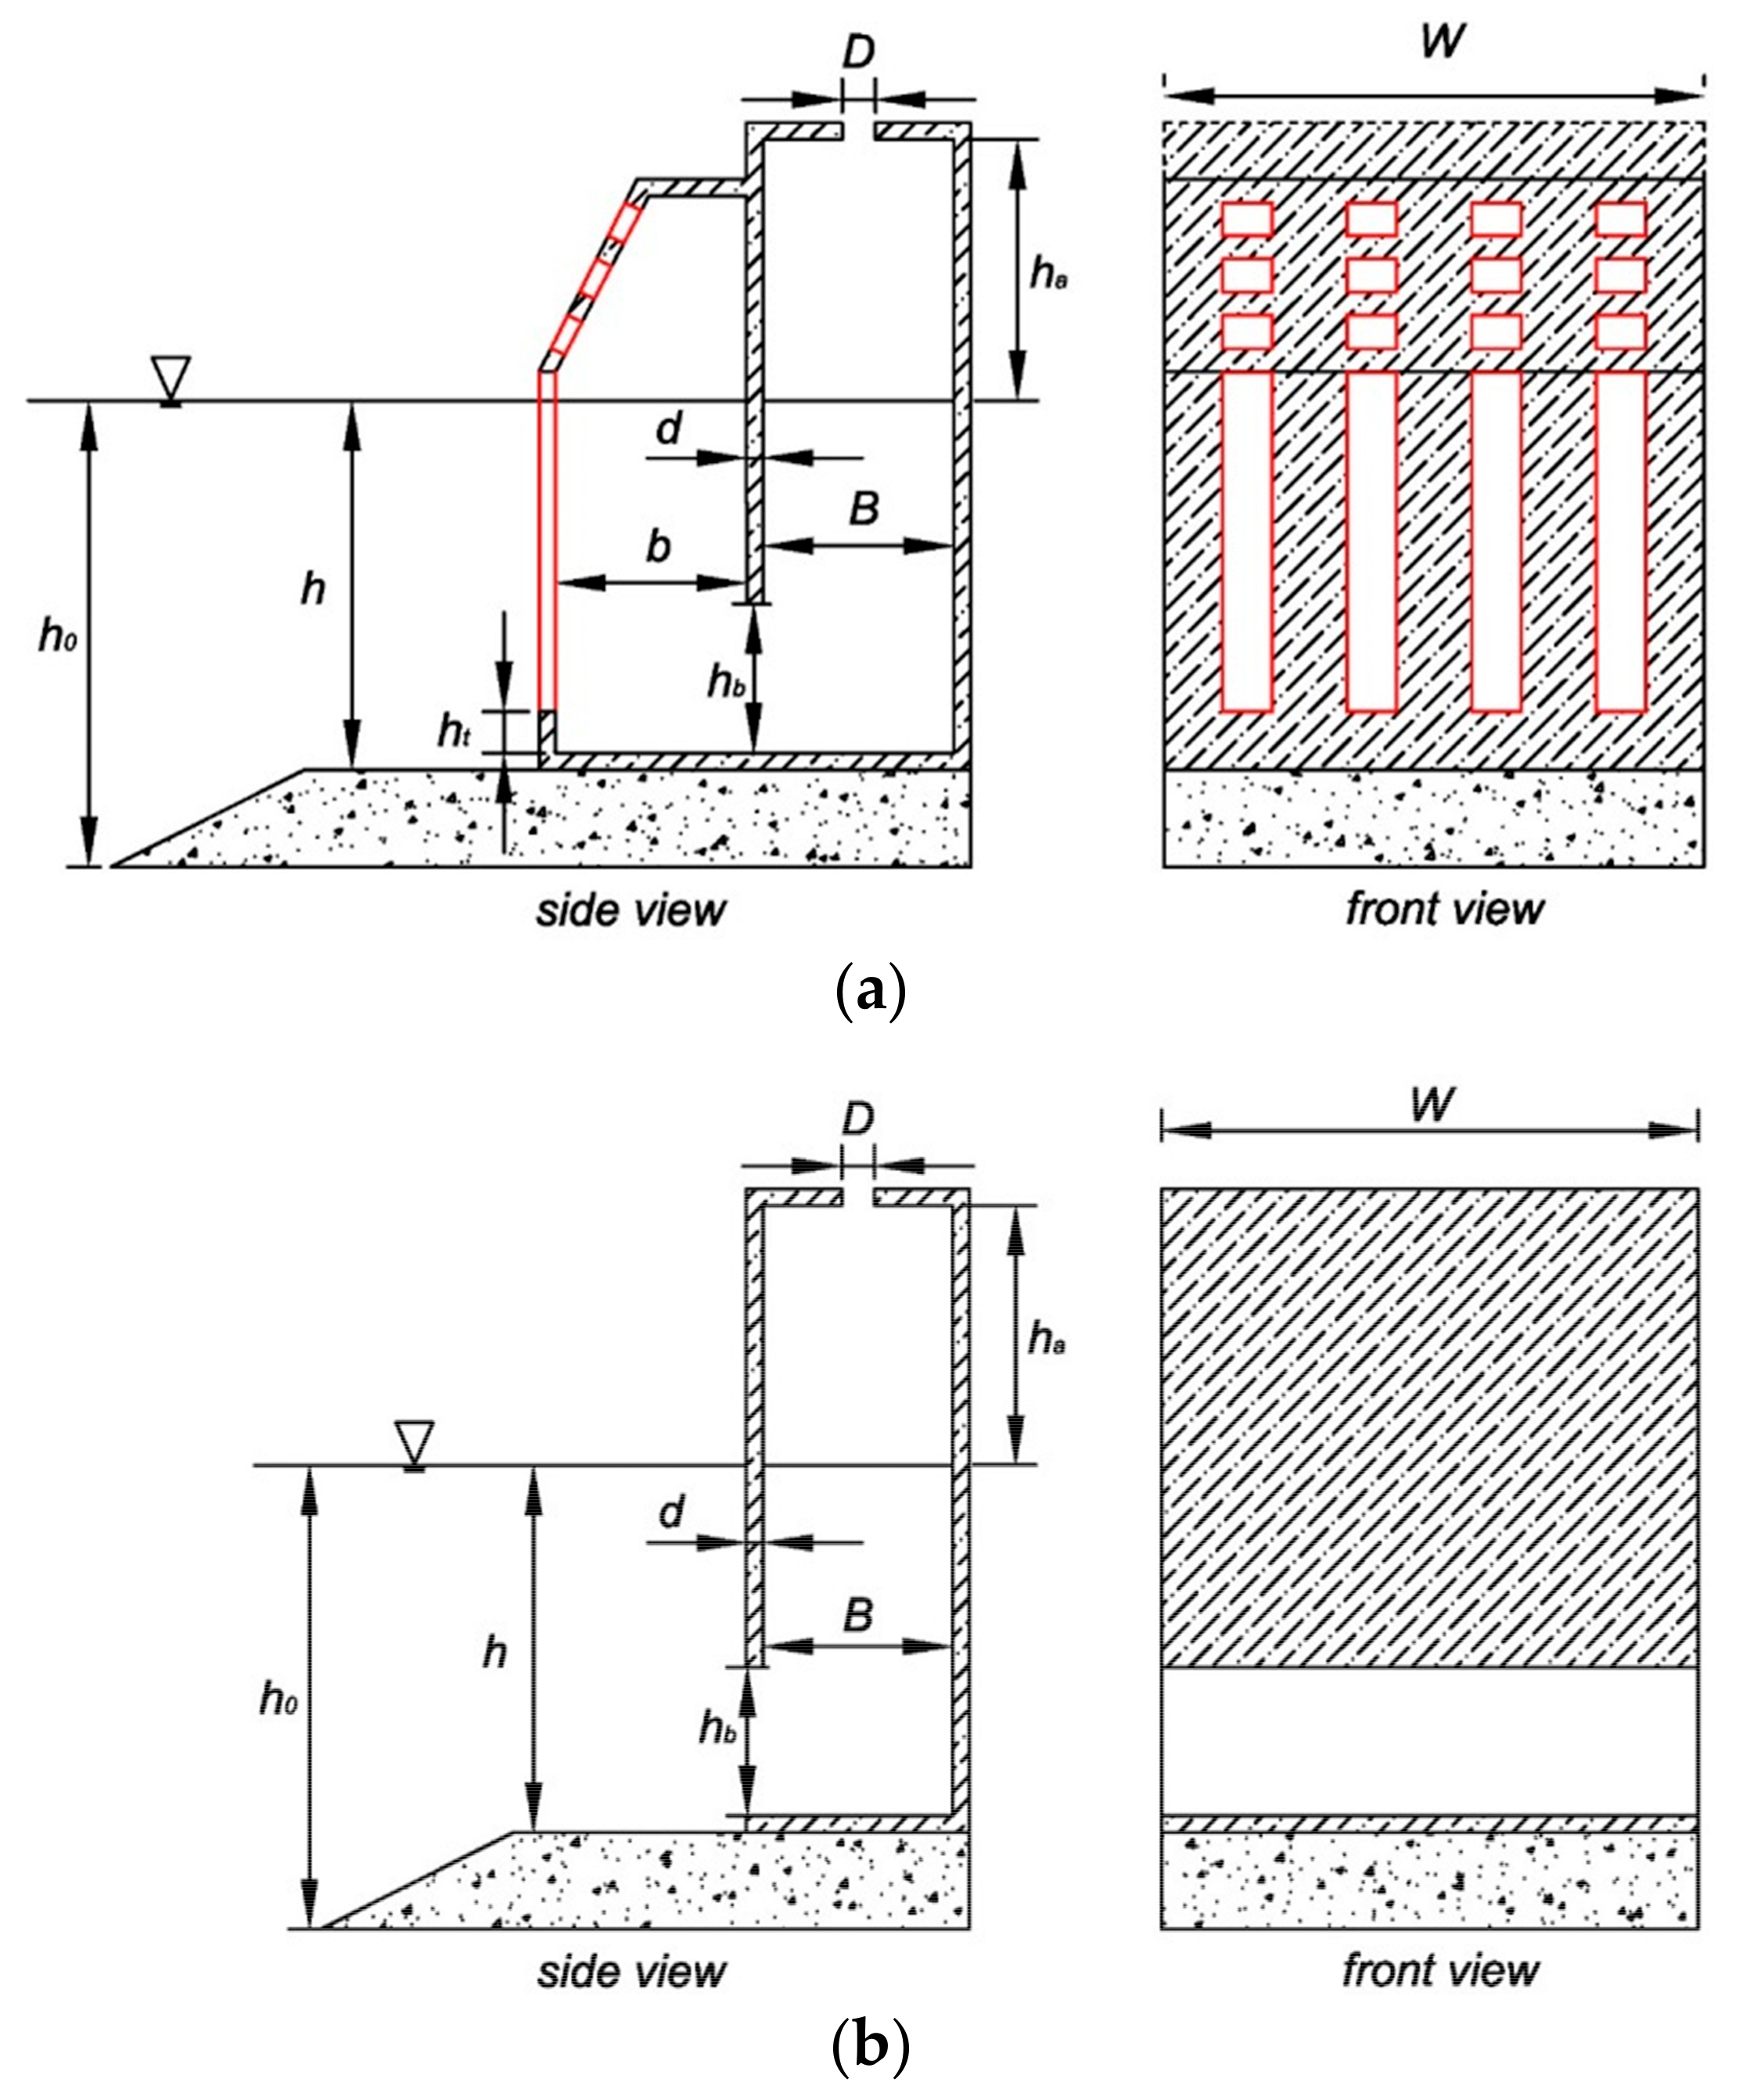
Figure 3.
The sketches of computational meshes of present and typical OWC devices.

Figure 4.
Correlation of air velocity profile across the orifice between empirical formula and computed result using the experimental conditions shown in Table 2.
Figure 4.
Correlation of air velocity profile across the orifice between empirical formula and computed result using the experimental conditions shown in Table 2.
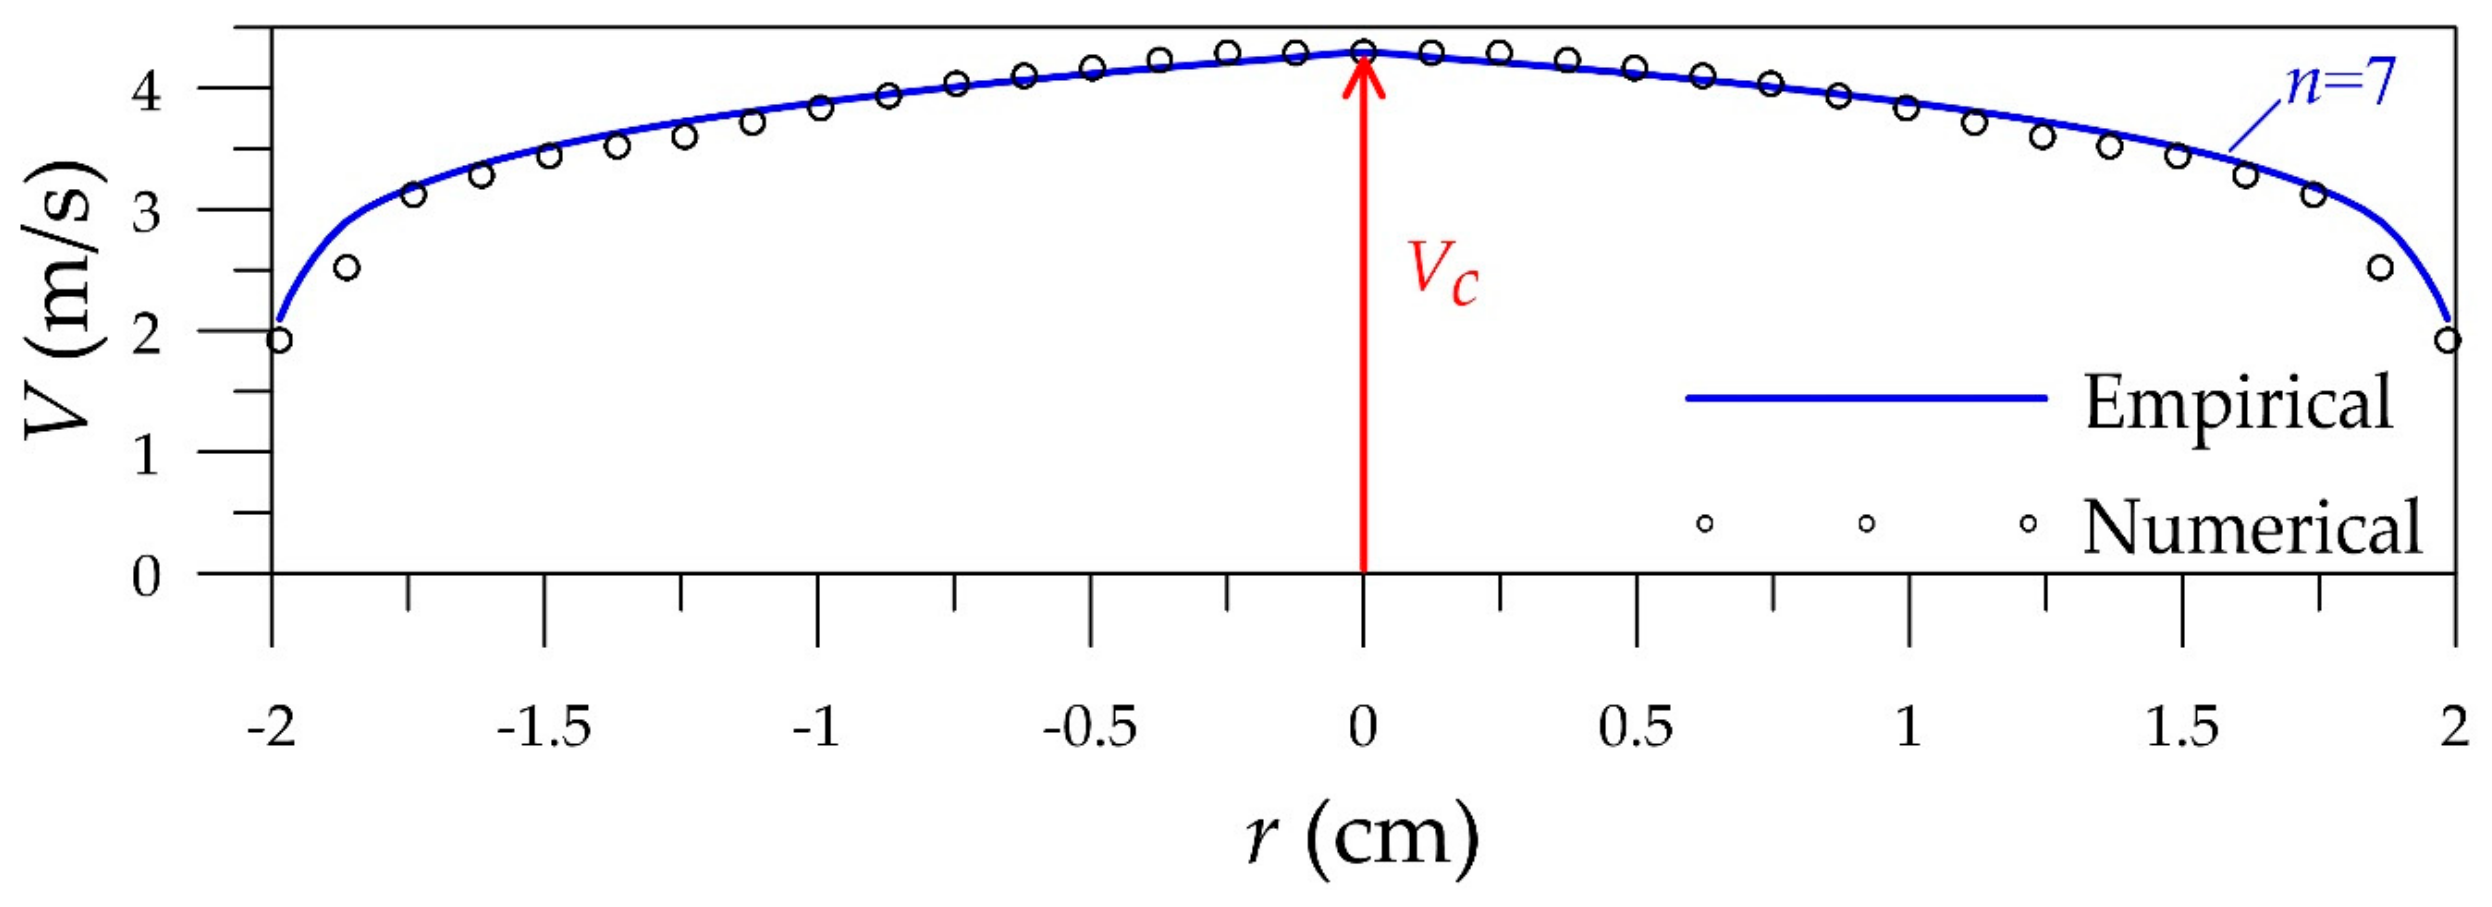
Figure 5.
Comparison between the numerical and experimental results of the flowrate through the orifice.
Figure 5.
Comparison between the numerical and experimental results of the flowrate through the orifice.

Figure 6.
The sketch of experimental set-up.
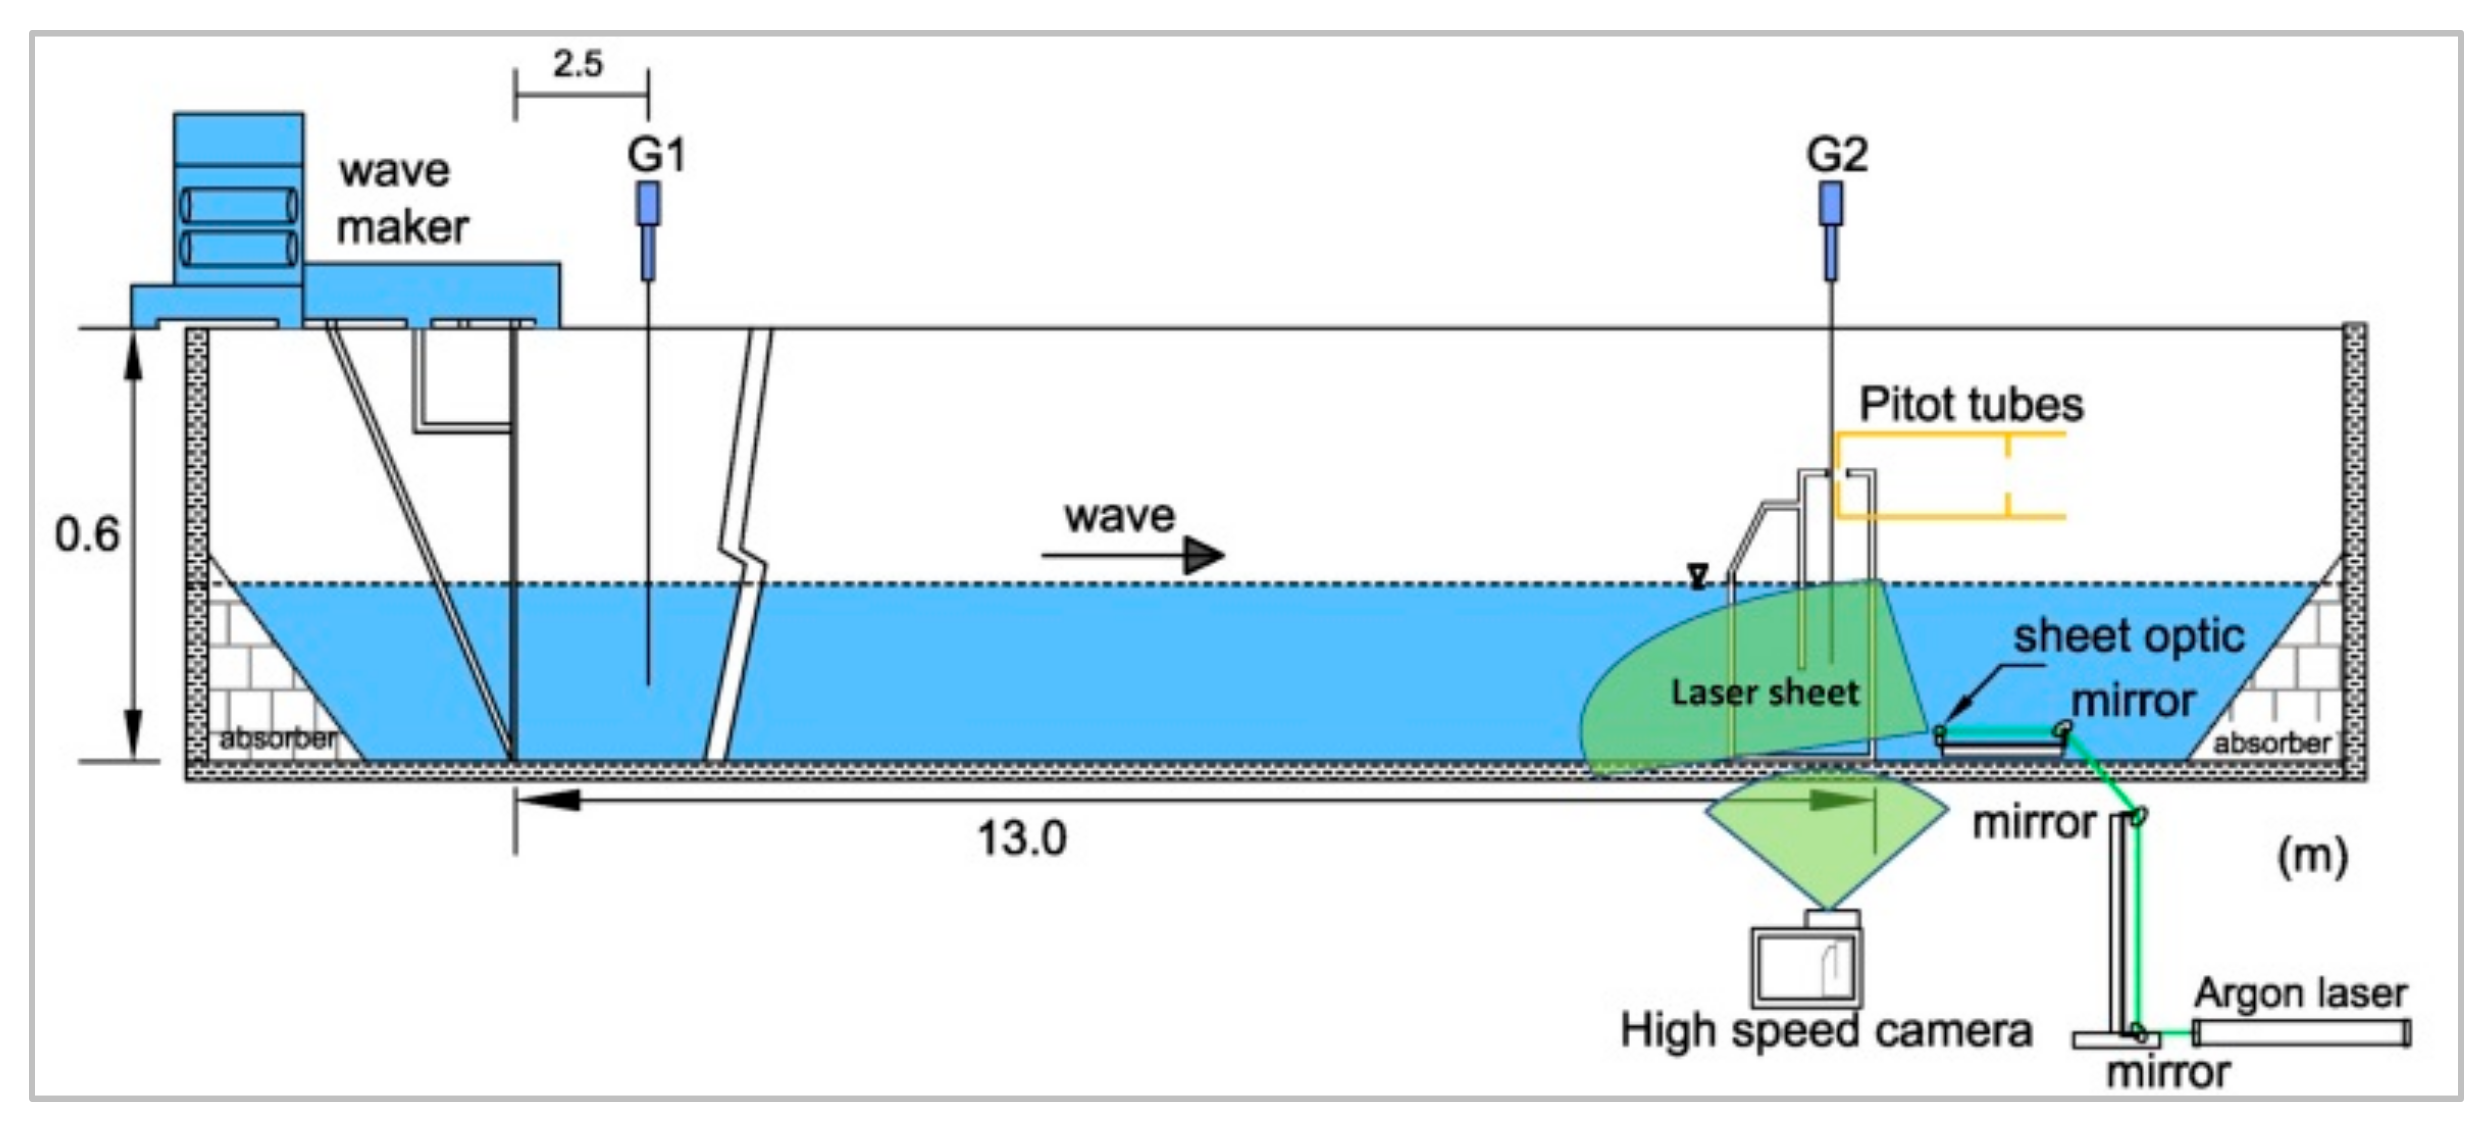
Figure 7.
Comparisons of hydrodynamic performance parameters between numerical results and experimental measurements for (a) present OWC device (b) typical OWC device.
Figure 7.
Comparisons of hydrodynamic performance parameters between numerical results and experimental measurements for (a) present OWC device (b) typical OWC device.

Figure 8.
Flow fields in the vicinity of the entrance of the present OWC chamber during the exhalation and inhalation stages, (A) t/T = 0; (B) t/T = 0.25; (C) t/T = 0.5; (D) t/T = 0.75. Left column: numerical simulations; right column: experimental observations.
Figure 8.
Flow fields in the vicinity of the entrance of the present OWC chamber during the exhalation and inhalation stages, (A) t/T = 0; (B) t/T = 0.25; (C) t/T = 0.5; (D) t/T = 0.75. Left column: numerical simulations; right column: experimental observations.

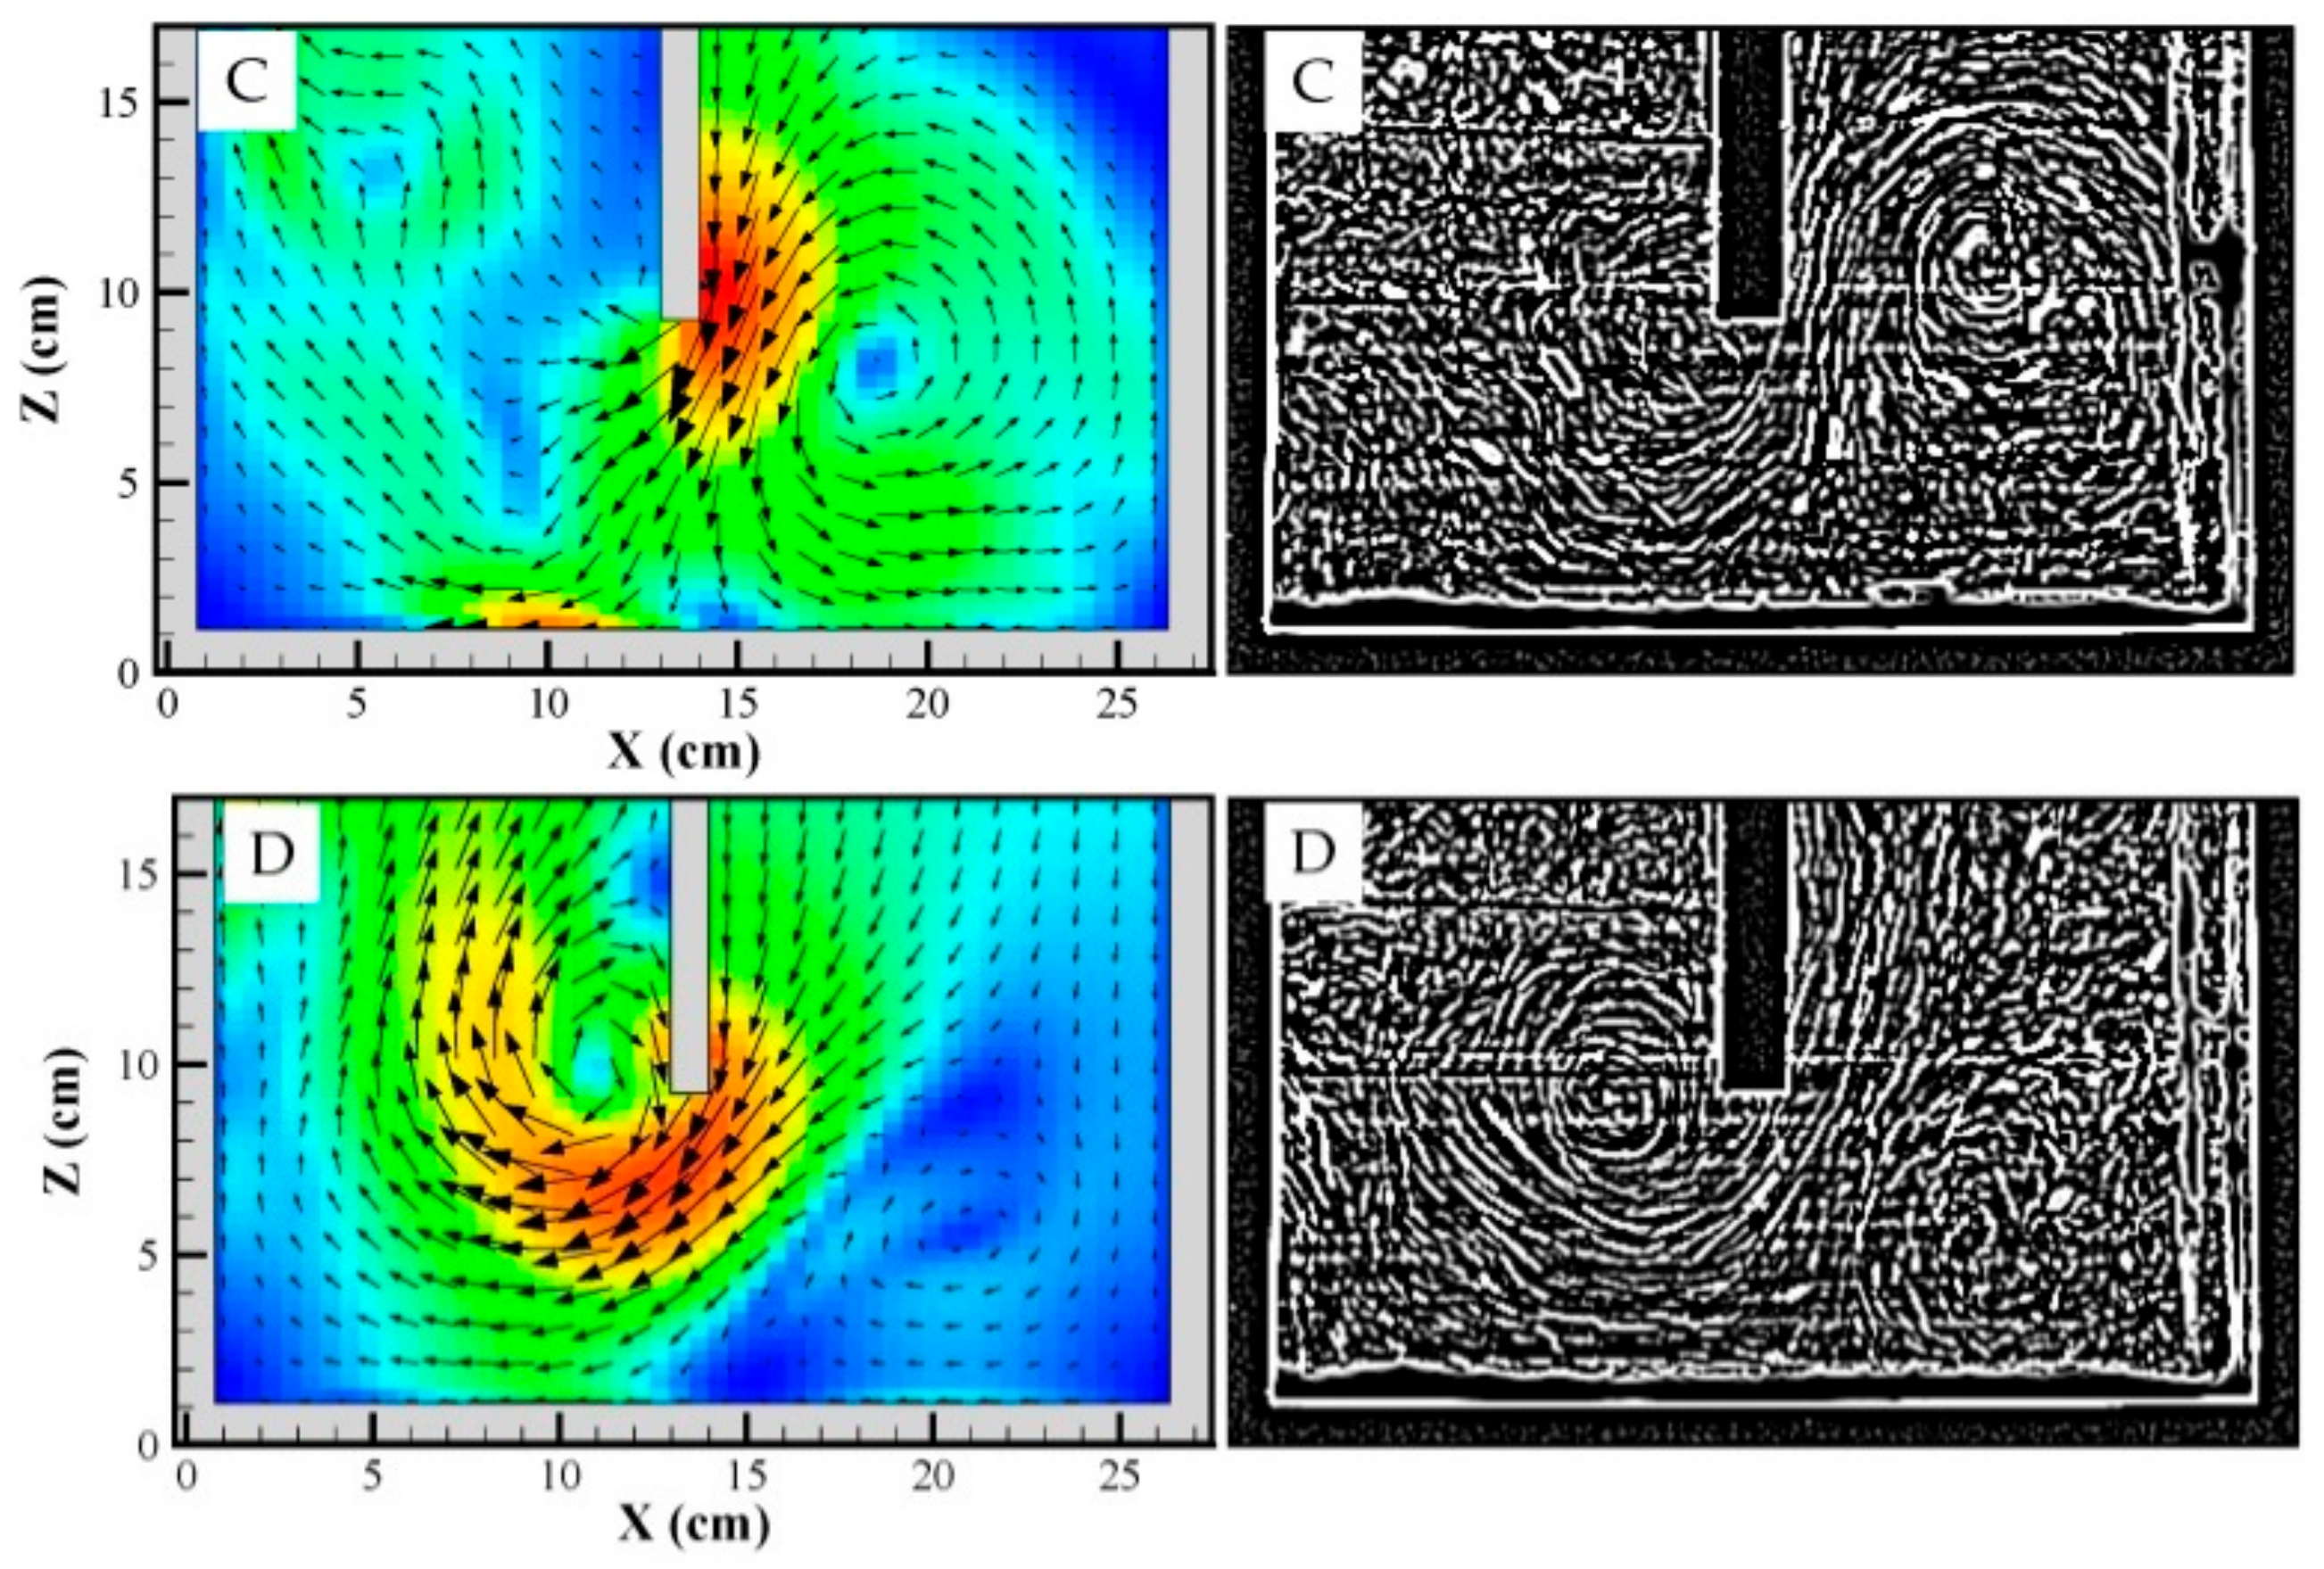
Figure 9.
Hydrodynamic efficiency versus relative water depth kho for different chamber breadths.

Figure 10.
The incident wave power Pw and pneumatic power Pair against the relative water depth kho for b:B = 1:1.
Figure 10.
The incident wave power Pw and pneumatic power Pair against the relative water depth kho for b:B = 1:1.
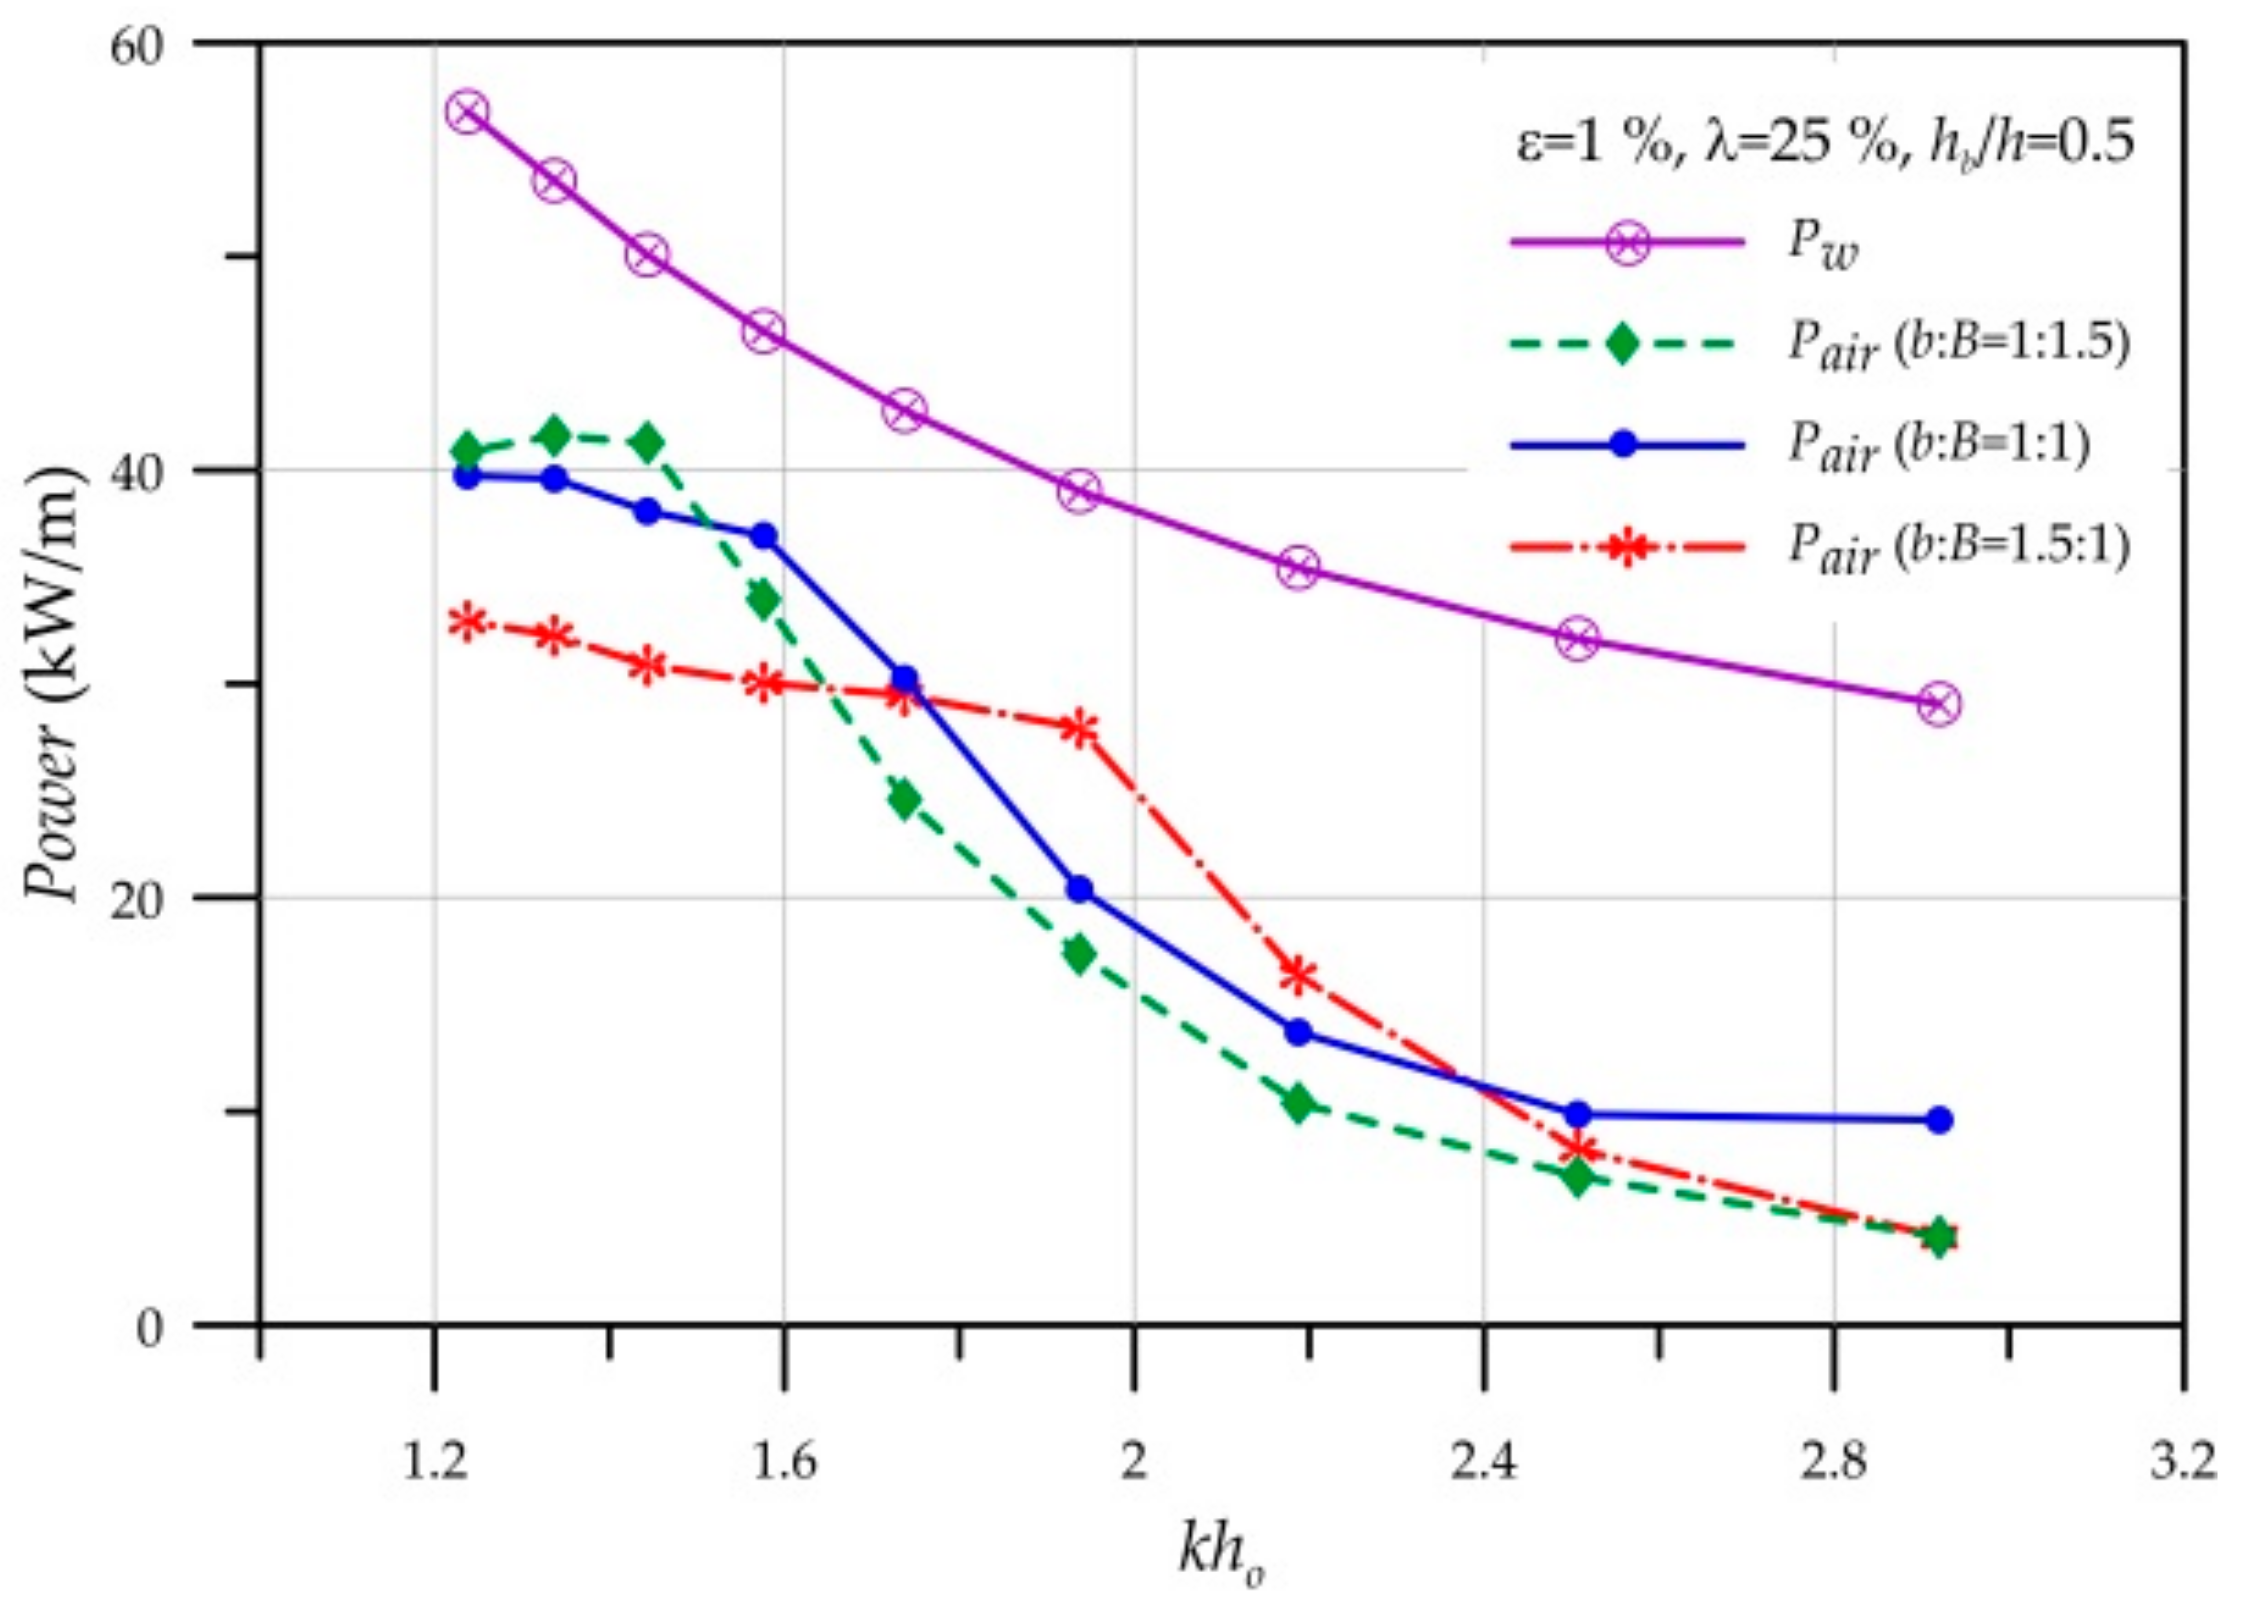
Figure 11.
Comparisons of the time variation of the performance parameters at kho = 1.58 for b:B = 1:1.5, 1:1, and 1.5:1.
Figure 11.
Comparisons of the time variation of the performance parameters at kho = 1.58 for b:B = 1:1.5, 1:1, and 1.5:1.
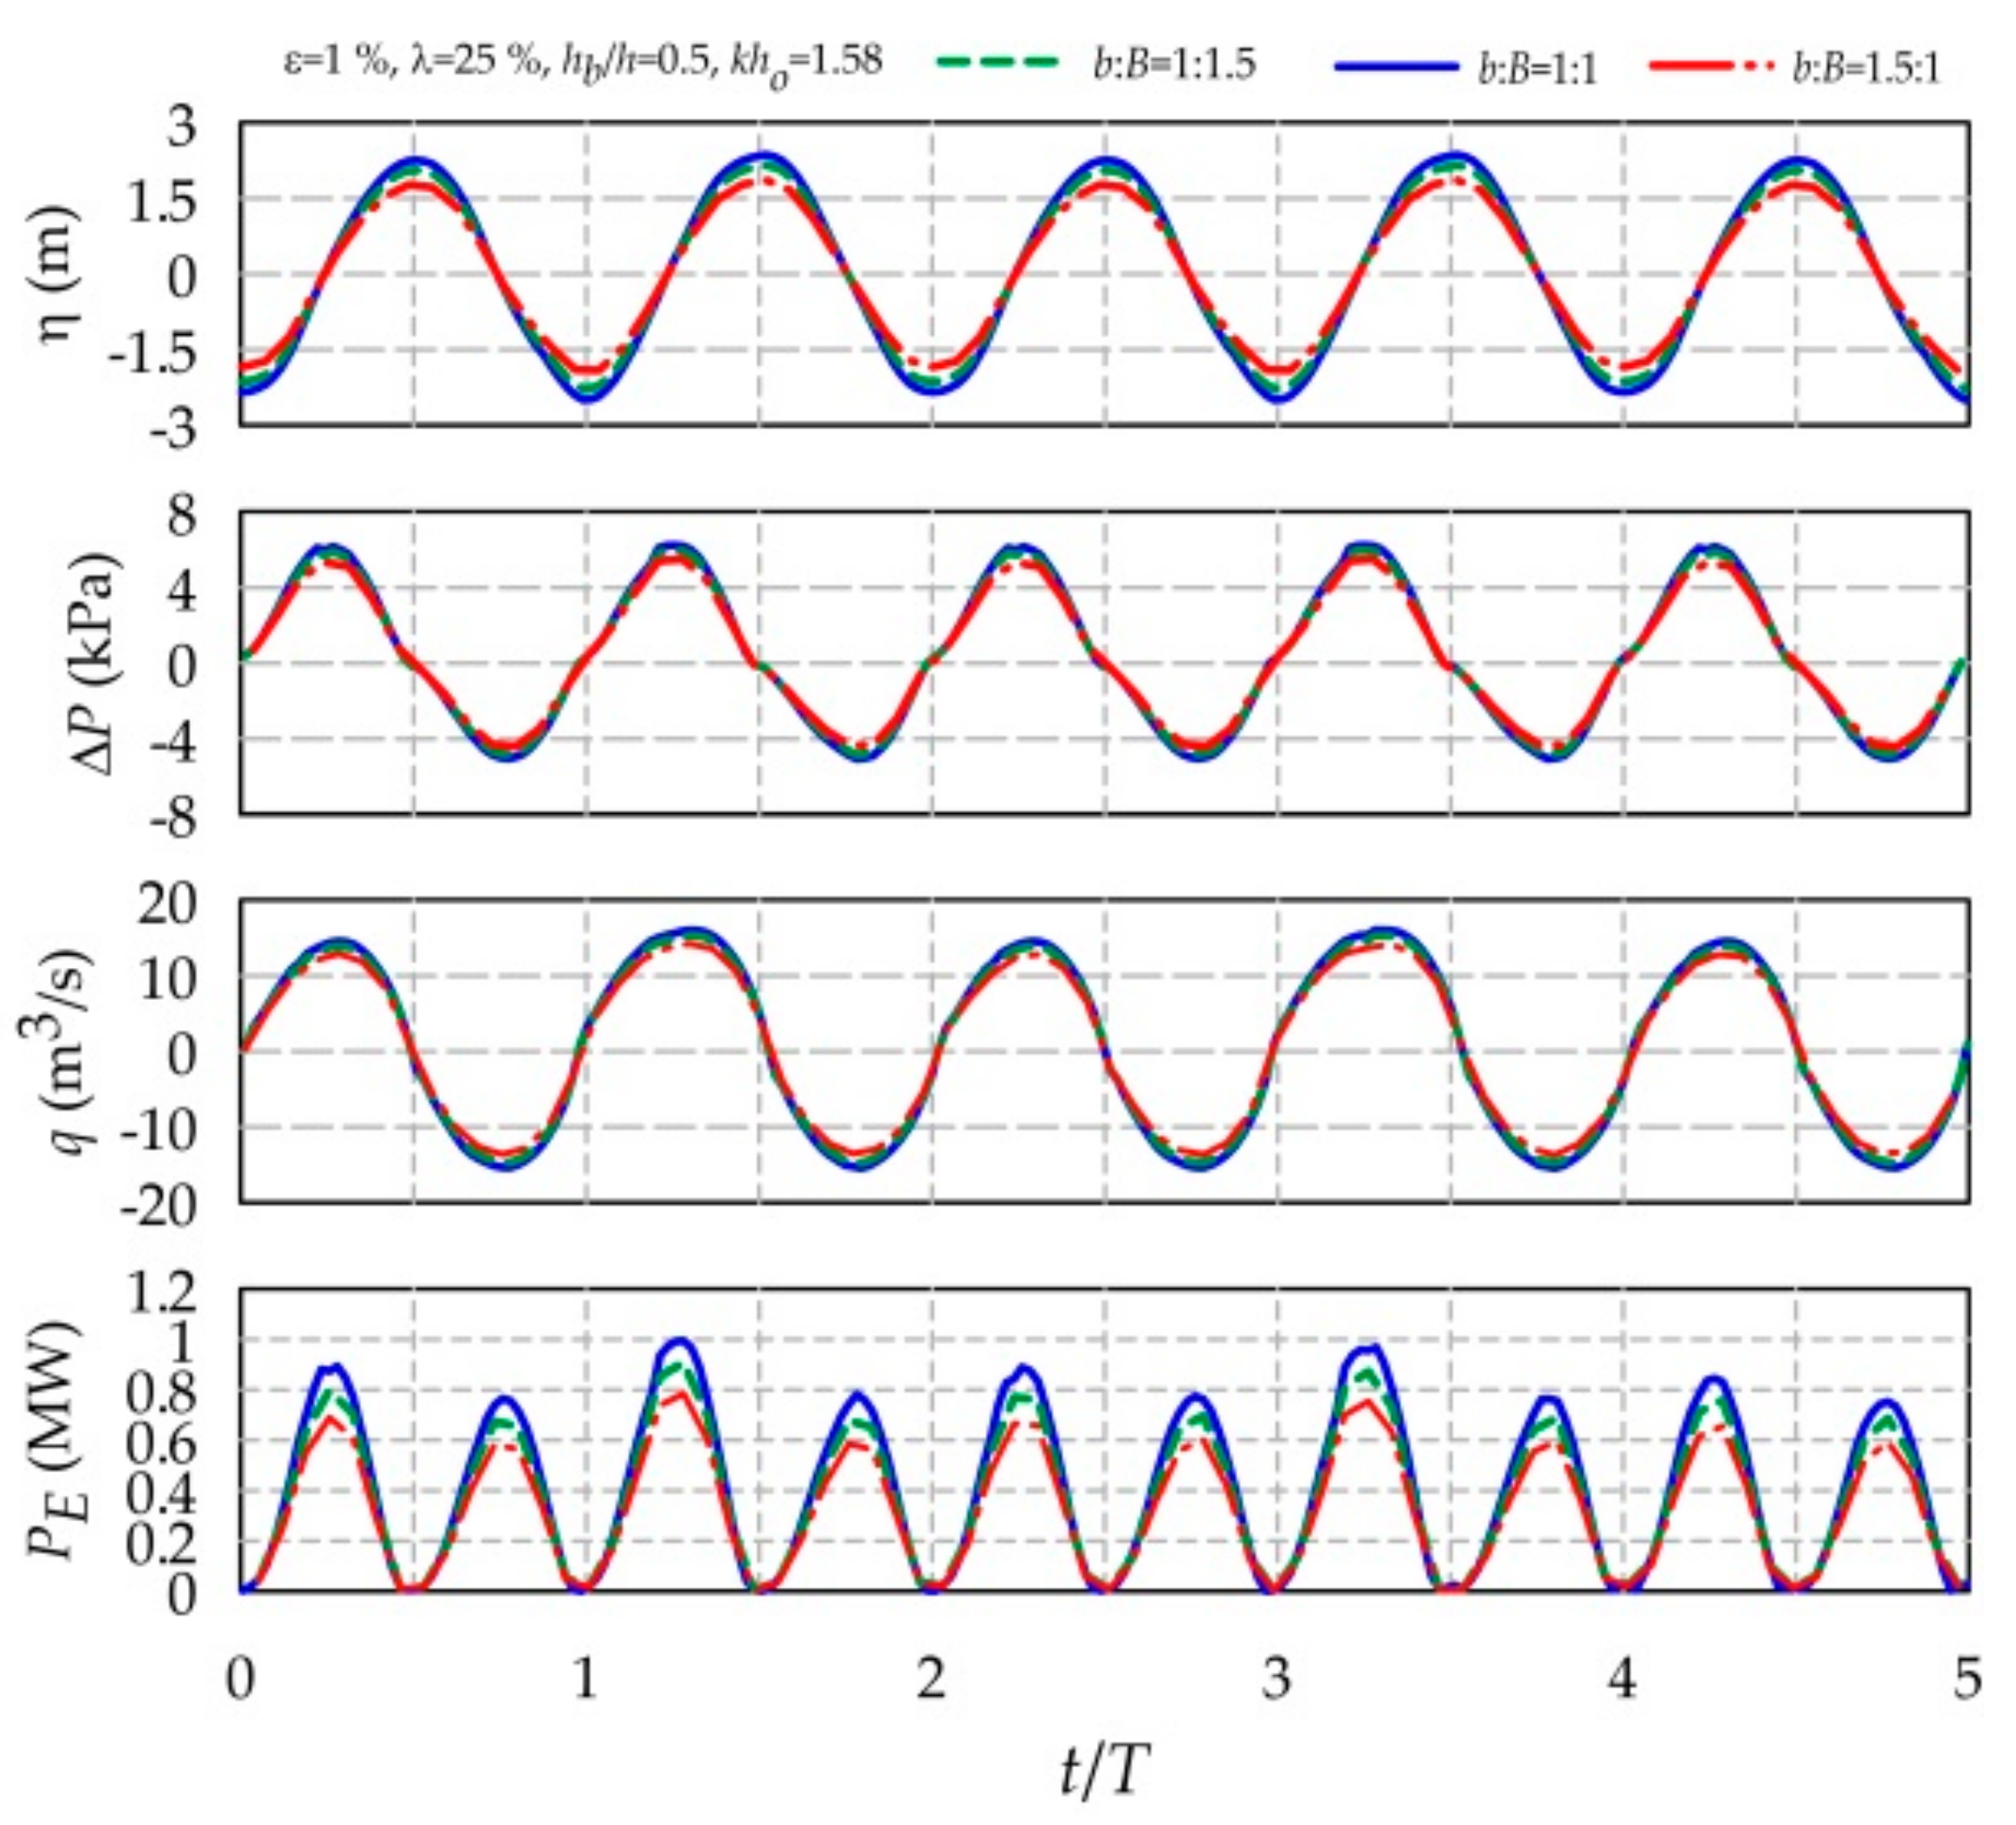
Figure 12.
Hydrodynamic efficiency versus different open heights of front submerged wall of OWC chamber for kho = 1.58 using b:B = 1:1, ε = 1%, and λ = 25%.
Figure 12.
Hydrodynamic efficiency versus different open heights of front submerged wall of OWC chamber for kho = 1.58 using b:B = 1:1, ε = 1%, and λ = 25%.
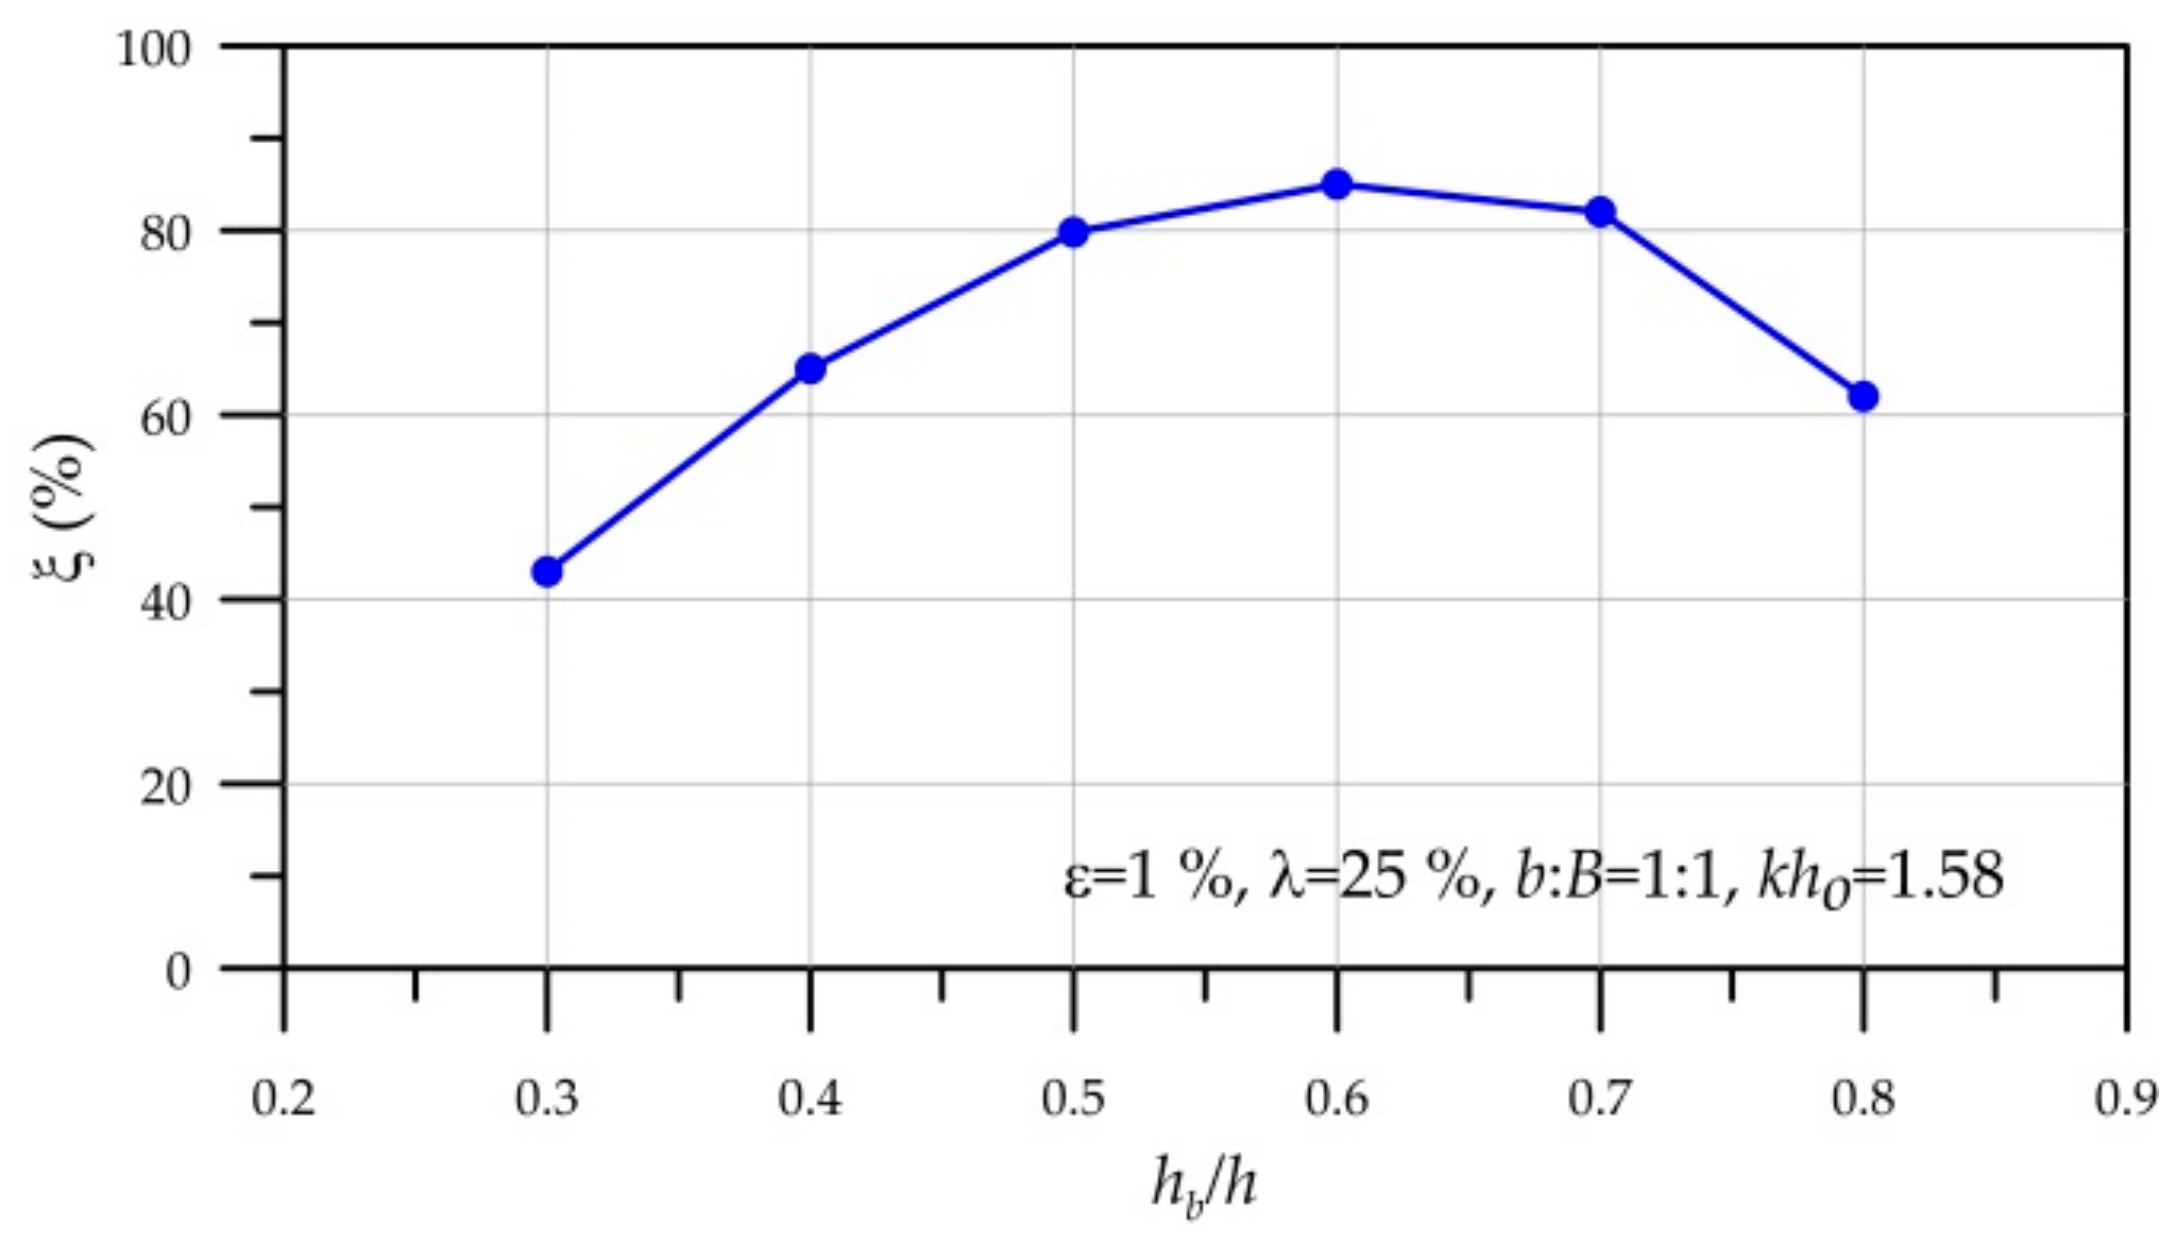
Figure 13.
Hydrodynamic efficiency versus different opening sizes of air orifice for kho = 1.58 using b:B = 1:1, hb/h = 0.5, and λ = 25%.
Figure 13.
Hydrodynamic efficiency versus different opening sizes of air orifice for kho = 1.58 using b:B = 1:1, hb/h = 0.5, and λ = 25%.
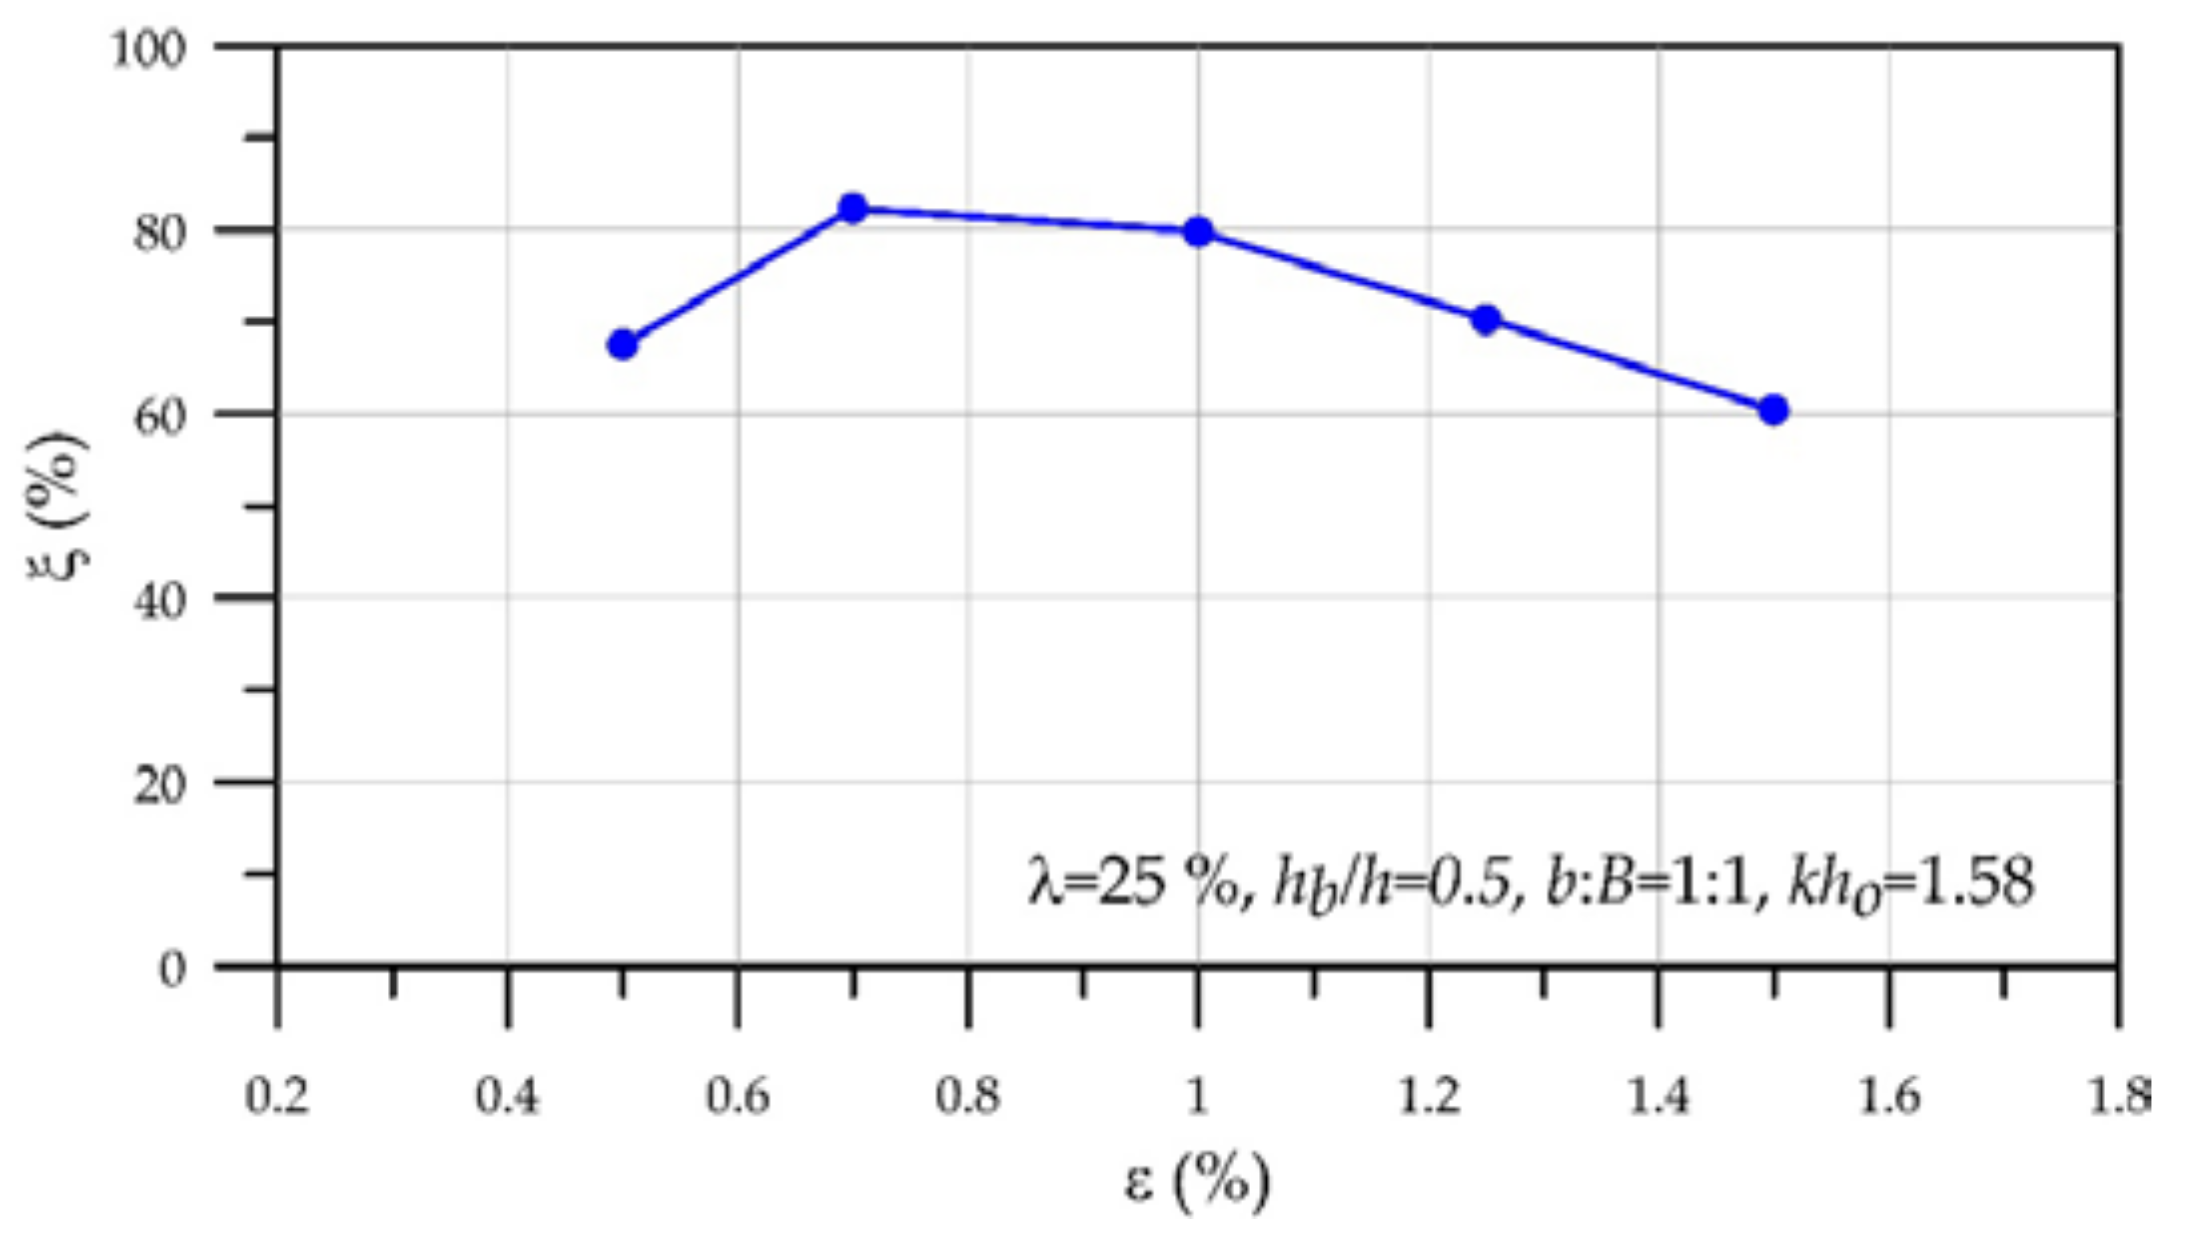
Figure 14.
(a) Hydrodynamic efficiency; (b) Wave reflection coefficient Kr; (c) Wave amplification coefficient Kt; (d) Dissipation of turbulent kinetic energy versus porosity of perforated front wall for kho = 1.58 using b:B = 1:1, hb/h = 0.5, and ε = 1%.
Figure 14.
(a) Hydrodynamic efficiency; (b) Wave reflection coefficient Kr; (c) Wave amplification coefficient Kt; (d) Dissipation of turbulent kinetic energy versus porosity of perforated front wall for kho = 1.58 using b:B = 1:1, hb/h = 0.5, and ε = 1%.

Figure 15.
Comparison of hydrodynamic efficiency between present and typical OWC devices versus relative water depth kho.
Figure 15.
Comparison of hydrodynamic efficiency between present and typical OWC devices versus relative water depth kho.
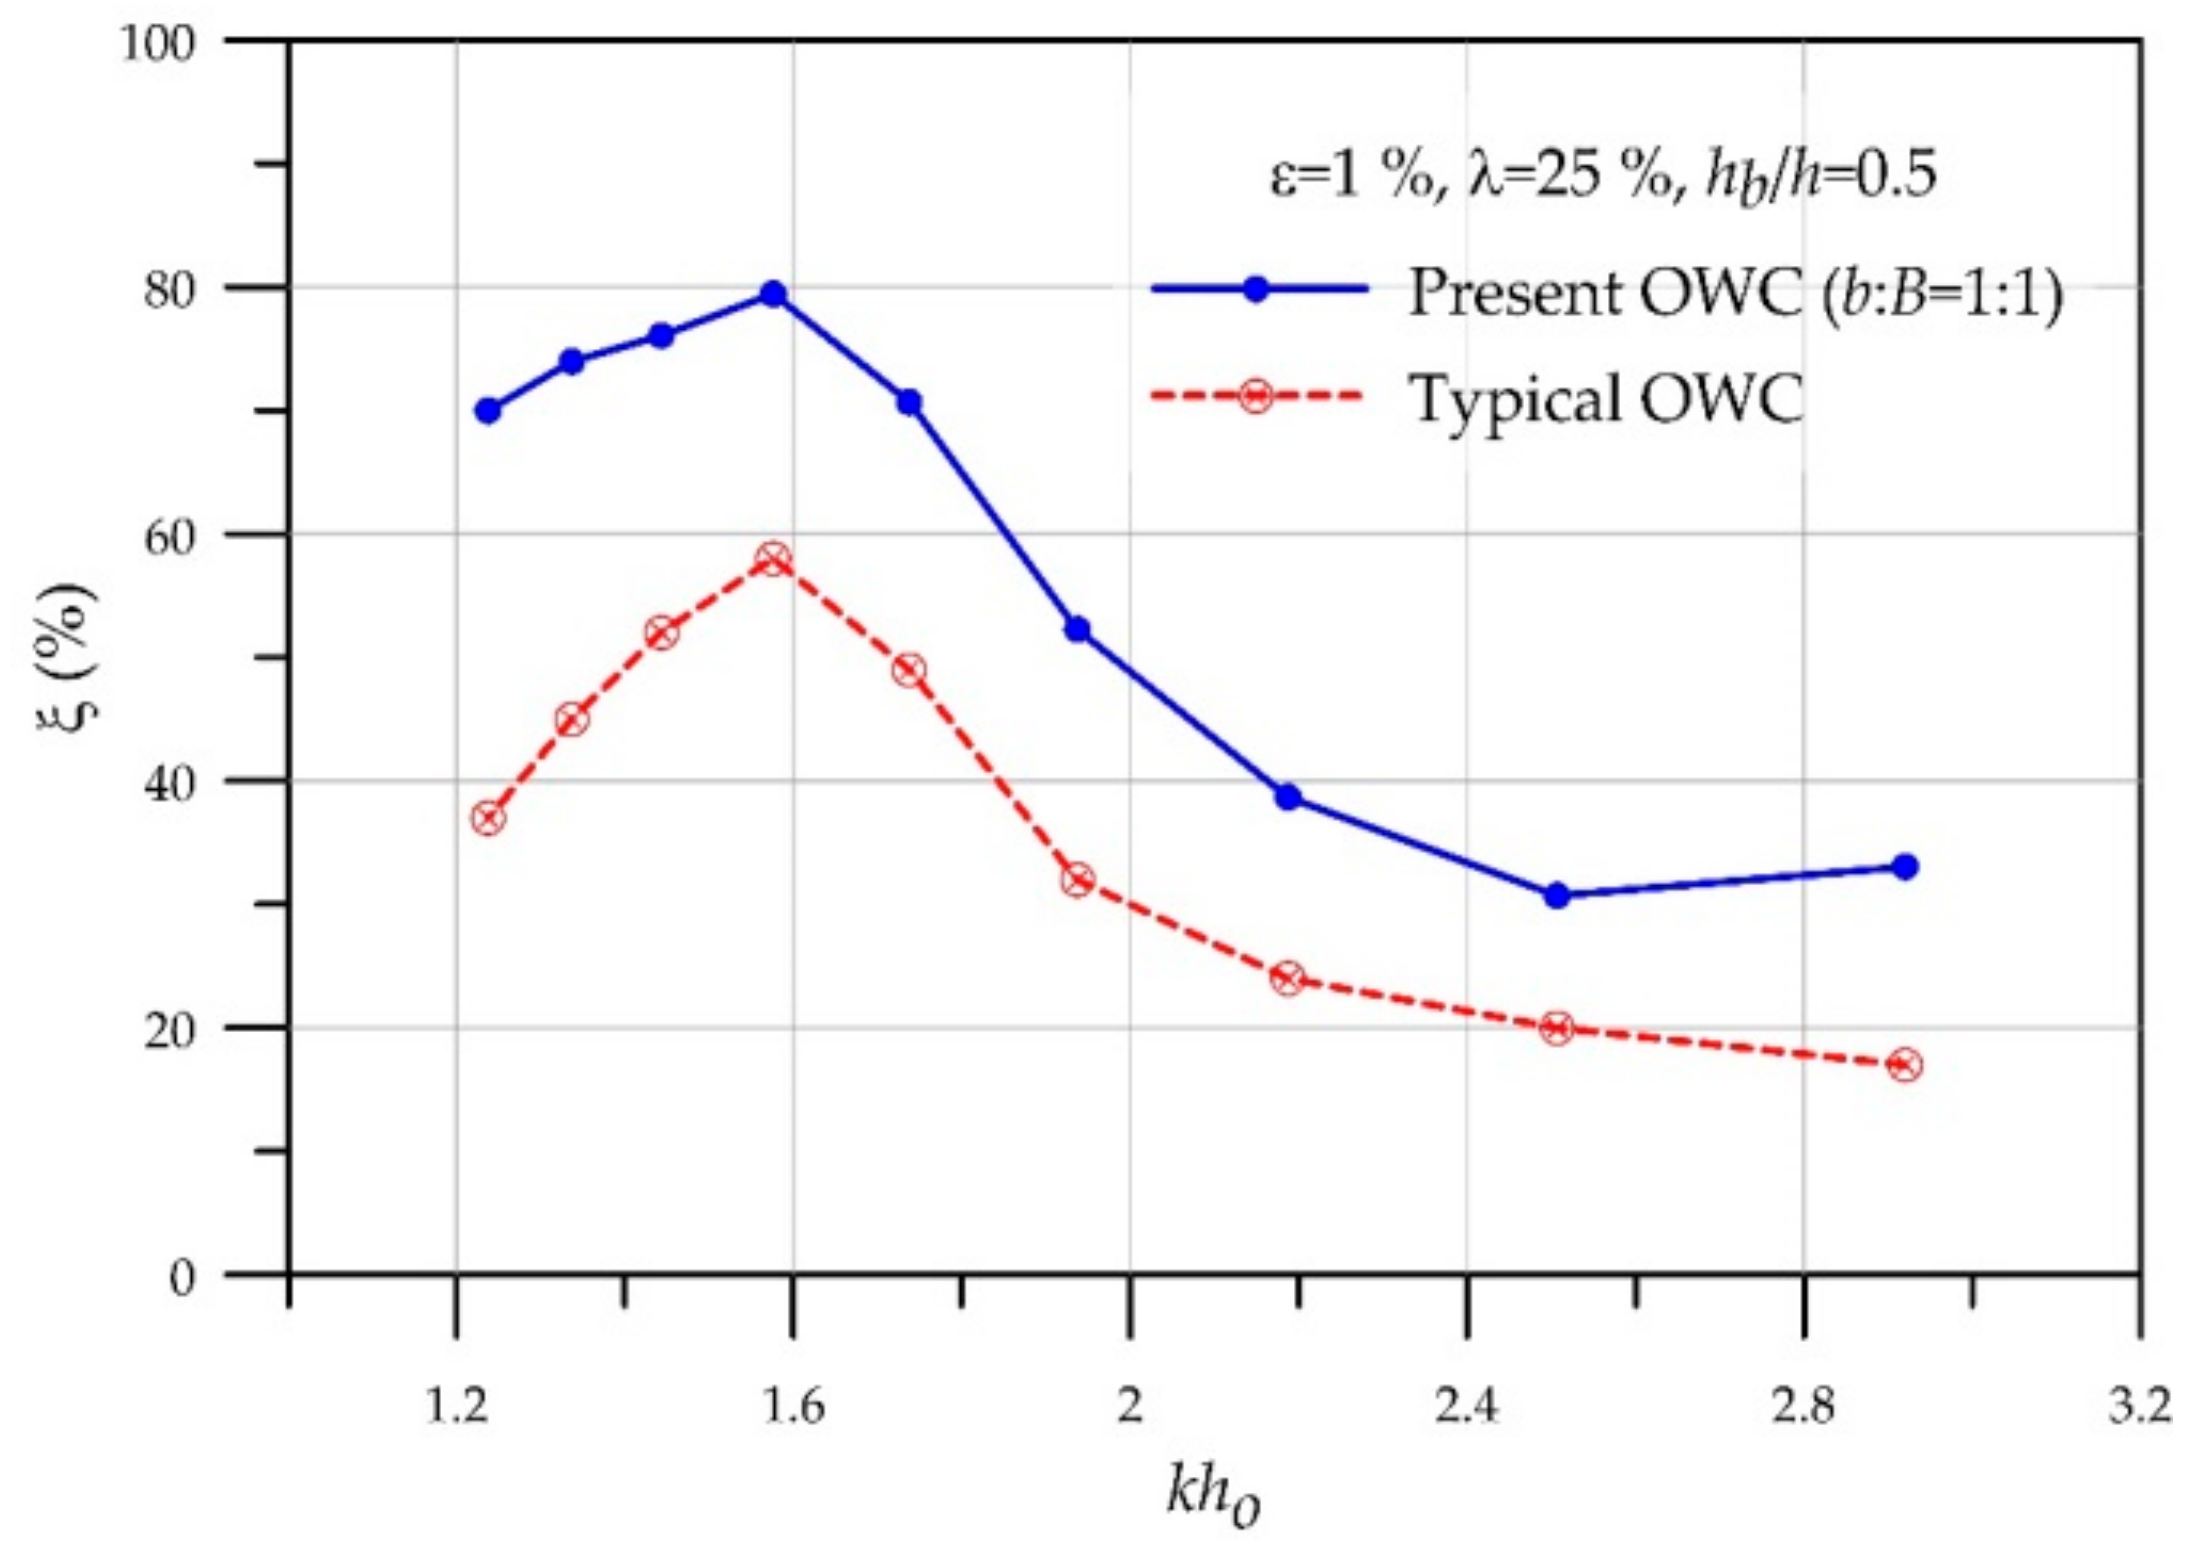
Figure 16.
Comparison of the time variation of the performance parameters between present and typical OWC devices.
Figure 16.
Comparison of the time variation of the performance parameters between present and typical OWC devices.
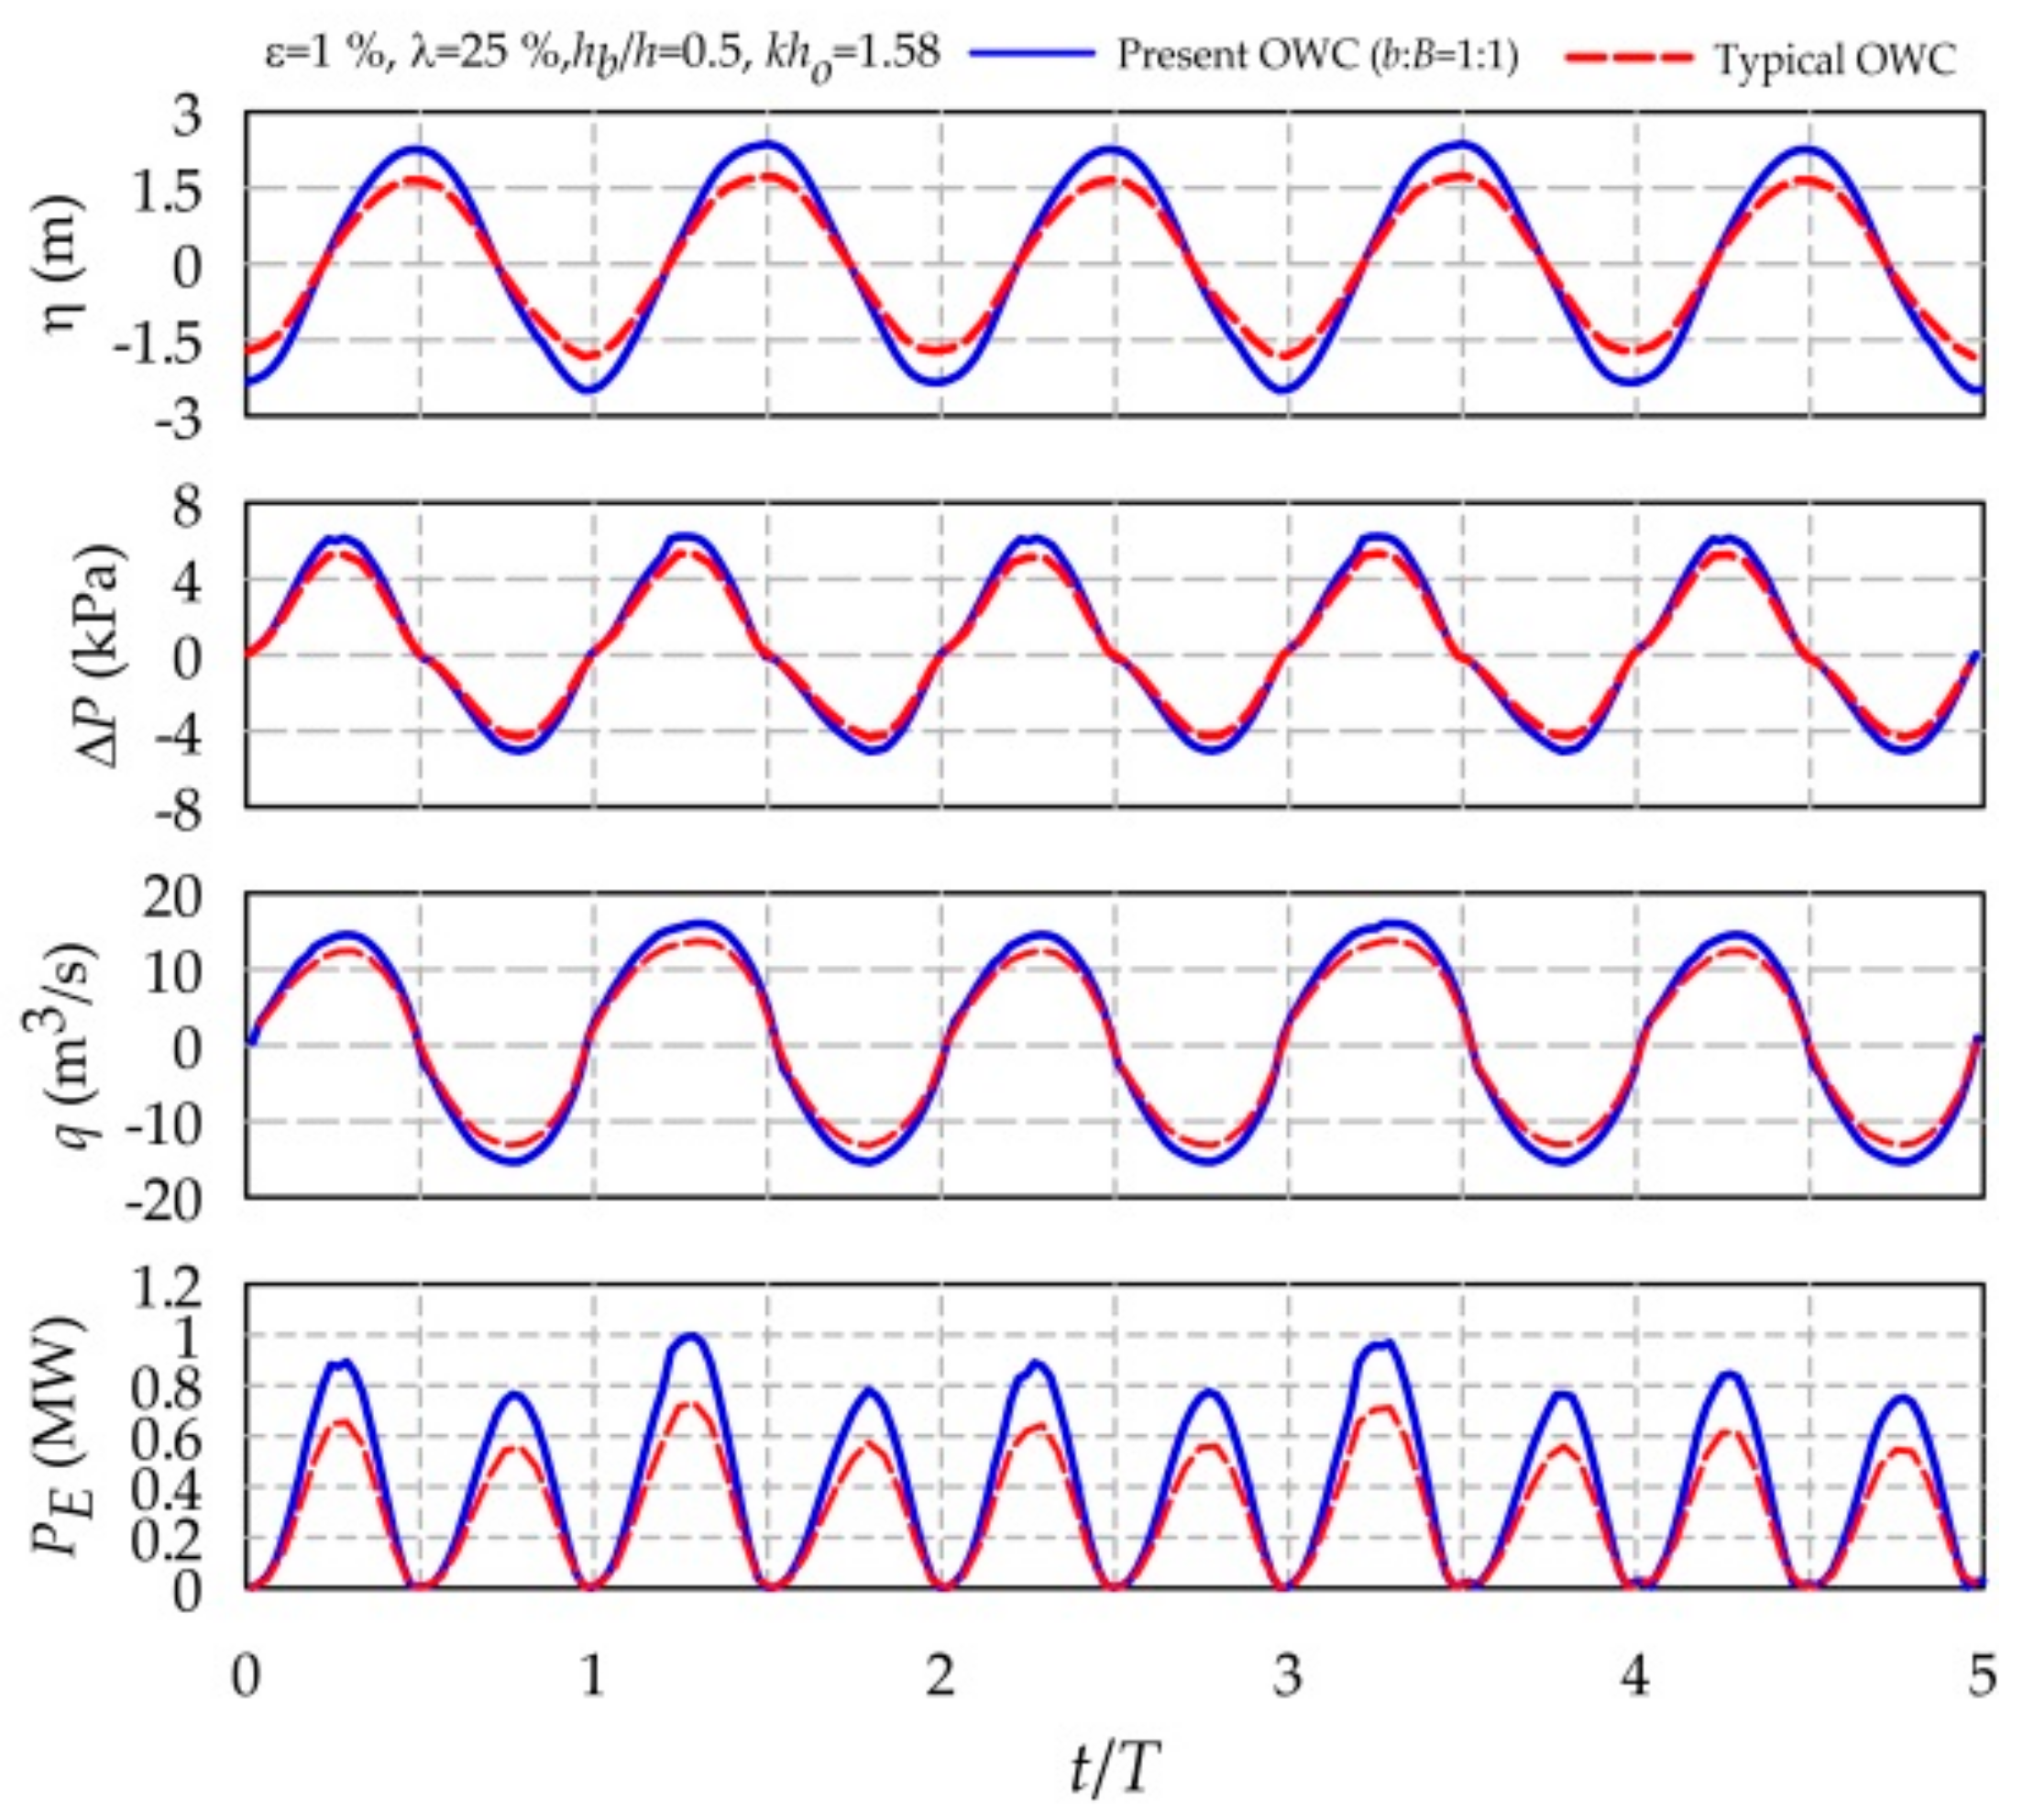
Figure 17.
Comparisons of flow characteristics at A: t/T = 0; B: t/T = 0.25; C: t/T = 0.5; D: t/T = 0.75. Left column: present OWC device; right column: typical OWC device.
Figure 17.
Comparisons of flow characteristics at A: t/T = 0; B: t/T = 0.25; C: t/T = 0.5; D: t/T = 0.75. Left column: present OWC device; right column: typical OWC device.

Figure 18.
Comparison of the variation of DTKE of the present and typical OWC devices.
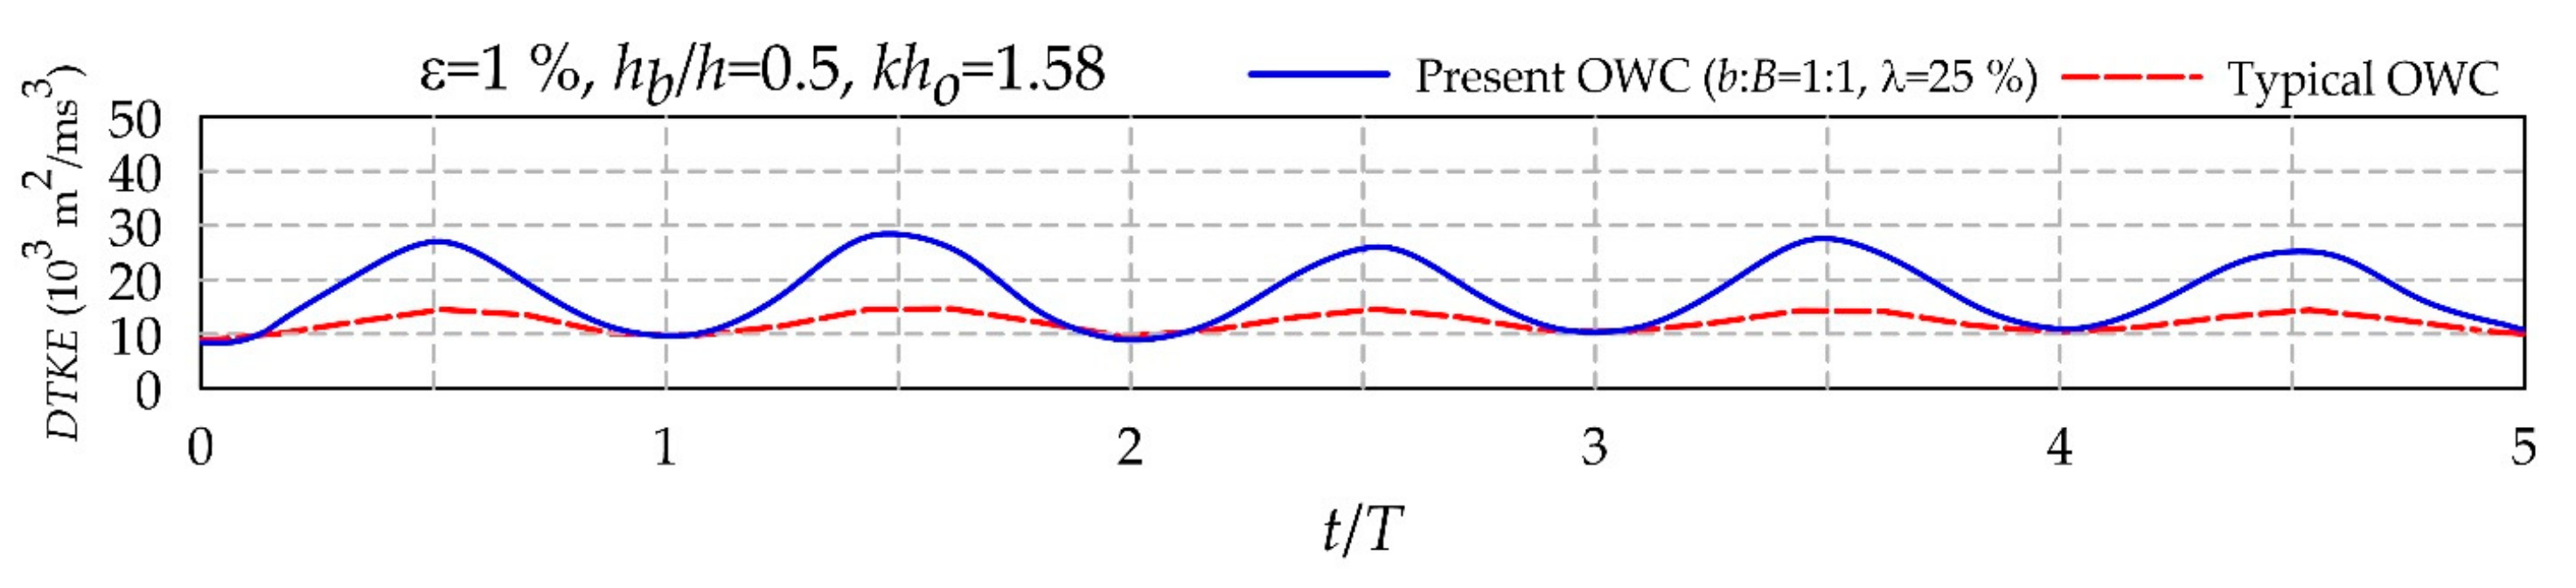
Figure 19.
Comparisons of the synthesized surface elevation (η) probed at antinode in front of OWC device and the reconstructed profile of incident wave (ηi). Left: present OWC device; right: typical OWC device.
Figure 19.
Comparisons of the synthesized surface elevation (η) probed at antinode in front of OWC device and the reconstructed profile of incident wave (ηi). Left: present OWC device; right: typical OWC device.
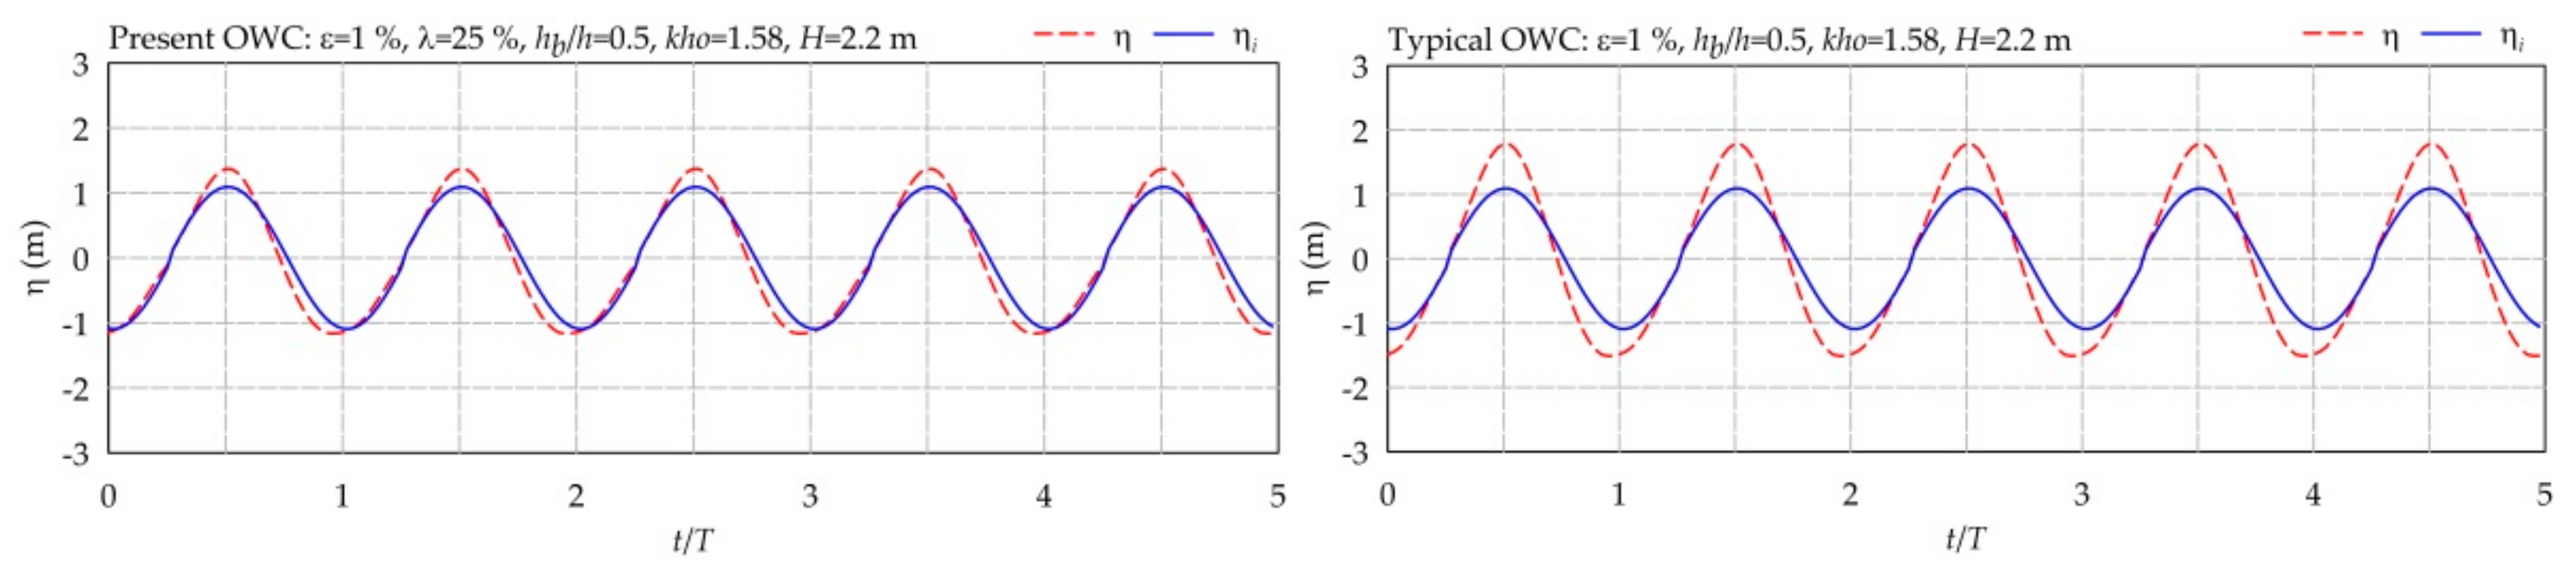
Figure 20.
Comparison of the horizontal force acting on the submerged open wall of the present and typical OWC devices.
Figure 20.
Comparison of the horizontal force acting on the submerged open wall of the present and typical OWC devices.

Table 1.
Arrangement of computational meshes.
| ΔX | ΔY | ΔZ | ΔZ (Water Surface Region) | |
|---|---|---|---|---|
| zone A | L/56~L/186 | W/10 | H/22 | H/44 |
| zone B | L/112~L/372 | W/20 | H/44 | H/88 |
| zone C | L/112~L/372 | W/20 | H/66 | H/132 |
| zone D | D/10~D/18 | D/10~D/18 | d/5 | - |
| zone S | L/168~L/558 | W/20 | H/66 | H/132 |
L: wavelength; H: incident wave height; W: chamber width; D: orifice diameter; d: wall thickness.
Table 2.
Experimental conditions.
| Parameters | Present OWC Device | Typical OWC Device | |
|---|---|---|---|
| incident wave | H | 3.45 cm | 3.45 cm |
| T | 0.875 s | 0.875 s | |
| h | 21.0 cm | 21.0 cm | |
| ho | 21.0 cm | 21.0 cm | |
| kho | 1.285 | 1.285 | |
| geometry of OWC device | B | 11.5 cm | 11.5 cm |
| b | 11.5 cm | - | |
| hb | 9.0 cm | 9.0 cm | |
| ht | 2.0 cm | - | |
| D | 4.0 cm | 4.0 cm | |
| d | 1.0 cm | 1.0 cm | |
| ha | 9.0 cm | 9.0 cm | |
| λ | 25% | - | |
| W | 48.0 cm | 48.0 cm | |
Table 3.
Conditions of numerical simulations for full-scale model.
| Parameters | Present OWC Device | Typical OWC Device | |
|---|---|---|---|
| incident wave | H | 2.2 m | 2.2 m |
| T | 6.0–10.0 s | 6.0–10.0 s | |
| h | 18.0 m | 18.0 m | |
| ho | 26.0 m | 26.0 m | |
| kho | 1.25–2.92 | 1.25–2.92 | |
| geometry of OWC device | b + B | 21.0 m | - |
| B | 8.4, 10.5, 12.6 m | 10.5 m | |
| b | 8.4, 10.5, 12.6 m | - | |
| hb | 5.4–14.4 m | 9.0 m | |
| ht | 1.5 m | - | |
| D | 0.82–1.41m | 1.15 m | |
| d | 0.5 m | 0.5 m | |
| ha | 8.0 m | 8.0 m | |
| λ | 15%–60% | - | |
| W | 10.0 m | 10.0 m | |
© 2018 by the authors. Licensee MDPI, Basel, Switzerland. This article is an open access article distributed under the terms and conditions of the Creative Commons Attribution (CC BY) license (http://creativecommons.org/licenses/by/4.0/).
Share and Cite
MDPI and ACS Style
Tsai, C.-P.; Ko, C.-H.; Chen, Y.-C. Investigation on Performance of a Modified Breakwater-Integrated OWC Wave Energy Converter. Sustainability 2018, 10, 643. https://doi.org/10.3390/su10030643
AMA Style
Tsai C-P, Ko C-H, Chen Y-C. Investigation on Performance of a Modified Breakwater-Integrated OWC Wave Energy Converter. Sustainability. 2018; 10(3):643. https://doi.org/10.3390/su10030643
Chicago/Turabian StyleTsai, Ching-Piao, Chun-Han Ko, and Ying-Chi Chen. 2018. "Investigation on Performance of a Modified Breakwater-Integrated OWC Wave Energy Converter" Sustainability 10, no. 3: 643. https://doi.org/10.3390/su10030643
Note that from the first issue of 2016, this journal uses article numbers instead of page numbers. See further details here.