Model Prediction of Secondary Soil Salinization in the Keriya Oasis, Northwest China


 ,
, 
Abstract
:1. Introduction
2. Material and Methods
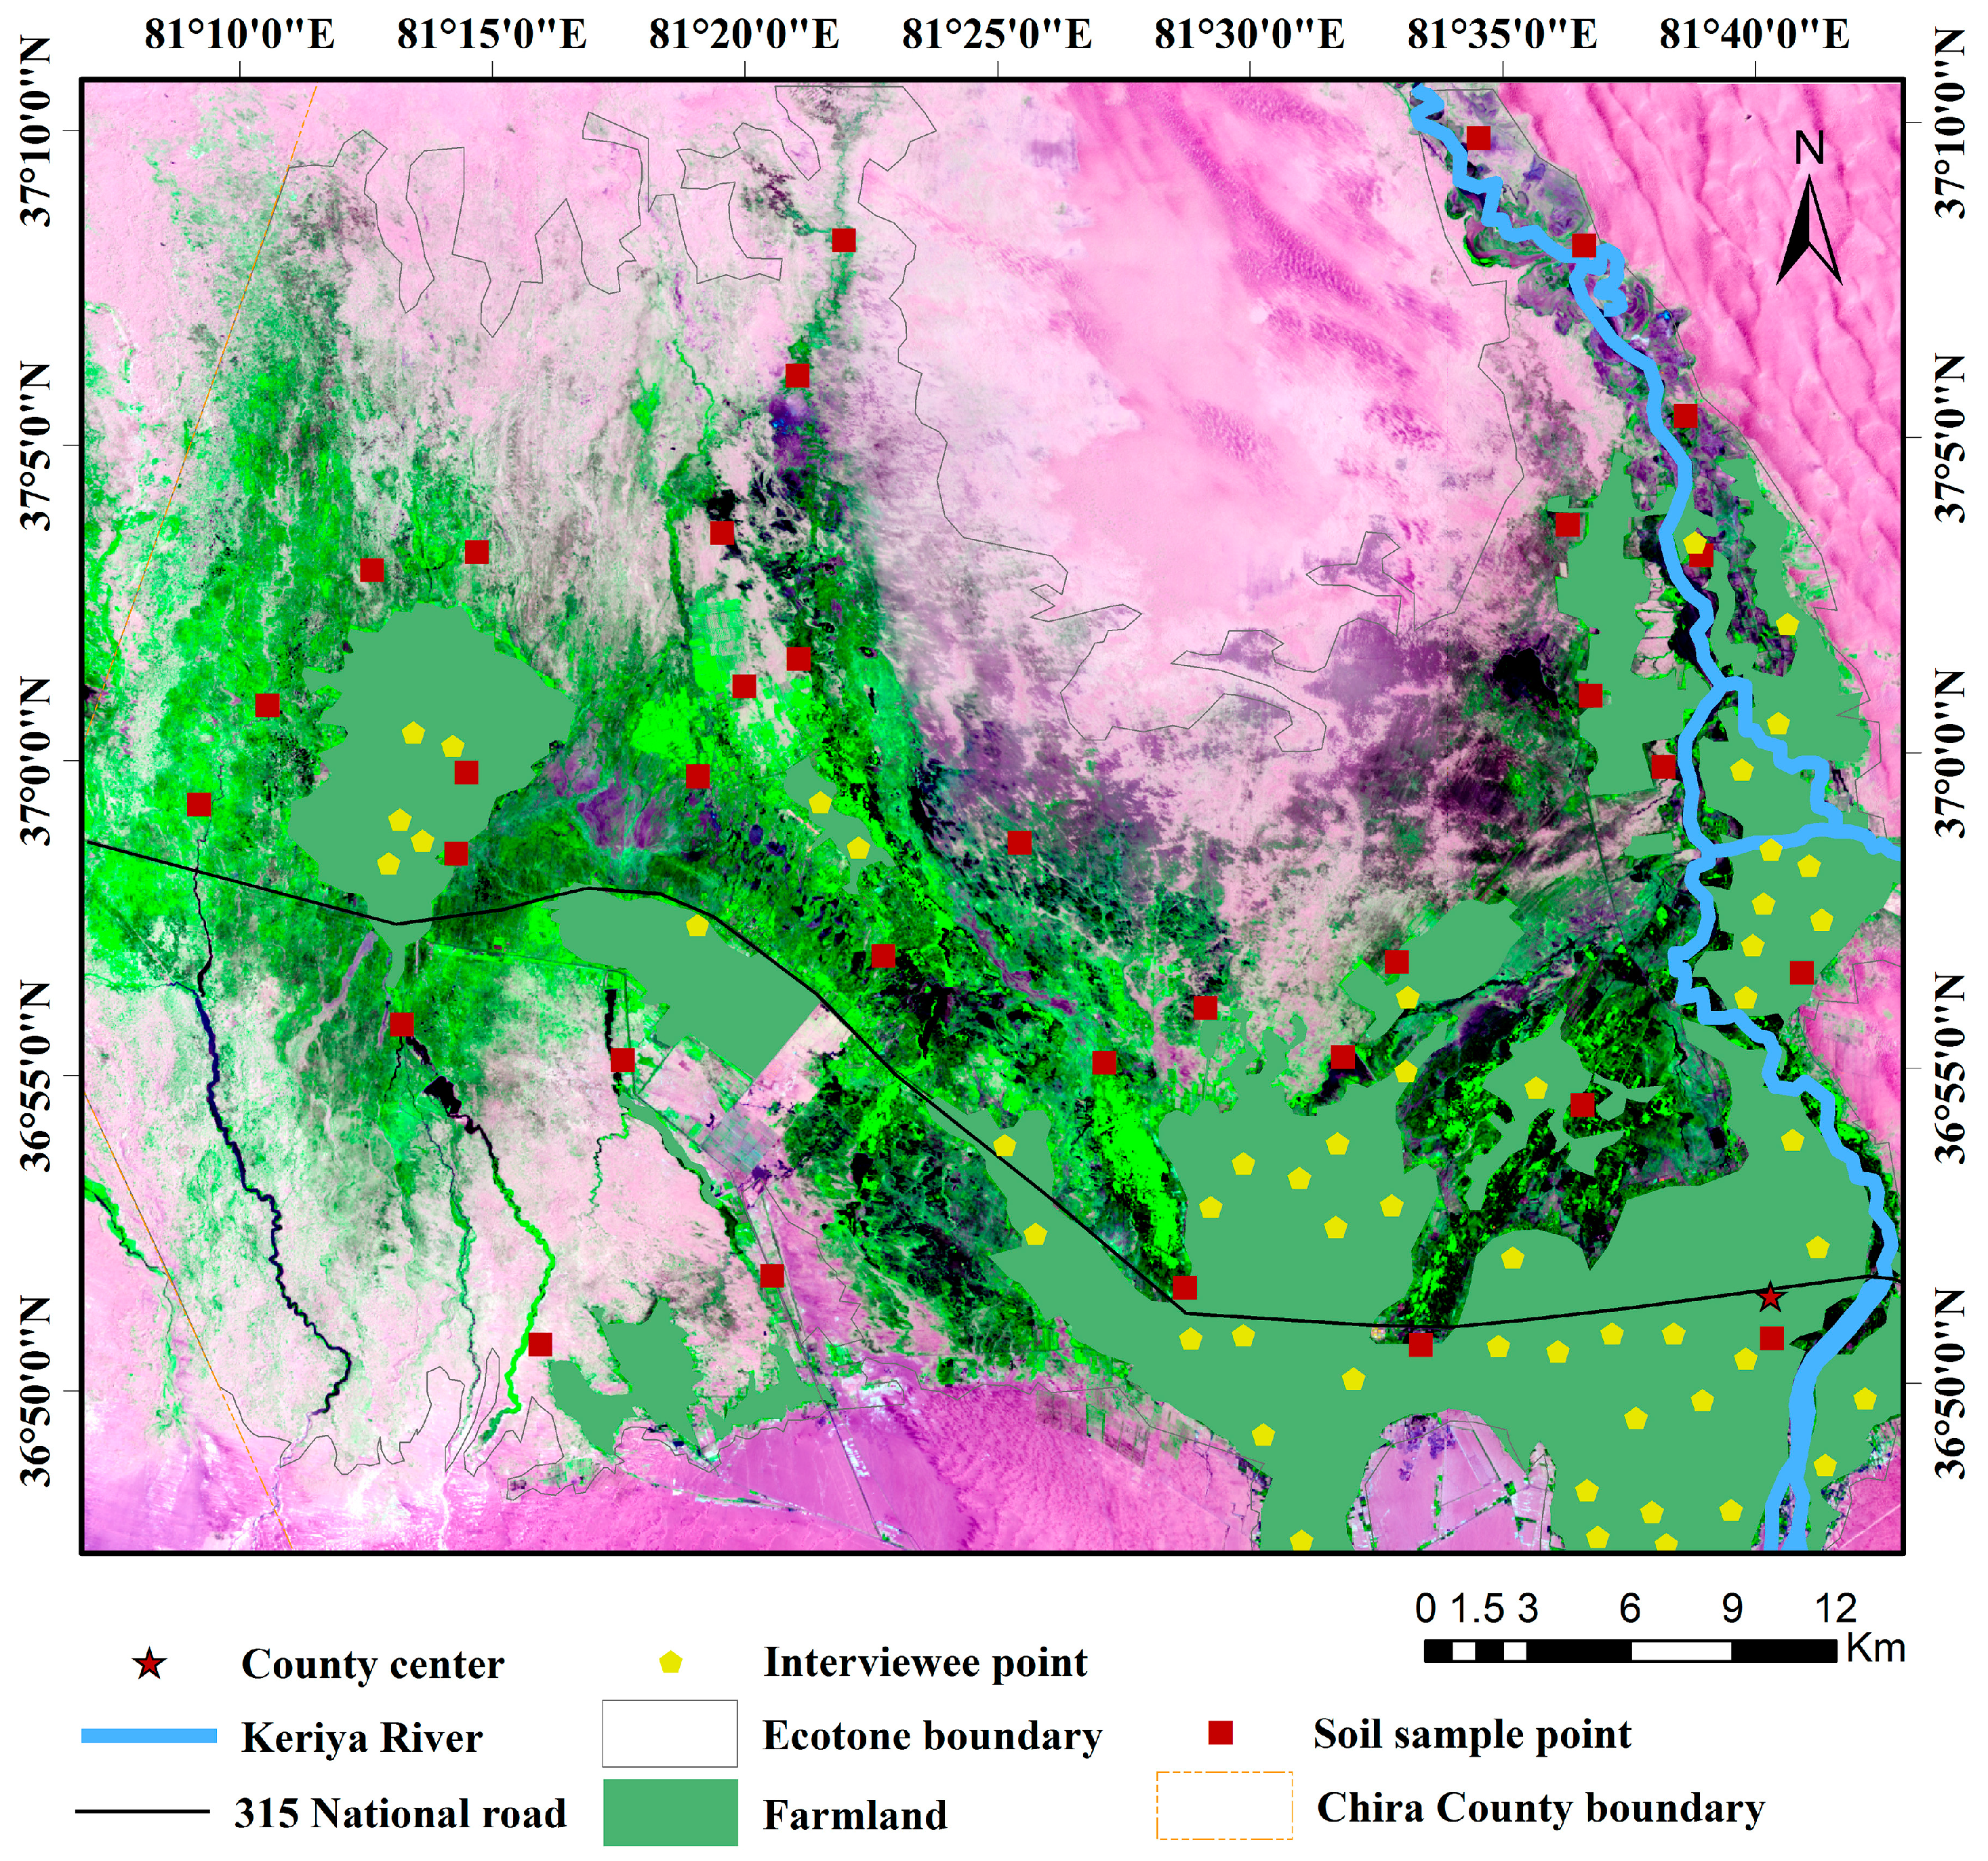
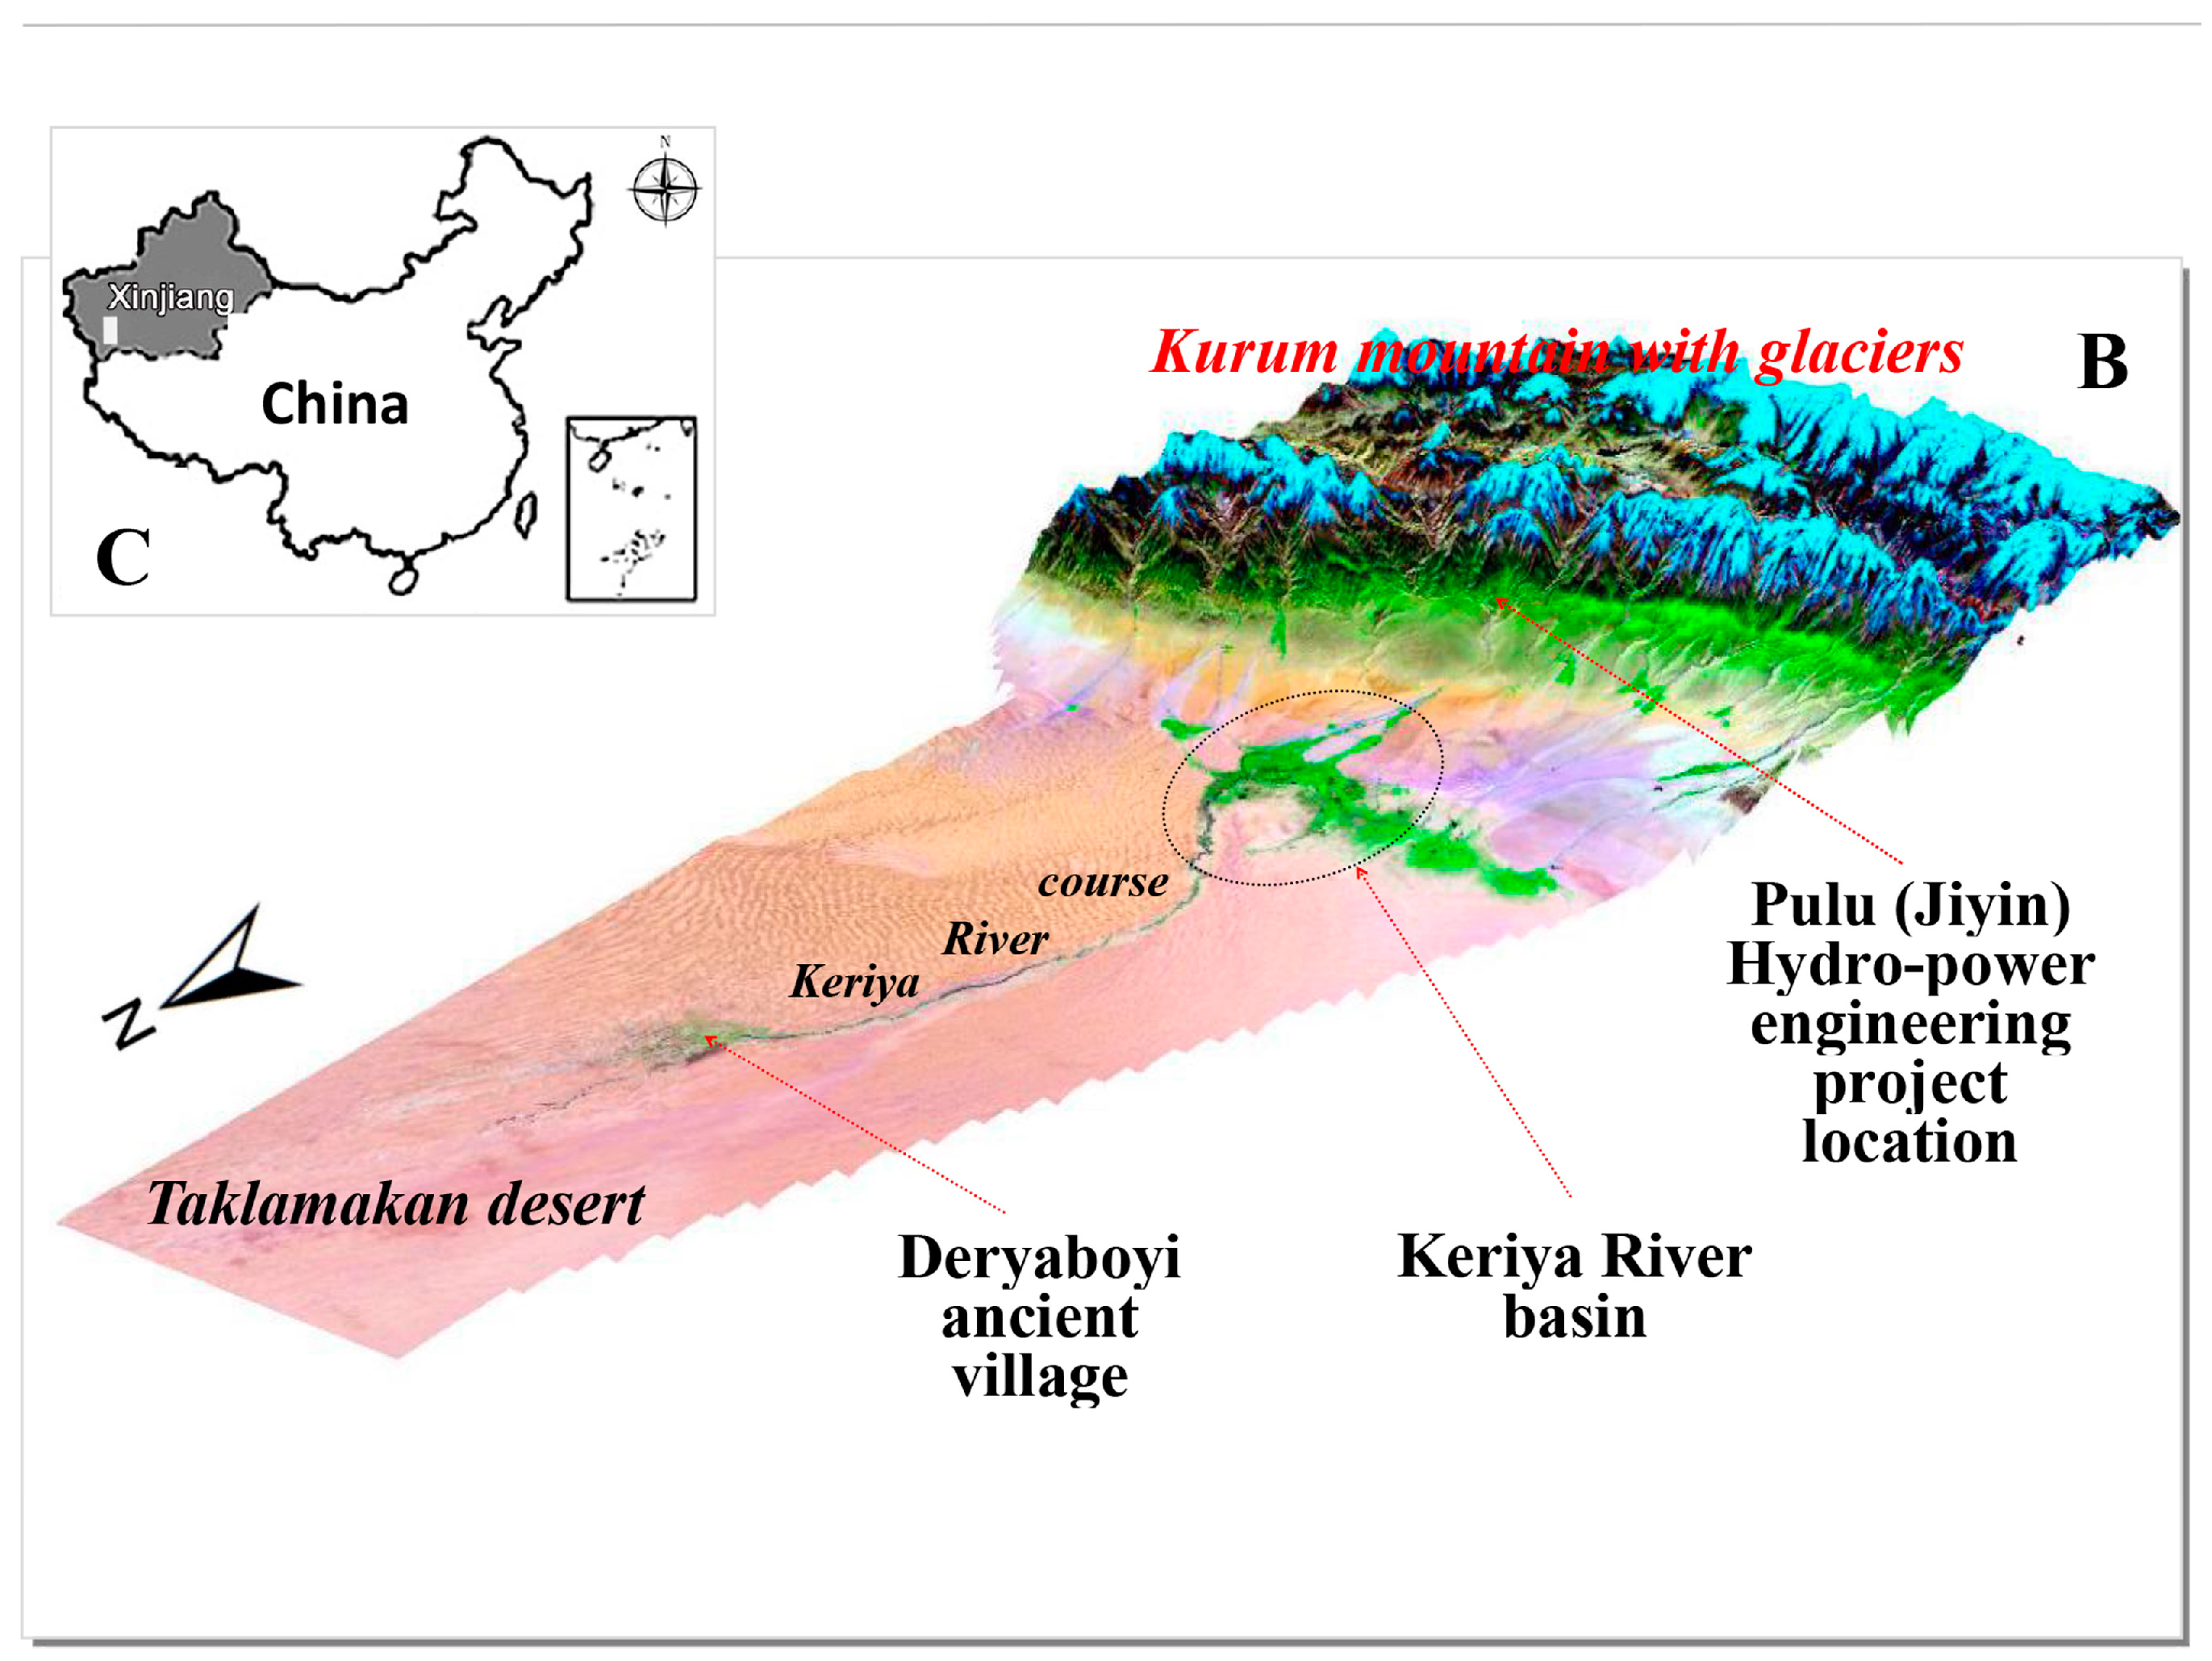
2.1. Study Area
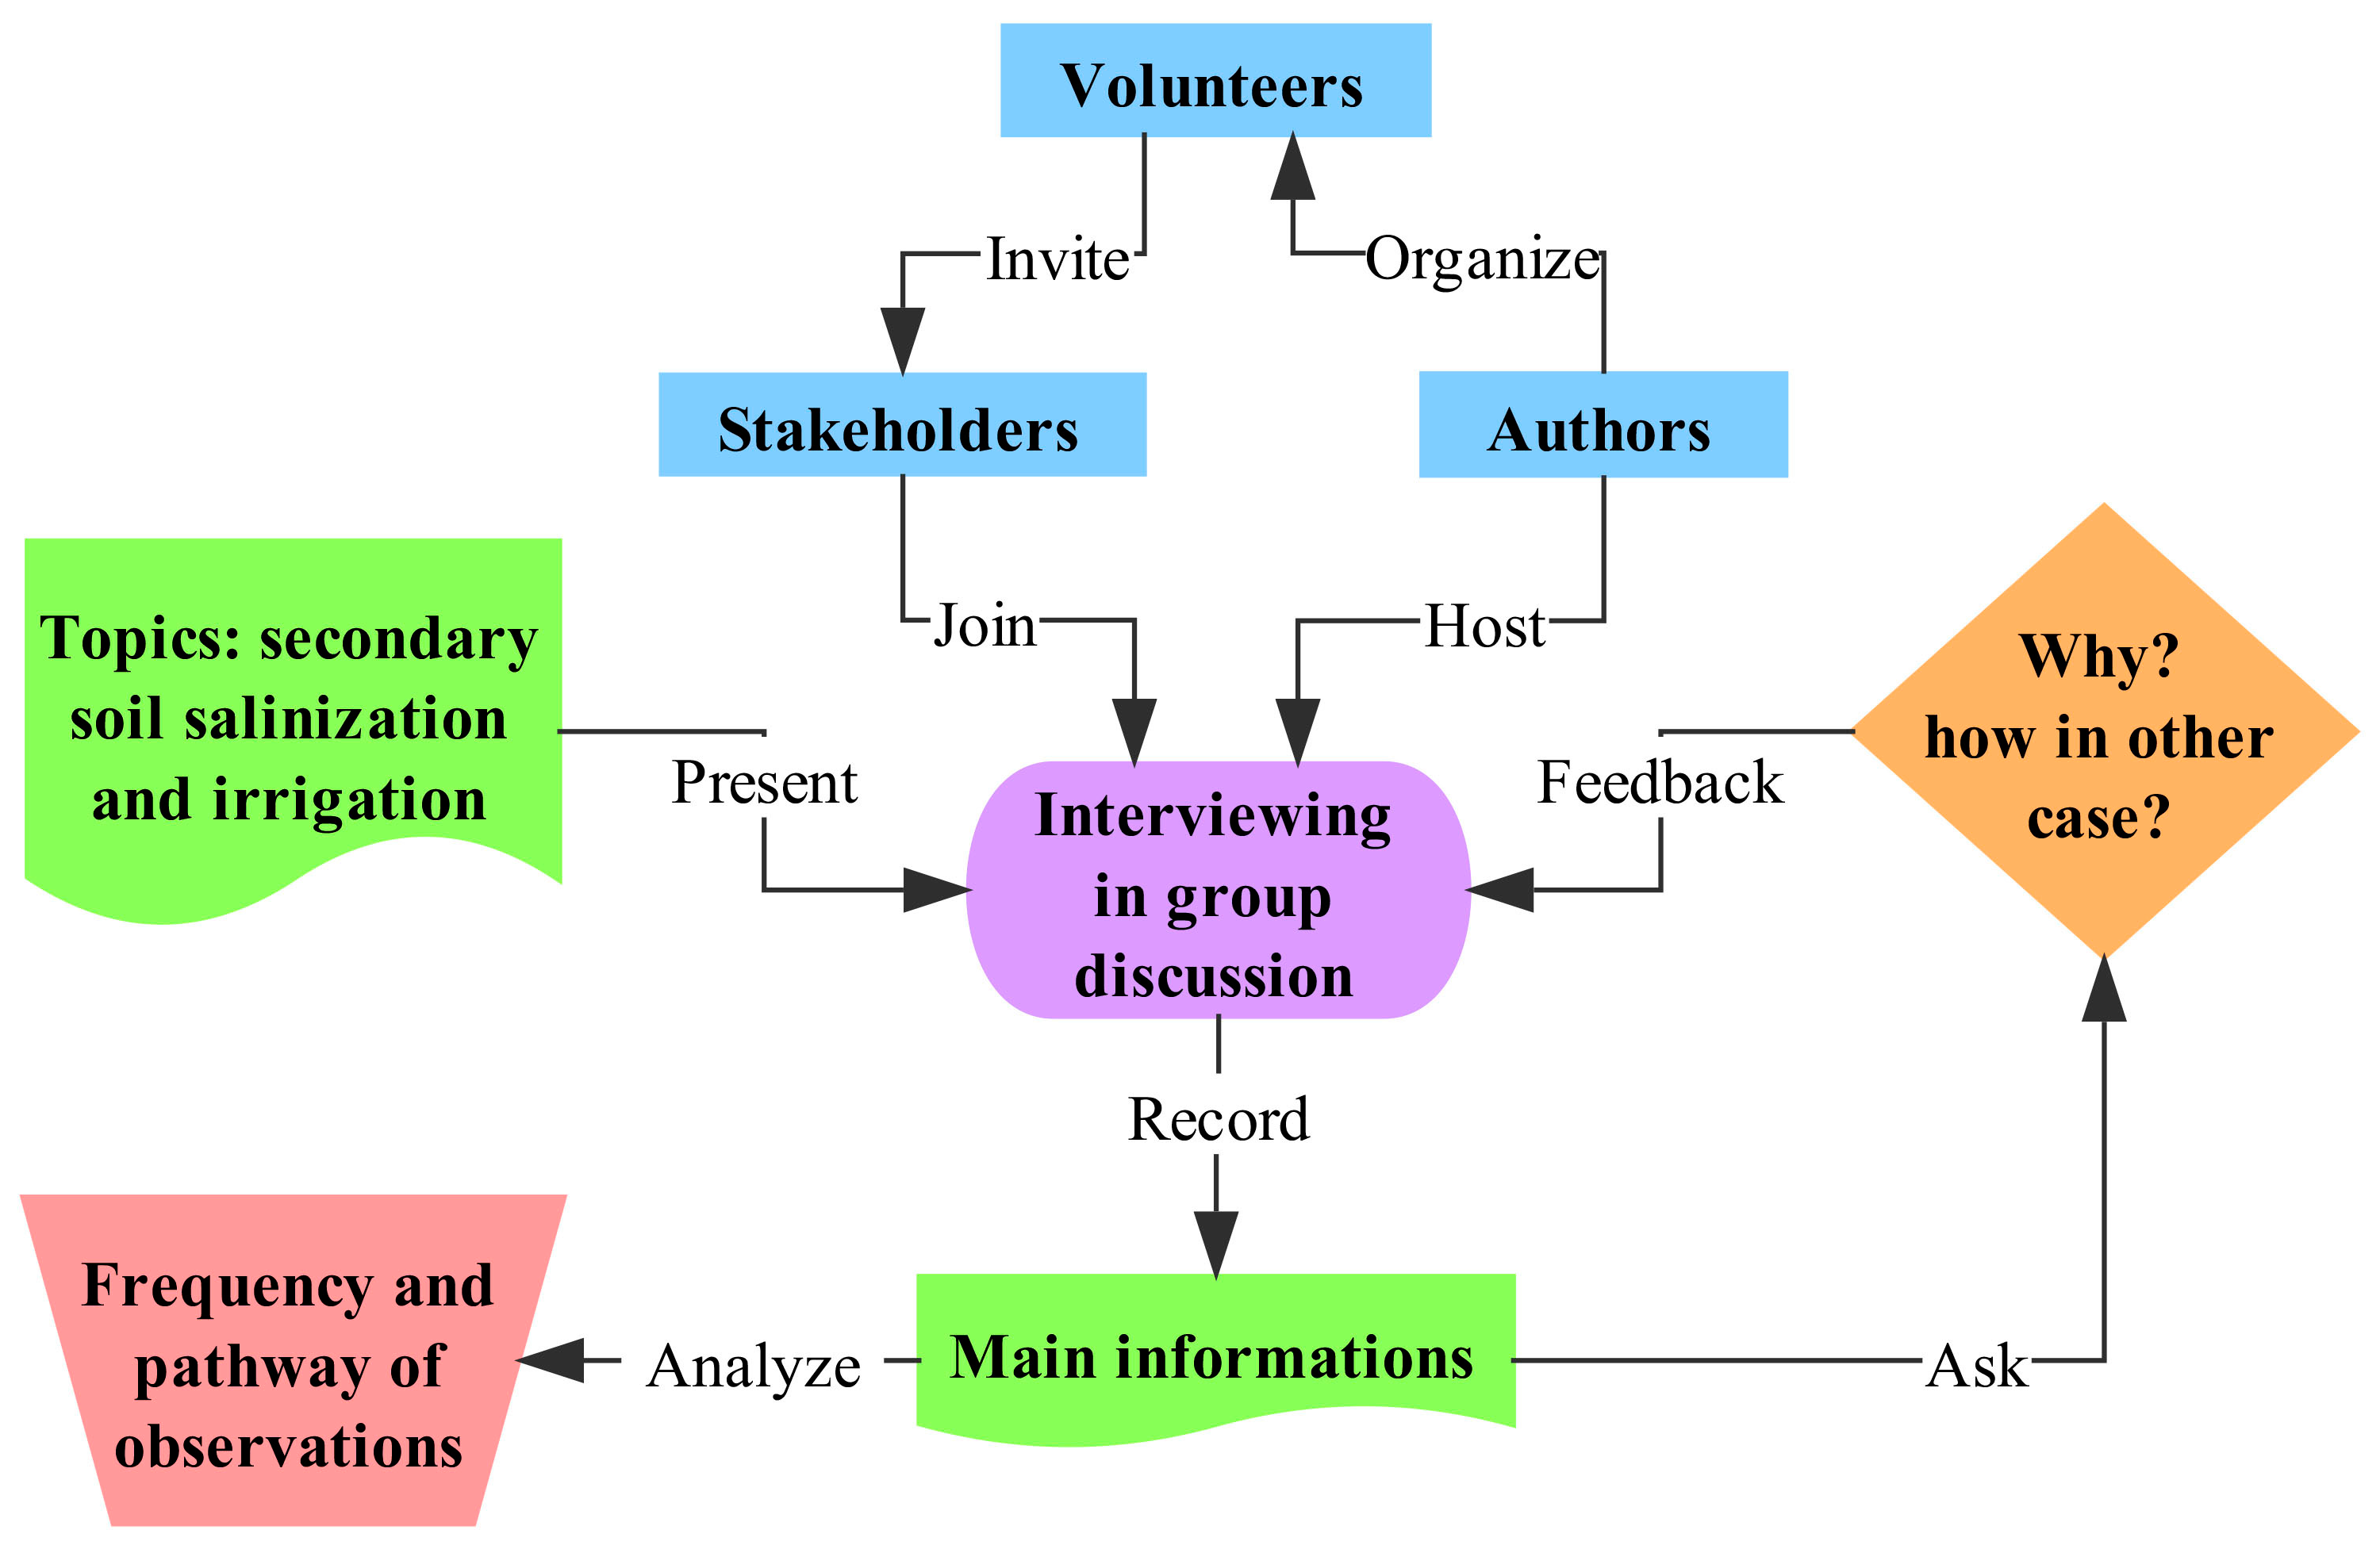
2.2. Data Sources
- The main questions presented to discussion groups were:
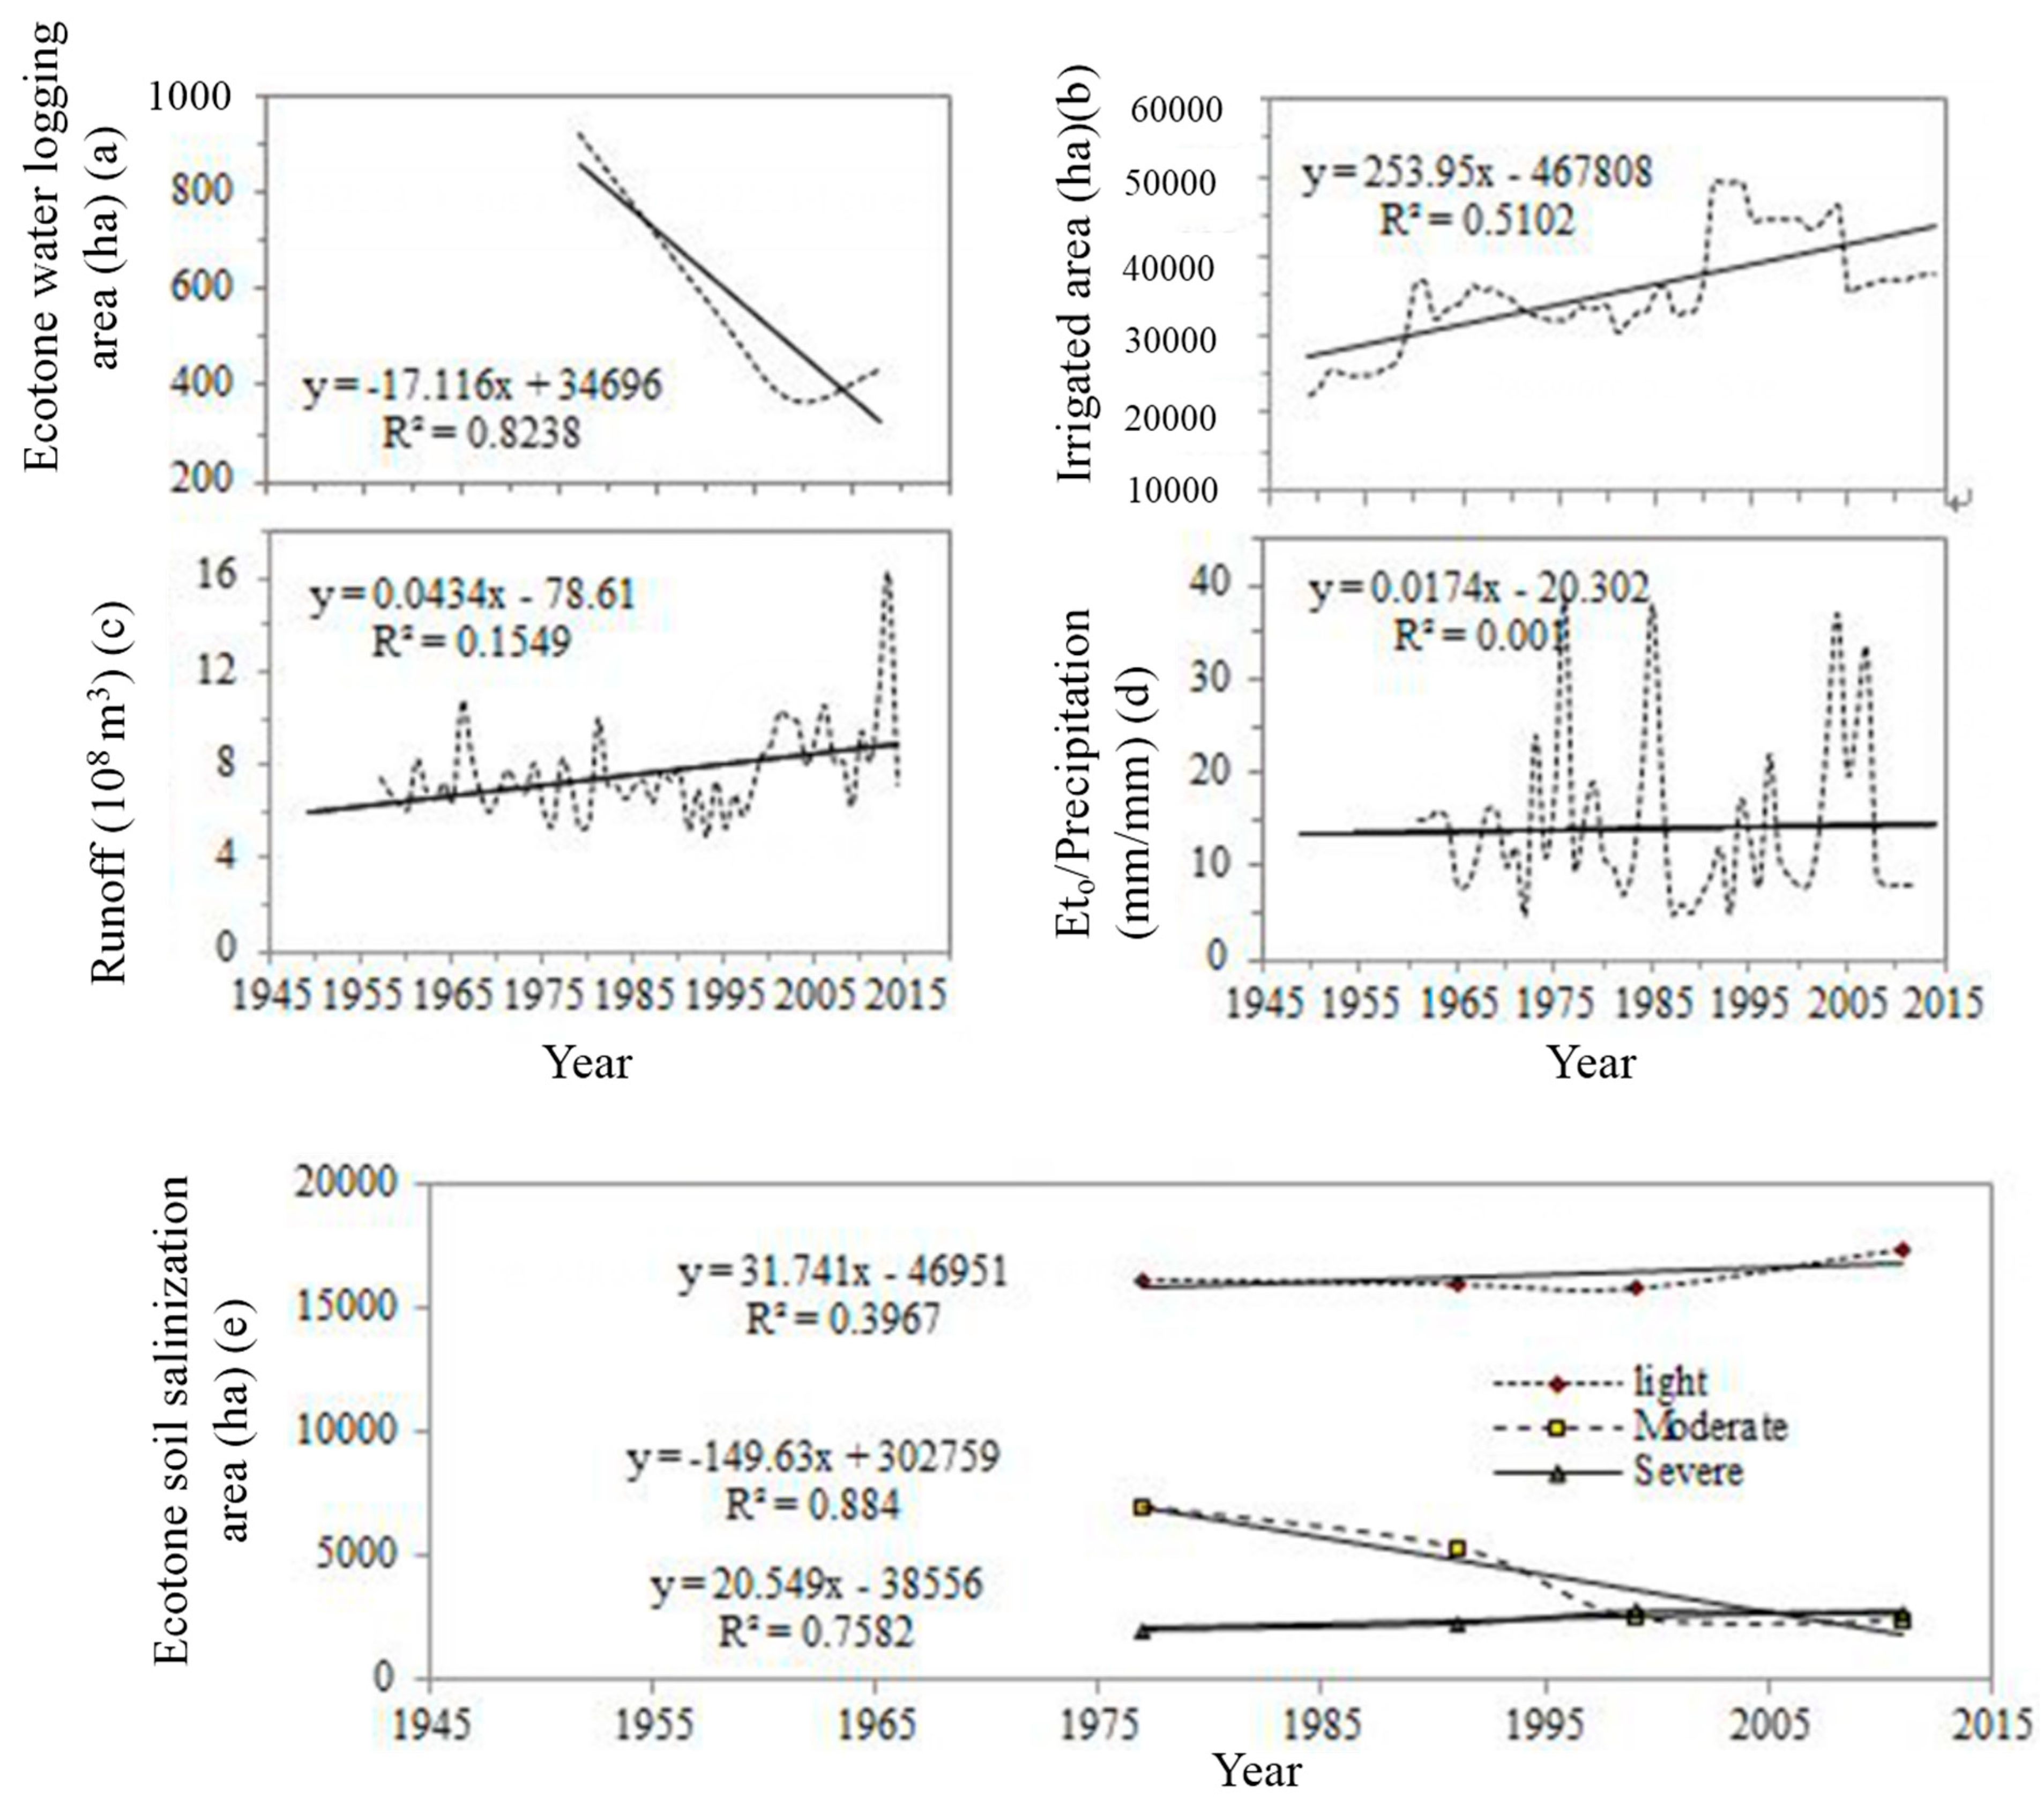
- How is the change in irrigation water quantity during 1950–2010s?
- How is the Oasis’s soil salinization trend during 1950–2010s?
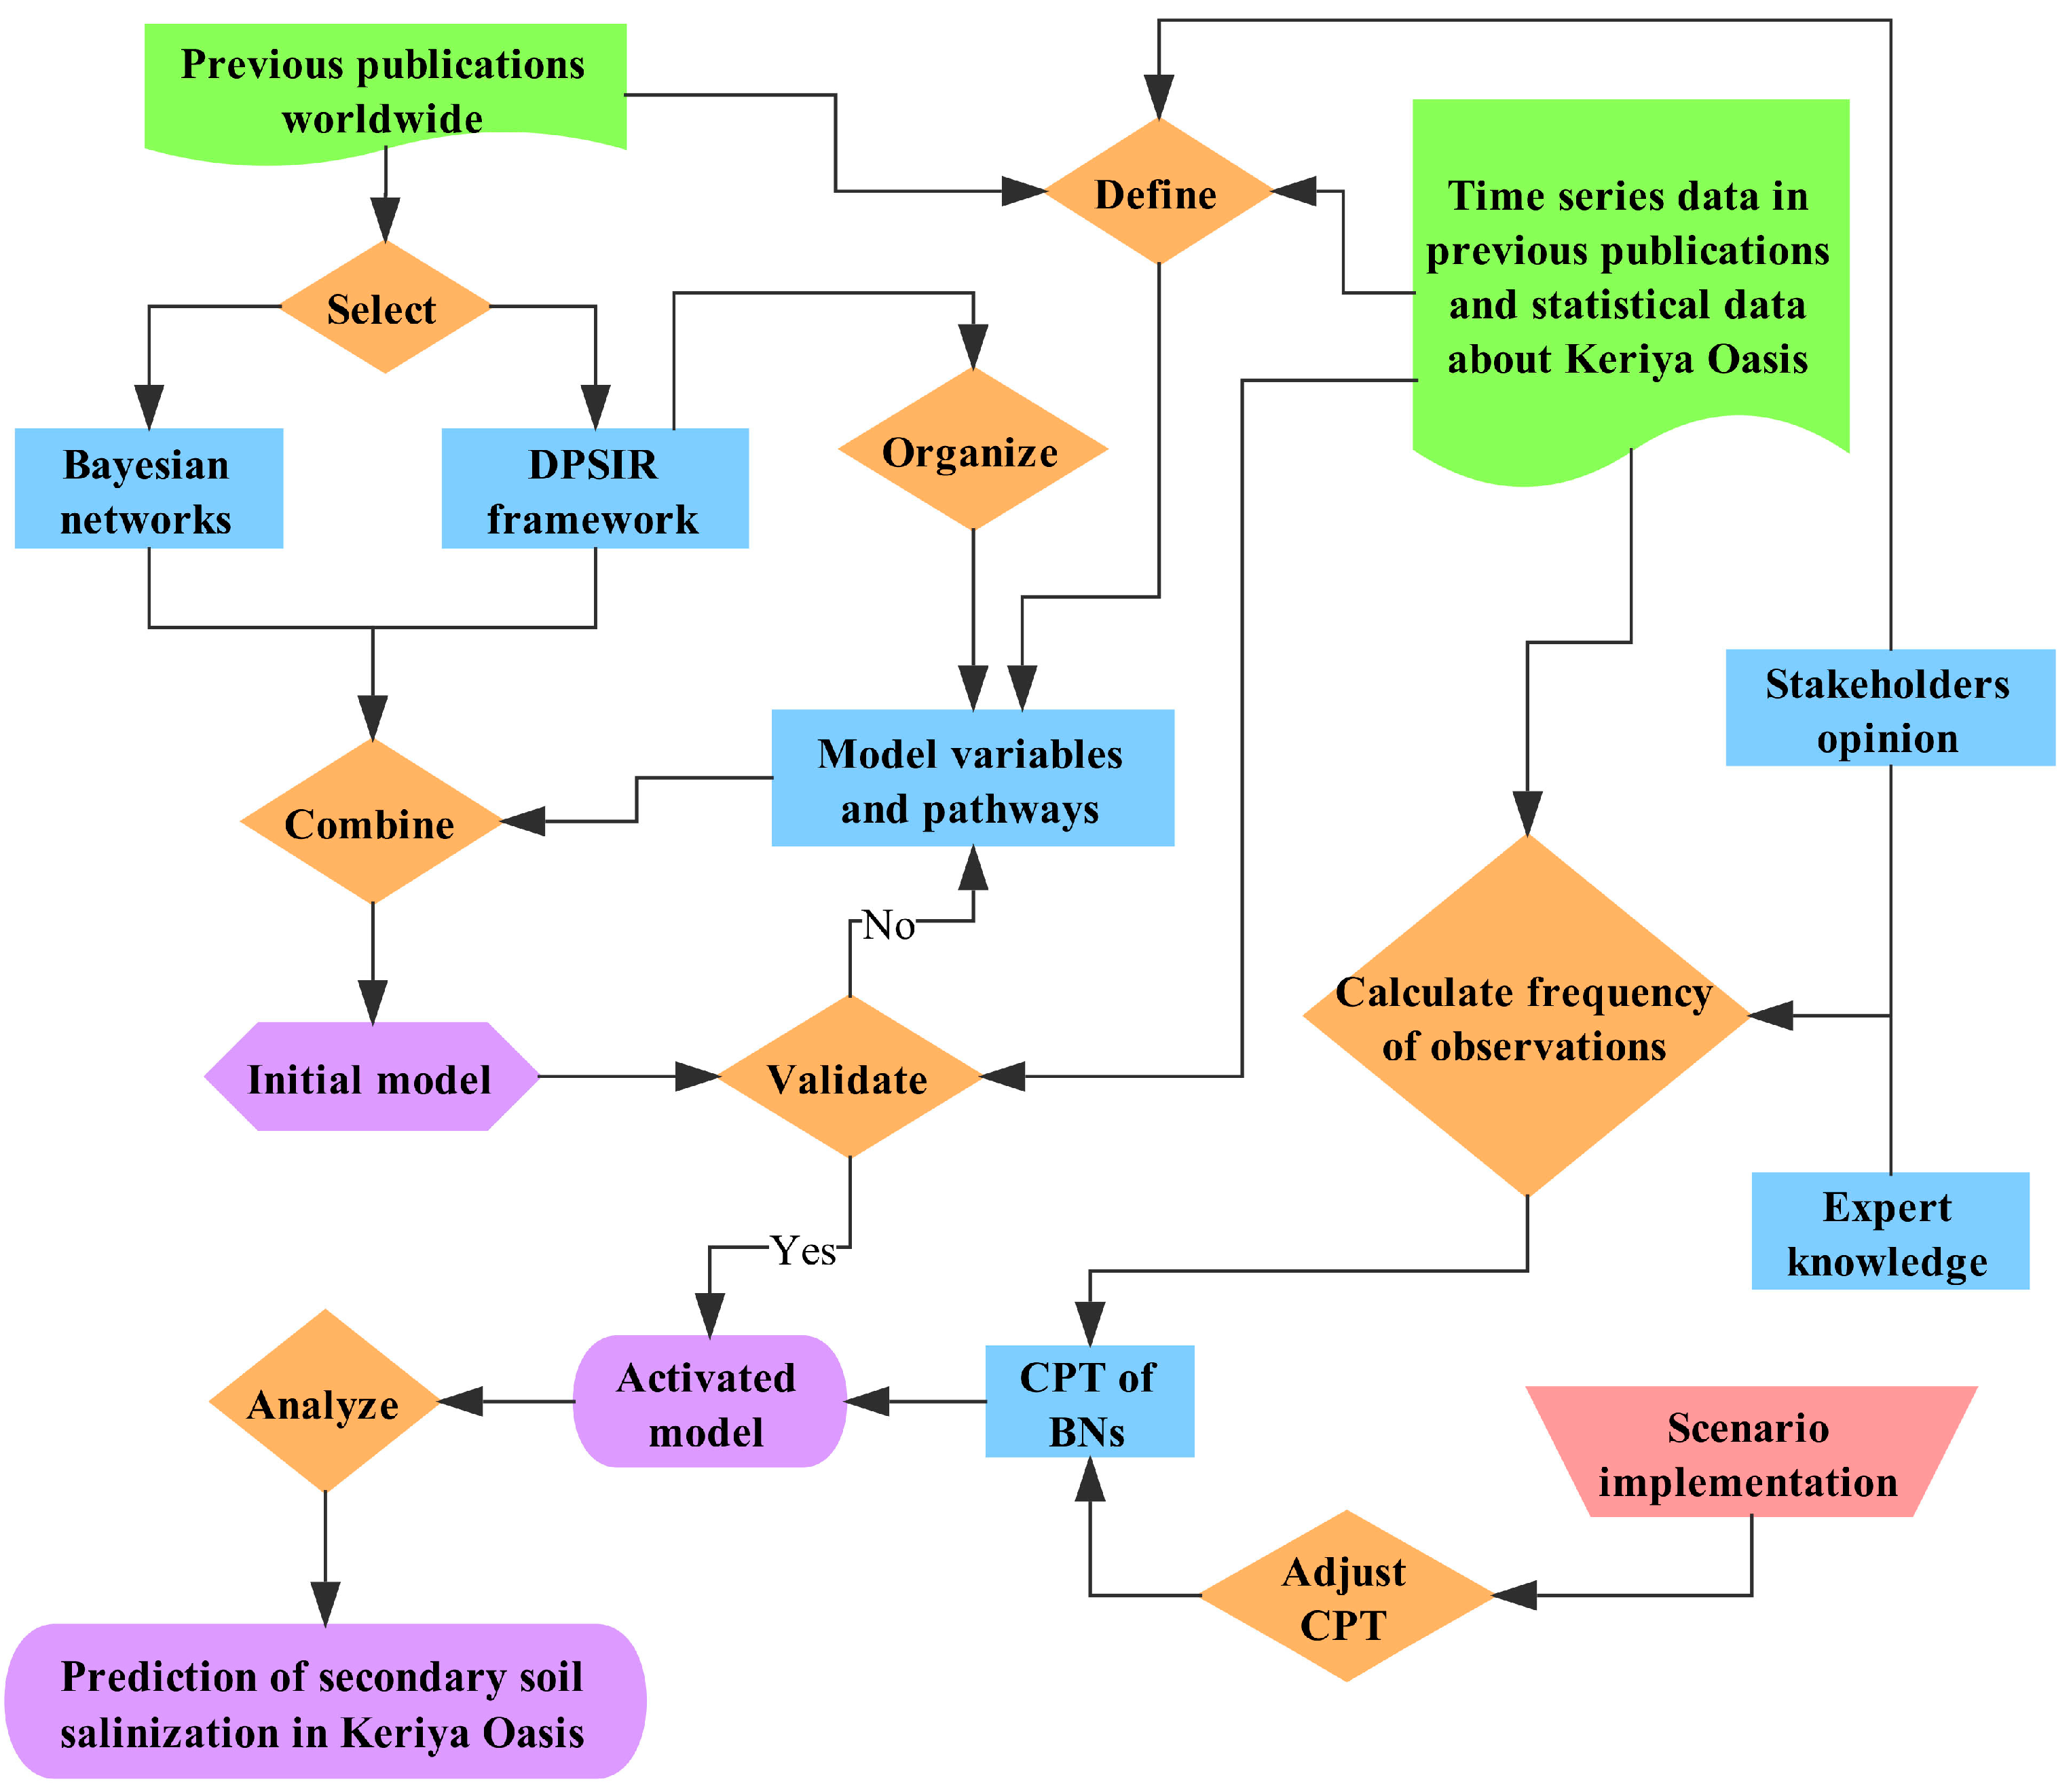
2.3. Modeling Approach
2.3.1. Modeling Tool
2.3.2. Model Development
2.3.3. Variable Indicators and Proxies
2.3.4. Probability Distribution Thresholds
- (1)
- The median value was considered the most appropriate threshold for natural variable, since, natural phenomena existed in the past, the initial value is uncertain for a short time intervals, therefore the median value was used. The median value refers to the value in the median position of data series. For example, 3 is the median value for the date series of 1, 2, 3, 4, 5. This allows the greatest possible overlap between linked datasets. The global warming, evapotranspiration/precipitation, surface water quantity, ecotone water logging, ecotone light salinization, ecotone moderate salinization, and ecotone severe salinization datasets were assigned threshold values in this way [34].
- (2)
- When a threshold was known, it was used [34,35]. Anthropogenic events such as population growth, economic growth, policy force, surface water extraction, farmland reclamation, and groundwater exploitation have known initial values, so a previous value in the data series was used as the threshold for the following data value.
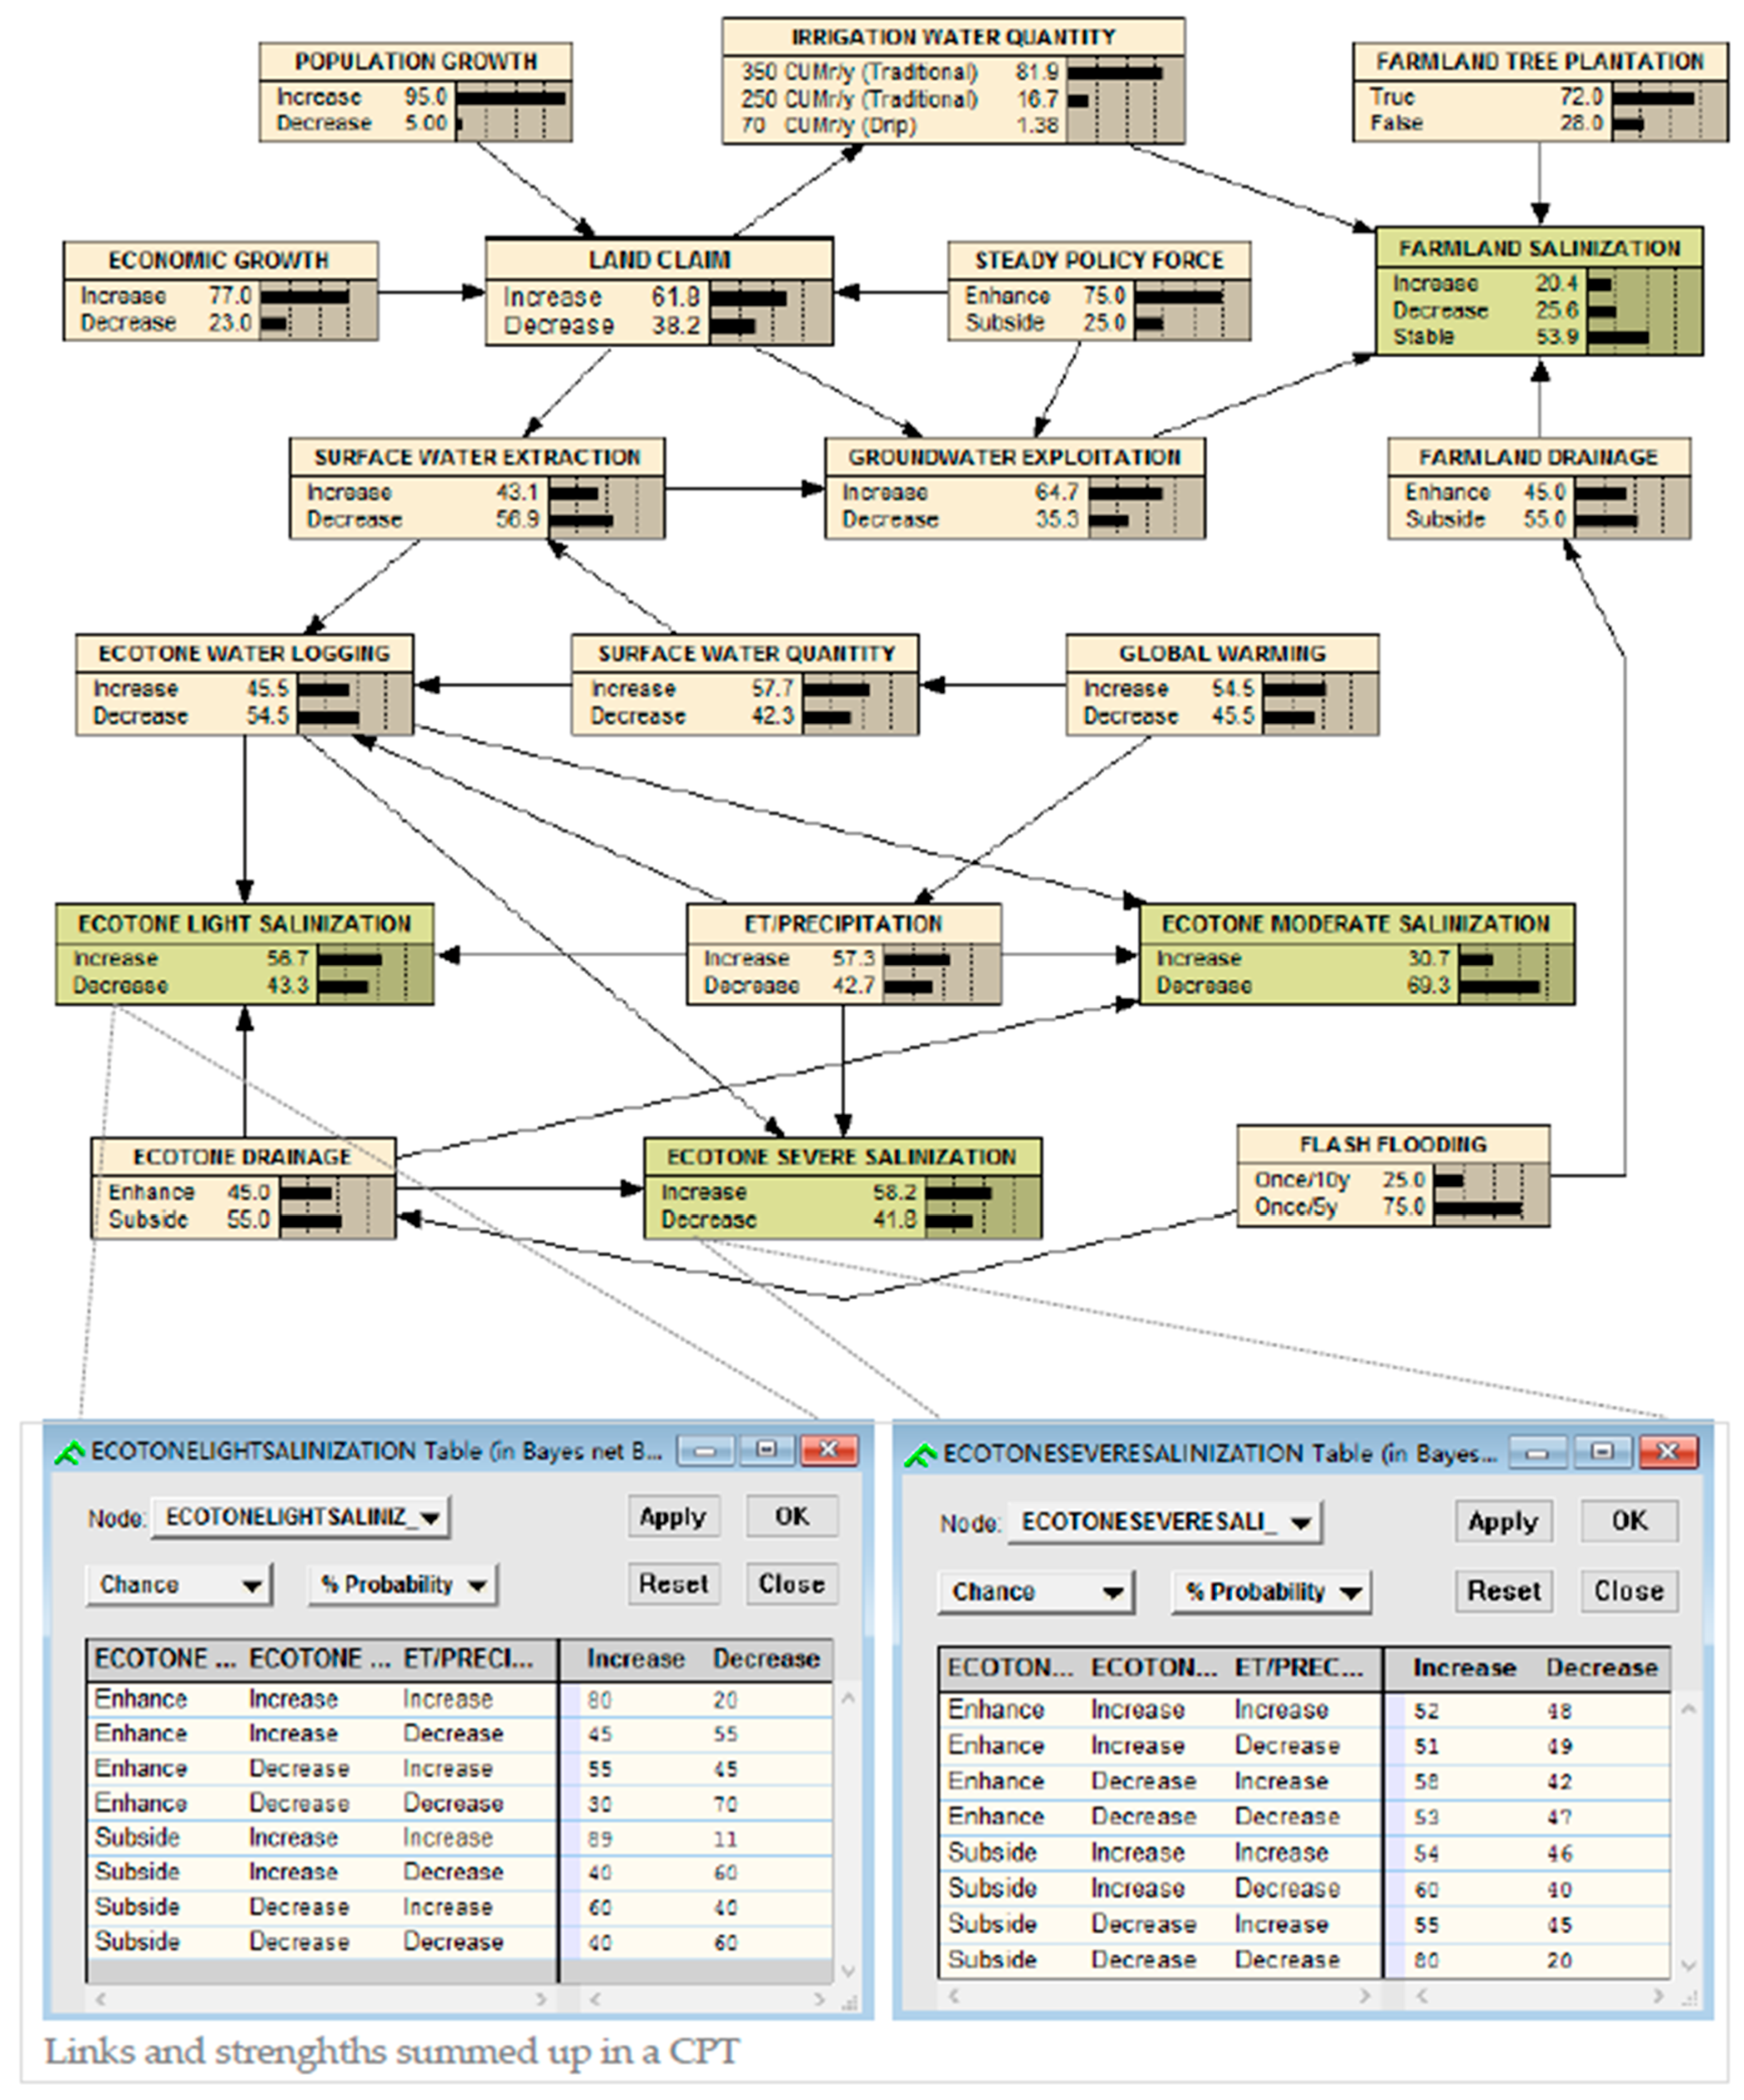
2.3.5. Conditional Probability Table
2.4. Model Validation
2.5. Model Prediction
3. Results
3.1. Model Validation
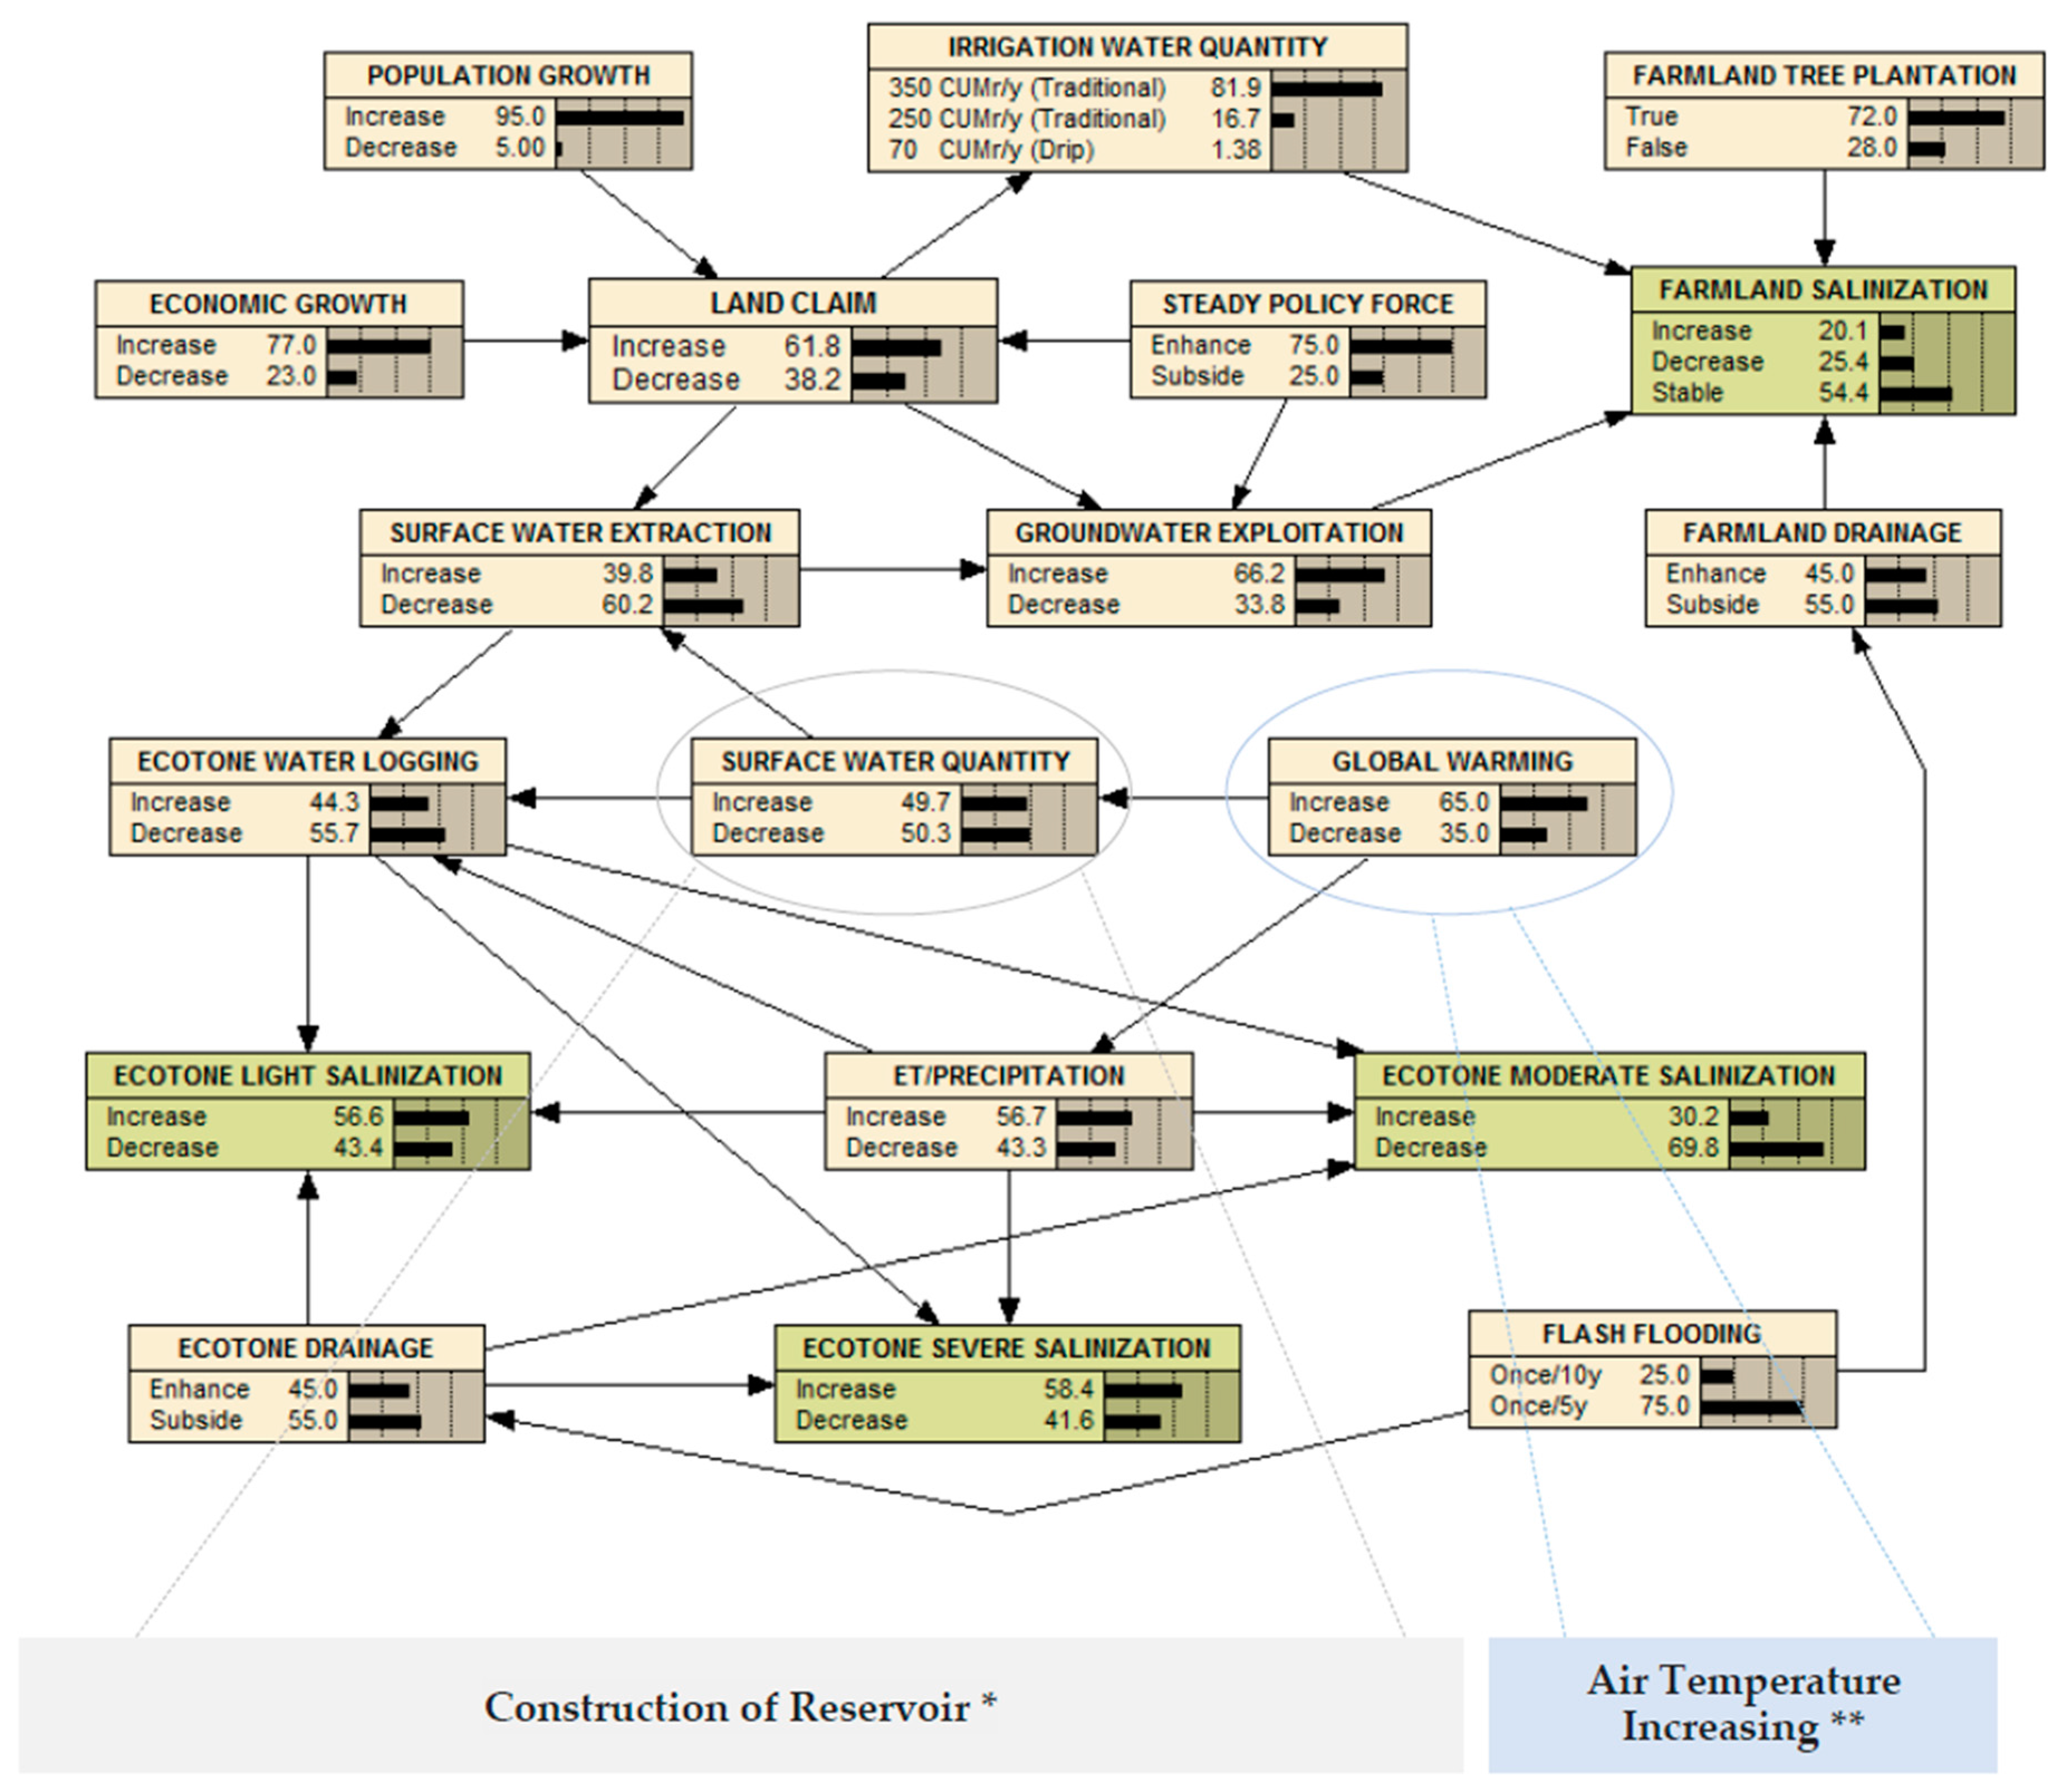
3.2. Model Prediction
3.2.1. Prediction of Farmland Salinization
3.2.2. Prediction of Ecotone Light Salinization
3.2.3. Prediction of Ecotone Moderate Salinization
3.2.4. Prediction of Ecotone Severe Salinization
4. Discussion
4.1. Combined Modeling of the DPSIR and BNs
4.2. Model Evaluation
4.3. Management Recommendation
5. Conclusions
Acknowledgments
Author Contributions
Conflicts of Interest
Appendix A

References
- Peck, A.J.; Hatton, T. Salinity and the discharge of salts from catchments in Australia. J. Hydrol. 2003, 272, 191–202. [Google Scholar] [CrossRef]
- Daliakopoulos, I.N.; Tsanis, I.K.; Koutroulis, A.; Kourgialas, N.N.; Varouchakis, A.E.; Karatzas, G.P.; Ritsema, C.J. The threat of soil salinity: A European scale review. Sci. Total Environ. 2016, 573, 727–739. [Google Scholar] [CrossRef] [PubMed]
- Wiebe, B.H.; Eilers, R.G.; Eilers, W.D.; Brierley, J.A. Application of a risk indicator for assessing trends in dryland salinization risk on the Canadian Prairies. Can. J. Soil Sci. 2007, 87, 213–224. [Google Scholar] [CrossRef]
- Houk, E.; Frasier, M.; Schuck, E. The agricultural impacts of irrigation induced water logging and soil salinity in the Arkansas Basin. Agric. Water Manag. 2006, 85, 175–183. [Google Scholar] [CrossRef]
- Corwin, D.L.; Rhoades, J.D.; Šimůnek, J. Leaching requirement for soil salinity control: Steady–state versus transient models. Agric. Water Manag. 2007, 90, 165–180. [Google Scholar] [CrossRef]
- Dregne, H.E. Land Degradation in the Dry lands. Arid Land Res. Manag. 2002, 16, 99–132. [Google Scholar] [CrossRef]
- Metternicht, G.I.; Zinck, J.A. Remote sensing of soil salinity: Potentials and constraints. Remote Sens. Environ. 2003, 85, 1–20. [Google Scholar] [CrossRef]
- Wang, Y.; Li, Y. Land exploitation resulting in soil salinization in a desert-oasis ecotone. Catena 2013, 100, 50–56. [Google Scholar] [CrossRef]
- Eziz, M.; Yimit, H.; Nijad, D.; Wei, B. The Response of Ecosystem Services Value to Land Use Change in Keriya Oasis, Northern Slope of Kunlun Mountain. Sci. Geogr. Sin. 2012, 32, 1148–1154. (In Chinese) [Google Scholar] [CrossRef]
- Jiang, H.T.; Tashpolat, T.; Mamat, S.; Zhang, F. Study on Spatial and Temporal Dynamics Change of Soil Salinization in Keriya Oasis. Chin. J. Soil Sci. 2014, 45, 123–129. (In Chinese) [Google Scholar] [CrossRef]
- Kosmas, C.; Kairis, O.; Karavitis, C.; Ritsema, C.; Salvati, L.; Acikalin, S.; Alcalá, M.; Alfama, P.; Atlhopheng, J.; Barrera, J.; et al. Evaluation and Selection of Indicators for Land Degradation and Desertification Monitoring: Methodological Approach. Environ. Manag. 2013, 54, 951–970. [Google Scholar] [CrossRef] [PubMed] [Green Version]
- Zhou, D.; Lin, Z.; Liu, L.; Zimmermann, D. Assessing secondary soil salinization risk based on the PSR sustainability framework. J. Environ. Manag. 2013, 128, 642–654. [Google Scholar] [CrossRef] [PubMed]
- Berkes, F.; Colding, J.; Folke, C. Rediscovery of Traditional Ecological Knowledge as Adaptive Management Published by : Ecological Society of America Rediscovery of Traditional Ecological Knowledge. Ecol. Appl. 2010, 10, 1251–1262. [Google Scholar] [CrossRef]
- Sadoddin, A.; Letcher, R.A.; Jakeman, A.J.; Newham, L.T.H. A Bayesian decision network approach for assessing the ecological impacts of salinity management. Math. Comput. Simul. 2005, 69, 162–176. [Google Scholar] [CrossRef]
- Halik, W.; Tiyip, T.; Yimit, H.; He, L.Zh. Water Resources Utilization and Eco–environmental Changing Reseach in Keriya Valley. Syst. Sci. Compr. Stud. Agric. 2006, 22, 283–287. (In Chinese) [Google Scholar] [CrossRef]
- Muhtar, P.; Yimit, H. Ecosystem Services Sensitivity to Land–use Change:A Case Study of the Keriya Oasis. J. Nat. Resour. 2014, 29, 1849–1858. (In Chinese) [Google Scholar] [CrossRef]
- Nurmemet, I.; Ghulam, A.; Tiyip, T.; Elkadiri, R.; Ding, J.L.; Maimaitiyiming, M.; Abliz, A.; Sawut, M.; Zhang, F.; Abliz, A.; Sun, Q. Monitoring soil salinization in Keriya River Basin, Northwestern China using passive reflective and active microwave remote sensing data. Remote Sens. 2015, 7, 8803–8829. [Google Scholar] [CrossRef]
- Abliz, A.; Tiyip, T.; Ghulam, A.; Halik, Ü.; Ding, J.L.; Sawut, M.; Zhang, F.; Nurmemet, I.; Abliz, A. Effects of shallow groundwater table and salinity on soil salt dynamics in the Keriya Oasis, Northwestern China. Environ. Earth. Sci. 2016, 75, 1–15. [Google Scholar] [CrossRef]
- Wang, G.Y.; Teyibai, T.; Tan, L.Z. Social Driven Forces to Land Use Variation in Yutian Oasis–desert Ecotone in Xinjiang. J. Desert Res. 2006, 26, 259–263. (In Chinese) [Google Scholar] [CrossRef]
- Chen, R.; Deng, X.Z.; Zhan, J.Y.; Wang, Y.L.; Li, D.; Niu, W.Y. Estimation model and application of the amount of eco–water demand: a case study on Keriya river basin. Geogr. Res. 2005, 24, 725–731. (In Chinese) [Google Scholar] [CrossRef]
- Gong, L.; Ran, Q.; He, G.; Tiyip, T. A soil quality assessment under different land use types in Keriya river basin, Southern Xinjiang, China. Soil Tillage Res. 2015, 146, 223–229. [Google Scholar] [CrossRef]
- Yang, X. The oases along the Keriya River in the Taklamakan Desert, China, and their evolution since the end of the last glaciation. Environ. Geol. 2001, 41, 314–320. [Google Scholar] [CrossRef]
- Ghulam, A.; Qin, Q.; Zhu, L.; Abdrahman, P. Satellite remote sensing of groundwater: Quantitative modelling and uncertainty reduction using 6S atmospheric simulations. Int. J. Remote Sens. 2004, 25, 5509–5524. [Google Scholar] [CrossRef]
- Gong, L.; Li, C.J.; Tiyip, T. Relations between soil heterogeneity and common reed (Phragmites australis Trin. ex Steud.) colonization in Keriya River Basin, Xinjiang of China. J. Arid Land 2014, 6, 753–761. [Google Scholar] [CrossRef]
- Jiang, Y.; Zhou, C.H.; Cheng, W.M. Streamflow trends and hydrological response to climatic change in Tarim headwater basin. J. Geogr. Sci. 2007, 17, 51–61. (In Chinese) [Google Scholar] [CrossRef]
- Lu, F.; Xu, J.H.; Chen, Y.N.; Li, W.H.; Zhang, L.J. Annual runoff change and it’s response to climate change in the headwater area of the Yarkand River in the recent 50 years. Quat. Sci. 2010, 30, 152–158. (In Chinese) [Google Scholar] [CrossRef]
- Huntington, H.P. Using Traditional Ecological Knowledge in Science: Methods and Applications. Ecol. Appl. 2000, 10, 1270–1274. [Google Scholar] [CrossRef]
- Huang, R.; Xu, L.; Liu, J. Research on spatio-temporal change of temperature in the Northwest Arid Area. Acta Ecol. Sin. 2013, 33, 4078–4089. (In Chinese) [Google Scholar] [CrossRef]
- Wei, Y.L.; Wang, H.; Li, N. Keriya County Annals, 1st ed.; Xinjiang People’s Press: Urumqi, China, 2006. (In Chinese) [Google Scholar]
- Li, J.J.; Ruzi, R.; Wang, W.H. Report of Main Development Index of Keriya (2000–2014), 1st ed.; Statistical Bureau of Keriya: Hotan, China, 2015; pp. 200–280, unpublished. (In Chinese)
- Xie, Y.; Gong, J.; Sun, P.; Gou, X. Oasis dynamics change and its influence on landscape pattern on Jinta oasis in arid China from 1963a to 2010a: Integration of multi–source satellite images. Int. J. Appl. Earth Obs. Geoinf. 2014, 33, 181–191. [Google Scholar] [CrossRef]
- Zhang, B.X.; Xiong, H.G.; Chang–Chun, X.U. Study on Ecological Resilience and Environment in Yutian Oasis, Xinjiang. Res. Soil Water Conserv. 2008, 15, 112–114. Available online: https://www.researchgate.net/publication/291191977_Study_on_ecological_resilience_and_environment_in_Yutian_Oasis_Xinjiang (accessed on 9 November 2017). (In Chinese).
- Taylor, P.; Carr, E.R.; Wingard, P.M.; Yorty, S.C.; Thompson, M.C.; Jensen, N.K.; Roberson, J. Applying DPSIR to sustainable development Applying DPSIR to sustainable. Int. J. Sustain. Dev. World Ecol. 2009, 14, 37–41. [Google Scholar] [CrossRef]
- Langmead, O.; McQuatters-Gollop, A.; Mee, L.D.; Friedrich, J.; Gilbert, A.J.; Gomoiu, M.T.; Jackson, E.L.; Knudsen, S.; Minicheva, G.; Todorova, V. Recovery or decline of the northwestern Black Sea: A societal choice revealed by socio-ecological modelling. Ecol. Model. 2009, 220, 2927–2939. [Google Scholar] [CrossRef]
- Rapport, D.J.; Friend, A.M. Towards a Comprehensive Framework for Environmental Statistics: A Stress–Response Approach, 1st ed.; Statistics Canada: Ottawa, ON, Canada, 1979; p. 87. Available online: http://trove.nla.gov.au/work/11961045?q&versionId=14099441 (accessed on 3 November 2017).
- Niemeijer, D.; de Groot, R.S. A conceptual framework for selecting environmental indicator sets. Ecol. Indic. 2008, 8, 14–25. [Google Scholar] [CrossRef]
- OECD (Organization of Economic Co-Operation and Development). OECD Core Set of Indicators for Environmental Performance Reviews. OECD Environment Monographs No. 83. Available online: https://DOI.org/10.1007/978-3-322-80897-4_80 (accessed on 2 December 2016).
- Omann, I.; Stocker, A.; Jäger, J. Climate change as a threat to biodiversity: An application of the DPSIR approach. Ecol. Econ. 2009, 69, 24–31. [Google Scholar] [CrossRef]
- Spangenberg, J.H.; Martinez-Alier, J.; Omann, I.; Monterroso, I.; Binimelis, R. The DPSIR scheme for analysing biodiversity loss and developing preservation strategies. Ecol. Econ. 2009, 69, 9–11. [Google Scholar] [CrossRef]
- Maxim, L.; Spangenberg, J.H.; O’Connor, M. An analysis of risks for biodiversity under the DPSIR framework. Ecol. Econ. 2009, 69, 12–23. [Google Scholar] [CrossRef]
- Huang, H.F.; Kuo, J.; Lo, S.L. Review of PSR framework and development of a DPSIR model to assess greenhouse effect in Taiwan. Environ. Monit. Assess. 2011, 177, 623–635. [Google Scholar] [CrossRef] [PubMed]
- Spangenberg, J.H.; Douguet, J.M.; Settele, J.; Settele, J.; Heong, K.L. Escaping the lock–in of continuous insecticide spraying in rice: Developing an integrated ecological and socio-political DPSIR analysis. Ecol. Model. 2015, 295, 188–195. [Google Scholar] [CrossRef]
- Camilleri, S.; Pérez-Hurtado de Mendoza, A.; Gabbianelli, G. Multiple DPSI frameworks for support of integrated research: a case study of the Bahía de Cádiz Nature Park (Spain). J. Coast. Conserv. 2015, 19, 677–691. [Google Scholar] [CrossRef]
- Phan, T.D.; Smart, J.C.R.; Capon, S.J.; Hadwen, W.L.; Sahin, O. Applications of Bayesian belief networks in water resource management: A systematic review. Environ. Model. Softw. 2016, 85, 98–111. [Google Scholar] [CrossRef]
- Li, P.C.; Chen, G.H.; Dai, L.C.; Zhang, L. A fuzzy Bayesian network approach to improve the quantification of organizational influences in HRA frameworks. Saf. Sci. 2012, 50, 1569–1583. [Google Scholar] [CrossRef]
- Keshtkar, A.R.; Salajegheh, A.; Sadoddin, A.; Allan, M.G. Application of Bayesian networks for sustainability assessment in catchment modeling and management (Case study: The Hablehrood river catchment). Ecol. Model. 2013, 268, 48–54. [Google Scholar] [CrossRef]
- Smith, J.W.; Smart, L.S.; Dorning, M.A.; Dupéy, L.N.; Méley, A.; Meentemeyer, R.K. Bayesian methods to estimate urban growth potential. Landsc. Urban Plan. 2017, 163, 1–16. [Google Scholar] [CrossRef]
- Stelzenmüller, V.; Lee, J.; Garnacho, E.; Rogers, S.I. Assessment of a Bayesian Belief Network-GIS framework as a practical tool to support marine planning. Mar. Pollut. Bull. 2010, 60, 1743–1754. [Google Scholar] [CrossRef] [PubMed]
- Pearl, J. Probabilistic Reasoning in Intelligent Systems: Networks of Plausible Inference, 1st ed.; Morgan Kaufmann: San Francisco, CA, USA, 1988; p. 552. ISBN 9781558604797. [Google Scholar]
- Kelly, R.A.; Jakeman, A.J.; Barreteau, O.; Borsuk, M.E.; ElSawah, S.; Hamilton, S.H.; Henriksen, H.J.; Kuikka, S.; Maier, H.R.; Rizzoli, A.E.; et al. Selecting among five common modelling approaches for integrated environmental assessment and management. Environ. Model. Softw. 2013, 47, 159–181. [Google Scholar] [CrossRef]
- Liedloff, A.C.; Woodward, E.L.; Harrington, G.A.; Jackson, S. Integrating indigenous ecological and scientific hydro–geological knowledge using a Bayesian Network in the context of water resource development. J. Hydrol. 2013, 499, 177–187. [Google Scholar] [CrossRef]
- Hamilton, S.H.; Pollino, C.A.; Jakeman, A.J. Habitat suitability modelling of rare species using Bayesian networks: Model evaluation under limited data. Ecol. Model. 2015, 299, 64–78. [Google Scholar] [CrossRef]
- Lauritzen, S.L.; Spiegelhalter, D.J. Local Computations with Probabilities on Graphical Structures and Their Application to Expert Systems. J. R. Stat. Soc. 1988, 50, 157–224. [Google Scholar] [CrossRef]
- Huffman, E.; Eilers, R.G.; Padbury, G.; Wall, G.; MacDonald, K.B. Canadian agri–environmental indicators related to land quality: Integrating census and biophysical data to estimate soil cover, wind erosion and soil salinity. Agric. Ecosyst. Environ. 2000, 81, 113–123. [Google Scholar] [CrossRef]
- Benjamin-Fink, N.; Reilly, B.K. A road map for developing and applying object-oriented bayesian networks to “WICKED” problems. Ecol. Model. 2017, 360, 27–44. [Google Scholar] [CrossRef]
- Heckerman, D. A Tutorial on Learning with Bayesian Networks, 1st ed.; Kluwer Academic Publishers: Washington, DC, USA, 1995; pp. 3–30. Available online: ftp://ftp.research.microsoft.com /pub/dtg/david/tutorial.ps (accessed on 18 October 2017).
- Zhang, T.-T.; Zeng, S.-L.; Gao, Y.; Ouyang, Z.-T.; Li, B.; Fang, C.-M.; Zhao, B. Assessing impact of land uses on land salinization in the Yellow River Delta, China using an integrated and spatial statistical model. Land Use Policy 2011, 28, 857–866. [Google Scholar] [CrossRef]
- Zhang, W.T.; Wu, H.Q.; Gu, H.B.; Feng, G.L.; Wang, Z.; Sheng, J.D. Variability of Soil Salinity at Multiple Spatio–Temporal Scales and the Related Driving Factors in the Oasis Areas of Xinjiang, China. Pedosphere 2014, 24, 753–762. [Google Scholar] [CrossRef]
- Nesheim, I.; Reidsma, P.; Bezlepkina, I.; Verburg, R.; Abdeladhim, M.A.; Bursztyn, M.; Chen, L.; Cissé, Y.; Feng, S.; Gicheru, P.; et al. Causal chains, policy tradeoffs and sustainability: Analysing land (mis)use in seven countries in the South. Land Use Policy 2014, 37, 60–70. [Google Scholar] [CrossRef]
- Kosmas, C.; Kairis, O.; Karavitis, C.; Acikalin, S.; Alcalá, M.; Alfama, P.; Atlhopheng, J.; Barrera, J.; Fernandez, F.; Gokceoglu, C.; et al. Catena An exploratory analysis of land abandonment drivers in areas prone to desertification. Catena 2014, 128, 252–261. [Google Scholar] [CrossRef]
- Fang, Y.; Jiang, N.N.; Liang, Y. Effects of Afforestation on Secondary Salinization Sites in the Yellow River Delta. Chin. For. Sci. Technol. 2009, 23, 15–19. (in Chinese) [Google Scholar] [CrossRef]
- Wang, H.W.; Fan, Y.H.; Tiyip, T. The research of soil salinization human impact based on remote sensing classification in oasis irrigation area. Procedia Environ. Sci. 2011, 10, 2399–2405. [Google Scholar] [CrossRef]
- Wei, H.; Wen, Z.S.; Zhen, Z.Y.; Kuang, W.H. Analysis on the shrinking process of wetland in Naoli River Catchment of Sanjiang Plain since the 1950s and its driving forces. J. Nat. Resour. 2004, 19, 725–731. (in Chinese) [Google Scholar] [CrossRef]
- Ghazaryan, K.; Chen, Y. Hydrochemical assessment of surface water for irrigation purposes and its influence on soil salinity in Tikanlik oasis, China. Environ. Earth. Sci. 2016, 75, 1–15. [Google Scholar] [CrossRef]
- Liu, C.; Xie, G.; Huang, H. Shrinking and Drying up of Baiyangdian Lake Wetland: A Natural or Human Cause? Chin. Geogr. Sci. 2006, 16, 314–319. [Google Scholar] [CrossRef]
- Jing, N.; Zhang, S.W.; Ying, L.I.; Wang, L. Analysis on Wetland Shrinking Characteristics and Its Cause in Heilongjiang Province for the Last 50 Years. J. Nat. Resour. 2008, 23, 80–83. (in Chinese) [Google Scholar] [CrossRef]
- Stone, J.V. Bays Rule: A Tutorial Introduction to BayesianAnalysis, 1st ed.; Sebtel Press: Sheffield, UK, 2013; pp. 29–43. ISBN 978-0-9563728-4-0. [Google Scholar]
- Du, Y.W.; Shi, F.Y.; Yang, N. Construction method for Bayesian network by fusing Experts’relative inferences. Comput. Eng. Appl. 2016, 52, 105–112. [Google Scholar] [CrossRef]
- Needham, C.J.; Bradford, J.R.; Bulpitt, A.J.; Westhead, D.R. A Primer on Learning in Bayesian Networks for Computational Biology. PLoS Comput. Biol. 2007, 3, 129. [Google Scholar] [CrossRef] [PubMed]
- O’Reilly, J.X.; Mars, R.B. Bayesian Models in Cognitive Neuroscience: A Tutorial an Introduction to Model-Based Cognitive Neuroscience; Springer: New York, NY, USA, 2015; pp. 3–24. [Google Scholar] [CrossRef]
- Martens, H.A.; Dardenne, P. Validation and verification of regression in small data sets. Chemom. Intell. Lab. Syst. 1998, 44, 99–121. [Google Scholar] [CrossRef]
- Feng, Q.; Gao, X. Application of Excel in the Experiment Teaching of Leave–one–out Cross Validation. Exp. Sci. Technol. 2015, 13, 49–51. (In Chinese) [Google Scholar] [CrossRef]
- Nikanorov, A.M.; Sukhorukov, B.L. Ecological hysteresis. Dokl. Earth Sci. 2008, 423, 1282–1285. [Google Scholar] [CrossRef]
- Beisner, B.E.; Haydon, D.; Cuddington, K.L. Hysteresis. Encycl. Ecol. 2008, 2008, 1930–1935. [Google Scholar] [CrossRef]
- Winter, R.A. Innovation and the dynamics of global warming. J. Environ. Econ. Manag. 2014, 68, 124–140. [Google Scholar] [CrossRef]
- Huaijun, W.; Yaning, C.; Weihong, L.I.; Haijun, D. Runoff Responses to Climate Change in Arid Region of Northwestern China during 1960–2010. Chin. Geogr. Sci. 2013, 23, 286–300. [Google Scholar] [CrossRef]
- Khadka, D.; Babel, M.S.; Shrestha, S.; Tripathi, N.K. Climate change impact on glacier and snow melt and runoff in Tamakoshi basin in the Hindu Kush Himalayan (HKH) region. J. Hydrol. 2014, 511, 49–60. [Google Scholar] [CrossRef]
- Dong, Y.; Haimiti, Y. Spatio-temporal variability and trend of potential evapotranspiration in Xinjiang from 1961 to 2013. Nongye Gongcheng Xuebao/transactions of the Chin. Soc. Agric. Eng. 2015, 31, 153–161. (In Chinese) [Google Scholar] [CrossRef]
- Ruo-Nan, L.I.; Chen, Q.W.; Cai, D.S.; Wang, H.M. One-dimensional and two-dimensional coupled water environment model for studying the impact of upstream reservoir operation. Shuili Xuebao/J. Hydrol. Eng. 2009, 40, 769–775. (In Chinese) [Google Scholar] [CrossRef]
- Sven, E.J.; Brian, D.F. Fundamentals of Ecological Modelling, Applications in Environmental Management and Research, 4th ed.; Science Press: Beijing, China, 2010; pp. 218–223. ISBN 978-7-03-033095-6. [Google Scholar]
- Chun-Lan, M.A. The Groundwater Depth Spatial–Temporal Differentiation Laws of Different Runoff Changes in Keriya River Basin. J. Anhui Agric. Sci. 2013, 26, 10766–10769. (In Chinese) [Google Scholar] [CrossRef]
- Su, X.; Yuan, W.; Du, S.; Cui, G.; Bai, J.; Du, S. Responses of groundwater vulnerability to groundwater extraction reduction in the Hun River Basin, northeastern China. Hum. Ecol. Risk Assess. Int. J. 2017, 23, 1121–1139. [Google Scholar] [CrossRef]
- Fan, Z.L.; Ying-Jie, M.A.; Zhang, H.; Wang, R.H.; Zhao, Y.J. Research of eco-water table and rational depth of groundwater of Tarim River drainage basin. Arid Land Geogr. 2004, 27, 8–13. (In Chinese) [Google Scholar] [CrossRef]
- Singh, A. Soil salinization and waterlogging: A threat to environment and agricultural sustainability. Ecol. Indic. 2015, 57, 128–130. [Google Scholar] [CrossRef]
- Landuyt, D.; Broekx, S.; D’hondt, R.; Engelen, G.; Aertsens, J.; Goethals, P.L.M. A review of Bayesian belief networks in ecosystem service modelling. Environ. Model. Softw. 2013, 46, 1–11. [Google Scholar] [CrossRef]
- Rahman, M.M.; Hagare, D.; Maheshwari, B. Framework to assess sources controlling soil salinity resulting from irrigation using recycled water: An application of Bayesian Belief Network. J. Clean. Prod. 2015, 105, 406–419. [Google Scholar] [CrossRef]
- Xue, J.; Gui, D.; Lei, J.; Mao, D.L. Development of a participatory Bayesian network model for integrating ecosystem services into catchment-scale water resources management. Hydrol. Earth Syst. Sci. 2016, 2016, 1–37. [Google Scholar] [CrossRef]
- Zhang, T.; Simelton, E.; Huang, Y.; Shi, Y. Agricultural and Forest Meteorology A Bayesian assessment of the current irrigation water supplies capacity under projected droughts for the 2030s in China. Agric. For. Meteorol. 2013, 178–179, 56–65. [Google Scholar] [CrossRef]
- Martín de Santa Olalla, F.; Dominguez, A.; Ortega, F.; Artigao, A.; Fabeiro, C. Bayesian networks in planning a large aquifer in Eastern Mancha, Spain. Environ. Model. Softw. 2007, 22, 1089–1100. [Google Scholar] [CrossRef]
- Xue, J.; Gui, D.; Lei, J.; Zeng, F.; Mao, D.; Zhang, Z. Model development of a participatory Bayesian network for coupling ecosystem services into integrated water resources management. J. Hydrol. 2017, 554, 50–65. [Google Scholar] [CrossRef]
- Shao, J.; Zhang, F.; University, S. Influence of Brackish Water Drip Irrigation on Soil Salt and Alkali in Manasi River Basin. Bull. Soil Water Conserv. 2015, 33, 216–221. [Google Scholar] [CrossRef]
- GloVis. Available online: http://glovis.usgs.gov/ (accessed on 21 July 2015).
- Geospatial Data Cloud. Available online: http://www.gscloud.cn/ (accessed on 21 July 2015).


| Variables | Indicators | Data Type | Source | Temporal Coverage | |
|---|---|---|---|---|---|
| Drivers | Global warming | Decennary average air temperature (°C) | Time-series | [28] | 1960–2007 a |
| Population growth | Yearly population density of entire county (person/km2) | Time-series | [29,30] | 1950–2014 | |
| Economic growth | Yearly per capita GDP (¥) | Time-series | [29,30] | 1950–2014 | |
| Steady policy force | The ratios of environmental policy number of sustainability to anti-sustainability (%) | Time-series | [31] | 1960–2015 a | |
| Flash flooding | Flash flooding (termed “Sel” in Uyghur) usually occurs due to heavy rain in the mountains, is always fast-moving, unexpected, and destructive to roads and fields in some areas. Generally, it leads to bed elevation of drainage ditches, and decreases land slope by depositing mud sedimentation in low areas during its path while creating natural large drainage channels at relatively higher elevated areas during its path by eroding the soil surface | Stakeholder’s opinion | Consultation | – | |
| Pressures | Surface water quantity | Yearly runoff (108 m3), measured at the main dike | Time-series | [29,30] | 1957–2014 |
| ET/precipitation | Yearly quantity of potential evapotranspiration (mm)/Yearly rainfall (mm) | Time-series | [27], MBK b | 1961–2012 | |
| Surface water extraction | Sum of the yearly irrigation quantity, extracted from river, reservoir and spring water (104 m3) | Time-series | [29,30] | 1950–2014 | |
| Land claim | Yearly irrigated area (ha) | Time-series | [29,30] | 1949–2014 | |
| Irrigation water quantity | Traditional flood irrigation frequency (times/year), and normal yearly water consumption is 350 m3, fields are divided into 0.5/0.25 mu, and follows the strict priority along the water channel during irrigation | Stakeholder’s opinion | Consultation | – | |
| Farm groundwater exploitation | Yearly exploitation quantity of farmland groundwater (104 m3) | Time-series | [29,30] | 1978–2014 | |
| Ecotone water logging | RS data of water body area (including wetland area, lake area and reservoir) (ha) | Time-series | [10] | 1976–2011a | |
| Ecotone drainage | Drainage functions and completeness of river course (drainage is one river dual function in the area, due to river seasonality and low elevation), natural drainage ditches (created by flash floods) and natural pits (termed “Dashliq” in Uyghur, means pits with reddish salty water) | Stakeholder’s opinion | Consultation | – | |
| Farmland drainage | Drainage functions and completeness of artificial drainage and natural drainage ditches | ||||
| Farmland tree plantation | Whether fruit-crop is inter-planted | ||||
| States | Farmland salinization | Changes of salt affected cultivated land (ha) were determined by field symptoms: field is relatively wet, but crop withers easily; and field has a shallow groundwater table, but requires regularly irrigation. Under the maximum degree of salt impact, fields would become entirely dead if they lose only one year of irrigation chance | Stakeholder’s opinion | Consultation | – |
| Ecotone light salinization | Remote sensing data of lightly salinized area (ha) | Time-series | [9,10,32] c | 1976–2011 a | |
| Ecotone moderate salinization | Remote sensing data of moderate salinized area (ha) | 1976–2011 a | |||
| Ecotone severe salinization | Remote sensing data of severely salinized area (ha) | 1976–2011 a | |||
| No | Cause-Effect Variable Chain | Error Rate (%) | Number of Tests |
|---|---|---|---|
| a | Economic growth—Land claim | 10.39 | 54 |
| b | Population growth—Land claim | 12.60 | 54 |
| c | Land claim—Farm groundwater exploitation | 36.29 | 37 |
| d | Land claim—Surface water extraction | 22.33 | 37 |
| e | Surface water extraction—Farm groundwater exploitation | 60.55 | 37 |
| f | Global warming—Surface water quantity | 16.16 | 6 |
| g | Surface water quantity—Surface water extraction | 25.52 | 37 |
| h | Surface water quantity—Ecotone water logging | 19.70 | 4 |
| i | Surface water extraction—Ecotone water logging | 35.00 | 4 |
| j | Farm groundwater exploitation—Ecotone water logging | 44.47 | 4 |
| k | Ecotone water logging—Ecotone soil light salinization | 5.01 | 4 |
| l | Ecotone water logging—Ecotone soil moderate salinization | 29.77 | 4 |
| m | Ecotone water logging—Ecotone soil severe salinization | 18.65 | 4 |
| n | ET/precipitation—Ecotone soil light salinization | 2.97 | 4 |
| o | ET/precipitation—Ecotone soil moderate salinization | 75.64 | 4 |
| p | ET/precipitation—Ecotone soil severe salinization | 35.12 | 4 |
| q | ET/precipitation—Ecotone water logging | 55.89 | 4 |
| r | Global warming—ET/precipitation | 29.5 | 6 |
| Issue | Scale | Data Types | Scenario | Validation | Approach | Reference |
|---|---|---|---|---|---|---|
| Secondary soil salinization trend | Keriya Oasis, NW China | Time–series, Stakeholder opinion, | No | Yes | BNs, DPSIR | This study |
| Soil salinity controlling | Crane Brook, NSW, Australia | Time–series | Yes | No | BNs | [87] |
| Secondary soil salinization risk | The Yinchuan Plain, China | Spatial data set | No | No | DPSIR | [12] |
| Dry land salinity management | Little River Catchment, Australia | Spatial data set | Yes | No | BNs | [14] |
| Water resource management | Qira Oasis, NW, China | Stakeholder and expert opinion, | Yes | Yes | BNs, IWRM | [88] |
| Water supplies capacity | Sub–China | Time–series, model output | No | No | BNs | [89] |
| Aquifer planning | Eastern Mancha, Spain | Stakeholder’s opinion, Time–series, | No | Yes | BNs | [90] |
| Ecosystem services | NW China | Literature, book, Stakeholder’s opinion | Yes | – | IWRM, BNs | [91] |
| Wildlife management | – | expert opinion | – | Yes | BNs | [55] |
| Strength | Opportunities | Weaknesses | Threats |
|---|---|---|---|
| Expert knowledge utilization | Knowledge acquisition | Knowledge–driven validation tools | Reliability |
| Stakeholder opinion utilization | Knowledge acquisition | Knowledge–driven validation tools | willingness of Experts and Stakeholders to participate |
| Combination of empirical data to quantified data | Enables adjusting easily | May produce bias | Limited scientific model acceptance |
| Applicable to adaptive management | Analyzing synergetic implications | Absence of feedback–loops | Perceived level of knowledge varies |
| Probabilistic treatment of uncertainties | User–friendly computational software | Data discretization | – |
| Observation of conditional probability table | Comprehensive understanding of scope | Absence of enough data sets | – |
© 2018 by the authors. Licensee MDPI, Basel, Switzerland. This article is an open access article distributed under the terms and conditions of the Creative Commons Attribution (CC BY) license (http://creativecommons.org/licenses/by/4.0/).
Share and Cite
Seydehmet, J.; Lv, G.H.; Nurmemet, I.; Aishan, T.; Abliz, A.; Sawut, M.; Abliz, A.; Eziz, M. Model Prediction of Secondary Soil Salinization in the Keriya Oasis, Northwest China. Sustainability 2018, 10, 656. https://doi.org/10.3390/su10030656
Seydehmet J, Lv GH, Nurmemet I, Aishan T, Abliz A, Sawut M, Abliz A, Eziz M. Model Prediction of Secondary Soil Salinization in the Keriya Oasis, Northwest China. Sustainability. 2018; 10(3):656. https://doi.org/10.3390/su10030656
Chicago/Turabian StyleSeydehmet, Jumeniyaz, Guang Hui Lv, Ilyas Nurmemet, Tayierjiang Aishan, Abdulla Abliz, Mamat Sawut, Abdugheni Abliz, and Mamattursun Eziz. 2018. "Model Prediction of Secondary Soil Salinization in the Keriya Oasis, Northwest China" Sustainability 10, no. 3: 656. https://doi.org/10.3390/su10030656