Main Factors Affecting Post-Harvest Grain Loss during the Sales Process: A Survey in Nine Provinces of China


Institute for Food Safety Risk Management, School of Business, Jiangnan University, Wuxi 214122, China
*
Author to whom correspondence should be addressed.
Sustainability 2018, 10(3), 661; https://doi.org/10.3390/su10030661
Submission received: 4 January 2018
/
Revised: 13 February 2018
/
Accepted: 26 February 2018
/
Published: 1 March 2018
(This article belongs to the Section Sustainable Agriculture)
Abstract
:Ensuring food security has always been a top priority of the Chinese government. However, China’s grain supply is facing challenges due to limited resources for grain production and the growth of domestic grain consumption. Reducing post-harvest grain loss represents one of the most realistic and effective ways to ensure grain security in China. In view of the importance of grain sales in the post-harvest period, we conducted a survey, interviewing 1890 grain sellers across 54 regions in 9 provinces of China, to investigate the factors affecting post-harvest grain loss during sales. The results of the survey show that grain storage conditions have the greatest impact on post-harvest grain loss, followed by transportation. Display and sales have the least impact on grain loss. The Tobit regression model was used to analyze the main factors affecting post-harvest grain loss during sales. The findings suggest that the seller’s education level, years of working as a seller, the conditions of grain storage, and the supply and management level of public facilities in the market were negatively correlated with grain loss in the sales process, whereas the seller’s age, the separation of sales shops and storage warehouses, and the fall season were positively correlated with grain loss. Policy implications are also provided for potential future policy decisions.
1. Introduction
Food security is a necessary foundation for economic and social stability and sustainable development and has been the focus of current work by several international organizations and national governments [1]. China, a large country with a population of about 1.4 billion, pays particular attention to its food security status [2,3]. Grains are the most important group of products in China’s food security program. To ensure the security of the grain supply in past decades, China has paid huge environmental and resource costs by relying on a large investment in pesticides and fertilizers and an increase of cultivated land, without paying enough attention to the sustainable development of grain production [4]. After consecutive growth of China’s grain production for 12 years, from 2004 to 2015, a further increase in grain production is meeting rising difficulties, constrained by reduced arable land, water shortages, climate change, and other factors [5,6,7]. However, with population growth and an upgrade in grain consumption patterns of residents, China’s grain consumption and demand have increased remarkably and inflexibly [8]. In this context, there also exist quite severe post-harvest grain losses in China. According to preliminary estimates, China’s annual post-harvest grain loss is about 80 billion kg, equivalent to the production from 100,000 km2 of high-yield farmland, or about 15% of the annual total national grain production, which is enough to feed 200 million people for one year [9]. The massive post-harvest grain loss in China not only reduces the grain supply, but also restricts China’s self-sufficiency in the grain market. It also wastes a large amount of the labor, arable land, fresh water, fertilizers, and other resources used in grain production, which does not go along with sustainable development. Therefore, it is very important to reduce post-harvest grain loss to ensure a sufficient supply of grains and to make utilization of the agricultural production resources sustainable.
Post-harvest loss was defined by Boxall (1986) as loss that occurs when the grain is taken from the site of growth or production to the point where it is prepared for consumption [10]. Since then, scholars from developing and developed countries, as well as different international organizations, have conducted pilot studies on this concept across different countries or regions based on local situations. For example, Aulakh and Regmi (2013) referred to post-harvest food loss as the inevitable loss of grain caused by objective factors, such as the lack of infrastructure, the lack of management and technology, and outdated equipment [6]. Song et al. (2015) defined the concept of post-harvest grain loss as the sum of all tangible grain losses during the processes of harvesting, transportation, drying, and storage [11]. Based on the existing literature and the situation in China, Wu et al. (2017) pointed out that post-harvest grain loss should refer to the decrease in quantity and quality of edible grain in the supply chain caused by factors such as natural conditions, infrastructure, technological equipment, management decisions, and practitioners' individual characteristics [12].
In fact, the post-harvest period involves many steps. It refers to the entire supply chain system, from harvesting to consumption: harvesting, transportation, drying, storage, processing, sales, and consumption [12]. Post-harvest grain loss can occur between these steps, and the extent and causes of grain loss vary depending on the nature of the specific post-harvest steps and the type of grain. In previous studies, most researchers put their focus on specific steps in the post-harvest grain loss process [13,14,15,16], such as harvesting, transportation, storage, or consumption. It is rare to investigate grain loss during sales, especially in developing countries (and regions), including China. The sales step, as the final step in the grain production-consumption process, plays an important role in reducing post-harvest grain loss. Accordingly, China has promulgated relevant policies to promote the structural transformation of grain sellers. In particular, local governments are required to adopt preferential policies to support knowledge-based, technology-based, and scale-based sellers to reduce grain loss at the sales stage.
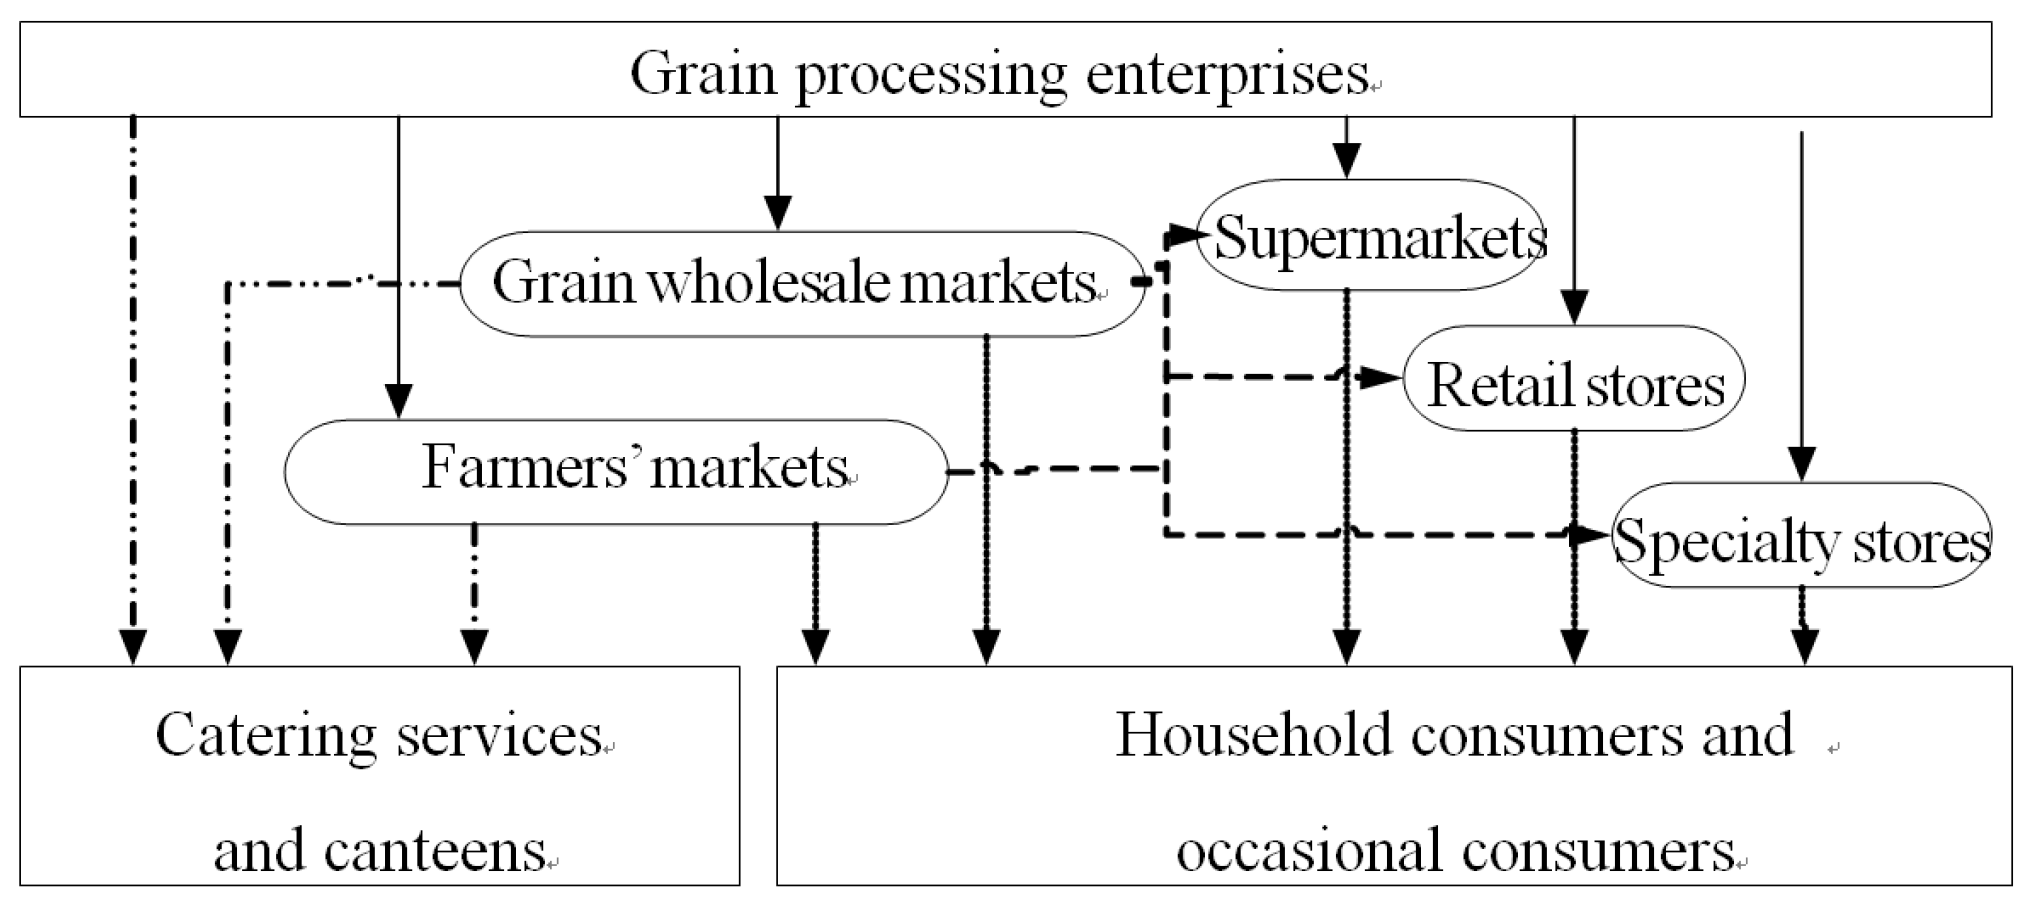
Understanding the main factors affecting post-harvest grain loss during the sales process in China will help with better design of intervention steps to reduce grain loss and promotion of sustainable development of the grain supply. Therefore, the objective of this study was to investigate the main factors affecting post-harvest grain loss at the sales stage, by applying the Tobit regression model to analyze the data obtained from valid questionnaires of 1662 grain sellers across 54 regions in 9 provinces of China. It should be pointed out that based on China’s actual situations and previous research findings, grain loss at the sales stage is defined as “the amount of grains that are reduced before reaching consumers during the sales process due to limited operating conditions and the lack of management capacity at the sales stage,” and the sales stage is divided into subcategories: transportation, storage, and display and sales. In our study, we examined post-harvest grain loss involving the sellers and channels specified in Figure 1. The different scales of grain sellers in China include wholesale markets, farmers’ markets, supermarkets, retail stores, and grain and oil specialty stores. The grains for sale that were surveyed included rice, wheat, maize, soybean, peanut, rapeseed, and others.
2. Literature Review and Hypothesis Development
China has many grain varieties and geographical regions, which means substantial differences in the levels of economic and social development and consumption habits across regions. Also, according to observed reality, the factors that influence grain loss are in different subcategories at the grain sales stage. In addition, a range of sellers are widely distributed geographically, and they differ substantially in scale and level of mechanization [12]. Thus, multiple factors affect post-harvest grain loss at the sales stage, including the personal characteristics of the sellers (e.g., age, education level, and years of working), the management characteristics (e.g., storage and equipment), and the external environment (e.g., policy factors, sales seasons).
To study the main factors affecting post-harvest grain loss at the sales stage, this study makes the following hypotheses based on the available research literature and the investigations.
2.1. Personal Characteristics of Grain Sellers
Previous studies showed that the characteristics of grain sellers affect the extent of grain loss at the sales stage [17]. Kaminski and Christiaensen (2014) conducted a survey on maize sellers, and the results showed that the gender and age of a seller had an impact on maize loss at the sales stage [18]. In particular, young male sellers were correlated with less maize loss. In our on-site investigation, we found that the sellers’ education level was generally low, and most of them lacked basic knowledge of grain management. Also, lack of awareness of grain saving is common in the grain sales industry at present. Our pre-survey also found that a seller’s years of working was negatively correlated with grain loss during the sales process. The more years worked, the less grain lost. Therefore, we derived the following hypotheses regarding grain loss at the sales stage:
Hypothesis 1.
Compared to their male colleagues, female sellers are associated with more grain loss.
Hypothesis 2.
The age of a seller is positively correlated with grain loss.
Hypothesis 3.
The education level of a seller is negatively related to grain loss.
Hypothesis 4.
The seller’s years of working is negatively related to grain loss.
2.2. Separation of Grain Shops and Storage Warehouses
Our survey found that if sellers’ shops and storage warehouses are geographically close or adjacent, it improves the sellers’ management efficiency and helps reduce grain loss. Therefore, the separation of shops and storage warehouses is closely related to the extent of grain loss. During our survey, we also found that the majority of grain sellers operated at a small scale, and the number of employees was <10. Also, warehouse managers generally lack professional knowledge and capabilities. Therefore, the following hypothesis is made:
Hypothesis 5.
The separation of sellers’ shops and warehouses is positively correlated with grain loss during the sales process.
2.3. Grain Seller’s Equipment Level
Premanandh (2011) pointed out that poor infrastructure in developing countries is a major contributor to grain loss, and these countries should increase their investment to improve key technologies and equipment [19]. Koester (2014) argued that lagging infrastructure and facilities in developing countries is a major cause of higher levels of grain loss when compared to developed countries [20]. Also, as transportation and storage represent important steps in the grain sales process, the level of mechanized equipment determines the production efficiency of grain sales and has a positive impact on reducing grain loss [21]. Qin et al. (2008) pointed out that grain products are commodities with large sales volumes but low margins, and they require a lot of manpower and resources during the transportation, storage, and sales stages [22]. To maximize their interest, grain sellers often have a negative attitude toward equipment updates. In our survey, we also found that most grain sellers chose to reduce their investment in equipment to cut costs and increase profit due to intense competition pressure and low margins. Overall, wearing out of equipment is a common problem for grain sellers. Therefore, the following hypothesis is derived:
Hypothesis 6.
The level of grain sellers’ equipment is negatively correlated with grain loss.
2.4. Grain Sellers’ Grain Storage Conditions
During the sales process, grains are often stored temporarily by grain sellers before entering the market. As a result, storage conditions and methods affect the extent of grain loss and quality [6]. Grains that are temporarily stored are susceptible to damage caused by rodents, insects, and microbes, which affects their quantity and quality. Therefore, good storage conditions could effectively reduce grain loss from insects or other pests [23]. A study by Munesue et al. (2015) further showed that the longer the storage time and the worse the storage conditions, the more severe the grain loss [24]. Therefore, grain sellers should improve storage conditions as much as possible. For example, reasonable control of storage temperature and humidity is important [6]. Boxall (1986) also pointed out that it is necessary to maintain proper moisture content where grains are stored [10]. Good ventilation and dehumidification measures are needed as well. Additionally, insufficient storage conditions during display could increase grain loss. Our on-site survey also found that substantial differences existed in grain storage conditions among different sellers. For some grain sellers, their storage warehouses were well equipped with damp-proof floors, ventilators, and thermometers. For others, however, their storage warehouses were in dismal condition. Therefore, the following hypothesis is made:
Hypothesis 7.
Grain sellers’ storage conditions are negatively correlated with grain loss during the sales process.
2.5. Supply of Public Facilities and Market Management Level
The reality is that many grain sellers often gather in a variety of markets, such as grain wholesale markets, farmers’ markets, supermarkets, and so on. The size and scale of these markets differ, and the number of sellers varies. Grain wholesale markets, farmers’ markets, and supermarkets are generally operated and managed by major investors or commissioned by third parties. In the market, a seller leases or buys the facilities (e.g., shops and warehouses) provided by the market management, and uses public facilities such as water, electricity, and roads to carry out sales and business activities. Therefore, the condition and management level of these facilities would affect the extent of grain loss during the sales process. Our on-site survey found that grain sellers often complained that neglect and mismanagement of the market contributed to grain loss during the sales process. Therefore, the following hypothesis is derived:
Hypothesis 8.
The supply and management level of public facilities in a market are negatively related to grain loss.
2.6. Seasonal Factors
Seasonal factors, especially weather conditions, play a crucial role in affecting the retail grain industry. On the one hand, grains are susceptible to extreme weather events, such as prolonged exposure to strong sunlight and heavy rainstorms during transportation, which can lead to grain loss. On the other hand, bad weather can affect the storage environment. Continued high temperature can shorten the shelf life of grains. When grain sellers are not able to provide a good storage environment, grains can rapidly deteriorate [6,25]. In our on-site survey, grain sellers also reported that the summer season, with high temperatures and heavy precipitation, can cause more mold problems. Therefore, the following hypotheses are made:
Hypothesis 9.
The spring season is negatively correlated with grain loss.
Hypothesis 10.
The summer season is positively correlated with grain loss.
Hypothesis 11.
The fall season is negatively correlated with grain loss.
2.7. Government Policies in Support of the Grain Market
The Food and Agriculture Organization of the United Nations pointed out in its 2011 report concerning global grain loss and waste that the government policy environment affects grain loss [13]. A study conducted by Kitinoja et al. (2011) also suggested that grain loss in developing countries is closely related to government regulation, policy support, and national legislation [17]. Also, government interventions can affect the sellers’ behavior and the rate of grain loss [26]. In our on-site survey, we found that there was a lack of local government policies in support of sellers, which, to some extent, could affect the grain sellers’ motivation to reduce grain loss. Therefore, the following hypothesis is derived:
Hypothesis 12.
Government policies in support of grain markets are negatively correlated with grain loss.
3. Materials and Methods
3.1. Description of the Study Region
The objective of this study was based on a special nonprofit sector research project entitled “Research on the Survey of Grain Loss and Waste in Post-Harvest Stages and the Relevant Assessment Techniques”, supported by the State Administration of Grain in China. The survey area and sample size were determined by the project’s expert steering team. In the present study, surveys were conducted across 54 regions in 9 designated provinces (Anhui, Guangdong, Hunan, Hubei, Jiangsu, Liaoning, Shandong, Shaanxi, and Sichuan). The sampling regions not only cover the major regions of China, but also span across five major grain-producing areas (South China, Central China, East China, Southwest China, and Northeast China). Therefore, our samples have a good representation of spatial distributions (Figure 2). Furthermore, according to years of observation by the State Administration of Grain, these nine provinces are not only regionally representative, but also among the typical areas where post-harvest grain loss is severe. Therefore, our survey work was mainly conducted in these nine provinces to find out the major factors that contribute significantly to grain loss during the sales process.
3.2. Data Collection and Questionnaire Design
The survey was conducted from August 2016 to September 2016. Prior to the large-scale survey, a preliminary survey was conducted of grain sellers of varying scales in Wuxi City of Jiangsu Province, to identify potential questionnaire problems, make changes, and finalize the questionnaire. Interviewers received scientific training and were instructed in how to prevent the participating grain sellers (hereinafter referred to as respondents) from answering questions in an incomplete manner, or even concealing their true thoughts when interviewed due to their own interests. Additionally, respondents’ understanding of the surveyed questions could vary significantly. When the formal survey was conducted, to prevent the respondents’ misunderstanding of the questionnaire and information distortion, trained interviewers paid random visits to the designated survey areas and interviewed the respondents face-to-face, and the questionnaire was filled out by the interviewers. The final questionnaires were conducted in nine provinces, shown in Figure 2. We conducted stratified sampling, and six cities were surveyed in each province, according to the population distribution. In each provincial city, we chose 10 to 15 sellers of different sizes in one city, one county, and one town. The respondents (grain sellers) were asked to provide direct answers to the questionnaire in face-to-face interviews. A total of 1890 respondent samples were obtained in our survey, and the number of effective samples was 1662, with an effective rate of 87.94%.
The questionnaire items were set based on the existing research literature (the main references are cited in the Literature Review and Hypothesis Development section of this paper) and the objective observations during the pre-survey in Wuxi, Jiangsu Province, China. The formal questionnaire is composed of the following parts: First, the individual information and management characteristics of the respondents, including gender, age, educational attainment, and years of working, and the separation of grain stores and storage warehouses, equipment level, and grain storage conditions, corresponding to Table 1. Second, the respondents’ judgment on the impact of relevant factors on grain loss in the various steps of grain sales, including transportation (loading and unloading methods, handling tools, packaging quality, weather conditions during loading and unloading), storage (equipment conditions, warehouse ventilation, hot and humid environment, mildew), display and sales links (grain display, grain shelf life, etc.), corresponding to Table 2. Third, the respondents’ judgment on the impact of the external environment on grain loss, including the level of supply and management of public facilities in the market, seasonal factors (spring, summer, and autumn), the government’s supportive policies on grain markets, etc., corresponding to the relevant content in Table 3.
4. Results
4.1. Descriptive Statistics
4.1.1. Demographics
Table 1 provides the basic statistical characteristics of the grain sellers interviewed. Among 1662 respondents, men accounted for 51.93%, which was slightly higher than the percentage of women. Regarding age distribution, most respondents fell in the age group of 36–45 years, which accounted for 40.61% of the total, and approximately 95% of the respondents were ≤56 years old. In terms of education level, years of working, size of the sales shops, and annual revenue, the highest percentage fell in the brackets of junior high school (44.71%), 6–10 years of working (33.21%), 20–50 m2 (46.93%), and annual sales of 100,000–500,000 RMB (42.48%).
4.1.2. Factors that Affect Grain Loss at Different Steps of Grain Sales
The results of the statistical analysis of the 1662 sellers’ judgment on the factors affecting grain loss in the different subcategories (transportation, storage, and display and sales) during the grain sales process are shown in Table 2. The survey showed that, in terms of transportation, 13.60% and 36.16% of respondents believed that weather conditions during the (un)loading had a great and relatively important impact, respectively, on grain loss. In terms of storage, 11.67% and 35.68% of respondents indicated that storage equipment conditions had a great and relatively important impact, respectively, on grain loss; and 15.88% and 42.18% of respondents thought that ventilation and humid and hot conditions in the storage warehouse played a significant and intermediate role, respectively, on grain loss; 19.73% and 33.21% of respondents believed that mold contamination had a great and relatively important impact, respectively, on grain loss. Furthermore, in terms of display and sales, 40.01% and 32.37% of respondents indicated that the display method had limited or relatively little impact, respectively, on grain loss. The shelf life of grains puts a time limit on grain sales, as 29.18% and 28.64% of respondents believed that shelf life had limited or relatively little impact, respectively, on grain loss.
4.2. Variable Selection
Based on the foregoing assumptions, we defined sellers’ grain loss ratio at the sales stage as the dependent variable, and factors that affect this value as independent variables. The definitions of all variables and their types are shown in Table 3.
4.3. Tobit Regression Analysis
To clarify the distribution pattern of the sellers’ grain loss ratio, the present study plots a histogram of Y values (in Table 3), as shown in Figure 3.
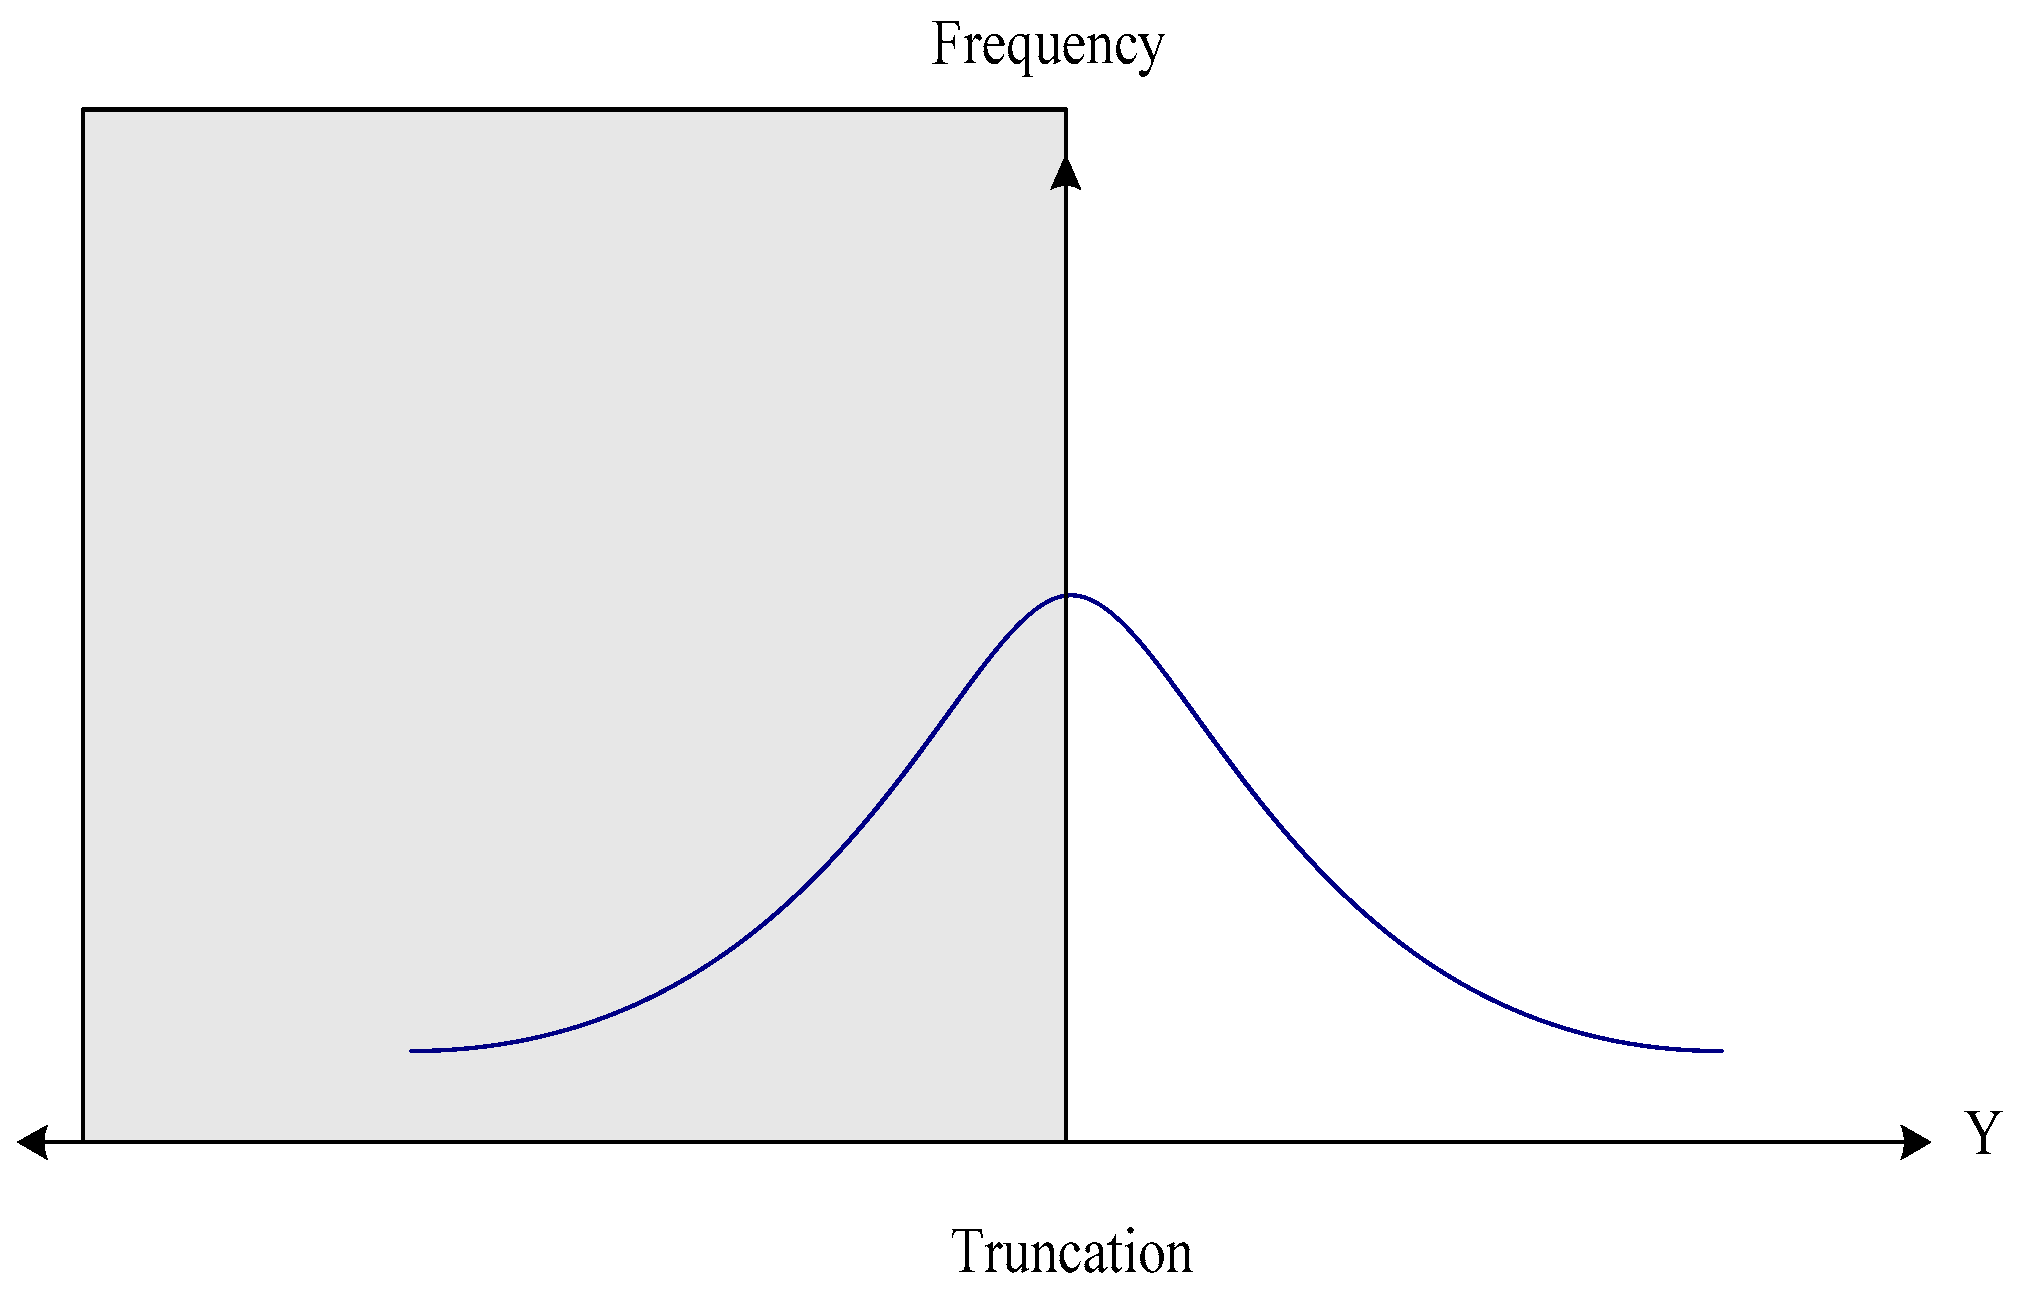
As seen in Table 3 (Y mode) and Figure 3 (the histogram of grain loss rate), Y is a variable that is continuous over a strictly positive range but takes a positive value of zero, meeting the characteristics of Tobit model [27]. Also, Y can be regarded as a normal distribution truncated at 0 according to the histogram as shown in Figure 4.
Based on the above reasons, Tobit regression models were established:
where i = 1,2,⋯,n, n represents the number of samples, k represents the kth explanatory variable, yi represents the dependent variable, xi represents the independent variable, βK represents the estimated parameter, and εK represents the random error term.
Then, Stata 12.0 analysis software (StataCorp LLC, College Station, TX, USA) was used to estimate the effects of different factors on grain loss; the results are shown in Table 4.
It can be seen from Table 4 that a grain seller’s age, education level, and years of working, separation of sales shops and storage warehouses, grain storage conditions, the supply of public facilities and the management level, and fall season were statistically significant at the 0.01 level, whereas the remaining variables were not statistically significant. Within those significant variables, the regression result of the fall season variable was not consistent with our research hypothesis. This is probably because the fall season is known for big temperature changes between day and night. As a result, condensation is likely to occur on grain stacks. Other possibilities, such as inadequate implementation of storage and management measures, may also cause grain loss.
5. Discussion
Based on the results above, the present study mainly focused on three aspects—individual characteristics of grain sellers (operators), their managerial characteristics, and external factors—to conduct further analysis.
5.1. Individual Characteristics of Grain Sellers (Operators)
Based on the regression model, the coefficient for the grain sellers’ ages was 0.009, suggesting that as their age increases, the extent of grain loss will rise substantially. Also, with one unit increase in grain sellers’ age, the grain loss rate will increase by 0.009 unit, which is consistent with hypothesis 2. This is probably because older grain sellers generally lack knowledge of grain saving. Moreover, sticking to traditional sales practices, they cannot take effective measures to reduce grain loss. The coefficient for the grain sellers’ education level was −0.033, suggesting that an increase in education level would significantly reduce grain loss, which is consistent with hypothesis 3. This is not difficult to understand, since a highly educated seller would have a relatively well-rounded business philosophy and strong awareness of grain saving, which would be helpful in alleviating grain loss. The estimated coefficient for the years of working was −0.023, suggesting that the more years of working, the less the extent of grain loss. Also, with one unit increase in the grain sellers’ years of working, the grain loss rate will decrease by 0.023 unit, which is consistent with hypothesis 4. This is probably because a grain seller with many years of working history is more experienced, and thus can make a reasonable arrangement regarding inventory according to market demand and effectively avoid grain loss.
5.2. Managerial Characteristics of Grain Sellers
The coefficient for the separation of sales shops and storage warehouses was 0.188, suggesting that if a seller’s store and storage warehouse are geographically close or adjacent, it helps to reduce grain loss, which is consistent with hypothesis 5. The coefficient for grain storage conditions was −0.171, suggesting that improved storage equipment could help reduce grain loss, which is consistent with hypothesis 7, and with the findings by the Food and Agriculture Organization (FAO) (2011), Mena et al. (2011), Beretta et al. (2012), and other scholars [13,28,29]. However, it is not consistent with the findings of Giuseppe et al. (2014), who claimed that an improvement in storage conditions would increase grain loss [30]. Their explanation was that to improve grain storage conditions, a seller would have to increase his or her investment in storage facilities. To save cost (Minnich and Maier, 2006) [31], however, sellers tend to cut managerial input at the same time, thereby increasing the risk of grain loss. Although the findings of Giuseppe et al. (2014) are somewhat reasonable, their generality need more tests [30].
5.3. External Factors
The coefficient for the supply and management level of public facilities was −0.183, indicating that improved supply and standardized market management practices would significantly reduce grain loss, which is consistent with hypothesis 8. The coefficient for the fall season variable was 1.019, which is statistically significant at the 0.000 level, suggesting that grain loss events are more likely to be associated with the fall season, which is not consistent with hypothesis 11. By contrast, the coefficient for the summer season variable was statistically insignificant, inconsistent with respondents’ noting that summer is more likely to be associated with grain loss. This is probably because high temperatures, heavy precipitation, and other bad weather conditions often occur in summer. Therefore, grain sellers should strengthen grain management beforehand. By contrast, temperatures get cooler in the fall season, and grain sellers often overlook the impact of the big change between daytime and nighttime temperatures on grain storage. As a result, condensation is likely to occur on grain stacks due to their lack of caution (Sun, 2014) [32]. Cool temperatures in the fall season are ideal for the growth of microbes and pest insects, which, coupled with inappropriate measures for ventilation and dehumidification, could cause local insect, overheating, and mold problems (Zhang and Song, 2003) [33], which could further lead to grain loss.
6. The Main Conclusions and Policy Implications
Post-harvest grain loss during the sales process is a matter of importance but does not receive enough attention. Understanding the main factors affecting post-harvest grain loss during the sales process will help in formulating more effective measures to reduce grain loss and promote food security in China and other countries with similar conditions worldwide. By interviewing 1662 grain sellers across 54 regions in 9 provinces of China and using the Tobit regression model, the present study analyzed the main factors affecting post-harvest grain loss at the sales stage. The results show that grain storage conditions had the largest impact, followed by the steps of transportation. By contrast, display and sales had the least impact on grain loss. Additionally, the seller’s education level and years of working, the conditions of grain storage, and the supply and management level of public facilities in the market were all negatively correlated with grain loss at the sales stage, whereas the seller’s age, the separation of sales shops and storage warehouses, and the fall season were positively correlated with grain loss.
The conclusions of this study have multiple implications on policy-making. First, using a variety of policy tools, the government should encourage grain sellers to increase their investment in equipment and to improve grain storage facilities and conditions, and effectively improve their management skills. Second, a variety of newly established markets with grain sales functions should strive to minimize the geographical separation of shops and storage warehouses. Also, storage warehouses should be built to higher standards. Market management should be standardized, and the public infrastructure supply should be increased. The government should provide necessary financial subsidies or tax relief to support the owners/operators of existing markets and grain sellers in improving sales facilities. This is especially true for markets that have been running for years. Third, relevant laws and regulations, as well as supervision and enforcement of grain-related laws and regulations, must be strengthened. By doing so, grain waste behavior would be restrained or punished through legal means. Fourth, the government should fully support the training of grain sales professionals in colleges and universities, actively cultivate new-generation grain sellers, and greatly encourage people with higher levels of education to engage in grain sales. Meanwhile, education and publicity are also helpful in reducing grain loss. It requires calling on the active participation of the whole society to reduce grain loss.
Acknowledgments
This work was supported by the 2015 special project on nonprofit grain industry research, “Research on Investigation and Assessment Techniques for Post-Harvest Grain Loss and Waste” (No. 201513004-6), the Fundamental Research Funds for the Central Universities, “Food Safety Risk Management (China)” (No. 2017JDZD01), and the Fundamental Research Funds for the Central Universities, “Research on Chinese Food Safety Incidents Based on Big Data” (No. 2015JDZD01).
Author Contributions
Xiujuan Chen conceived and designed the experiments and wrote the paper; Qiuxia Zang analyzed the data; Lijie Shan contributed to the survey; Linhai Wu conceived and designed the experiments, checked the paper, and provided important suggestions for the paper.
Conflicts of Interest
The authors declare no conflict of interest.
References
- Wu, J.; Zhang, J.; Wang, S.; Kong, F. Assessment of Food Security in China: A New Perspective Based on Production-Consumption Coordination. Sustainability 2016, 8, 183. [Google Scholar] [CrossRef]
- Population Reference Bureau. World Population Data Sheet; PRB: Washington, DC, USA, 2012. [Google Scholar]
- Anderson, K.; Strutt, A. Food security policy options for China: Lessons from other countries. Food Policy 2014, 49, 50–58. [Google Scholar] [CrossRef]
- Jiao, X.; Lyu, Y.; Wu, X.; Li, H.; Cheng, L.; Zhang, C.; Yuan, L.; Jiang, R.; Jiang, B.; Zed, R.; Zhang, F.; William, D. Grain production versus resource and environmental costs: towards increasing sustainability of nutrient use in China. J. Exp. Bot. 2016, 67, 4935–4949. [Google Scholar] [CrossRef] [PubMed]
- Liu, J.; Folberth, C.; Yang, H.; Röckström, J.; Abbaspour, K.; Zehnder, A.J.B.A. Global and Spatially Explicit Assessment of Climate Change Impacts on Crop Production and Consumptive Water Use. PLoS ONE 2013, 8, e57750. [Google Scholar]
- Aulakh, J.; Regmi, A. Post-Harvest Food Losses Estimation-Development of Consistent Methodology. In Proceedings of the Agricultural & Applied Economics Association’s 2013 AAEA & CAES Joint Annual Meeting, Washington, DC, USA, 4–6 August 2013. [Google Scholar]
- Huang, J.; Wang, X.; Dang, H. Impacts of and attitudes toward GM technology in China: Challenges, policy and research implications. China Agric. Econ. Rev. 2017, 9, 334–339. [Google Scholar] [CrossRef]
- Forecast of Chinese Grain Demand and Supply Gap. Available online: http://www.grainnet.cn/zt/forecast.html (accessed on 12 October 2017).
- Guo, Y.Z.; Chen, R.; Guo, J.L. Analysis and countermeasure of the grain loss in the whole industry chain from field to table. Agric. Econ. 2014, 1, 23–24. (In Chinese) [Google Scholar]
- Boxall, R.A. A Critical Review of the Methodology for Assessing Farm-Level Grain Losses after Harvest (G191); Nature Resource Institute, University of Greenwich: London, UK, 1986; ISBN 0 85954-208-4. Available online: http://gala.gre.ac.uk/10793 (accessed on 18 August 2016).
- Song, H.Y.; Zhang, H.C.; Li, J.; Wu, Z.G. Loss of Harvest of China's Grain—A Case Study of Wheat in Henan Province. J. Huazhong Agric. Univ. (Social Sciences Edition) 2015, 4, 1–6. (In Chinese) [Google Scholar]
- Wu, L.H.; Hu, Q.P.; Wang, J.H.; Zhu, D. Empirical analysis of the main factors influencing rice harvest losses based on sampling survey data of ten provinces in China. China Agric. Econ. Rev. 2017, 9, 287–302. [Google Scholar] [CrossRef]
- Food and Agriculture Organization of the United Nations (FAO). Global Food Losses and Food Waste—Extent, Causes and Prevention; Food and Agriculture Organization of the United Nations: Rome, Italy, 2011. [Google Scholar]
- Tefera, T.; Kanampiu, F.; De Groote, H.; Hellin, J.; Mugo, S.; Kimenju, S.; Beyene, Y.; Boddupalli, P.M.; Shiferaw, B.; Banziger, M. The metal silo: An effective grain storage technology for reducing post-harvest insect and pathogen losses in maize while improving smallholder farmers’ food security in developing countries. Crop Prot. 2011, 30, 240–245. [Google Scholar] [CrossRef]
- Mutambuki, K.; Ngatia, C.M.; Mbugua, J.N. Post-Harvest Technology Transfer to Reduce on Farm Grain Losses in Kitui District, Kenya. J. Agric. Sci. Tech. B 2011, 1, 392–399. [Google Scholar]
- Mendoza, J.R.; Sabillón, L.; Martinez, W.; Campabadal, C.; Hallen-Adams, H.E.; Bianchini, A. Traditional maize post-harvest management practices amongst smallholder farmers in Guatemala. J. Stored Prod. Res. 2017, 71, 14–21. [Google Scholar] [CrossRef]
- Kitinoja, L.; Saran, S.; Roy, S.K.; Kader, A.A. Postharvest technology for developing countries: Challenges and opportunities in research, outreach and advocacy. J. Sci. Food Agric. 2011, 91, 597–603. [Google Scholar] [CrossRef] [PubMed]
- Kaminski, J.; Christiaensen, L. Post-harvest loss in sub-Saharan Africa—What do farmers say? Glob. Food Secur. 2014, 3, 149–158. [Google Scholar] [CrossRef]
- Premanandh, J. Factors affecting food security and contribution of modern technologies in food sustainability. J. Sci. Food Agric. 2011, 91, 2707–2714. [Google Scholar] [CrossRef] [PubMed]
- Koester, U. Food Loss and Waste as an Economic and Policy Problem. Intereconomics 2014, 49, 348–354. [Google Scholar] [CrossRef]
- An, X.Y.; Liu, C.R.; Cao, D.J.; Cai, W. Discussion on the management of machinery and equipment in the process of grain warehousing in pingfang warehouse. Cereal Food Ind. 2012, 4, 44–47. (In Chinese) [Google Scholar]
- Qin, F.; Li, X.D.; Lv, X.Y.; Lu, X.H. Study on cost and benefit of wheat industry chain of Henan. Issues Agric. Econ. 2008, 5, 13–19. (In Chinese) [Google Scholar]
- Mishra, A.; Prabuthas, P.; Mishra, H.N. Grain storage: methods and measurements. Qual. Assur. Saf. Crop Foods 2012, 4, 144. [Google Scholar] [CrossRef]
- Munesue, Y.; Masui, T.; Fushima, T. The effects of reducing food losses and food waste on global food insecurity, natural resources, and greenhouse gas emissions. Environ. Econ. Policy Stud. 2015, 17, 43–77. [Google Scholar] [CrossRef]
- Paragyropoulou, E.; Lozano, R.; Steinberger, J.K.; Nigel, W.; Zaini bin, U. The food waste hierarchy as a framework for the management of food surplus and food waste. J. Clean. Prod. 2014, 76, 106–115. [Google Scholar] [CrossRef]
- Thyberg, K.L.; Tonjes, D.J. Drivers of food waste and their implications for sustainable policy development. Resour. Conserv. Recycl. 2016, 106, 110–123. [Google Scholar] [CrossRef]
- Wooldridge, J.M. Introductory Econometrics: A Modern Approach; South-Western College Publishing: Cincinnati, OH, USA, 2000. [Google Scholar]
- Mena, C.; Adenso-Diaz, B.; Yurt, O. The causes of food waste in the supplier–retailer interface: Evidences from the UK and Spain. Resour. Conserv. Recycl. 2011, 55, 648–658. [Google Scholar] [CrossRef]
- Beretta, C.; Stoessel, F.; Baier, U.; Hellwega, S. Quantifying food losses and the potential for reduction in Switzerland. Waste Manag. 2013, 33, 764–773. [Google Scholar] [CrossRef] [PubMed]
- Giuseppe, A.; Mario, E.; Cinzia, M. Economic benefits from food recovery at the retail stage: An application to Italian food chains. Waste Manag. 2014, 34, 1306–1316. [Google Scholar] [CrossRef] [PubMed]
- Minnich, D.; Maier, F.H. Supply Chain Responsiveness and Efficiency–Complementing or Contradicting Each Other? In Proceedings of the 24th International Conference of the System Dynamics Society, Nijmegen, The Netherlands, 23–27 July 2006.
- Sun, H. Characteristics and control techniques of condensation of banker storage. J. Henan Univ. Technol. 2014, 3, 75–78. (In Chinese) [Google Scholar]
- Zhang, W.; Song, H. Causes and control methods of condensation during grain storage. J. Agric. Mech. R. 2003, 3, 162. (In Chinese) [Google Scholar]
Figure 1.
A diagram of China’s current major grain sellers and selling channels in the post-harvest period.
Figure 1.
A diagram of China’s current major grain sellers and selling channels in the post-harvest period.

Figure 2.
Illustration of the study region. Note: This is merely a schematic diagram and does not cover the issue of territorial sovereignty.
Figure 2.
Illustration of the study region. Note: This is merely a schematic diagram and does not cover the issue of territorial sovereignty.
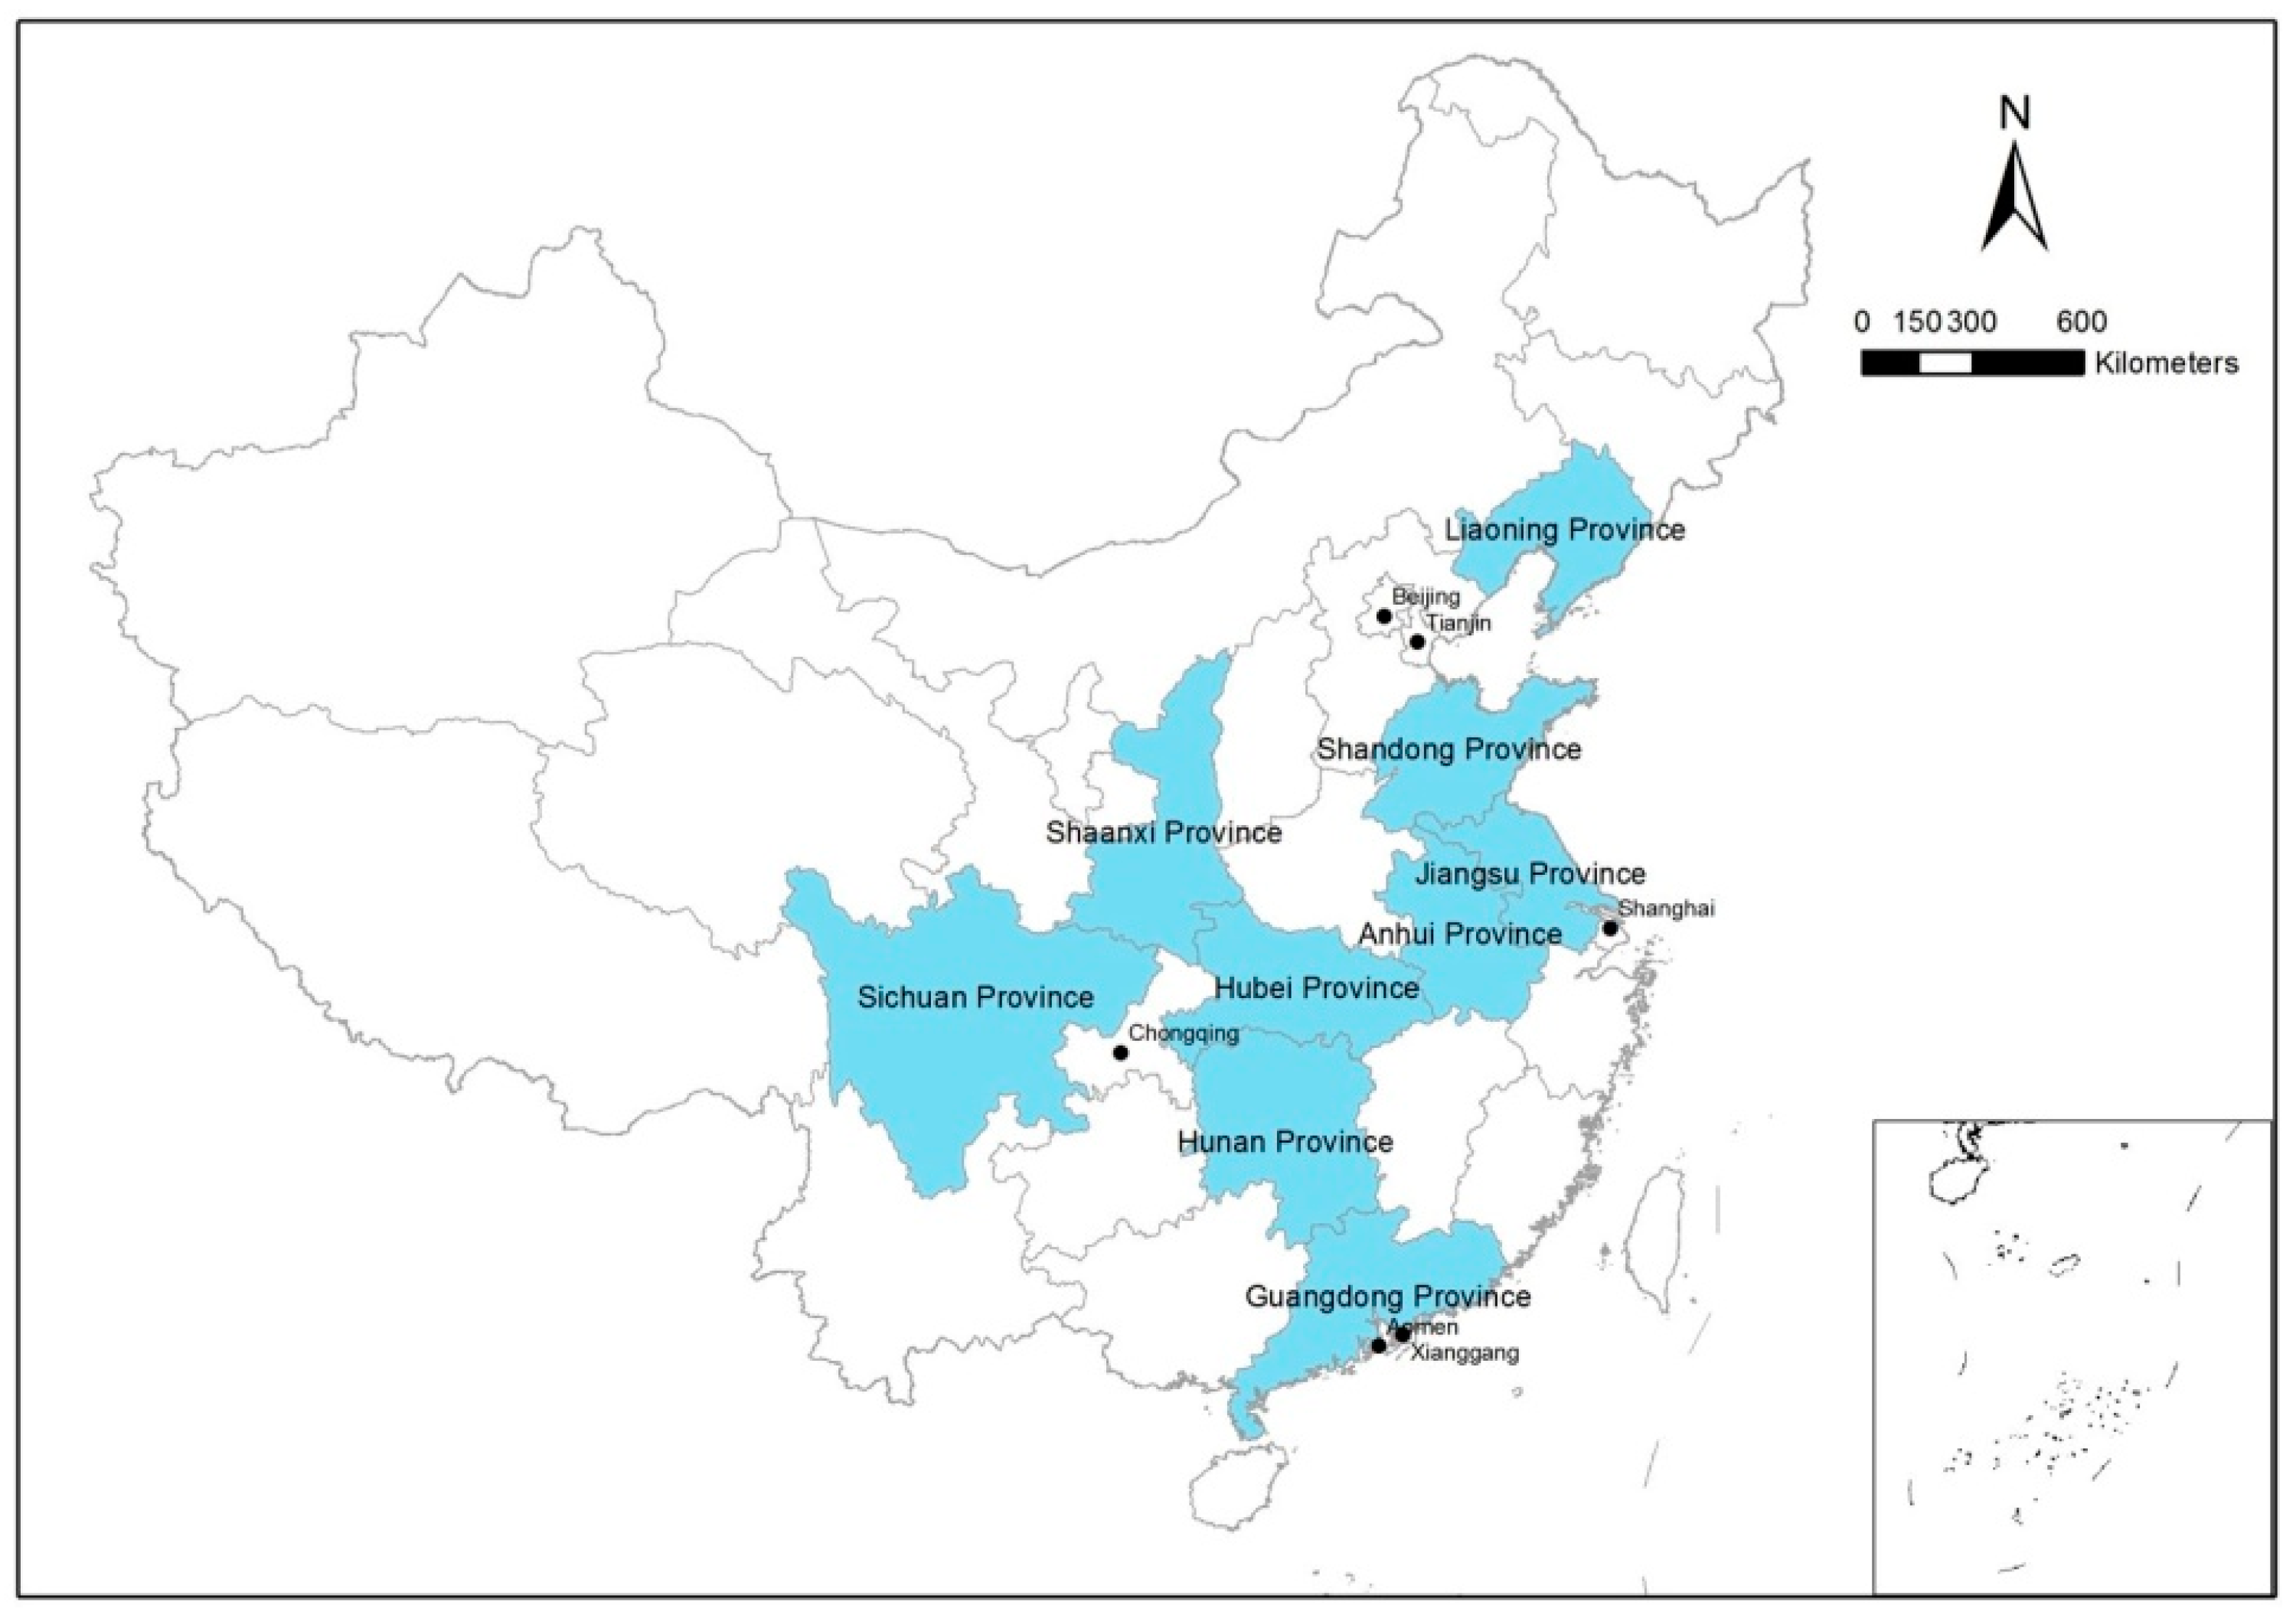
Figure 3.
Histogram of grain loss ratio (Y axis: frequency).
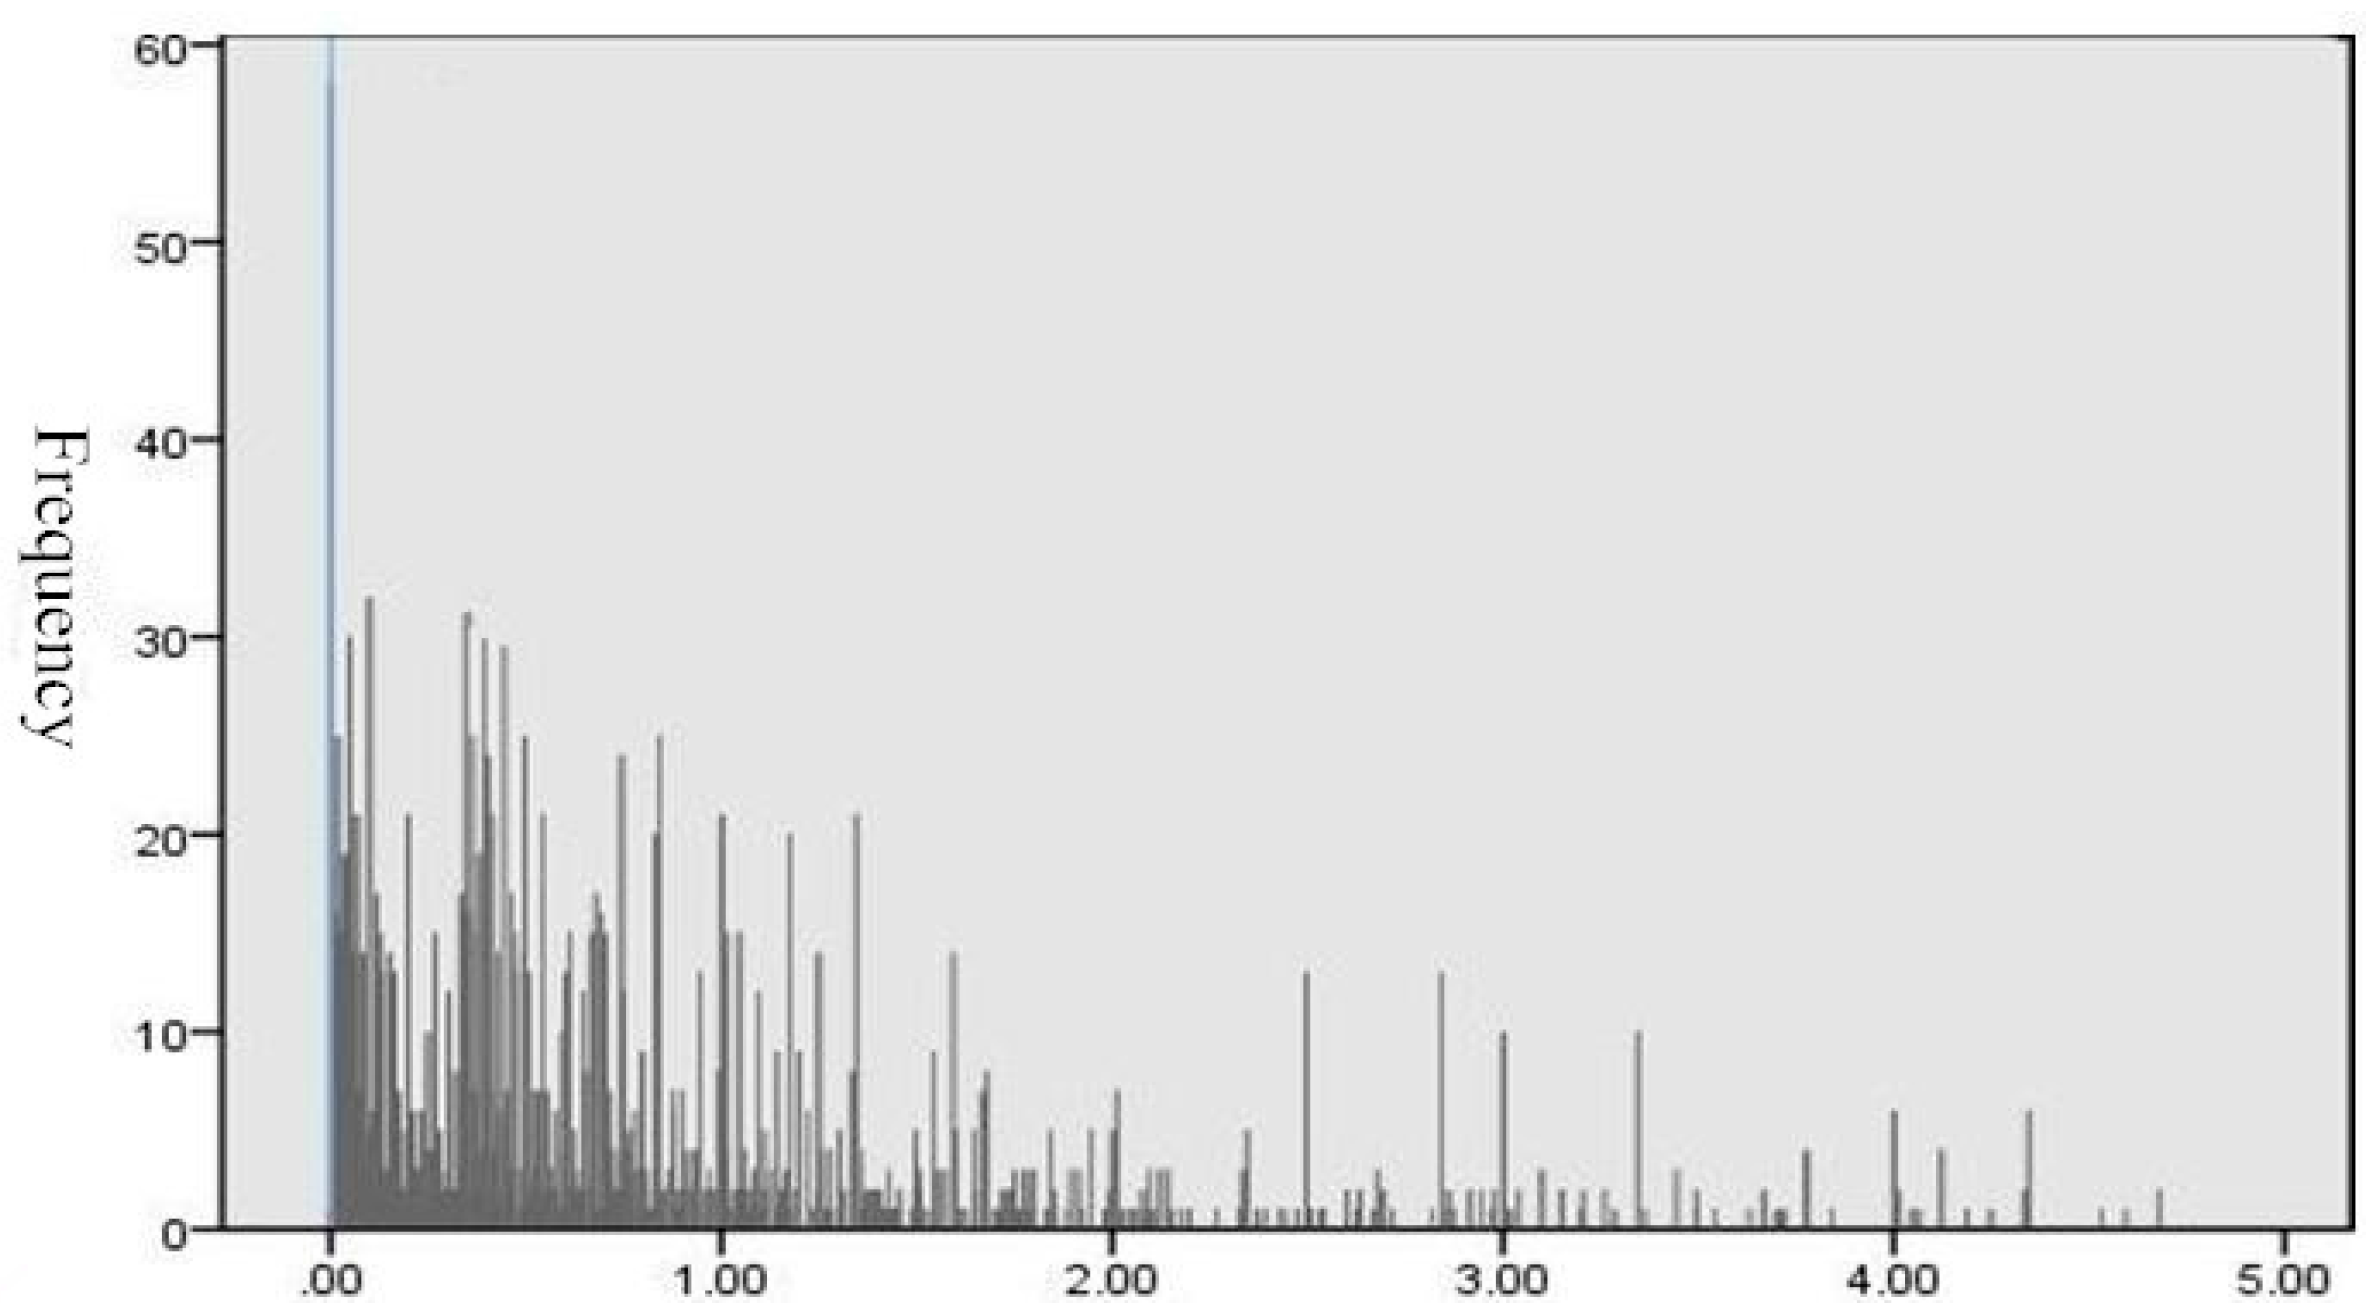
Figure 4.
Truncated normal distribution.

Table 1.
Basic statistical characteristics of the grain sellers interviewed.
| Characteristic | Characteristic Categories | Count | Percentage (%) |
|---|---|---|---|
| Gender | Male | 863 | 51.93 |
| Female | 799 | 48.07 | |
| Age | ≤25 years old | 65 | 3.91 |
| 26–35 years old | 397 | 23.89 | |
| 36–45 years old | 675 | 40.61 | |
| 46–55 years old ≥56 years old | 428 97 | 25.75 5.84 | |
| Education | Primary school and lower | 267 | 16.06 |
| Junior high school | 743 | 44.71 | |
| High school or vocational school | 473 | 28.46 | |
| Junior college | 116 | 6.98 | |
| Undergraduate and higher | 63 | 3.79 | |
| Years of working | ≤2 years | 145 | 8.72 |
| 3–5 years | 394 | 23.71 | |
| 6–10 years | 552 | 33.21 | |
| 11–15 years | 319 | 19.19 | |
| ≥16 years | 252 | 15.16 | |
| Shop size | ≤20 m2 | 160 | 9.63 |
| 20–50 m2 | 780 | 46.93 | |
| 50–100 m2 | 429 | 25.81 | |
| 100–200 m2 | 172 | 10.35 | |
| 200–500 m2 | 62 | 3.73 | |
| ≥500 m2 | 59 | 3.55 | |
| Annual revenue (RMB) | ≤100,000 | 328 | 19.73 |
| 100,000–500,000 | 706 | 42.48 | |
| 500,000–1,000,000 | 224 | 13.48 | |
| 1,000,000–2,000,000 | 155 | 9.33 | |
| 2,000,000–5,000,000 | 98 | 5.89 | |
| 5,000,000–8,000,000 | 101 | 6.08 | |
| ≥8,000,000 | 50 | 3.01 |
Table 2.
Factors that affect the extent of grain loss at different steps of grain sales.
| Grain Sales Step | Factors | Limited Impact (%) | Relatively Little Impact (%) | Medium Impact (%) | Relatively Important Impact (%) | Significant Impact (%) |
|---|---|---|---|---|---|---|
| Transportation | Loading and unloading methods | 40.07 | 30.93 | 19.68 | 8.00 | 1.32 |
| Handling of tools | 40.55 | 30.21 | 19.92 | 8.18 | 1.14 | |
| Packaging quality | 21.06 | 24.79 | 24.49 | 22.98 | 6.68 | |
| Weather conditions | 6.98 | 18.77 | 24.49 | 36.16 | 13.60 | |
| Storage | Storage equipment conditions | 8.00 | 13.36 | 31.29 | 35.68 | 11.67 |
| Ventilation, humid and hot conditions | 6.62 | 13.78 | 21.54 | 42.18 | 15.88 | |
| Mold contamination | 10.65 | 16.19 | 20.22 | 33.21 | 19.73 | |
| Display and sales | Grain display | 40.01 | 32.37 | 18.71 | 6.68 | 2.23 |
| Shelf life | 29.18 | 28.64 | 21.78 | 14.44 | 5.96 |
Table 3.
Definitions and types of variables.
| Variable | Definitions and Assigned Values | Mean | Mode | Standard Deviation | |
|---|---|---|---|---|---|
| Grain loss ratio (Y) | Continuous variable; specific grain loss ratio (%) | 0.53 | 0.00 | 1.02 | |
| Individual characteristics of grain sellers | Gender (X1) | Discrete variable; male = 1, female = 0 | 0.52 | 1 | 0.50 |
| Age (X2) | Continuous variable; actual age (years old) | 41.89 | 41.5 | 8.51 | |
| Education level (X3) | Continuous variable (years old); specific education length (years) | 10.07 | 9 | 2.71 | |
| Years of working (X4) | Continuous variable; specific employment length (years) | 8.70 | 8 | 4.58 | |
| Management characteristics of grain sellers | Separation of sales shops and warehouses (X5) | Discrete variable; yes = 1, no = 0 | 0.36 | 0 | 0.48 |
| Equipment level (X6) | Continuous variable; amount of equipment investment (10,000 RMB) | 5.63 | 3.0 | 8.00 | |
| Grain storage conditions (X7) | Dummy variable (no or little equipment = 0, otherwise = 1) | 0.55 | 1 | 0.50 | |
| External factors | Supply and management level of public facilities (X8) | Dummy variable (lack of management = 0, otherwise = 1) | 0.59 | 1 | 0.49 |
| Seasonal factors: spring season (X9) | Discrete variable; whether spring is the worst season for grain loss (yes = 1, no = 0) | 0.08 | 0 | 0.27 | |
| Seasonal factors: summer season (X10) | Discrete variable; whether summer is the worst season for grain loss (yes = 1, no = 0) | 0.87 | 1 | 0.33 | |
| Seasonal factors: fall season (X11) | Discrete variable; whether fall is the worst season for grain loss (yes = 1, no = 0) | 0.03 | 0 | 0.18 | |
| Government policy support for grain market (X12) | Dummy variable (little = 0, otherwise = 1) | 0.28 | 0 | 0.45 | |
Note: Mode refers to the most frequently occurring value in a set of data.
Table 4.
Examination of the main influencing factors on grain loss at the sales stage based on the Tobit regression model.
Table 4.
Examination of the main influencing factors on grain loss at the sales stage based on the Tobit regression model.
| Variable | Coefficient | Standard Error | t Value | p Value |
|---|---|---|---|---|
| Gender (X1) | −0.065 | 0.050 | –1.320 | 0.188 |
| Age (X2) | 0.009 ** | 0.003 | 2.980 | 0.003 |
| Education level (X3) | –0.033 ** | 0.010 | –3.330 | 0.001 |
| Years of working (X4) | –0.023 ** | 0.006 | –4.020 | 0.000 |
| Separation of sales shops and warehouses (X5) | 0.188 ** | 0.054 | 3.520 | 0.000 |
| Equipment level (X6) | 0.005 | 0.053 | 1.660 | 0.096 |
| Grain storage conditions (X7) | –0.171 ** | 0.052 | –3.300 | 0.001 |
| Supply and management level of public facilities (X8) | –0.183 ** | 0. 052 | –3.550 | 0.000 |
| Spring season (X9) | 0.008 | 0.219 | –0.040 | 0.972 |
| Summer season (X10) | –0.101 | 0.202 | –0.500 | 0.619 |
| Fall season (X11) | 1.019 ** | 0.242 | 4.220 | 0.000 |
| Government policy support for grain market (X12) | 0.061 | 0.056 | 1.090 | 0.275 |
| _cons | 0.821 | 0.273 | 3.000 | 0.003 |
| Likelihood function value, Log likelihood = –2321.535 | ||||
| Overall significance, LR chi2 (12) = 144.200 | ||||
Note: ** for p < 0.01.
© 2018 by the authors. Licensee MDPI, Basel, Switzerland. This article is an open access article distributed under the terms and conditions of the Creative Commons Attribution (CC BY) license (http://creativecommons.org/licenses/by/4.0/).
Share and Cite
MDPI and ACS Style
Chen, X.; Wu, L.; Shan, L.; Zang, Q. Main Factors Affecting Post-Harvest Grain Loss during the Sales Process: A Survey in Nine Provinces of China. Sustainability 2018, 10, 661. https://doi.org/10.3390/su10030661
AMA Style
Chen X, Wu L, Shan L, Zang Q. Main Factors Affecting Post-Harvest Grain Loss during the Sales Process: A Survey in Nine Provinces of China. Sustainability. 2018; 10(3):661. https://doi.org/10.3390/su10030661
Chicago/Turabian StyleChen, Xiujuan, Linhai Wu, Lijie Shan, and Qiuxia Zang. 2018. "Main Factors Affecting Post-Harvest Grain Loss during the Sales Process: A Survey in Nine Provinces of China" Sustainability 10, no. 3: 661. https://doi.org/10.3390/su10030661
Note that from the first issue of 2016, this journal uses article numbers instead of page numbers. See further details here.