Article

Manufacturing Decisions and Government Subsidies for Electric Vehicles in China: A Maximal Social Welfare Perspective

1
College of Transportation and Civil Engineering, Fujian Agriculture and Forestry University, Fuzhou 350002, China
2
School of Economics and Management, Fuzhou University, Fuzhou 350002, China
3
College of Management Engineering, Anhui Polytechnic University, Wuhu 241000, China
4
Departamento de Ingeniería Mecánica y de Materiales (DIMM), Universitat Politècnica de València, Camino de Vera s/n, 46022 Valencia, Spain
5
School of Business, Ningbo University, Ningbo 315211, China
*
Authors to whom correspondence should be addressed.
Sustainability 2018, 10(3), 672; https://doi.org/10.3390/su10030672
Submission received: 16 January 2018 / Revised: 16 February 2018 / Accepted: 26 February 2018 / Published: 1 March 2018
(This article belongs to the Special Issue Transition from China-Made to China-Innovation )

Abstract

:
In order to address challenges in the sustainable development of transportation, economy, and environment, governments of China and conventional automobile manufacturers are extremely concerned about the development of the electric vehicle (EV) manufacturing industry and market. However, owing to the limitations of EVs and the government economic policies on decreasing subsidies in China, many manufacturers are worried about entering the EV market. Given the low consumer preference for EVs, using a leader-follower Stackelberg game model, we investigate the impact of government a subsidy on the optimal production and pricing decisions of an auto manufacturer who could produce both EVs and conventional vehicles. We characterize whether/under what conditions the manufacturer’s decision to offer EV products under government subsidy, whilst increasing its profits (a win-win situation). On the policy side, we delineate how government a subsidy can be set to realize the inherent economic, environmental, and social benefits of EV production (the triple win of EV production). We further investigate the impact of EV manufacturing- and society-related factors on the balance among manufacturer profits, environmental impact and social welfare. This study also finds that the adoption of EVs is not bound to be beneficial for the environment.

1. Introduction

Nowadays, given the global trend towards environmental sustainability [1], electric vehicle (EV) has been recognized as a promising means to reduce dependence on petroleum fuel and carbon emissions from the transportation industry [2]. For instance, EVs can lower carbon emissions by 30–50% and improve fuel efficiency by 40–60%, on average [3]. Scholars and environmentalists regard EVs as a generic cure for many environmental issues of China, such as urban smog and energy crisis [4]. In China, governments has put forward the strategy of “Energy Saving and Electric Vehicles”, and almost all of the major car manufacturers are demonstrating their interest in EVs [5]. However, owing to the early stage of EV development in China, there are significant gaps between consumer expectations and EV performance, such as limited driving range, high purchasing price, long charging time, and insufficient charging stations, which will limit market size and result in automobile manufacturers hesitating to enter the EV market [6,7].
To tackle the disadvantages of EVs and to promote the EV adoption, governments of China have implemented a series of policy measures, including macroscopic demonstration policy, financial subsidy policy, preference tax policy, technical support policy and infrastructure policy, and so on. In fact, most consumers in China are concerned with the EV purchasing price which is significantly higher than conventional vehicles. Zhang et al. [8] argue that in China, the high purchase price is a major barrier to promote EVs. Therefore, acting as a primary economic supporting policy, financial subsidies for EVs are highlighted and are widely provided by central or local governments of China (see Table 1). As investigated by Li et al. [9] and Li et al. [10], the financial incentive policy measures have had a positive impact on encouraging automobile manufacturers to launch EVs manufacturing plans and increasing consumer acceptance of EVs. However, it should be pointed out that the characteristic of the EV industry in developing countries like China is distinctly different from that in developed countries. Albeit a hefty government subsidy, low environment preference results in consumers’ less willingness to pay for EVs than conventional vehicles, such that automobile manufacturers cannot expect great returns from EVs manufacturing activities. In order to achieve the maximal social welfare, consumer surplus and enterprise profitability, as well as the aforesaid environmental issues must be taken into account by governments. In other words, government should set reasonable subsidies to induce auto manufacturers to offer EVs, only if EV production enhances economic, environmental and social benefits (referred to as the triple win for remanufacturing) in the community. However, even well-intentioned economic initiatives harnessed to decrease vehicles’ external cost to the environment and promote efficiency can have negative effects if not carefully structured and managed [11]. Also, owing to fiscal limitations, our first main research objective is to delineate how a proper subsidy or subsidy range can be set for EV adoption in their infancy to realize the social, economic and environmental benefits of EV production, which is a significant concern for government at all level in China.
On the other hand, despite various government subsidies which have attracted an increasing number of enterprises to invest in EV production, new market entrants continue to face some challenges and barriers [5]. In particular, how to make decisions regarding EV production strategies under subsidy policies is a primary challenge for conventional automobile manufacturers, owing to the following three aspects:
First, the EV market is still at its infancy and thus consumer acceptance is highly uncertain. According to the statistics of China Association of Automobile Manufacturers (CAAM), while the total number of vehicle sales was 28.87 million by the end of 2017, the number of EV sales was only 468,000 by the end of the same year [13]. Therefore, it is evident that the EV market in China is facing the dilemma of “hot policy”, but “cold market” [9].
Second, EV promotions are so dependent on finance policy support in China that their governments decide to gradually decrease the subsidies of EVs in order to convert the subsidies-oriented EV market to a market-oriented one [14,15]. It also can be seen in Table 1 that the subsidies provided by governments of China in 2017 are significantly lower than those in 2016. The probable fall in EV sales in the event that subsidies decrease may weaken an enterprise initiative of developing EVs.
Finally, currently, it is impossible for most automobile manufacturers of China to shift completely from gasoline vehicle (GV) production to EV production, owing to the tremendous scale of the GV market and the heavy upfront investment in GV production. Auto manufacturers firmly believe that EV production would cannibalize the market for their GV sales. For an auto manufacturer, to offer EV products, it should not only yield environmental benefits, but also economic revenue. An EV production strategy is affected by these internal constraints, which may complicate the automobile manufacturer’s production decision. Thus, our second main research objective is to examine whether/when the EV production decision improves the social welfare under government subsidy incentive, whilst increasing its overall profits.
Our aforesaid objectives translate into the following research questions:
  • How effective is the government subsidy for EV consumers to transfer internal and external savings to the auto industry?
  • What are the impacts of EV manufacturing-related factors on the economics of EV production (i.e., production quantities and prices of GVs and EVs) under the government subsidy?
  • Under the government subsidy, what is the degree of the cannibalization from EV production? How does the cannibalization influence the overall economic and environmental performances?
  • What is the optimal subsidy to realize the maximization of social welfare which EV production offers? If the optimal subsidy does not exist, is there a feasible range of subsidies that we can explore?
To answer those questions, we consider a leader-follower Stackelberg game a welfare-maximizing policymaker and a profit-maximizing auto manufacturer, where consumers are heterogeneous in their willingness-to-pay (WTP) and value EV products less then GV product. In line with the technology roadmap (see Figure 1), we examine two distinct cases: (1) No EV production case; and, (2) EV production case. For the former, the auto manufacturer does not invest in EV production and offers just GV products. For the latter, the manufacturer offers both EV and GV products. We compare the economic, social and environmental performance of EV production under these two cases and derive the optimal EV production decisions from the comparative analysis.
The remainder of this paper is organized as follows. Section 2 reviews the related literature. Section 3 describes our model with notations and assumptions. Section 4 presents the optimal decisions of and the equilibrium analysis for the manufacturer, and Section 5 presents the optimal decisions of and the equilibrium analysis for the government. Section 6 presents numerical experiments, which are followed by the conclusion and implications in Section 7. All the proofs of our paper are provided in the Appendix A, Appendix B, Appendix C, Appendix D, Appendix E, Appendix F, Appendix G, Appendix H, Appendix I and Appendix J.

2. Literature Review

Since our research objectives are to delineate how to optimize EV production decision and how government subsidy policy can be instituted to realize the social, economic and environmental benefits of EV adoption, this section intends to map the development in the area of EV literature through Triple Bottom Line (TBL) framework [16]. EV production and adoption is generally recognized as sustainable or green initiatives are based on primarily on three dimensions: Economic, Environment and Society (popularly termed as TBL) [16]. In line with the TBL framework, the analysis of papers highlights EV adoption impact on three main performance types:
  • Environmental performance: concerning C O 2 emissions (i.e., the emission of carbon dioxide), oil and other fossil fuel consumption [17] and GHG (greenhouse gas) emissions [18].
  • Economic performance: the achievement of economic objectives (e.g., cost reduction, increase in revenues) [19] and the impact of government policy and regulation on economic performance [20].
  • Social performance: concerning consumers’ willingness to pay (WTP) for EVs. Specifically, these papers aim to explore the factors influencing the consumer’s acceptance of EVs or maximize consumers’ utility under three possible scenarios (i.e., high, uncertain or low WTP).
Table 2 shows that eight papers selected focus on environmental performance including 2 review papers which provide a comprehensive overview on this topic; 9 papers selected concerns economic performance; eight papers selected deal with social performance including a review paper; only three papers take all of the three level performances into consideration, which are closely related to our paper.
As for the papers dealing with environmental performance, Rolim et al. [21] carry out a case study to estimate EV user’s energy consumption and C O 2 emissions, and found that EV revealed considerable reductions in both of them. Hawkins et al. [22] reviewed many EV studies and concluded that EVs using electricity from sources with lower Global Warming Potentials were better than GVs. Then, a similar conclusion was obtained in a comparative life cycle assessment, which indicated that it was counterproductive to promote EVs in regions where electricity is produced from oil, coal and lignite combustion [23]. He and Chen [24] designed and examined five scenarios which assess EVs or hybrid vehicles to estimate the potentials for reducing consumption and emission. They found that significant energy savings and emissions reduction can be achieved by promoting EVs. According to Garcia and Freire [25], life-cycle assessment is generally applied to assess and compare the environmental impact of EVs, such that they presented a critical review of the literature addressing fleet-based life-cycle approaches and analyzed the key aspects underlying environmental and energy impacts of EVs. Ma et al. [26] conducted a quantitative analysis of such EVs being promoted in Beijing as electric taxis, electric buses, electric sanitation trucks and rental EVs, based on which they forecast the EV performance in terms of energy conservation and emission reduction. Beside the impact on environmental performance, Faria et al. [27] presents an environmental and an economic Life-Cycle Assessments for GV and EV technologies. Their study shows that EV can be more sustainable from an environmental and economic perspective. Chatzikomis et al. [28] quantified the environmental and economic effects of generalized introduction and the use of electric vehicles in Greece and presented the effect of market penetration by EV and the resulting benefit on energy cost and Green House gas. Shafiei et al. [29] implemented a simulation comparative analysis and found that banning both GVs and hybrid electric vehicles could improve the environmental performance in New Zealand. Fernández [30] proposed a new approach for assessing EVs’ influence on greenhouse gas emissions and found that EVs could contribute well to C O 2 reduction. Using a diffusion model, Sgouridis et al. [31] predict that a 5% diffusion of EVs by 2030 will result in a reduction of 517,000 tones of C O 2 . Kiani [32] recorded 6.7–8.4% emission differential with only 5% market penetration of EVs in United Arab Emirates, which indicates the overall impact of EV on pollution statistics. Braun and Rid [33] linked driving pattern factors and the specific energy use of EVs and find that there exists a significant correlation between them. Concerning the EV environmental performance in China, most of the studies conduct empirical research and stimulation modeling to indicate and predict the reduction of tailpipe emissions that are caused by EV adoption [34,35], but pollutant emission is still much higher than that in developed countries [36]. A few scholars find that there is no significant difference between the external environmental performance of EV and GV [37,38]. In summary, most papers show that EVs adoption positively influence on environmental performance, yet highlight that emission reduction is very dependent on some underlying factors, such as electricity source, fuel economy improvements, vehicle weight reduction, and so on.
As for the papers concerning economic performance, investment in eco-innovation, e.g., EVs, is specifically disincentivized because benefits from pollution levels are not included in a product’s price [39]. Specially regarding EVs, consumers looking to purchase alternative GVs do not accurately incorporate fuel economy in their vehicle purchase decisions, leading to irrational purchase behavior [40]. Therefore, there must first be enough demand with the EV niche market that manufacturers continue to develop and sell the automobiles. Consequently, governments have employed financial incentives to help attract early EV adopters [39]. Sierzchula et al. [39] found that financial incentives are statistically significant factor and socio-demographic variables e.g., education level and income were not significant after analyzing incentives on EV adoption across 30 countries. Lutsey et al. [41] analyzed the EV sales in the 25 most populous U.S. metropolitan area, concluding that Monetary incentives are significant factors in city EV share. Bjerkan et al. [42] made a survey among Norwegian EV owners and find that fiscal incentives are the most important reason to buy EV if they are sufficient high to offset cost differences between EV and conventional vehicles. Olson [43] resorted to the data that was available from lead markets for EVs and find that EV supporting public policies are primarily responsible for EV adoption in the early stage. Kontou et al. [44] proposed an optimization framework for minimizing the societal cost of replacement of GVs for EVs, and the societal cost includes operational costs and government investments. Regarding to EV performance of China, using empirical studies, many scholars indicate that consumer-oriented measures and policies including subsidies are able to significantly promote EV adoption and lower its lifecycle cost [15,45,46]. On the other hand, Diamond [47] shows that the relationship between incentive policies and EV adoption is weak in the United States (US). According to a nationwide survey that was made by Zhang, Wang, Hao, Fan and Wei [8], the moderating effect of government policies to purchase intention was not strong. Wang et al. [48] reveal that a drop in government fiscal support would not result in a significant decline of EV adoption in China. The effect of subsidy on EV adoption would be attenuated by the increase of fuel price [49]. From the manufacturers’ perspective, Kieckhäfer et al. [50] argue that manufacturers’ portfolio decisions play an significant role in the market development of EV.
Zhang [51] extended previous reference-dependence newsvendor research by incorporating both consumer trade-offs and government subsidies to evaluate the relevant influences on the optimal EV production decisions. They found that subsidies, loss aversion, the performance of both EVs, and internal combustion engine-powered vehicles and the coefficient of variation of demand to be significant factors influencing the optimal production quantity. Gu et al. [5] investigated a loss-averse EV manufacturer’s optimal production strategy under uncertain market demand in the presence of both battery recycling and government subsidy by applying the newsvendor model. They find that increased subsidy and battery recycling rate promotes the manufacturers’ optimal production quantity. Chocteau et al. [52] investigated the effect of the collaboration among commercial fleets on the adoption of EVs based on cooperative game theory.
As for the papers concerning social performance, we provide a review on the subject of EV adoption of consumers to analyze the consumers’ willingness to pay for EVs and the EV social influences. A study conducted by Junquera et al. [53] is the first analysis about the influence of consumers’ perceptions about technical specifications on their willingness to buy an EV in the Spanish market. Struben and Sterman [54], based on the generation of consumer awareness, explore the possible transition from internal combustion engines to alternative fuel vehicles and show how the transition depends on economic and behavior parameters. Ferguson et al. [55] suggested considerable openness of Canadian households to EVs. Smith et al. [56] conducted a Stated Choice survey of 440 households in Australia on consumer preferences and attitude towards EV to examine possible environmental enthusiast bias focused around EV choice. Another study also highlights that the important role of the environmental preference of EVs outweigh the price value and range confidence as for consumer purchase intentions for EVs [57]. Pettifor et al. [58] incorporating social influence effect into global integrated assessment models accelerates the adoption of EV in its early stage. She et al. [59] conducted a questionnaire survey in Tianjin, China, and found that a large proportion of respondents have no interest in EVs and hold a “wait and see” attitude instead of making adoption decisions. The potential barriers for consumers to adopt EVs include the high purchase cost, limited range, long recharge time, limited recharge availability and consumers unfamiliarity with EVs [60]. A common result across the EV adoption studies is that the consumers compare the utility of attributes of EVs and GVs when making purchasing decisions. The typical trade-offs involve purchase costs [61,62] and convenience (e.g., cruising range, charge time, and availability) [63,64]. Li et al. [65] applied fault tree analysis method to study the factors for low purchase willingness for battery electric vehicle and show that the poor professional pre-sales consulting turns to be a key factor influencing EVs purchase. Qian and Yin [66] conducted a nationwide online survey to identify the important role of Chinese cultural values in consumers’ intention to adopt EVs. Most of these studies have incorporated models of consumers’ preference to EVs or GVs wherein the models are most commonly derived from combinations of purchaser demographic data, past vehicles sales data or survey. Al-Alawi and Bradley [67] conducted a review of hybrid, plug-in hybrid, and electric vehicle market modeling studies. They found that existing studies have applied a suite of analytical and computational tools to model the consumer acceptability of EVs under a wide variety of policy and macroeconomic scenarios. They recommend that modeling of EV penetration rates should include modeling of automakers’ actions, government policy, and its effect on automotive markets.
Despite the ample literature focusing on the relationship between EV adoption and environmental, economic or social performance, as far as we know, all of the three performances have been integrated into the EV production decision in only three papers: Huang et al. [68] develop a two-stage approach to investigate the duopoly setting whereby the two supply chains (i.e., the EV and the EV-GV supply chain) compete for consumers when a government implements a subsidy incentive scheme to promote EVs sales and protect the environment. Luo et al. [69] examined a two-echelon EV supply chain under a price-discount incentive scheme. A Nash bargaining game is conducted between a manufacturer and a retailer, whereby the optimal retail price and the price-discount rate can be derived. Shao et al. [70] analyzed and compared the effectiveness of a subsidy incentive scheme and a price discount incentive scheme in two different structures (i.e., a monopoly setting and a duopoly setting). When considering the three primary stakeholders, namely the EV manufacturer, the GV manufacturer, and the government in the vehicle market, they develop non-cooperative game-theoretic models taking the consumers’ low-carbon awareness into account.
Our paper differs from the above studies in various way:
  • Regarding the papers on the evaluation of EV environmental performance, even though the authors consider some specific indexes (e.g., C O 2 emissions, energy efficiency) for measuring performance, few papers present a set of indexes integrating economic efficiency; none of the above-mentioned papers in this area incorporate social indexes into the measuring framework. Due to a different research focus, our paper reduces the complicated environmental impact to a simple exogenous variable to examine its influence on the optimal EV production decision.
  • Concerning the papers that are dealing with the EV economic performance, many papers have incorporated the government subsidy into the EV production strategy and consumers’ purchasing decision. Few papers have explored the environmental impact and the heterogeneity in consumers’ attitudes toward EVs and GVs, which are both considered in our paper.
  • As far as the literature on the EV social performance, the majority of papers conduct empirical studies on customers’ acceptance and EV market penetration rates, and seldom include automakers’ actions and government policy. Our paper involves mathematical modelling of integration of all the above elements.
  • As for the three papers considering three performances, the authors have explored the effects of the different government incentive schemes, and examined the environmental, economic, and social performances of EV production. Unlike these three studies, we have made the following innovations: first, our model investigates whether EV production must be added to GV production, rather than whether it must replace GV production. Second, we consider a utility model which allows us to capture the customers’ low WTP for EVs. This attitude reflects the general reality of China more closely than the high or uncertain WTP presented in these three papers. Third, a critical component of our model is the issue of demand cannibalization, which may result in auto manufacturers’ output reductions, which are inconsistent with the government’s initial expectation. Therefore, the EV production decision aiming at realizing the triple win (the economic, social, and environmental benefits) of EV production should involve the degree of cannibalization.
  • The environmental, economic, and social gains of EV production must be questioned based on not only on the choice of EV production, but also on the degree of cannibalization.
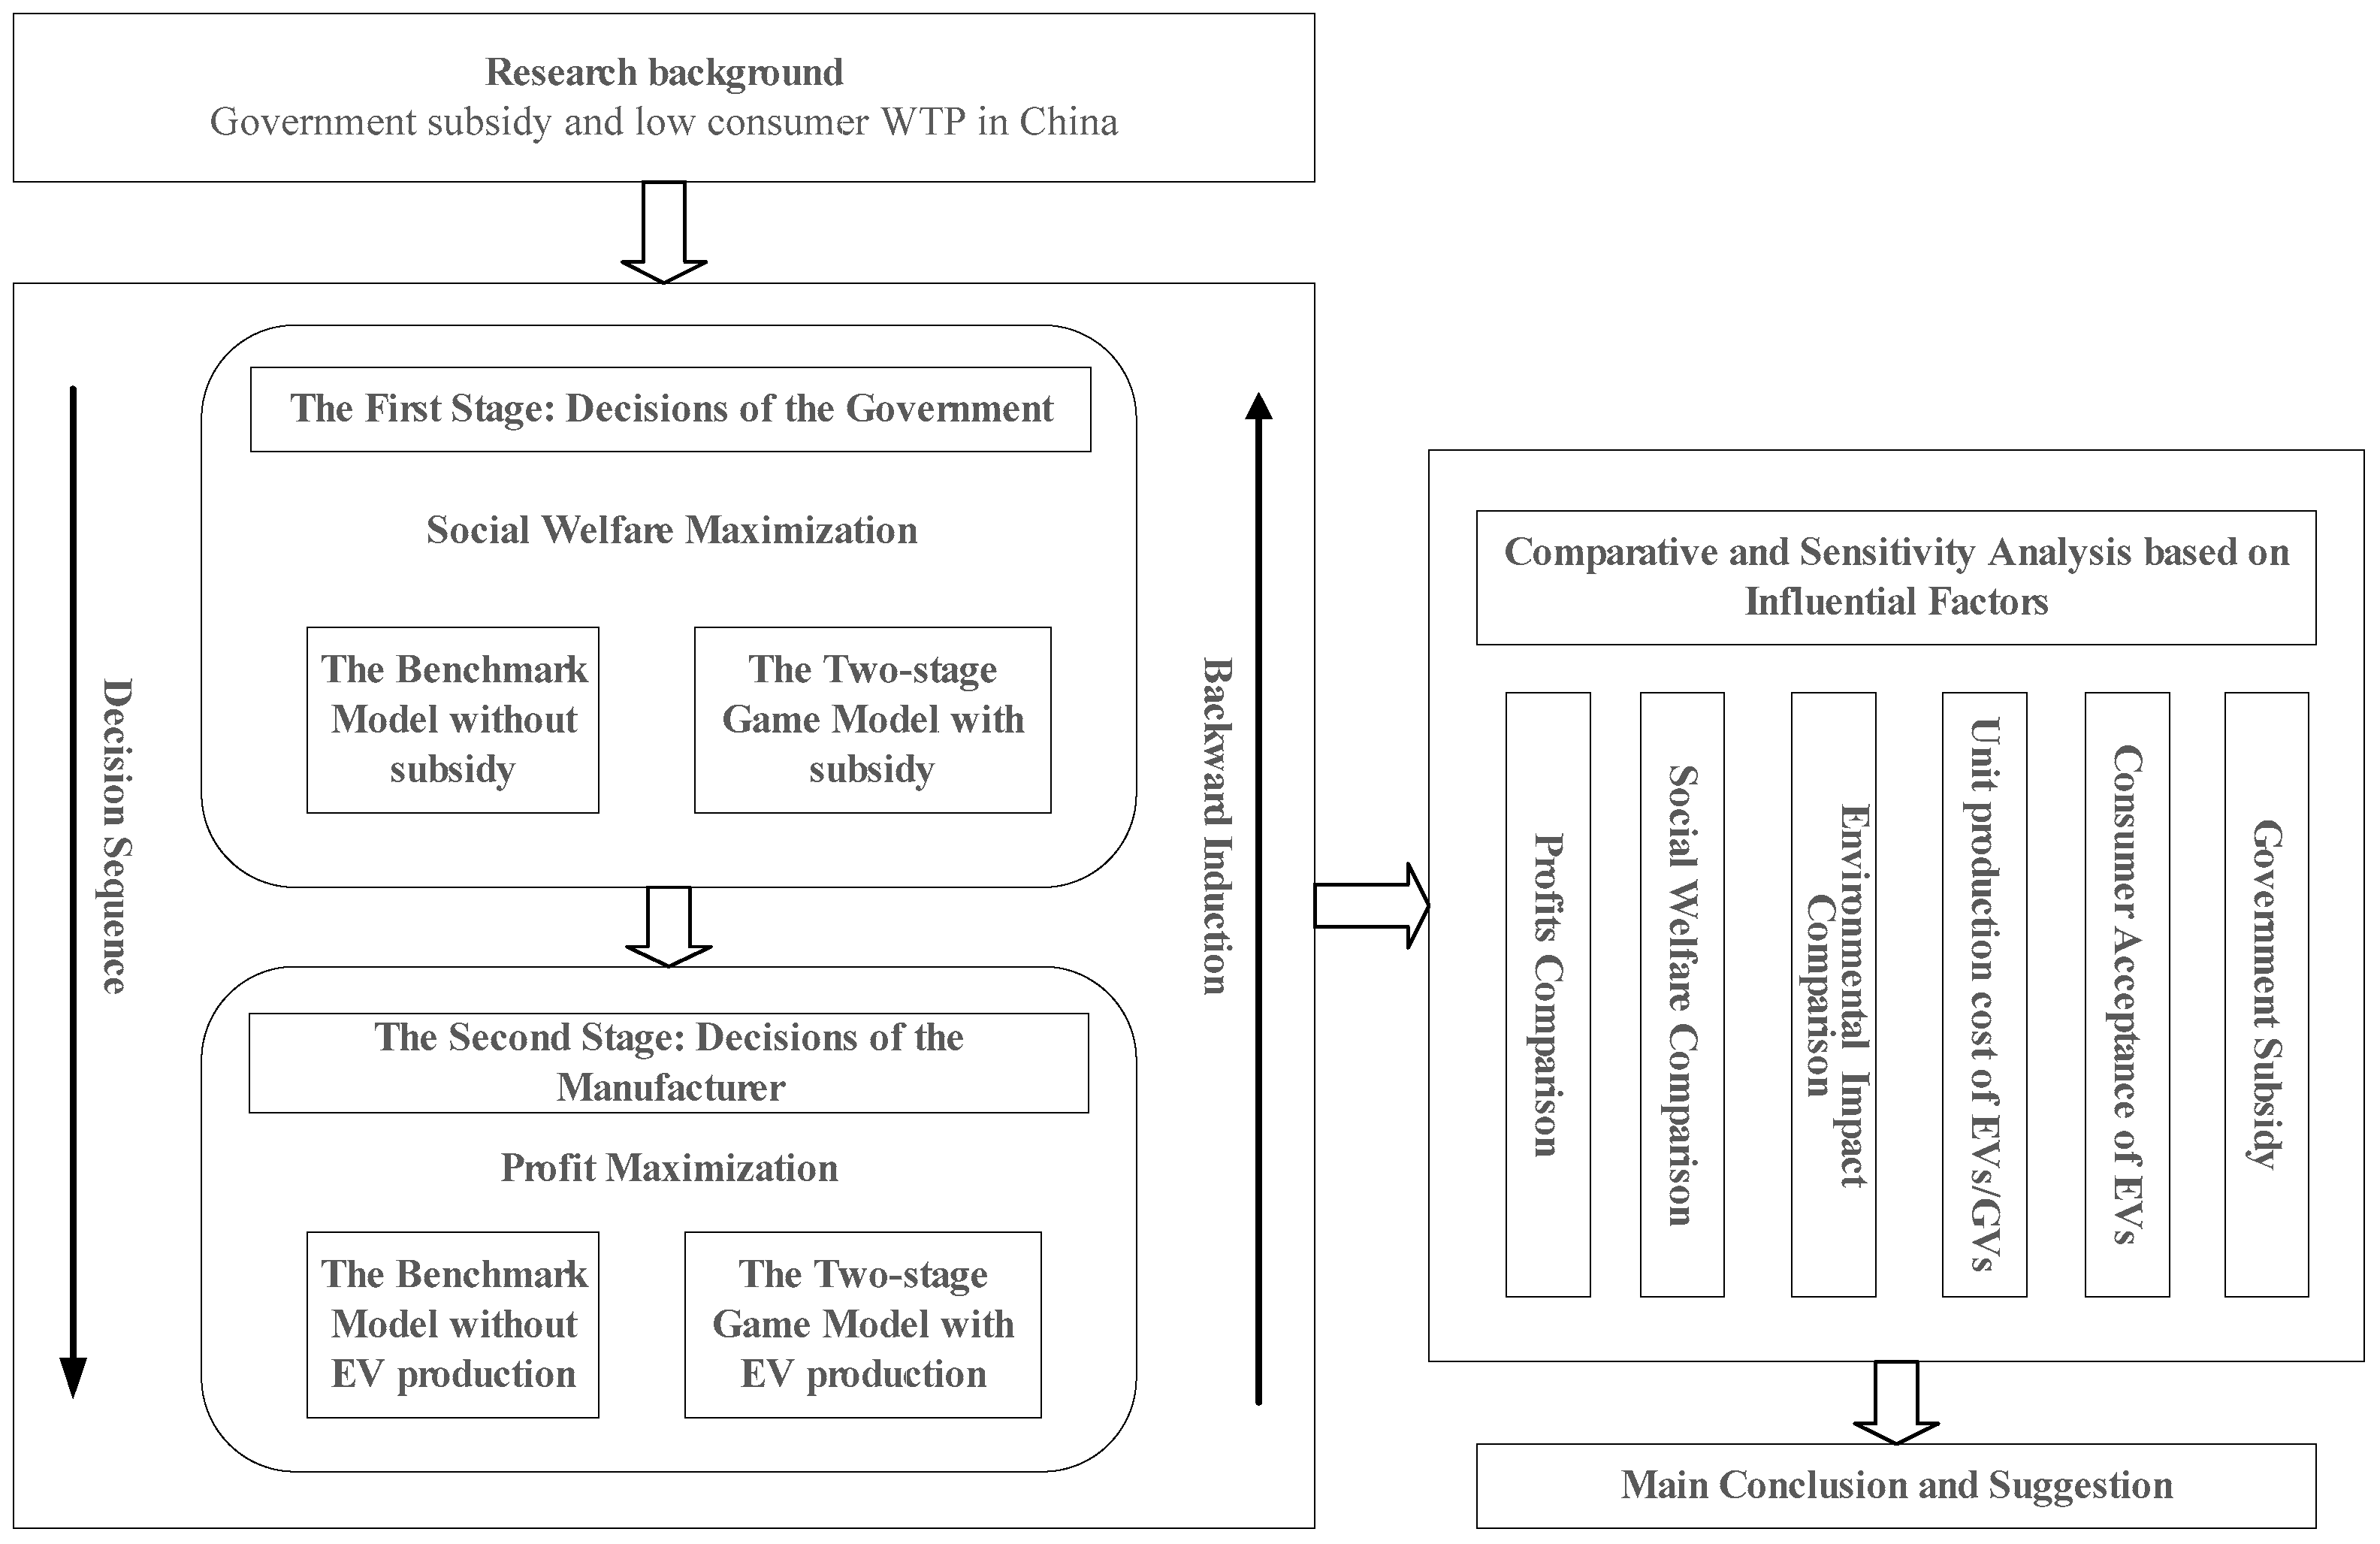
  • The literature on EV performances has been classified on the basis of methodology followed in conducting the research, as follows: survey (including secondary data analysis), case studies approach, mathematical modeling, and literature review. We build a model as a multi-stage Stackelberg game between a government policymaker who aims at the social welfare maximization and an auto manufacturer who pursues the profit maximization because the policymaker firstly determines the per unit subsidy, then the auto manufacturer decide the optimal retailer price, which is analogous to Stackelberg market competition. Thus, we contextualized the EV study to develop the Stackelberg model to optimize the environmental, economic, and social performance of the system.

3. Problem Definition and Assumptions

In this study, we consider two different scenarios for a vehicle manufacturer: first, without government involvement, the vehicle manufacturer as a unique member of the supply chain only produces GVs and determines his/her optimal price to maximize his/her profit, which is used as a benchmark model (Model B); second, the manufacturer produces EVs and GVs simultaneously, and makes optimal decisions for these two products in terms of a subsidy incentive scheme that is offered by the government, which is characterized by a two-stage game model (Model T). The game sequence is as follows: in the principle of maximization of social welfare, the government as the leader first sets the per unit subsidy (i.e., R denotes the amount given to EV consumers), according to the consideration of the profit-maximizing actions of the manufacturer; then the manufacturer decides the optimal retail price for EVs and GVs, which depends on the subsidy that is given by the government. The primary goal of this study is to determine under what conditions entering the EV market is a desirable option for the manufacturer based on the comparison of the equilibriums in these two scenarios. Table 3 summarizes the key notations of the models.
We assume consumer heterogeneity with respect to the consumer willing-to-pay (WTP) for GVs and EVs. Despite the advantages of environment-friendliness and energy-efficiency, EV production is faced with the challenges of inadequate infrastructure, battery replacement, recycling, and so on. Consequently, consumers prefer purchasing GVs, especially in developing countries. Therefore, a consumer with a willingness-to-pay θ (i.e., θ that is uniformly distributed in the interval [0, 1]) to purchase an GV has a willingness-to-pay δ θ to purchase a EV, where δ < 1 represents the consumer’s acceptance of EVs [51,59,71]. It is worth noting that albeit low WTP for EVs, the low-emission advantage of the EV production is still appealing to some consumers, which results in the economic consequence of cannibalization. In additional, for professional fleet customers such as car-sharing, car hire or small logistics firms, the existence of a critical threshold for EV adoption, which depends on factors including economies of scale, spatial differentiation according to population density and distances to commute, is not discussed in this paper and require further analysis.
Furthermore, owing to the high cost of batteries, the production cost of EVs is higher than that of GVs, namely, c e > c g . For example, an electric Golf costs twice as much as a gasoline Golf [72]. In spite of the rapidly falling prices of battery packs for electric vehicles [73], the production cost of EVs remains much higher than that of GVs.
In this study, government subsidy is denoted by R , which is the amount given to EV buyers. p e R is the effective price, which is the out-of-pocket net price that is paid by EV buyers. Thus, the higher the subsidy, the lower the price to the consumer. However, the government subsidy has experienced restrictions on fiscal expenditures. We assume that the subsidy is less than the production costs of EV, namely R < c e .
Similar to the definition in Agrawal et al. [74], let e g and e e denote the per-unit environmental impact of GVs and EVs, respectively. Following Shao, Yang, and Zhang [70], we assume that e e < e g . Then, let c g + e g and c e + e e denote the total social costs of GVs and EVs, respectively. We assume that c e + e e < c g + e g holds, because it serves as an incentive for the government to encourage EV adoption.

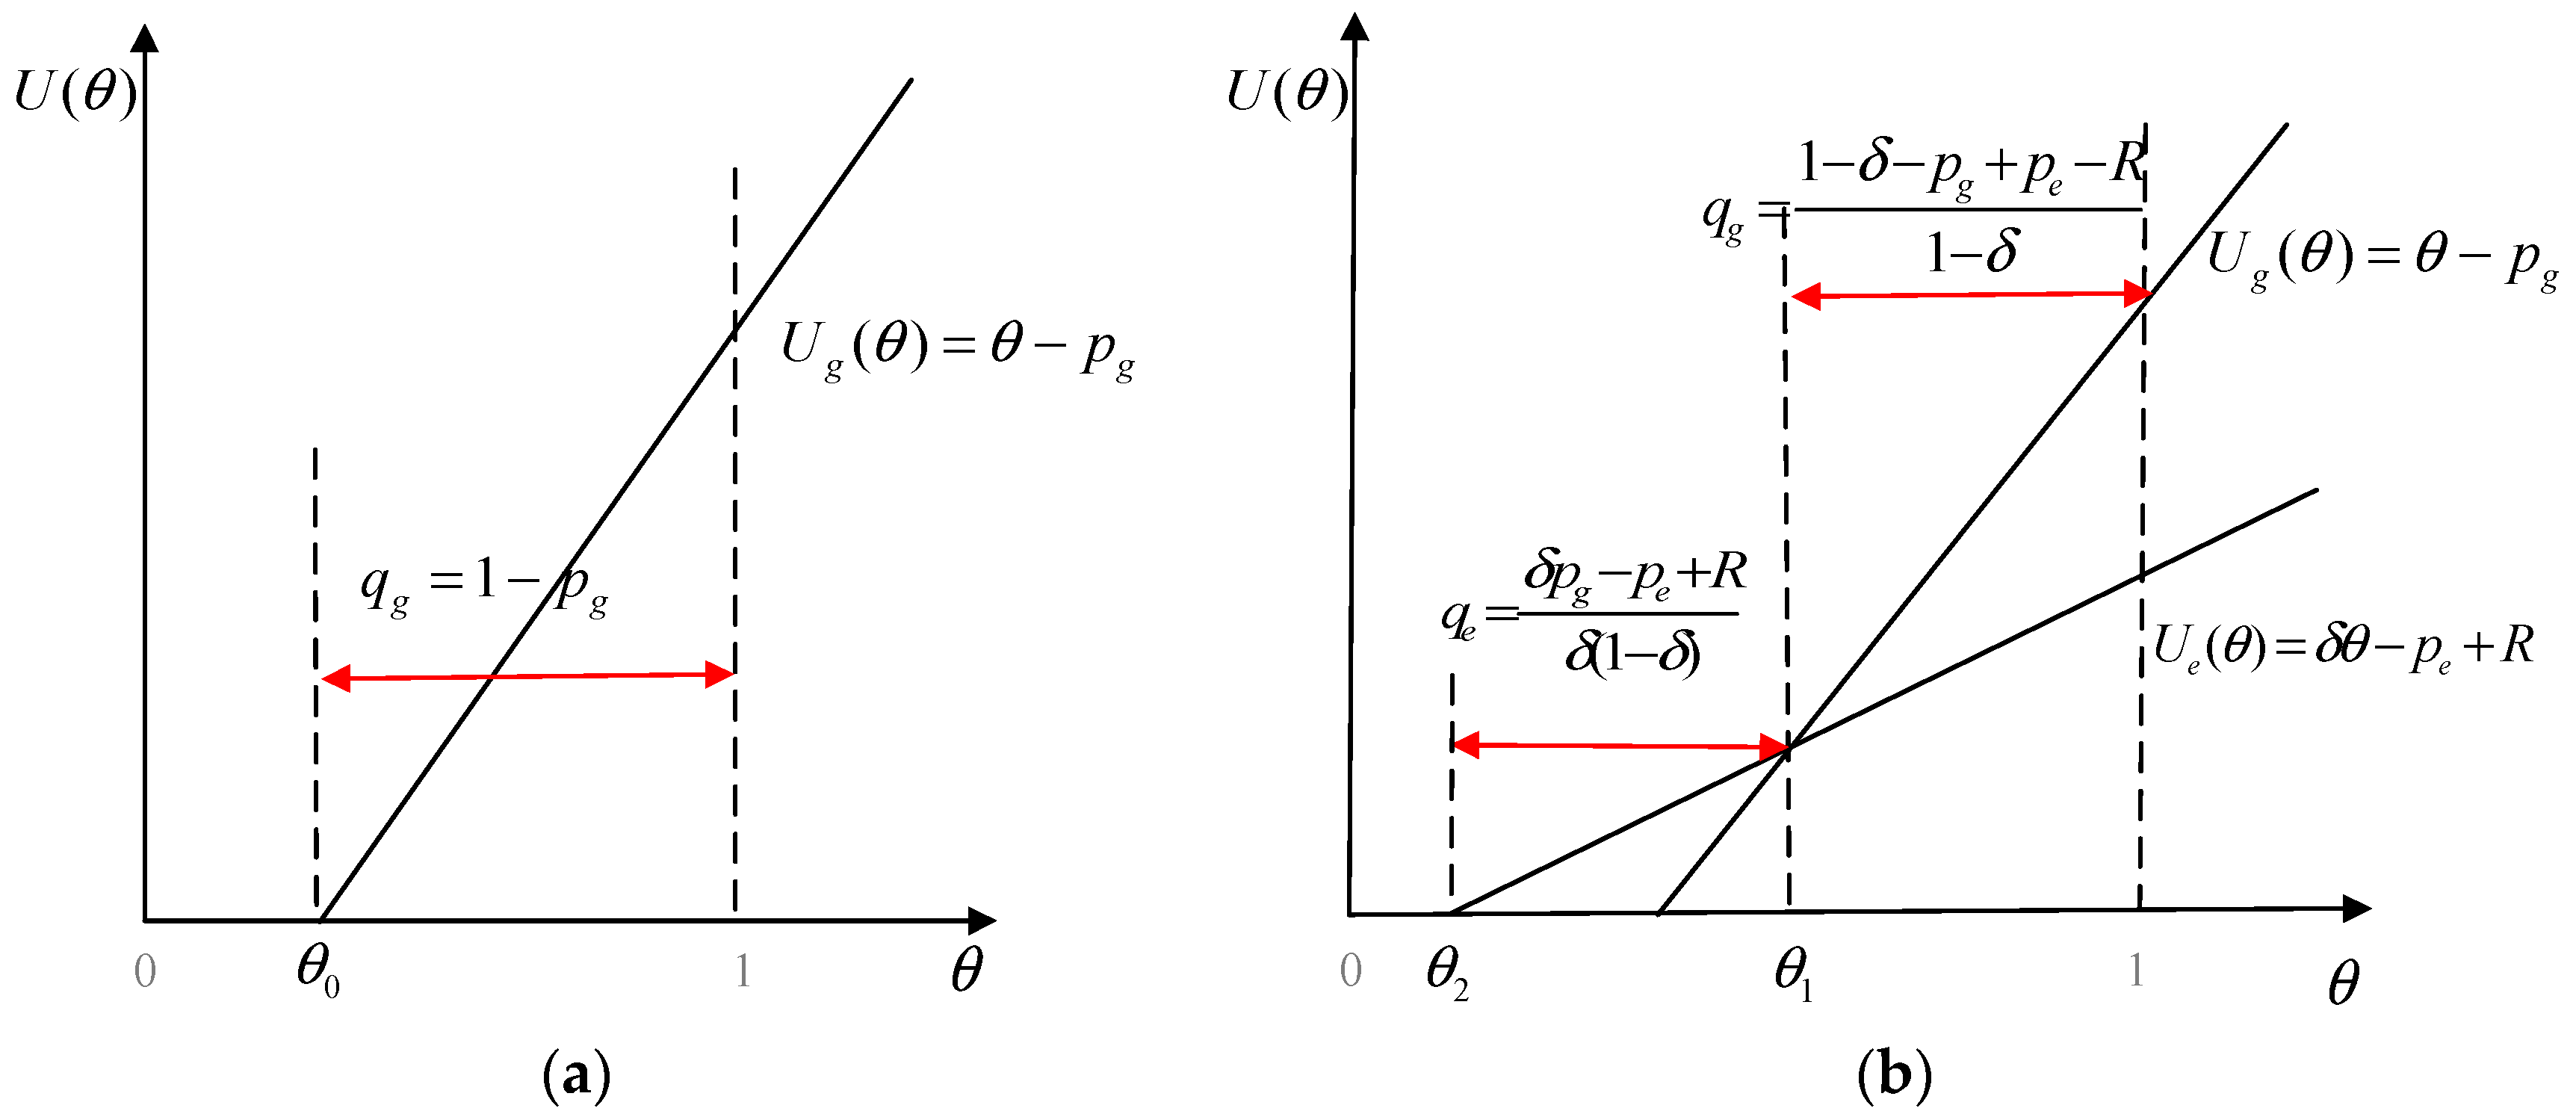
4. The Second Stage: Decisions of the Manufacturer

4.1. The Benchmark Model (Marked as Model B)

To obtain a benchmark, we first consider that the vehicle market with the monopoly manufacturer who only produces and sells GVs.
To derive the demand function for the GV in Model B, we need to describe consumer utility as
U g ( θ ) = θ p g ,
p g denotes the retail price of a GV in accordance with the well-known Mussa and Rosen [75] and Örsdemir et al. [76] utility function. We denote the boundary between buying a GV and remaining inactive by θ 0 , which is derived from U g ( θ 0 ) = θ 0 p g = 0 . Then, owing to the market size that is assumed as 1, consumer demand can be obtained as q g = 1 p g (see Figure 2a). Then, the demand function for GVs in Model B is presented, as follows:
q g = 1 p g .
Thus, the problem of Model B can be stated as
max p g π m B = ( p g c g ) q g ,
where π m B = ( p g c g ) q g denotes the manufacturer’s profit function.
Equation (3) can be verified to be concave with respect to the retail price p g of GVs. When considering the first order conditions of Equation (3), the optimal decisions of Model B can be obtained, as follows
p g B * = 1 + c g 2 ,
q g B * = 1 c g 2 .
Accordingly, the optimal profit of the manufacturer is
π m B * = ( 1 c g ) 2 4 .
The proof is included in Appendix A.
According to Equations (4)–(6), we can find that in Model B, the production cost of GV c g is a critical parameter that determines the manufacturer’s income as well as consumer demand. Both can be increased by cost-cutting with respect to GVs.
Consumer surplus indicates the aggregate utility of consumers in the vehicle market, which can be derived by integrating the utility function with respect to the consumer preference parameter θ over buying GVs and remaining inactive. Then, following Örsdemir, Kemahlıoğlu-Ziya and Parlaktürk [76], we denote consumer surplus ( C S ) in Model B as
C S B = p g 1 ( θ p g ) d θ = ( 1 p g ) 2 2 .
With respect to the environment impact ( E ) and the social welfare ( S W ) , which are relevant to the government subsidy scheme and the new energy vehicle (i.e., EVs), we characterize them in the two-stage game mode.

4.2. The Two-Stage Game Model (Marked as Model T)

In this section, we consider a scenario wherein EVs and GVs are produced by the monopoly manufacturer simultaneously under a subsidy incentive scheme. Thereby, the two-stage Stackelberg game is conducted between the government and manufacturer: in the first stage, the government plays a leader’s role by offering the subsidy scheme; in the second stage, the manufacturer plays a follower’s role and determines the retail prices of EVs and GVs in terms of the subsidy offered by the government.
Owing to the government’s subsidy policy, consumers can enjoy lower EV prices with subsidy R , which is denoted by p e = p e R , where p e is the retail price that is set by the manufacturer. Hence, following Mussa and Rosen [75], we describe the utility function for EVs and GVs, respectively, as follows:
U e ( θ ) = δ θ p e + R ,
U g ( θ ) = θ p g ,
where the utility function for GVs is the same as that in Model B. Thus Equations (8) and (9) yields the boundary θ 1 between buying a GV and buying an EV, which is given by θ 1 = p g p e + R 1 δ . Let U e ( θ ) = δ θ p e + R = 0 , then we can obtain θ 2 = R p e δ . Figure 2b shows the different behaviors of heterogeneous consumers: when θ [ θ 1 , 1 ] , consumers will buy GVs; when θ [ θ 2 , θ 1 ] , consumers will buy the EVs; when θ [ 0 , θ 2 ] , consumers will remain inactive.
Now there is enough information acquired to compute the demand for GVs and EVs. For GVs, the demand q g T is 1 θ 1 ; for EVs, the demand q e T is θ 1 θ 2 . Their respective demand functions are as follows:
q g T = 1 δ p g + p e R 1 δ ,
q e T = δ p g p e + R δ ( 1 δ ) .
Accordingly, the manufacturer’s profit function can be stated as
π m T = ( p g T c g ) q g T + ( p e T c e ) q e T ,
of which the manufacturer aims at maximization.
Similar to consumer surplus C S B * , we denote consumer surplus in Model T as
C S T * = p e R δ p g p e + R 1 δ ( δ θ p e + R ) d θ + p g p e + R 1 δ 1 ( θ p g ) d θ .
We denote the per-unit environment impact of GVs and EVs as e g and e e , respectively, in the same way as Agrawal, Ferguson, Toktay and Thomas [74]. By referencing the outcome of MacKay [77], we can reasonably assume that e g < e e . The total environment impact of the supply chain can be computed as
E T = e g q g T + e e q e T ,
where e g q g and e e q e represent the environment impacts of GVs and EVs, respectively. Note that the environment impact in Model B can be obtained as
E B = e g q g B = e g ( 1 c g ) 2 ,
for the reason that EVs are not produced before the manufacturer’s entry into the EV market.
Subsequently, we consider social welfare, and the maximization of social welfare is the aim of the government. Reducing the environment impact ( E ) is the primary goal of governments when implementing their subsidy incentive scheme. Naturally, the government wants to achieve its goal with minimum expenditure ( G ) , maximum profit of the manufacturer ( π m ) , and consumer surplus ( C S ) . Therefore, the problem of the two-stage Stackelberg game can be described as
max R S W T = π m T + C S T G T E T s . t . max p e , p g π m T = ( p g c g ) q g + ( p e c e ) q e .
According to backward induction, we first consider the second stage with respect to the manufacturer’s decision. It is easy to verify that the profit function is a concave function, and therefore, the manufacturer’s optimal prices for GVs and EVs, respectively, are obtained as follows:
p g T * = 1 + c g 2 ,
p e T * = R + δ + c e 2 .
Accordingly, the sale quantity, total profits, and EV and GV profits are obtained, as follows:
q g T * = 1 R δ + c e c g 2 ( 1 δ ) ,
q e T * = R c e + δ c g 2 δ ( 1 δ ) ,
π m T * = ( 1 c g ) 2 4 + ( R c e + δ c g ) 2 4 δ ( 1 δ ) ,
π g T * = ( 1 c g ) 2 4 ( 1 c g ) ( R c e + δ c g ) 4 ( 1 δ ) ,
π e T * = ( R + δ c e ) ( R c e + δ c g ) 4 δ ( 1 δ ) ,
where π m T * = π g T * + π e T * .
Given Equations (17)–(20), we can obtain social welfare, environment impact, and government costs, as follows
C S T * = ( 1 c g ) 2 8 + ( R c e + δ c g ) 2 8 δ ( 1 δ ) ,
E T * = e g ( 1 c g ) 2 + ( R c e + δ c g ) ( e e δ c g ) 2 δ ( 1 δ )   and
G T * = R q e T * = R ( R c e + δ c g ) 2 δ ( 1 δ ) .
All of the proofs are included in Appendix B.

4.3. The Decision Analysis

In this section, given the above equilibrium solution, we examine the changes in the manufacturer’s decision that is affected by different parameters.
Proposition 1.
The manufacturer will engage in EV production only when R + δ c g c e > 0 .
Proof. 
All proofs are included in Appendix C. □
Proposition 1 indicates that EV production costs should be lower than a threshold value, i.e., c e < c e ¯ = δ c g + R . Otherwise, owing to high costs, the manufacturer will raise EV prices that cannot be accepted by consumers. Consequently, in accordance with the rational economic man theory, consumers are willing to buy GVs that have a better cost performance. Therefore, the manufacturer chooses not to enter the EV market. Further, according to c e ¯ δ > 0 and c e ¯ R > 0 , we know that the greater the consumer acceptance and the government subsidy, the easier it is for the manufacturer to enter the EV market, and vice versa, suggesting that the manufacturer’s decision to enter the EV market is affected by external factors; that is, the consumers’ willingness to pay for EVs changes with consumer acceptance and government subsidies, which leads to the alteration of the market demand for EVs, and ultimately influences the manufacturer’s decision to produce EVs. From c e ¯ c g > 0 , we also know that the increase in GV production costs makes it easier for the manufacturer to turn to EV production and vice versa. This indicates the influence of internal factors on the manufacturer’s decision to adopt EV production; for instance, the alteration of GV production costs results in a change in the relative competitive advantages of the two products, which can influence the manufacturer’s decision to adopt EV production.
Corollary 1.
In Model T, there exists the government subsidy range, i.e., R min < R < R max where R min = c e δ c g and R max = min { 1 δ + c e c g , c e } .
Proof. 
All of the proofs are included in Appendix D. □
Corollary 1 shows that the threshold for the manufacturer’s entry into the EV market (i.e., R + δ c g c e > 0 ) holds. It indicates that when EV production costs are greater than those of GVs (i.e., c e > c g ), the government subsidy should not be too low, which must satisfy R > c e δ c g . This is the only way that the manufacturer will engage in EV production; otherwise, he/she will continue to produce only GVs. Therefore, the government subsidy should be larger than R min , where R min = c e δ c g .
However, owing to the upfront heavy investment for GVs (i.e., investment in the production line, technology, infrastructure, and so on), GVs remain one of the main products of conventional car makers. We should ensure that the sale of GVs is greater than zero, where government subsidies are denoted by R < 1 δ + c e c g , otherwise, there will only be EVs that are produced in the car market, which is not in accordance with the original intention of the conventional car manufacturer. Then, given the assumption, we obtain R < c e , R max = min { 1 δ + c e c g , c e } where R max > R min holds. Hence, we denote the government’s subsidy range as R min < R < R max , which can effectively motivate conventional automobile manufacturers to invest in the EV market. Therefore, only when government subsidies create a scenario wherein EVs and GVs can coexist, will conventional car manufacturers consider an EV production strategy under a subsidy policy.
Proposition 2.
Compared to the benchmark Model B, Model T has the same GV price, lower GV sales, GV profits, and environmental impact, and higher total profits and consumer surplus. However, the value of the total environmental impact does not always decrease as it depends on whether EVs have a significant advantage of environmental friendliness.
Proof. 
All of the proofs are included in Appendix E. □
Proposition 2 shows that the GV price in Model T is the same as that in Model B because the GV price only depends on its production cost. Owing to the monopoly of the automotive market, the introduction of EVs can meet customers’ differentiated demand such that some of the potential consumers convert to EVs. The sales quantity of GV are reduced by R c e + δ c g 2 ( 1 δ ) . Since the prices of GVs remain unchanged and the per-unit environmental impact of GVs is fixed, consumer surplus increases, but their profits and environmental impact declines. In fact, many GV manufacturers are currently worried that the introduction of EVs may have a “cannibalization effect” on GVs, resulting in a decrease in their revenues. However, this study reveals that under a government subsidy policy, it is profitable for the conventional automobile manufacturer to enter the EV market. Although EVs do have a “cannibalization effect” on GVs, the profits that are generated by the introduction of EVs outweigh the losses incurred owing to reduced GV sales. When compared to Model B, the total profits that are generated by EV production increases by ( R c e + δ c g ) 2 4 δ ( 1 δ ) . This increment (i.e., ( R c e + δ c g ) 2 4 δ ( 1 δ ) ) positively correlates with the government subsidy, consumer acceptance, and the production cost of GVs, but negatively correlates with the production cost of EVs. Therefore, entering the EV market with the help of government subsidies is actually profitable for GV manufacturers.
Although a decrease in sales of GVs will result in a reduced impact on the environment, the overall environmental impact is not necessarily reduced, as this depends on whether or not the environmental friendliness of EVs is significantly more than that of GVs. When e e < δ e g , the advantages of EVs result in reduced total environmental impact; otherwise, there is an increase in the total environmental impact.
Proposition 3.
In Model T, the price of an EV positively correlates with customer acceptance; however, the subsidy and the production cost of an EV has no correlation with the production cost of a GV. The price of a GV is only positively related to its production cost and not to other parameters. The sales quantity of EVs positively correlates with customer acceptance of EVs, subsidies, and the production costs of GVs, but negatively correlates with the production costs of EVs. The sales quantity of GV changes in the opposite way to EV.
Proof. 
All of the proofs are included in Appendix F. □
From Proposition 3, it can be seen that under Model T, an increase in the production cost of an EV will result in its higher price. Similarly, the increase in the production cost of a GV will result in its higher price. The pricing of these two types of automotive products is only related to their respective costs. Meanwhile, the increase in the government subsidy and the consumer acceptance for EV will increase the EV price, but not the GV price.
It is noteworthy that the impact of consumer acceptance, government subsidies, and production costs on the sales quantity of EVs is exactly opposite to that of GVs. That is, the improvement in the consumer acceptance of EVs will increase the sales of EVs, but will reduce the sales of GVs, and the increment of EV sales quantity is c e R 2 δ 2 more than the reduction in GV sales quantity; government subsidies will increase the sales quantity of EVs while reducing that of GVs, and the higher the level of consumer acceptance, the greater is the reduction in GV sales. In addition, it can be seen that an increase in EV sales is 1 δ ( 1 δ > 1 ) of the decrease in GV sales. It is clear that while considering Model T, the adoption of EV production under government subsidies results in a decrease in GV sales, but an increase in overall car sales; similar to the case of government subsidies, the reduction in the production costs of EVs will increase EV sales but decrease GV sales, and an increase in EV sales is 1 δ ( 1 δ > 1 ) of the decrease in GV sales. A decrease in the production costs of GVs will increase GV sales and reduce the EV sales, they have the same variations of the sales quantity as each other. According to the comparison of the impacts of the two products’ production costs, it can be concluded that the conventional automobile manufacturer is more willing to commit himself/herself to reduce the production cost of EV in order to boost market demand.
Proposition 4.
The profits of EVs positively correlates with customer acceptance, subsidies, and the production cost of GVs, but negatively correlates with the production costs of EVs; the profit of GV changes in the opposite way to that of EV; the total profit and consumer surplus of EV manufacturers positively correlates with customer acceptance and the subsidy of EV, but negatively correlates with their production costs.
Proof. 
All proofs are included in Appendix G. □
From Proposition 4, we find that the impact of consumer acceptance, government subsidies, and the production costs on the profit of EVs is exactly the opposite to that of GVs. This relationship confirms the cannibalization impact of EV production on GV profits in the current market. Increased consumer acceptance or government subsidies will result in an increase in EV profits and a decrease in GV profits. This is a result of the competitive relationship between EV and GV. Specifically, increased consumer acceptance or government subsidies will directly improve consumers’ purchasing utility for EV and increase the competitive advantages of EV, which results in an increase in EV sales and the earning variations of the two vehicles, and vice versa. Further, the increase in production costs of GVs or the decrease in production costs of EVs will lead to an increase in EV profits and a decrease in GV profits, respectively. This indicates that the changes in the production costs of the two vehicles indirectly affects the comparative advantage between EV and GV, and ultimately affects their earning situations. In despite of the cannibalization impact of EV production on GV, there are no economic losses to the conventional automobile manufacturer, and it is profitable for him/her to invest in EV production. This results from the fact that the profits of EVs increase more rapidly than those of GVs, such that the total profit increases. That is, investment in EV production can provide the conventional automobile manufacturer with extra revenues.
In addition, it is worth noting that the effect of the four parameters ( δ , R , c e , and c g ) on consumer surplus is similar to that on the manufacturer’s total profit. The sensitivity of the manufacturer’s total profits to any parameter is twice as that of consumer surplus. It reflects the advantage of the strategy of EV production whereby a win-win situation is realized, namely, both the manufacturer and the consumer can benefit from EV production. It also can be seen that consumer acceptance and government subsidies have positive effects on consumer surplus and manufacturers’ total profits. However, the production costs of the two vehicles have negative effects on consumer surplus and the manufacturers’ total profits. Increased consumer acceptance and government subsidies directly increase the utility of consumers. However, because of the prices, production costs indirectly affect consumers’ willingness to pay for EVs, which ultimately affects consumer surplus and the manufacturers’ total profits.

5. The First Stage: Decisions of the Government

Based on the manufacturer’s equilibrium decisions in Section 4, we analyze the optimal subsidy decision for the government, which aims at the maximization of the total social welfare.
Under the condition that no influence is imposed by the government, the total social welfare for the vehicle market in Model B can be stated as
S W B * = π m B + C S B E B = ( 1 c g ) [ 3 ( 1 c g ) 4 e g ] 8 ,
The social welfare for the vehicle market in Model T can be formulated as
S W T * = π m T * + C S T * G T * E T * = ( 1 c g ) [ 3 ( 1 c g ) 4 e g ] 8 ( R c e + δ c g ) ( R + 3 c e 3 δ c g + 4 e e 4 δ e g ) 8 δ ( 1 δ ) ,
Proposition 5.
In Model T, there exists the optimal subsidy, i.e., R 0 = 2 ( δ e g e e ) c e + δ c g , which can maximize social welfare; here, R 0 positively correlates with consumer acceptance, GV production costs, and the per-unit environmental impact of GVs, but negatively correlates with EV production cost and the per-unit environmental impact of EV.
Proof. 
All proofs are included in Appendix H. □
Proposition 5 shows that the greater the consumer acceptance of EVs, the greater is the government subsidy that aims to maximize social welfare. This result may seem counterintuitive, but in the early stages of EV development, owing to consumers’ lower preference for EVs (i.e., 0 < δ < 1 ), when there is an increase in consumer acceptance, it is critical for governments to provide EV buyers with subsidies in order to maintain the increased acceptance. Otherwise, consumer acceptance is too low to warrant subsidies. Meanwhile, the optimal subsidy negatively correlates with EV production costs and positively correlates with GV production costs, implying that the innovation and the development of automotive technology can be promoted by subsidizing the high-tech EV and the low-tech GV. In addition, the lesser the environmental impact of EVs (i.e., the higher the environmental friendliness of EV), the higher are the subsidies, thereby reflecting that the environmental performance of EVs is one of the major driving factors behind the optimal subsidies. The manufacturer should strive to improve the environmental performance of EVs. The greater the per-unit environmental impact of GVs, the greater is the negative impact on the environment, and the more urgent the demand for energy conservation and emission reduction. Therefore, if higher subsidies are implemented to stimulate the development of the EV market, such that GVs are gradually replaced by EVs, the maximization of social welfare will be realized.
Proposition 6.
Based on the aforementioned government subsidy range, namely, R min < R < R max , we denote the feasible optimal subsidy of government R * : when c e + e e c g + e g < δ < min { 1 + 2 c e c g + 2 e e 1 + c g + 2 e g , 2 ( c e + e e ) c g + 2 e g } , R * = R 0 ; otherwise R * = 0 .
Proof. 
All proofs are included in Appendix I. □
Proposition 6 indicates that the government should take both the manufacturer and consumer into account when formulating the subsidy policy to maximize total social welfare. Given the consumers’ low WTP for EVs, the government can set the feasible optimal subsidy, i.e., R * = R 0 only when δ satisfies c e + e e c g + e g < δ < min { 1 + 2 c e c g + 2 e e 1 + c g + 2 e g , 2 ( c e + e e ) c g + 2 e g } and R 0 satisfies the threshold condition R min < R 0 < R max . Such a decision will not only motivate the conventional automobile manufacturer to produce EVs, but also achieve the maximum of total social welfare. Otherwise, 0 < δ c e + e e c g + e g , the government subsidy fails to work and has a negative effect on the manufacturer’s decision regarding EV production (i.e., q e T * = 0 ). At this point, it is essential for the government to take some measures to improve consumer acceptance for EVs such as stepping up low-carbon promotion and highlighting the green consumption concept, rather than providing subsidies.
Proposition 7.
In Model T, the impact of the feasible optimal subsidy R * on the social welfare can be stated as follows:
(i) 
The government sets the feasible optimal subsidy R * = R 0 , then S W T * | ( R = R 0 ) = ( 1 c g ) [ 3 ( 1 c g ) 4 e g ] 8 + ( c e δ c g + c e δ e g ) 2 2 δ ( 1 δ ) 0 is obtained and S W T * > S W B * holds;
(ii) 
The government sets the feasible optimal subsidy R * = 0 , then S W T * = S W B * = ( 1 c g ) [ 3 ( 1 c g ) 4 e g ] 8 is obtained.
Proof. 
All of the proofs are included in Appendix J. □
Owing to the high dependency of GVs on gasoline, EVs, which are environmentally friendly and provide sustainable development, serve as incentives for the government to abate emissions and reduce the negative impact on society. Proposition 7 shows that with the premise that Proposition 6 is satisfied; the government can set the subsidy as R * = R 0 . At this point, it is not advisable for the government to award subsidies to EV buyers. In summary, Proposition 7 reveals that the subsidy scheme should be provided as an incentive to develop EVs.

6. Numerical Example

In order to describe the conclusion of the aforementioned analysis effectively, this section makes use of some numerical examples to supplement the analysis on how government subsidies can change the equilibrium solutions and their sensitivities on δ and c e . Related parameters are set as follows: c e = 0.55 , c g = 0.5 , e e = 0.03 , e g = 0.15 , δ = 0.15 , and R = 0.12 .

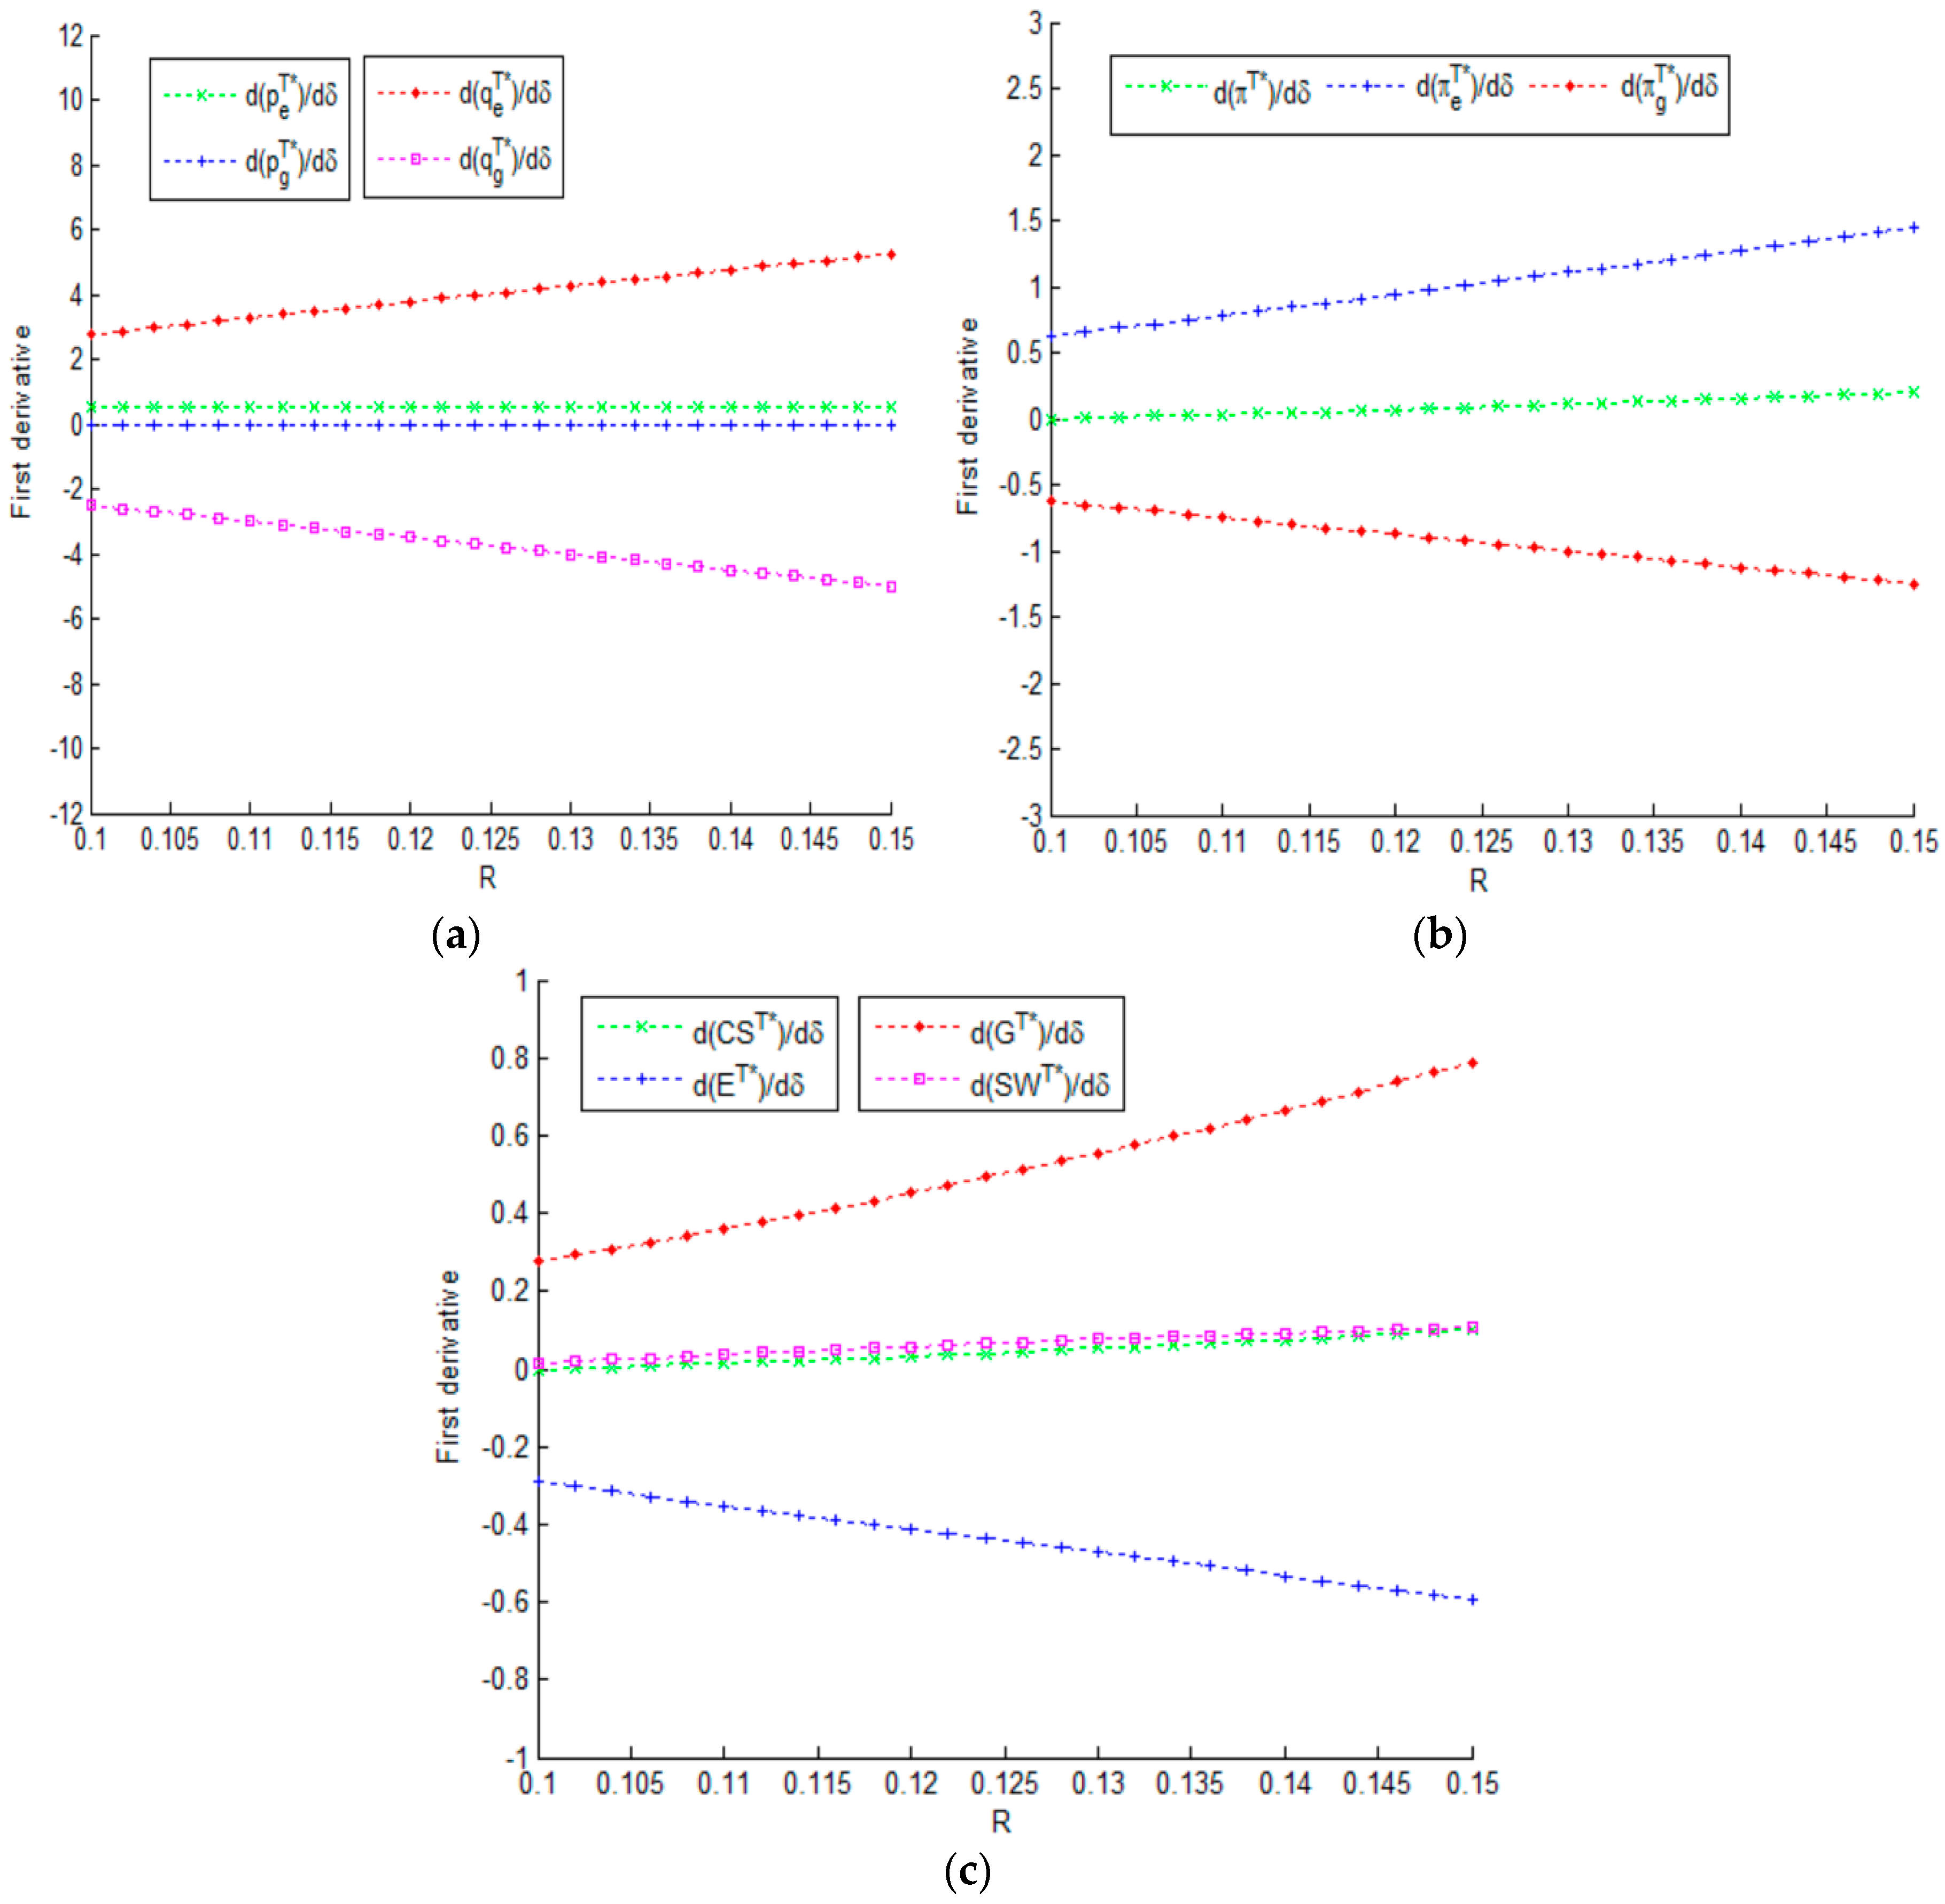
6.1. Sensitivities on the Consumer Acceptance δ Change with R

When a government subsidy varies from 0.1 to 0.15, the first derivatives of the optimal prices, sales quantity, manufacturer profit, government expenditure, consumer surplus, environmental impact, and the total social welfare for δ are shown in Figure 3.
As can be seen from Figure 3a, the price of GVs is not affected by the consumer acceptance ( p g T * δ = 0 ); the price of EVs positively correlates with consumer acceptance ( p e T * δ > 0 ), namely, the price of EVs increases with consumer acceptance, which has no correlation with the subsidy. In addition, the impact of consumer acceptance on EVs sales is opposite to that on GVs. That is, q e T * δ > | q g T * δ | , which shows that with increased consumer acceptance, the increase in the sales of EVs is slightly higher than the decrease in the sales of GVs. In addition, as the government subsidy increases, the positive effect of consumer acceptance on the sales of EVs increases and the negative effect of consumer acceptance on the sales of GVs increases as well. An increase in the subsidy can amplify both of these effects.
Figure 3b also verifies the positive correlation between consumer acceptance, EV profits, and the manufacturer’s total profits, and the negative correlation between consumer acceptance and GV profits, which are mentioned in Proposition 4. Further, according to Figure 3b, it can be observed that no matter how the subsidy changes in the interval, π e T * δ is always larger than | π g T * δ | such that π T * δ > 0 .
As can be seen from Figure 3c, consumer acceptance has positive effects on consumer surplus, government expenditure, and total social welfare, and negative effects on the environmental impact. An increase in the subsidy can amplify all of the effects. In summary, when the subsidy lies within certain intervals, an improvement in the consumer acceptance of EVs as well as the government subsidy is beneficial for the manufacturer and the environment.

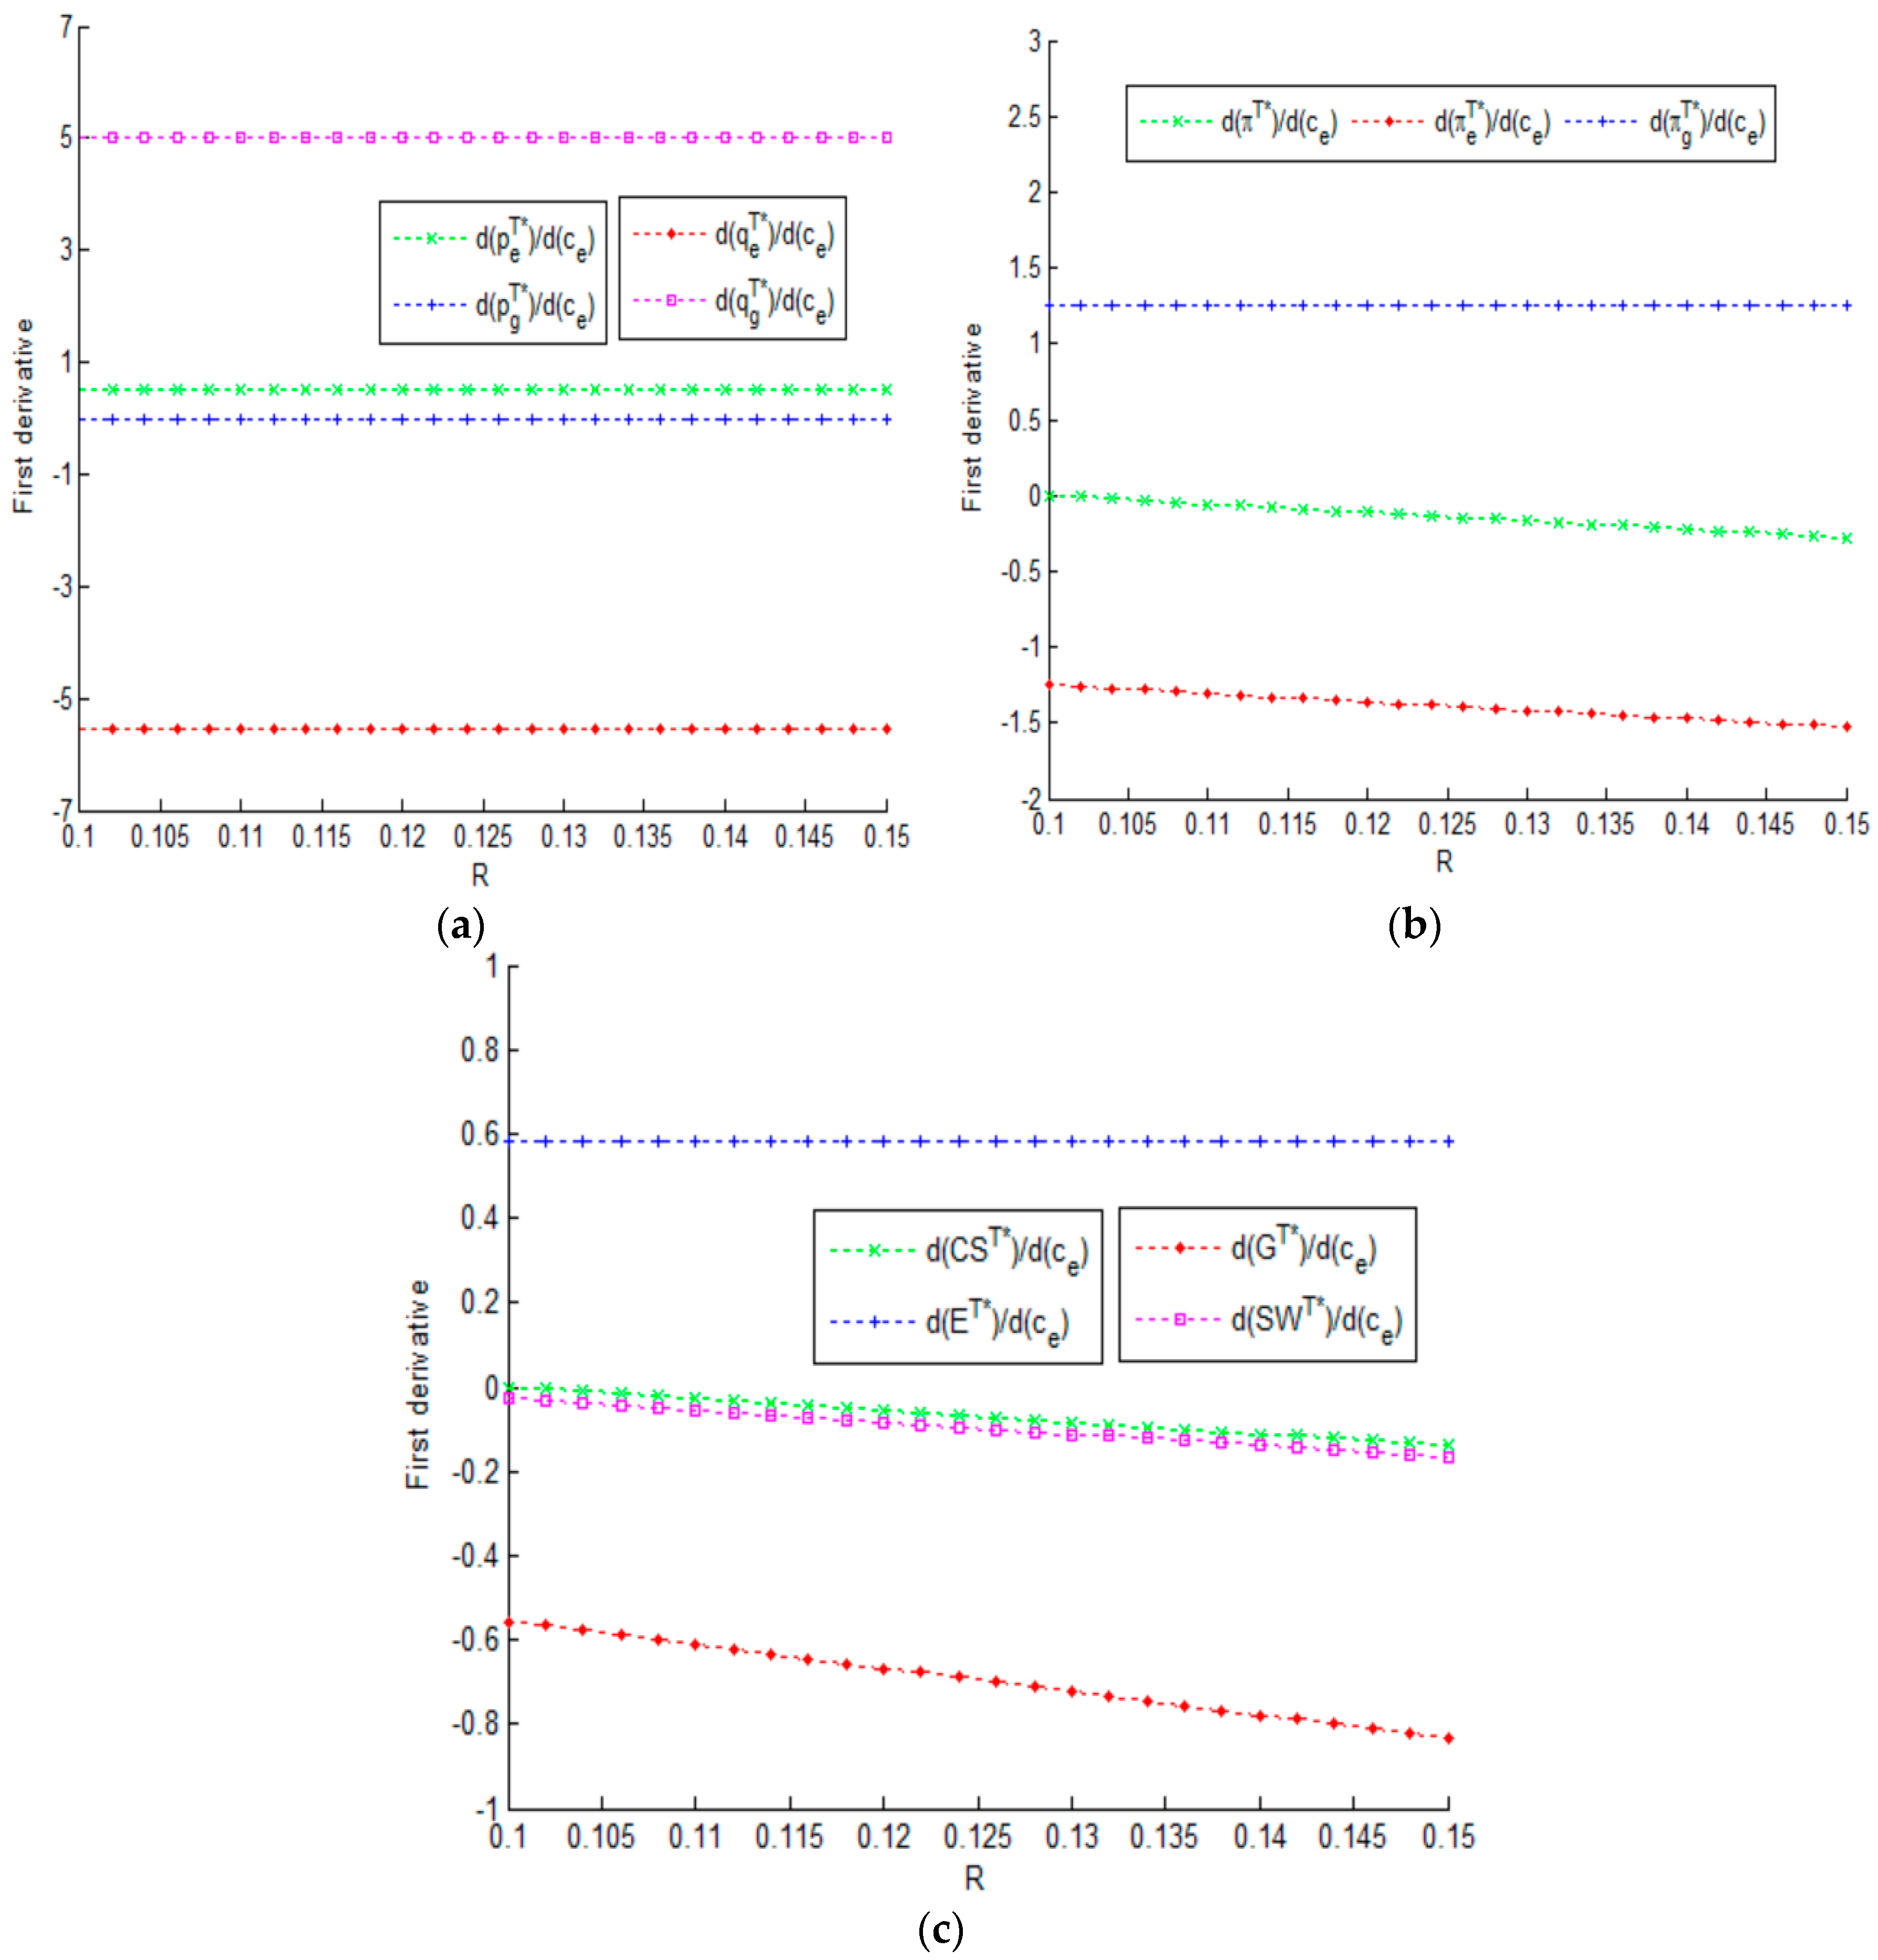
6.2. Sensitivities on the Production Cost of EVs c e Change with R

When the government subsidy varies from 0.1 to 0.15, the first derivatives of the optimal prices, sales quantity, manufacturer profit, government expenditure, consumer surplus, environmental impact, and the total social welfare for the production cost of EV are shown in Figure 4.
According to Figure 4a, we can find that the production costs of EVs have no effect on the price of GVs, i.e., p g T * c e = 0 , the production costs of EVs positively correlates with EV prices and sales of GVs, and negatively correlates with the sales of EVs. The change in the subsidy has no effect on their relationship.
From Figure 4b, we understand that owing to p g T * c e = 0 and q g T * c e > 0 , the production cost of EVs has a positive effect on the profits of GVs; owing to p e T * c e > 0 and q e T * c e < 0 , the production cost of EVs has a negative effect on the profits of EVs. Overall, the production cost of EVs has a negative effect on the total profit of the manufacturer, and an increase in the subsidy will amplify the effect.
From Figure 4c, we can see that when the production cost of EVs decreases, the environment impact decreases, but this has no correlation with the subsidy. In addition, the production cost of EVs has negative effects on the consumer surplus, government expenditure, and social welfare, and an increase in government subsidies will amplify the effects. In summary, under certain conditions, a decrease in the production costs of EVs and an increase in government subsidies will cause a multiplier effect.

6.3. Sensitivities on the Government Subsidy R

The impact of the government subsidy on prices, sales quantity, manufacturer’s profits, government expenditure, consumer surplus, environment impact, and total social welfare are shown in Figure 5.
Figure 5a shows that the price of GVs has no correlation with the subsidy, and the price of EVs positively correlates with the subsidy. That is, given a higher subsidy, manufacturers will split the “welfare pie” provided by the government by raising the price of EVs. The impact of government subsidies on GV sales is opposite to that on EVs sales, which demonstrates that under government subsidies, the introduction of EVs has a cannibalization effect on GV sales. As the subsidy increases, some consumers will purchase EVs instead of GVs, which leads to an increase in EVs sale and a decrease in GV sales, and the former is larger than the latter.
Further, Figure 5b shows that as the government subsidy increases, the total profit of the manufacturer and EV profits increase, and GV profits decrease. An increase in the total profits of the manufacturer results from the greater increase in EVs profits when compared to the reduction in GV profits. The increase in the profitability of EVs surpasses the reduction in the profits of GVs, which can be explained as follows: with an increase in the subsidy, the price of EVs increases, EV sales increase more than the decrease in GVs, such that the profit growth of EVs will be more rapid than the profit loss of GVs.
From Figure 5c, we can see that given R ( 0.1 , 0.15 ) , as the government subsidy increases, consumer surplus and government expenditure increases, the environmental impact decreases, and the total social welfare first increases and then decreases. This conclusion demonstrates Propositions 2–5, namely, under certain conditions, an increase in subsidies increases the consumer utility of purchasing EVs, such that some consumers will purchase EVs instead of GVs and the environment impact falls. However, the government is faced with more expenditure. Owing to the comprehensive effects, there exists an optimal subsidy to maximize the total social welfare.
Similar to the result in the previous Propositions 2–5 that under certain conditions, an increase in subsidies will increase consumers purchasing utility for EVs and consumers surplus, the following will occur: Some consumers will choose EVs; EVs, while offering an alternative to GVs, may reduce the environmental impact, increase government subsidies and the cost of its financial expenditure. Under the combined effect, there exists an optimal subsidy to maximize total social welfare. In this numeral example, the optimal subsidy can be calculated as R * = R 0 = 0.11 .

7. Conclusions

Owing to the exacerbating energy crisis and the environmental pollution that is caused by GVs, EVs serving as a new kind of green transportation vehicle has received global attention. In China, as EVs are still in their preliminary stage of development, there is low consumer acceptance because of their limitations. Given consumers’ low preference for EVs, this paper analyzes the optimal EV production decisions and government subsidies from a maximal social welfare perspective. The results of this study can be summarized, as follows:
In the monopoly market, there exists a threshold condition for the traditional automobile manufacturer to enter the EV market. The driving factors that are related to the threshold conditions are composed of the internal and external factors of the automobile manufacturer, including the production costs of GVs and EVs, consumer acceptance of EVs, and government subsidies. Therefore, an increase in consumer acceptance, government subsidies, production cost of GVs, and a decrease in the production cost of EVs can lower the threshold for conventional automobile manufacturer to enter the EV market. However, when considering that the conventional automobile manufacturer has no intention of making a transition to a pure EVs manufacturer, greater government subsidies are not always better for the development of the EV market. Instead, the government subsidies lie within a certain range.
If government subsidies can satisfy the aforementioned threshold condition, it is profitable for the manufacturer to enter the EV market. Although EV production causes a decrease in GV profits, owing to the cannibalization from EVs, EV profits are greater than the loss in GV profits, which leads to an increase in the total profits of the manufacturer. Moreover, EV production can meet consumers’ differentiated demand and improve consumer surplus. However, the external environmental impact does not always improve by the introduction of EVs, which depends on whether there is a significant environmental advantage of EVs.
There exists an optimal subsidy that can maximize social welfare in the two-stage model. The subsidy increases with an increase in production costs of GVs and the environment impact factors of GVs, and decreases with the production costs of EVs and the environmental impact factors of EVs. It is interesting that the subsidy is positively correlated with consumer acceptance of EVs, namely, the higher the consumer acceptance of EVs, the more subsidies are provided by the government. In addition, we find that the government must take both the manufacturer and consumers into account such that its subsidy policy can effectively motivate the conventional automobile manufacturer to enter the EV market to maximize the social welfare. Otherwise, providing subsidy is not the government’s optimal decision.
There are several implications for policymakers:
  • Well-intentioned incentive policies to reduce auto products’ environmental impact and produce profitable revenue for manufacturers may lead to adverse effects if not implemented effectively.
  • Government of China should focus on strengthening public awareness of protecting the environment and promote the development and application of new green technologies.
  • Government should establish collaborative relationships with auto manufacturers and consumers since that the adoption and diffusion of EV can be understood and conducted smoothly.
For paper limitation, our analysis focuses on an EV market that was dominated by a monopoly manufacturer who can offer EV and GV simultaneously. This is a reasonable assumption with which the development of the EV technology at the early stage depends on large-scale investment and integrated technical competence. However, with the fast development of EV technology, there will be also situations where EV production is not appealing to an auto manufacturer, but attractive for independent and potential EV manufacturers. In such a case, these EV manufacturers who do not produce GVs capture sales of the market which result in a competitive situation. It will be our future research concentration.
In future research, we can develop game models in various supply structures with different assumption settings, including (1) information asymmetry between manufacturers and governments; (2) the dual-channel strategy of the automobile market; (3) the differentiation competition under a duopoly setting; and, (4) various government regulations, such as the reward and punishment mechanism, and so on. Moreover, in the future, we will verify the results of these problems that are supported by extant data.

Acknowledgments

This work in this paper was supported by the National Natural Science Foundation, China (No. 71671001, 71771002), the Humanities and Social Science Project of Fujian Province, China (No. FJ2016C025), the Young and Middle-age Teacher Education Research Project of Fujian Province, China (No. JAS170151), the Humanities and Social Science Key Research Project of Anhui Province, China (No. SK2017A0122), the National Natural Science Foundation of Anhui Province, China (No. 1608085QG168), Zhejiang Province Natural Science Foundation (No. LY18G010007), Fuzhou University National or Ministerial Major Nurturing Projects, China (No. BPZD1602), and the University Development Foundation of Fujian Agriculture and Forestry University (113-612014018).

Author Contributions

For this research article, Xiaoxue Zheng and Zhi Liu conceived, designed, and wrote the manuscript. Haiyan Lin and Shouzhen Zeng contributed significantly to the analysis and manuscript preparation. Haiyan Lin was responsible for the model development and analysis. Haiyan Lin helped perform the analysis with constructive discussions. Dengfeng Li and Carlos Llopis-Albert supervised the whole process of modeling and manuscript drafting. All authors read and approved the manuscript.

Conflicts of Interest

The authors declare no conflict of interest. The founding sponsors had no role in the design of the study; in the collection, analyses, or interpretation of data; in the writing of the manuscript; or in the decision to publish the results.

Appendix A. Calculations of the Optimal Decisions in Model B

In the benchmark Model B, the profit function of the conventional automobile manufacturer is π m B = ( p g c g ) q g , the demand function for GVs is q g = 1 p g . Substitute the demand function into the profit function, it is easy to verify that the manufacturer’s profit function is a concave function with respect to the price of GVs, i.e., ( π m B ) 2 p g 2 = 2 < 0 . Then we derive the optimal response function with respect to the GVs price p B * = 1 + c g 2 from the first-order condition of the profit function π m B p g = 0 . Substitute p g B * into q g = 1 p g , then we obtain the optimal sales quantity of GVs, namely q g B * = ( 1 c g ) 2 . Then we further obtain the optimal profit of manufacturer π m B * = ( 1 c g ) 2 4 , the optimal consumer surplus C S B * = ( 1 c g ) 2 8 , the optimal environmental impact E B * = e g ( 1 c g ) 2 and total social welfare S W B * = ( 1 c g ) [ 3 ( 1 c g ) 4 e g ] 8 .

Appendix B. Calculations of the Optimal Decisions in Model T

In the first stage, substitute the demand functions of EVs and GVs (i.e., q e = δ p g p e + B δ ( 1 δ ) and q g = 1 δ p g + p e B 1 δ ) into the profit function of the manufacturer π m T = ( p g c g ) q q + ( p e c e ) q e . Taking the second derivative of the profit function with respect to the EV price and the GV price, we can obtain ( π m T ) 2 p e 2 = 2 δ ( 1 δ ) , ( π m T ) 2 p g 2 = 2 1 δ , ( π m T ) 2 p e p g = 2 1 δ . Since the Hessian matrix | H | = 4 δ ( 1 δ ) > 0 , π m T is jointly concave in p e and p g . Using the first-order conditions π m T p e = 0 and π m T p g = 0 , we obtain the optimal response functions of prices of EVs and GVs p e T * = B + δ + c e 2 , p g T * = 1 + c g 2 . Substitute the optimal prices into demand functions respectively, then q e T * = B c e + δ c g 2 δ ( 1 δ ) and q g T * = 1 B δ + c e c g 2 ( 1 δ ) are obtained. We now have enough information to explore the optimal decisions of the manufacturer.
In the second stage, from the perspective of government, taking the second derivative of the social welfare with respect to the subsidy, we get ( S W T * ) 2 R 2 = 1 4 δ ( 1 δ ) < 0 , so there is a maximum social welfare. Using the first-order condition S W T * R = 0 , we can obtain the optimal subsidy R * = 2 ( δ e g e e ) c e + δ c g , then the maximum social welfare is ( 1 c g ) [ 3 ( 1 c g ) 4 e g ] 8 + ( c e δ c g + c e δ e g ) 2 2 δ ( 1 δ ) .

Appendix C. Proof of Proposition 1

Given the government subsidy R , Equation (20) denotes the optimal EV sales q e T * which is given by q e T * = R c e + δ c g 2 δ ( 1 δ ) . Thus, the manufacturer can benefit from the EVs production only if q e T * satisfies q e T * > 0 , namely R + δ c g c e > 0 .
Proposition 1 is demonstrated.

Appendix D. Proof of Corollary 1

According to Proposition 1, we denote R + δ c g c e > 0 as the threshold for the manufacturer entry into the EVs market, then we can derive R > R min = c e δ c g . From Equation (19), we denote the optimal decision for GVs sale as q g T * = 1 R δ + c e c g 2 ( 1 δ ) . Let q g T * > 0 , we can obtain R < 1 δ + c e c g . Besides, we can derive R < R max = min { 1 δ + c e c g , c e } from the assumption R < c e . Naturally, when 1 δ + c e c g < c e , R max = 1 δ + c e c g , then R max R min = ( 1 δ ) ( 1 c g ) > 0 is obtained. Similarly, when 1 δ + c e c g < c e , R max = c e , then R max R min = δ c g > 0 is obtained. Therefore, R max > R min always holds, then we can obtain the government subsidy range, i.e., R min < R < R max , where R min = c e δ c g and R max = min { 1 δ + c e c g , c e } .
Corollary 1 is demonstrated.

Appendix E. Proof of Proposition 2

According to the optimal decisions and the boundary condition R > R min = c e δ c g , we can obtain:
p g T * p g B * = 0 , q g T * q g B * = R c e + δ c g 2 ( 1 δ ) < 0 , π g T * π g B * = ( 1 c g ) ( R c e + δ c g ) 4 ( 1 δ ) < 0 , E g T * E g B * = ( R c e + δ c g ) e g 2 ( 1 δ ) < 0 , π m T * π m B * = ( R c e + δ c g ) 2 4 δ ( 1 δ ) > 0 , C S T * C S B * = ( R c e + δ c g ) 2 8 δ ( 1 δ ) > 0 and E T * E B * = ( R c e + δ c g ) ( e e δ e g ) 2 δ ( 1 δ ) . At that time e e δ e g < 0 , there was E T * < E B * .
Proposition 2 is demonstrated.

Appendix F. Proof of Proposition 3

In Model T, taking first-order partial derivative of the optimal product sales and price of EV and GV with respective to the variable δ , B , c e and c g , we can respectively obtain:
p e T * δ = 1 2 , p e T * R = 1 2 , p e T * c e = 1 2 and p e T * c g = 0 ; p g T * δ = 0 , p g T * R = 0 , p g T * c e = 0 and p g T * c g = 1 2 ; q e T * δ = R c e + c g 2 ( 1 δ ) 2 + c e R 2 δ 2 > 0 , q e T * R = 1 2 δ ( 1 δ ) > 0 and q e T * c g = 1 2 ( 1 δ ) > 0 ; q g T * δ = R c e + c g 2 ( 1 δ ) 2 < 0 , q g T * R = 1 2 ( 1 δ ) < 0 , q g T * c e = 1 2 ( 1 δ ) > 0 and q g T * c g = 1 2 ( 1 δ ) < 0 .
Proposition 3 is demonstrated.

Appendix G. Proof of Proposition 4

Based on Corollary 1 and the conditions c e + e e > c g + e g , we can obtain R c e + δ c g > 0 , 1 R δ + c e c g > 0 , and c e c g + e e e g > 0 . Taking first-order partial derivative of the optimal profit of EV and GV, car manufacturer’s total profits and consumer surplus with respective to the variable δ , R , c e and c g , we can respectively obtain:
C S T * δ = c g ( R c e + δ c g ) 4 ( 1 δ ) δ ( 1 2 δ ) ( R c e + δ c g ) 8 δ 2 ( 1 + δ ) 2 = ( ( 1 2 δ ) ( c e R ) + δ c g ) ( R c e + δ c g ) 8 δ 2 ( 1 δ ) 2 > 0 , C S T * R = R c e + δ c g 4 ( 1 δ ) δ > 0 , C S T * c e = R c e + δ c g 4 ( 1 δ ) δ < 0 and C S T * c g = 1 R δ + c e c g 4 ( 1 δ ) < 0 ; π m T * δ = c g ( R c e + δ c g ) 2 ( 1 δ ) δ ( 1 2 δ ) ( R c e + δ c g ) 4 δ 2 ( 1 + δ ) 2 = ( ( 1 2 δ ) ( c e R ) + δ c g ) ( R c e + δ c g ) 4 δ 2 ( 1 δ ) 2 > 0 , π m T * R = R c e + δ c g 2 ( 1 δ ) δ > 0 , π m T * c e = R c e + δ c g 2 ( 1 δ ) δ < 0 and π m T * c g = 1 R δ + c e c g 2 ( 1 δ ) < 0 ; π g T * δ = ( 1 c g ) ( R c e + c g ) 4 ( 1 + δ ) 2 < 0 , π g T * R = 1 c g 4 ( 1 δ ) < 0 , π g T * c e = 1 c g 4 ( 1 δ ) > 0 and π g T * c g = R 2 + δ c e + 2 c g 4 ( 1 δ ) < 0 ; π e T * R = 2 R 2 c e + δ + δ c g 4 δ ( 1 δ ) > 0 , π e T * c e = 2 R + δ 2 c e + δ c g 4 δ ( 1 δ ) < 0 , π e T * c g = R + δ c e 4 ( 1 δ ) > 0 and π e T * δ = R ( 2 R δ R + δ 2 ) ( 1 2 δ ) c e 2 + ( 1 + R ) δ 2 c g c e ( 4 R δ 2 R + δ 2 + δ 2 c g ) 4 δ 2 ( 1 δ ) 2 > 0 .
Proposition 4 is demonstrated.

Appendix H. Proof of Proposition 5

In Model T, taking the second order partial derivation of optimal social general welfare with respect to subsidies, we obtain ( S W T * ) 2 R 2 = 1 4 δ ( 1 δ ) < 0 . It indicates that the social general welfare S W T * is a strictly concave function with respect to R . There exists a maximum value of social welfare. Then, from the first-order optimality condition S W T * R = 0 , we can get the optimal subsidy R 0 = 2 ( δ e g e e ) c e + δ c g . Taking the first order partial derivative of R 0 with respect to parameters δ , c e , c g , e e and e g , we can obtain R 0 δ = c g + 2 e g > 0 , R 0 c e = 1 < 0 , R 0 c g = δ > 0 , R 0 e e = 2 < 0 and R 0 e g = 2 δ > 0 .
Proposition 5 is demonstrated.

Appendix I. Proof of Proposition 6

Given the government subsidy threshold range R min < R < R max , where R min = c e δ c g and R max = min { 1 δ + c e c g , c e } . Then R 0 = 2 ( δ e g e e ) c e + δ c g is obtained which can maximize social welfare, there are five conditions for its numerical distribution: (I) R 0 < R min ; (II) R 0 = R min ; (III) R min < R 0 < R max ; (IV) R 0 = R max ; (V) R 0 > R max .
When R 0 < R min , δ < c e + e e c g + e g is obtained, thus the government will set the optimal subsidy R * = R 0 , because R * < R min does not meet the boundary conditions of GV manufacturers entering the electric vehicle market, i.e., q e T * = 0 ; when R max < R 0 or R max = R 0 , min { 1 + 2 c e c g + 2 e e 1 + c g + 2 e g , 2 ( c e + e e ) c g + 2 e g } δ < 1 is obtained, then government set the subsidy as R * = R 0 where q g T * = 0 which cannot be accepted by the manufacturer. Therefore, when 0 < δ c e + e e c g + e g min { 1 + 2 c e c g + 2 e e 1 + c g + 2 e g , 2 ( c e + e e ) c g + 2 e g } δ < 1 , R * = 0 will be the government’s optimal decision. When R min < R 0 < R max , i.e., c e + e e c g + e g < δ < min { 1 + 2 c e c g + 2 e e 1 + c g + 2 e g , 2 ( c e + e e ) c g + 2 e g } , the government’s optimal decision will be R * = R 0 which satisfies the threshold of EV production and can motivate the auto manufacturer enter into the EV market. Thus, under Model T, there are only two settings of government decision, i.e., R * = 0 and R * = R 0 .
Proposition 6 is demonstrated.

Appendix J. Proof of Proposition 7

When R * = 0 , the social welfare S W T * | ( R = 0 ) = S W B * = ( 1 c g ) [ 3 ( 1 c g ) 4 e g ] 8 ; when R * = R 0 , substitute S W T into S W T * | ( R = R 0 ) = ( 1 c g ) [ 3 ( 1 c g ) 4 e g ] 8 + ( c e δ c g + c e δ e g ) 2 2 δ ( 1 δ ) , then S W T * | ( R = R 0 ) S W B * = ( c e δ c g + c e δ e g ) 2 2 δ ( 1 δ ) > 0 is obtained.
Proposition 7 is demonstrated.

References

  1. Wang, K.; Zhao, Y.; Cheng, Y.; Choi, T.-M. Cooperation or competition? Channel choice for a remanufacturing fashion supply chain with government subsidy. Sustainability 2014, 6, 7292–7310. [Google Scholar] [CrossRef]
  2. Egbue, O.; Long, S. Barriers to widespread adoption of electric vehicles: An analysis of consumer attitudes and perceptions. Energy Policy 2012, 48, 717–729. [Google Scholar] [CrossRef]
  3. Romm, J. The car and fuel of the future. Energy Policy 2006, 34, 2609–2614. [Google Scholar] [CrossRef]
  4. Graham-Rowe, E.; Gardner, B.; Abraham, C.; Skippon, S.; Dittmar, H.; Hutchins, R.; Stannard, J. Mainstream consumers driving plug-in battery-electric and plug-in hybrid electric cars: A qualitative analysis of responses and evaluations. Transp. Res. Part A Policy Pract. 2012, 46, 140–153. [Google Scholar] [CrossRef]
  5. Gu, H.; Liu, Z.; Qing, Q. Optimal electric vehicle production strategy under subsidy and battery recycling. Energy Policy 2017, 109, 579–589. [Google Scholar] [CrossRef]
  6. Consumer Acceptance of Electric Vehicles in the US. Available online: https://www.epa.gov/sites/production/files-/2014-09/documents/kodjak121312.pdf (accessed on 15 October 2017).
  7. Wang, S.; Li, J.; Zhao, D. The impact of policy measures on consumer intention to adopt electric vehicles: Evidence from China. Transp. Res. Part A Policy Pract. 2017, 105, 14–26. [Google Scholar] [CrossRef]
  8. Zhang, X.; Wang, K.; Hao, Y.; Fan, J.-L.; Wei, Y.-M. The impact of government policy on preference for NEVs: The evidence from China. Energy Policy 2013, 61, 382–393. [Google Scholar] [CrossRef]
  9. Li, W.; Long, R.; Chen, H. Consumers’ evaluation of national new energy vehicle policy in China: An analysis based on a four paradigm model. Energy Policy 2016, 99, 33–41. [Google Scholar] [CrossRef]
  10. Li, S.; Liu, Y.; Wang, J. Factors Affecting the Electric Vehicle Demonstration: 14 International Cities/Regions Cases. In Proceedings of the 2015 International Conference on Logistics, Informatics and Service Sciences (LISS), Barcelona, Spain, 27–29 July 2015; IEEE: Piscataway, NJ, USA, 2015; pp. 1–7. [Google Scholar]
  11. Yenipazarli, A. Managing new and remanufactured products to mitigate environmental damage under emissions regulation. Eur. J. Oper. Res. 2016, 249, 117–130. [Google Scholar] [CrossRef]
  12. Lin, B.; Wu, W. Why people want to buy electric vehicle: An empirical study in first-tier cities of China. Energy Policy 2018, 112, 233–241. [Google Scholar] [CrossRef]
  13. China Automobile Industry Yearbook. Available online: http://www.auto-stats.org.cn/default.asp (accessed on 30 October 2017).
  14. Wang, N.; Pan, H.; Zheng, W. Assessment of the incentives on electric vehicle promotion in China. Transp. Res. Part A Policy Pract. 2017, 101, 177–189. [Google Scholar] [CrossRef]
  15. Zhang, G.; Xu, Y.; Zhang, J. Consumer-oriented policy towards diffusion of electric vehicles: City-level evidence from China. Sustainability 2016, 8, 1343. [Google Scholar] [CrossRef]
  16. Rajeev, A.; Pati, R.K.; Padhi, S.S.; Govindan, K. Evolution of sustainability in supply chain management: A literature review. J. Clean. Prod. 2017, 162, 299–314. [Google Scholar] [CrossRef]
  17. Centobelli, P.; Cerchione, R.; Esposito, E. Developing the WH2 framework for environmental sustainability in logistics service providers: A taxonomy of green initiatives. J. Clean. Prod. 2017, 165, 1063–1077. [Google Scholar] [CrossRef]
  18. Centobelli, P.; Cerchione, R.; Esposito, E. Environmental Sustainability and Energy-Efficient Supply Chain Management: A Review of Research Trends and Proposed Guidelines. Energies 2018, 11, 275. [Google Scholar] [CrossRef]
  19. Centobelli, P.; Cerchione, R.; Esposito, E. Environmental sustainability in the service industry of transportation and logistics service providers: Systematic literature review and research directions. Transp. Res. Part D Transp. Environ. 2017, 53, 454–470. [Google Scholar] [CrossRef]
  20. Correia, E.; Carvalho, H.; Azevedo, S.G.; Govindan, K. Maturity models in supply chain sustainability: A systematic literature review. Sustainability 2017, 9, 64. [Google Scholar] [CrossRef]
  21. Rolim, C.C.; Gonçalves, G.N.; Farias, T.L.; Rodrigues, Ó. Impacts of electric vehicle adoption on driver behavior and environmental performance. Procedia-Soc. Behav. Sci. 2012, 54, 706–715. [Google Scholar] [CrossRef]
  22. Hawkins, T.R.; Gausen, O.M.; Strømman, A.H. Environmental impacts of hybrid and electric vehicles—A review. Int. J. LCA 2012, 17, 997–1014. [Google Scholar] [CrossRef]
  23. Hawkins, T.R.; Singh, B.; Majeau-Bettez, G.; Strømman, A.H. Comparative environmental life cycle assessment of conventional and electric vehicles. J. Ind. Ecol. 2013, 17, 53–64. [Google Scholar] [CrossRef]
  24. He, L.-Y.; Chen, Y. Thou shalt drive electric and hybrid vehicles: Scenario analysis on energy saving and emission mitigation for road transportation sector in China. Transp. Policy 2013, 25, 30–40. [Google Scholar] [CrossRef]
  25. Garcia, R.; Freire, F. A review of fleet-based life-cycle approaches focusing on energy and environmental impacts of vehicles. Renew. Sustain. Energy Rev. 2017, 79, 935–945. [Google Scholar] [CrossRef]
  26. Ma, Y.; Ke, R.-Y.; Han, R.; Tang, B.-J. The analysis of the battery electric vehicle’s potentiality of environmental effect: A case study of Beijing from 2016 to 2020. J. Clean. Prod. 2017, 145, 395–406. [Google Scholar] [CrossRef]
  27. Faria, R.; Marques, P.; Moura, P.; Freire, F.; Delgado, J.; de Almeida, A.T. Impact of the electricity mix and use profile in the life-cycle assessment of electric vehicles. Renew. Sustain. Energy Rev. 2013, 24, 271–287. [Google Scholar] [CrossRef]
  28. Chatzikomis, C.; Spentzas, K.; Mamalis, A. Environmental and economic effects of widespread introduction of electric vehicles in Greece. Eur. Transp. Res. Rev. 2014, 6, 365–376. [Google Scholar] [CrossRef]
  29. Shafiei, E.; Leaver, J.; Davidsdottir, B. Cost-effectiveness analysis of inducing green vehicles to achieve deep reductions in greenhouse gas emissions in New Zealand. J. Clean. Prod. 2017, 150, 339–351. [Google Scholar] [CrossRef]
  30. Fernández, R.Á. A more realistic approach to electric vehicle contribution to greenhouse gas emissions in the city. J. Clean. Prod. 2018, 172, 949–959. [Google Scholar] [CrossRef]
  31. Sgouridis, S.; Helmers, E.; Al Hadhrami, M. Light-duty electric vehicles in the gulf? Techno-economic assessment and policy implications. Int. J. Sustain. Transp. 2018, 12, 92–106. [Google Scholar] [CrossRef]
  32. Kiani, A. Electric vehicle market penetration impact on transport-energy-greenhouse gas emissions nexus: A case study of United Arab Emirates. J. Clean. Prod. 2017, 168, 386–398. [Google Scholar] [CrossRef]
  33. Braun, A.; Rid, W. Assessing driving pattern factors for the specific energy use of electric vehicles: A factor analysis approach from case study data of the Mitsubishi i–MiEV minicar. Transp. Res. Part D Transp. Environ. 2018, 58, 225–238. [Google Scholar] [CrossRef]
  34. Yang, J.; Dong, J.; Lin, Z.; Hu, L. Predicting market potential and environmental benefits of deploying electric taxis in Nanjing, China. Transp. Res. Part D Transp. Environ. 2016, 49, 68–81. [Google Scholar] [CrossRef]
  35. Hao, H.; Cheng, X.; Liu, Z.; Zhao, F. Electric vehicles for greenhouse gas reduction in China: A cost-effectiveness analysis. Transp. Res. Part D Transp. Environ. 2017, 56, 68–84. [Google Scholar] [CrossRef]
  36. Wu, Y.; Zhang, L. Can the development of electric vehicles reduce the emission of air pollutants and greenhouse gases in developing countries? Transp. Res. Part D Transp. Environ. 2017, 51, 129–145. [Google Scholar] [CrossRef]
  37. Jochem, P.; Doll, C.; Fichtner, W. External costs of electric vehicles. Transp. Res. Part D Transp. Environ. 2016, 42, 60–76. [Google Scholar] [CrossRef]
  38. Bauer, G. The impact of battery electric vehicles on vehicle purchase and driving behavior in Norway. Transp. Res. Part D Transp. Environ. 2018, 58, 239–258. [Google Scholar] [CrossRef]
  39. Sierzchula, W.; Bakker, S.; Maat, K.; van Wee, B. The influence of financial incentives and other socio-economic factors on electric vehicle adoption. Energy Policy 2014, 68, 183–194. [Google Scholar] [CrossRef]
  40. Turrentine, T.S.; Kurani, K.S. Car buyers and fuel economy? Energy Policy 2007, 35, 1213–1223. [Google Scholar] [CrossRef]
  41. Lutsey, N.; Searle, S.; Chambliss, S.; Bandivadekar, A. Assessment of Leading Electric Vehicle Promotion Activities in United States Cities; International Council on Clean Transportation: Washington, DC, USA, 2015; Available online: https://www.theicct.org/sites/default/files/publications/ICCT_EV-promotion-US-ities_20150729.pdf (accessed on 30 October 2017).
  42. Bjerkan, K.Y.; Nørbech, T.E.; Nordtømme, M.E. Incentives for promoting battery electric vehicle (BEV) adoption in Norway. Transp. Res. Part D Transp. Environ. 2016, 43, 169–180. [Google Scholar] [CrossRef]
  43. Olson, E.L. Lead market learning in the development and diffusion of electric vehicles. J. Clean. Prod. 2018, 172, 3279–3288. [Google Scholar] [CrossRef]
  44. Kontou, E.; Yin, Y.; Lin, Z.; He, F. Socially optimal replacement of conventional with electric vehicles for the US household fleet. Int. J. Sustain. Transp. 2017, 11, 749–763. [Google Scholar] [CrossRef]
  45. Wang, N.; Yan, R. Research on Consumers’ Use Willingness and Opinions of Electric Vehicle Sharing: An Empirical Study in Shanghai. Sustainability 2016, 8, 7. [Google Scholar] [CrossRef]
  46. Wang, Z.; Zhao, C.; Yin, J.; Zhang, B. Purchasing intentions of Chinese citizens on new energy vehicles: How should one respond to current preferential policy? J. Clean. Prod. 2017, 161, 1000–1010. [Google Scholar] [CrossRef]
  47. Diamond, D. The impact of government incentives for hybrid-electric vehicles: Evidence from US states. Energy Policy 2009, 37, 972–983. [Google Scholar] [CrossRef]
  48. Wang, F.-P.; Yu, J.-L.; Yang, P.; Miao, L.-X.; Ye, B. Analysis of the Barriers to Widespread Adoption of Electric Vehicles in Shenzhen China. Sustainability 2017, 9, 522. [Google Scholar] [CrossRef]
  49. He, H.; Fan, J.; Li, Y.; Li, J. When to switch to a hybrid electric vehicle: A replacement optimisation decision. J. Clean. Prod. 2017, 148, 295–303. [Google Scholar] [CrossRef]
  50. Kieckhäfer, K.; Wachter, K.; Spengler, T.S. Analyzing manufacturers’ impact on green products’ market diffusion–the case of electric vehicles. J. Clean. Prod. 2017, 162, S11–S25. [Google Scholar] [CrossRef]
  51. Zhang, X. Reference-dependent electric vehicle production strategy considering subsidies and consumer trade-offs. Energy Policy 2014, 67, 422–430. [Google Scholar] [CrossRef]
  52. Chocteau, V.; Drake, D.; Kleindorfer, P.R.; Orsato, R.; Roset, A. Collaborative Innovation for Sustainable Fleet Operations: The Electric Vehicle Adoption Decision; INSEAD: Fontainebleau, France, 2011. [Google Scholar]
  53. Junquera, B.; Moreno, B.; Álvarez, R. Analyzing consumer attitudes towards electric vehicle purchasing intentions in Spain: Technological limitations and vehicle confidence. Technol. Forecast. Soc. 2016, 109, 6–14. [Google Scholar] [CrossRef]
  54. Struben, J.; Sterman, J.D. Transition challenges for alternative fuel vehicle and transportation systems. Environ. Plan. B Plan. Des. 2008, 35, 1070–1097. [Google Scholar] [CrossRef]
  55. Ferguson, M.; Mohamed, M.; Higgins, C.D.; Abotalebi, E.; Kanaroglou, P. How open are Canadian households to electric vehicles? A national latent class choice analysis with willingness-to-pay and metropolitan characterization. Transp. Res. Part D Transp. Environ. 2018, 58, 208–224. [Google Scholar] [CrossRef]
  56. Smith, B.; Olaru, D.; Jabeen, F.; Greaves, S. Electric vehicles adoption: Environmental enthusiast bias in discrete choice models. Transp. Res. Part D Transp. Environ. 2017, 51, 290–303. [Google Scholar] [CrossRef]
  57. Degirmenci, K.; Breitner, M.H. Consumer purchase intentions for electric vehicles: Is green more important than price and range? Transp. Res. Part D Transp. Environ. 2017, 51, 250–260. [Google Scholar] [CrossRef]
  58. Pettifor, H.; Wilson, C.; McCollum, D.; Edelenbosch, O. Modelling social influence and cultural variation in global low-carbon vehicle transitions. Glob. Environ. Chang. 2017, 47, 76–87. [Google Scholar] [CrossRef]
  59. She, Z.-Y.; Sun, Q.; Ma, J.-J.; Xie, B.-C. What are the barriers to widespread adoption of battery electric vehicles? A survey of public perception in Tianjin, China. Transp. Policy 2017, 56, 29–40. [Google Scholar] [CrossRef]
  60. Eppstein, M.J.; Grover, D.K.; Marshall, J.S.; Rizzo, D.M. An agent-based model to study market penetration of plug-in hybrid electric vehicles. Energy Policy 2011, 39, 3789–3802. [Google Scholar] [CrossRef]
  61. Letmathe, P.; Suares, M. A consumer-oriented total cost of ownership model for different vehicle types in Germany. Transp. Res. Part D Transp. Environ. 2017, 57, 314–335. [Google Scholar] [CrossRef]
  62. Wu, G.; Inderbitzin, A.; Bening, C. Total cost of ownership of electric vehicles compared to conventional vehicles: A probabilistic analysis and projection across market segments. Energy Policy 2015, 80, 196–214. [Google Scholar] [CrossRef]
  63. Dimitropoulos, A.; Rietveld, P.; Van Ommeren, J.N. Consumer valuation of changes in driving range: A meta-analysis. Transp. Res. Part A Policy Pract. 2013, 55, 27–45. [Google Scholar] [CrossRef]
  64. Franke, T.; Günther, M.; Trantow, M.; Krems, J.F. Does this range suit me? Range satisfaction of battery electric vehicle users. Appl. Ergon. 2017, 65, 191–199. [Google Scholar] [CrossRef] [PubMed]
  65. Li, Q.; Long, R.; Chen, H.; Geng, J. Low Purchase Willingness for Battery Electric Vehicles: Analysis and Simulation Based on the Fault Tree Model. Sustainability 2017, 9, 809. [Google Scholar]
  66. Qian, L.; Yin, J. Linking Chinese cultural values and the adoption of electric vehicles: The mediating role of ethical evaluation. Transp. Res. Part D Transp. Environ. 2017, 56, 175–188. [Google Scholar] [CrossRef]
  67. Al-Alawi, B.M.; Bradley, T.H. Review of hybrid, plug-in hybrid, and electric vehicle market modeling studies. Renew. Sustain. Energy Rev. 2013, 21, 190–203. [Google Scholar] [CrossRef]
  68. Huang, J.; Leng, M.; Liang, L.; Liu, J. Promoting electric automobiles: Supply chain analysis under a government’s subsidy incentive scheme. IIE Trans. 2013, 45, 826–844. [Google Scholar] [CrossRef]
  69. Luo, C.; Leng, M.; Huang, J.; Liang, L. Supply chain analysis under a price-discount incentive scheme for electric vehicles. Eur. J. Oper. Res. 2014, 235, 329–333. [Google Scholar] [CrossRef] [Green Version]
  70. Shao, L.; Yang, J.; Zhang, M. Subsidy scheme or price discount scheme? Mass adoption of electric vehicles under different market structures. Eur. J. Oper. Res. 2017, 262, 1181–1195. [Google Scholar] [CrossRef]
  71. Liu, Z.; Tang, J.; Li, B.-Y.; Wang, Z. Trade-off between remanufacturing and recycling of WEEE and the environmental implication under the Chinese Fund Policy. J. Clean. Prod. 2017, 167, 97–109. [Google Scholar] [CrossRef]
  72. Cowan, R.; Hultén, S. Escaping lock-in: The case of the electric vehicle. Technol. Forecast. Soc. 1996, 53, 61–79. [Google Scholar] [CrossRef]
  73. Nykvist, B.; Nilsson, M. Rapidly falling costs of battery packs for electric vehicles. Nat. Clim. Chang. 2015, 5, 329–332. [Google Scholar] [CrossRef]
  74. Agrawal, V.V.; Ferguson, M.; Toktay, L.B.; Thomas, V.M. Is leasing greener than selling? Manag. Sci. 2012, 58, 523–533. [Google Scholar] [CrossRef]
  75. Mussa, M.; Rosen, S. Monopoly and product quality. J. Econ. Theory 1978, 18, 301–317. [Google Scholar] [CrossRef]
  76. Örsdemir, A.; Kemahlıoğlu-Ziya, E.; Parlaktürk, A.K. Competitive quality choice and remanufacturing. Prod. Oper. Manag. 2014, 23, 48–64. [Google Scholar] [CrossRef]
  77. MacKay, D. Sustainable Energy-without the Hot Air; UIT Cambridge: Cambridge, UK, 2008. [Google Scholar]
Figure 1. Technology Roadmap.
Sustainability 10 00672 g001
Figure 2. Behaviors of heterogeneous consumers in different models: (a) Model B; (b) Model T.
Sustainability 10 00672 g002
Figure 3. The impact of government subsidy on the sensitivities of equilibrium solutions on consumer acceptance: (a) Optimal prices and sales quantity; (b) The optimal total profit of the manufacture, EV profits, and GV profits; (c) The optimal consumer surplus, total environmental impact, government expenditure and total social welfare.
Sustainability 10 00672 g003
Figure 4. The impact of government subsidy on the sensitivities of equilibrium solutions on the production cost of EVs: (a) The optimal prices and sales quantity; (b) The optimal total profit of the manufacturer, EV profits, and gasoline vehicle (GV) profits; (c) The optimal consumer surplus, total environmental impact, government expenditure and total social welfare.
Sustainability 10 00672 g004
Figure 5. The sensitivities of equilibrium solutions on government subsidies: (a) The optimal prices and sales quantity; (b) The optimal total profits of the manufacturer, EV profits, and GV profits; (c) The optimal consumer surplus, total environmental impact, government expenditure, and total social welfare.
Sustainability 10 00672 g005
Table 1. Electric vehicle (EV) subsidy policy adopted by central and local governments in 2016 and 2017 [12].
100 km ≤ R < 150 km150 km ≤ R < 250 kmR ≥ 250 km
201620172016201720162017
Central government subsidy (yuan)25,00020,00045,00036,00055,00044,000
BeijingLocal subsidy (yuan)25,00010,00045,00018,00055,00022,000
Total subsidy (yuan)50,00030,00090,00054,000110,00066,000
ShanghaiLocal subsidy (yuan)10,00010,00030,00018,00030,00022,000
Total subsidy (yuan)35,00030,00075,00054,00085,00066,000
GuangzhouLocal subsidy (yuan)25,00010,00045,00018,00055,00022,000
Total subsidy (yuan)50,00030,00090,00054,000110,00066,000
ShenzhenLocal subsidy (yuan)35,00010,00050,00018,00060,00022,000
Total subsidy (yuan)60,00030,00095,00054,000115,00066,000
Table 2. Comparison of EV papers by Triple Bottom Line (TBL) and methodology.
Authors, Year(The Triple Bottom Line) TBLMethodology
Environmental PerformanceEconomic PerformanceSocial Performance(WTP)
High or UncertainLow (China)
Rolim et al., 2012 [21]Case study
Hawkins et al., 2012 [22]Literature review
Hawkins et al., 2013 [23]Life cycle assessment
He and Chen, 2013 [24]Long-rang energy alternative Planning
Garcia and Freire, 2017 [25]Literature review
Ma et al., 2016 [26]Case study
Faria et al., 2013 [27]Life cycle assessment
Chatzikomis et al., 2014 [28]Life cycle assessment
Shafiei et al., 2017 [29]Simulation-based comparative analysis
Fernández, 2018 [30]A new approach
Sgouridis et al., 2018 [31]A diffusion model
Kiani, 2017 [32]Long range energy alternative planning
Braun and Rid, 2018 [33]A factor analysis approach
Yang et al., 2016 [34]Simulation-optimization model
Hao et al., 2017 [35]Life cycle assessment
Wu and Zhang, 2017 [36]Life cycle assessment
Jochem et al., 2016 [37]Empirical study
Bauer, 2018 [38]Logistic and linear regression
Sierzchula et al., 2012 [39]Linear regression analysis
Turrentine and Kurani, 2007 [40]Interview and data analysis
Lutsey et al., 2015 [41]Statistical analysis
Bjerkan et al., 2016 [42]Interview and data analysis
Olson, 2018 [43]Consumer survey
Kontou et al., 2017 [44]Non-linear programming
Zhang, Xu and Zhang [15]Empirical study
Wang and Yan, 2015 [45]Empirical study
Wang et al., 2017 [46]Structural equation model
Diamond, 2008 [47]Cross-sectional analysis
Zhang et al., 2013 [8]Questionnaire survey
Wang et al., 2017 [48]Statistical model
He et al., 2017 [49]Empirical study
Kieckhäfer et al., 2017 [50]System dynamics model
Zhang, 2014 [51]Newsvendor model
Gu et al., 2017 [5]Newsvendor model
Chocteau et al., 2011 [52]Cooperative game
Junquera et al., 2016 [53]Consumers survey and regression analysis
Struben and Sterman, 2008 [54]Dynamic model
Ferguson et al., 2018 [55]Consumer survey
Smith et al., 2017 [56]Consumer survey
Degirmenci and Breitner, 2017 [57]Consumer survey
Pettifor et al., 2017 [58]Empirical study
She et al., 2017 [59]Questionnaire survey
Eppstein et al., 2011 [60]Agent-based modeling
Letmathe and Suares, 2017 [61]consumer-oriented total cost of ownership model
Wu et al., 2015 [62]Probabilistic analysis
Dimitropoulos et al., 2013 [63]Meta-analysis
Franke et al., 2017 [64]Contrast and regression analysis
Li et al., 2017 [65]Fault tree analysis method
Qian and Yin, 2017 [66]Consumer survey
Al-Alawi and Bradley, 2013 [67]Literature review
Huang et al., 2012 [68]Generalized Nash Bargaining
Luo et al., 2013 [69]Generalized Nash Bargaining
Shao et al., 2017 [70]Stackelberg game
This paperStackelberg game
Note: ● indicates that the literature focuses on the corresponding performance type.
Table 3. Notations of the models.
SymbolDefinition
θ The consumer’s willingness to pay (WTP) for GVs
δ The consumer’s acceptance of EVs, where δ < 1
c g / c e Unit production cost of GVs/EVs
e g / e e Per-unit environmental impact of GVs/EVs
q g / q e The quantity of GVs/EVs
U g / U e The utility from purchasing GVs/EVs
G The total government expenditure
C S The consumer surplus
S W The social welfare
π m The profit of the vehicle manufacturer
E The total environmental impact
Decision variables
R Subsidy given by the government to EV buyers and R < c e
p g / p e Unit retail price of GVs/EVs set by the manufacturer
Superscripts
B The benchmark model
T The two-stage game model

