Public Perceptions and Willingness to Pay for Renewable Energy: A Case Study from Greece
by
 , ,
, ,
Stamatios Ntanos
1,* ,
,
Grigorios Kyriakopoulos
2 ,
,
Miltiadis Chalikias
3,
Garyfallos Arabatzis
1 and
Michalis Skordoulis
1 1
Department of Forestry and Management of the Environment and Natural Resources, School of Agricultural and Forestry Sciences, Democritus University of Thrace, 68200 Orestiada, Greece
2
School of Electrical and Computer Engineering, National Technical University of Athens, 15780 Zografou, Greece
3
Department of Business Administration, School of Business and Economics, Piraeus University of Applied Sciences, 12244 Aigaleo, Greece
*
Author to whom correspondence should be addressed.
Sustainability 2018, 10(3), 687; https://doi.org/10.3390/su10030687
Submission received: 31 January 2018
/
Revised: 25 February 2018
/
Accepted: 1 March 2018
/
Published: 3 March 2018
(This article belongs to the Special Issue Sustainable Development of Electrical Energy Storage Technologies in Energy Production)
Abstract
:The purpose of this study is to discover the factors shaping public opinion about renewable energy sources and investigate willingness to pay for expansion of renewable energy sources in the electricity mix. Data was collected through a questionnaire applied in Nikaia, an urban municipality of Greece. The respondents have a positive attitude towards renewable energy systems. Most of them have good knowledge of solar and wind energy systems and are using solar water heating, while several respondents own a solar PV system. Environmental protection is seen as the most important reason for investing in a renewable energy system. Willingness to pay for a wider penetration of RES into the electricity mix was estimated to be 26.5 euros per quarterly electricity bill. The statistical analysis revealed the existence of a relationship between RES perceived advantages and willingness to pay for renewable energy. Furthermore, by using a binary logit model, willingness to pay was found to be positively associated with education, energy subsidies, and state support.
1. Introduction
Life is directly linked to the quality of the natural environment and the availability of natural resources. Environment and life are interdependent concepts. Maintaining a balance in the world ecosystem is a basic prerequisite for preserving life. The atmosphere of our planet is a valuable and sensitive resource to be protected. On the contrary, undesirable inflows into the ecosystem, caused by anthropogenic activity, can shake this harmony and degrade living conditions [1]. Human influence on the environment is increasing due to mass production of technological goods [2], intensification of agriculture [3], the rapid rate of urbanization, and growing demand of fossil fuels for energy and transport [4]. According to data from the International Energy Agency, between 1971–2014, global primary energy consumption has increased by 2.5 times, as from 5.5 GTOE in 1971 to 13.7 GTOE for 2014 [5]. Over the same period, carbon dioxide emissions (hereinafter CO2) have doubled. Climate change poses a significant environmental, social, and economic threat [6]. The increase in anthropogenic carbon emissions is linked to global warming. Scientists point out that CO2 concentration in the atmosphere has significantly increased over the last century, compared to relatively stable levels of the pre-industrial era [7]. Since 1751, about 400 billion tons of coal have been released into the atmosphere due to fossil fuel combustion and cement production. Half of those CO2 emissions were added since the late 1980s [8]. There are scientific publications from the early 1970s, calling for actions to control CO2 emissions. Dyson [9], estimated that fossil fuel combustion adds 5 × 10⁹ tons of CO2 annually, of which, about half remain in the atmosphere. Bach [10] reported that the upward trend in global population, energy consumption, and economic activity contributes to climate change. He estimated that the average temperature would rise by about 1.5 °C to 3 °C by 2050, due to the increase of anthropogenic CO2 emissions. Garret [11], calculated that the global temperature will increase between 2 °C (optimistic scenario) and 4 °C (pessimistic scenario), by the year 2100, compared to the average temperature of the Industrial Revolution era. Recent estimates of the Intergovernmental Conference on Climate Change point out that we are close to exceeding the 2 °C global warming threshold [12].
The phenomenon of the ever-increasing environmental burden due to the rising trend in energy demand has turned environmental research interest on energy management and renewable energy sources. There has already been a remarkable shift of developed countries towards green growth due to their commitment to the Kyoto Protocol and the Paris Agreement [13], which is favored by broad public access to environmental information [14]. There is a need for wider penetration of renewable energy sources (hereinafter RES), to achieve the Paris Agreement target of limiting temperature increase to only 1.5 °C above the pre-industrial levels. Therefore, in the context of the implementation of ‘sustainable development’, green investments in the energy sector have significantly evolved, especially during recent years. Greece, for the period of 2006–2016, has managed to double the share of renewables in final energy consumption, from 7.2% to 15.2%. For the power generation sector, the participation of RES is higher, as in 2016 it reached 30% for the European Union, while in Greece, the corresponding figure is 23.8% [15]. The concept of ‘social acceptance’ is used to assess the degree of readiness of citizens to accept renewable energy investments in their area [16,17]. According to another study, ‘social acceptance’ is a measure of the active or passive attitude of citizens towards different green technologies or products [18]. Under social acceptance, a body of literature also explores willingness to pay for greener electricity. Many studies from Greece reflect positive public attitudes towards various forms of renewable energy and social responsible actions [19,20,21], although only a few Greek studies access willingness to pay.
Within this research framework, the scope of this paper is to address the social and economic dimensions of renewable energy sources for an urban area of Greece, with two main research aims: (a) the examination of public perceptions about RES and (b) the estimation of willingness to pay (hereinafter WTP) for a greater expansion of RES into the Greek energy mix. The area of Nikaia was selected for the study, a densely populated municipality near the capital of Greece, Athens. The ambient air condition in Athens, is heavily burdened by traffic load, heating applications, and industrial facilities [22]. Furthermore, all previous Greek studies on WTP for renewables took place in semi-urban or rural areas of the Greek province, where severe environmental problems are less noticeable to the residents.
2. Literature Review
Social acceptance of green investments is monitored at both national and local levels, as it has been observed that citizens’ attitudes may vary, not only between countries but also between regional entities of the same country [23,24,25]. The leaders in renewable energy production are Denmark and Germany. In the latter, more than 42% of electricity generation is produced by renewable sources [26]. In South Korea, active ecological awareness has been reported among citizens; most of them support policies which promote renewable forms of energy that remain state-owned [27]. In parallel, both the federal and the state US regulations are further motivating consumers through tax credits and discounts, so that the energy end-users can install solar energy systems [28]. In Portugal, there is a positive attitude towards innovative RES investments, and this social behavior is more pronounced for solar projects and new hydropower units [29]. The countries with the largest installed photovoltaic rated power are Germany, Italy, USA, China, Japan, Spain, France, Belgium, Australia, and the Czech Republic. These countries are mainly drawing their energy policies upon KWh guaranteed prices (FiT), low bank lending rates, national solar development goals, and tax reductions [30]. In the Netherlands, volunteers and local authorities play a very important role in the technological spur and large-scale applicability of photovoltaics [31].
Contrarily, an important factor that inhibits the wider adoption of RES-based energy systems, apart from the high cost of infrastructure, is the lack of publicly shared information and the behavior of citizens against RES technological advancements [14]. This social behavior has mainly been observed in economically developing regions or countries. Lack of information was reported in residents of rural, suburban, and urban areas in the Chinese context [32]. Another study was deployed in the Malaysian context, about views and perceptions of the local population towards solar energy and the installation of photovoltaics; it was concluded that the Malaysians hardly understood the incentives and the wider socio-economic benefits derived, thus they were reluctant to invest in photovoltaics [33]. Additionally, in the Middle East and North Africa, the attribute of social opposition was reported among interviewed citizens, since they expressed a biased behavior, significantly distorting anything that tends to become socially acceptable [34]. On the other hand, a study about the social acceptance of small hydropower plants (SHP) in India revealed that SHP projects are regionally challenging forms that can be directly utilized in the Indian energy mix of production [35].
Apart from social acceptance, many studies focus on the economic amount a consumer is prepared to pay for further expansion of RES in their area of residence, which is defined as willingness to pay (WTP). For estimation of the economic value that an individual hypothetically assigns to a non-market good, such as WTP for renewable energy, the contingent valuation method (CVM), is commonly used [36]. In this method, the respondent is directly asked usually through a questionnaire survey, to state his preference [36]. A positive relation has already been identified between WTP, income, and level of information [37,38]. In a study examining attitudes towards RES, Australian tourists were willing to pay 1–5% more for the existence of renewable energy systems within their accommodation units [39]. For the case of Sweden, by using binary logistic regression, it was found that people with increased environmental awareness are more likely to accept renewable energy [40]. Comparable results were proved, by a study on the factors influencing WTP for green electricity, noticing that a proactive attitude towards environmental issues can lead to a higher level of economic participation [41]. A study from China revealed that household income, knowledge of renewable energy, and education are positively associated with WTP, while age and perception of neighbors’ non-participation have a negative impact on WTP [16].
Willingness to pay for renewable energy with the CVM method, has been estimated at 17 USD/household/month for Japan [42]; 4.24 USD/household/month for North Carolina, USA [43]; 14 USD/household/month for New Mexico, USA [44]; 2.7–3.3/household/month for Beijing, China [45]; 13–16 USD/household/month for Australia [46]; 2.3–4.3/household/month for Italy [47]; and 4.1 USD/household/month for Slovenia [48].
Under an economic view, RES expansion in Greece can lead to benefits estimated to be 4.9 euros/MWh and 4.4 euros/MWh for electricity produced from solar p/v’s and biomass power stations, respectively. Economic benefits of 1.9 euros/MWh and 1.8 euros/MWh were also attributed to wind farms and hydropower plants electricity production [49]. Furthermore, in a study accessing Greek households WTP for greener electricity, evidence of positive association was found with income, level of information, and awareness on green investments [19]. In a relevant empirical study about tourists’ WTP for renewable energy in the island of Crete, in Greece, positive association was found between the respondents’ age, information status about RES, and previous experience by using a logit model [50]. In a study concerning WTP for biofuels expansion at the area of Thrace, in northern Greece, most of the car owners who took part in the survey, were willing to use biofuels and accept an increased cost of 0.079 €/L [51].
The significance of the energy sector in Greece, which is a developed country under a severe economic crisis since 2009, has also attracted a wider scientific interest covering:
- the applicability of enhanced exploitation of renewables [52];
- the spur of novel technologies upon electrical energy storage in electricity generation [53];
- the socio-cultural value of energy production as a common good that must be instilled in the secondary education systems [54];
- and the ongoing controversy between ecological, economic, and financial environment in Greece, since national policies should be oriented to ‘green fiscal policies’. Greek national policy must be compatible with relevant European reports. National environmental policy should align with the restructuring of the community framework for the taxation of energy products, which draws the transition from income taxes towards a system based on the principle that payment should burden those who consume more energy and produce more air pollutants [58,59].
3. Materials and Methods
A questionnaire survey was conducted in Nikaia, which is situated in the western sector of Attica and has a population of 89,380 permanent residents, according to the 2011 census. Data was collected between November and December 2016. The method of random stratified sampling was used [60]. The stratification is carried out at municipality level, using the list of registered voters as the sampling frame. By using the electoral catalogues, we ensured that the sampling units are adults, residents of the municipality of Nikaia. The municipality of Nikaia was divided into 159 polling stations with 93,851 registered voters during the parliamentary elections of January 2015 [61]. We used the electoral lists of the elections of January 2015, containing voters per polling station, as retrieved from the Ministry of Interior [61]. For creation of the sample, we numbered all voters for each polling station in ascending order, according to our nominal voter list. Then we randomly selected voters, by separate draw per polling station, according to the percentage the polling station represents over the total voters. To ensure randomness, we used the random number generator of Microsoft Excel, version 2007. Random numbers are given by the ‘RANDBETWEEN’ function, which is compiled as follows: ‘=RANDBETWEEN (bottom, top)’. The ‘RANDBETWEEN’ function can produce as many integer numbers as desired by the user, between the bottom and top boundaries. Special emphasis has been put on calculating the correct sample size, since it affects not only the accuracy of the measurement but also the conclusions about the population [62]. For the calculation of the appropriate sample size, because the dispersion of the variables of our investigation is not available, we performed a preliminary survey in the area, by collecting 50 questionnaires. By using this pivot sample, we were able to calculate the variance, standard deviation and the ratio for each variable. Regarding sample size estimation, in the case of unknown population variance and for the case of a large sample, the following equation is used [62]
where n is the estimated sample size, s is the calculated standard deviation resulting from the control sample, Z1−a/2 values derive from the confidence level selected by the investigator based on the normal distribution table and D is the overall width of the desired confidence level as determined by the researcher or as given by similar research. In our sample, the variable with the greater standard deviation ‘age’ (mean = 40.4, s = 14.24). By using Equation (1), sample size was estimated as can be seen in the calculation below
The appropriate sample size was rounded up at 400 persons. The proportion equation for variables expressed in percentages, gave lower sample size estimates. Face-to-face method was used to fill out the questionnaires. If the respondents were absent or refused, one more effort was made to capture their opinion. This mainly happened with senior respondents (>65), who were reluctant to respond to the questionnaire. In this case, we used the previous process to select new sampling units, thus our study better represents the views of citizens aged 18–65.
The questionnaire includes 16 multifaceted questions on RES, which form 73 variables, about respondents’ viewpoint of use, information and acceptance of RES. Previous surveys on renewables for Greece were taken into consideration for appropriate questionnaire design [19,63,64,65,66,67].
The main research goal is to assess public opinion on renewable energy sources, perceived advantages and disadvantages, and willingness to pay for RES energy. A second research goal is to locate the main dimensions of public attitude towards WTP for RES expansion. Statistical methods include principal components analysis, one-way ANOVA, and binary logit regression. For the purposes of the analysis, Stata/MP 13.0 and SPSS v.17 were used.
4. Results
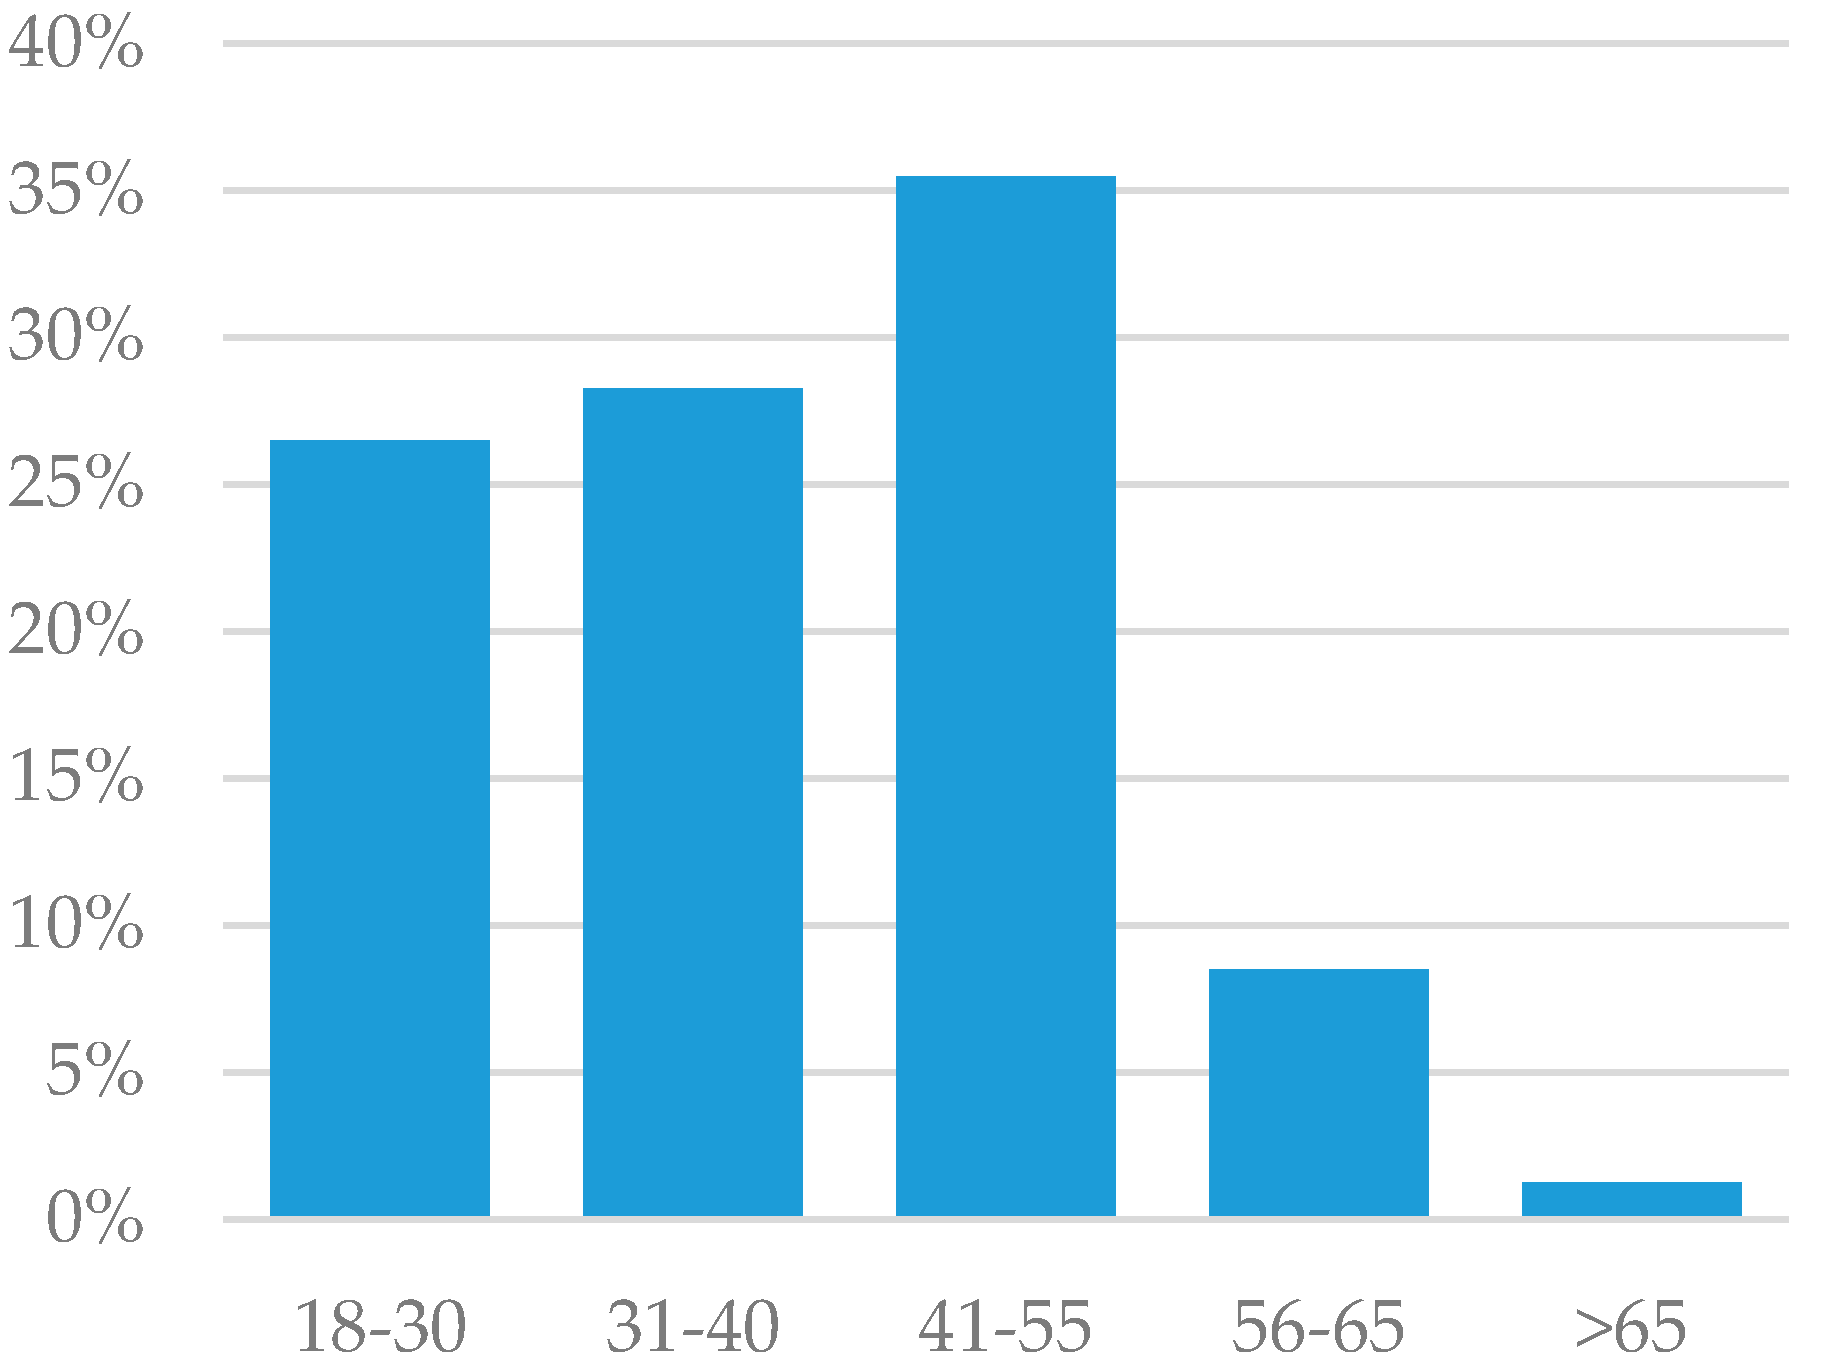
Most of the respondents are males (52.3%), found in the age category of 41–55 (35.5%), as presented in Table 1 and Figure 1. For verification of sampling accuracy, in Figure 1 and Figure 2, age distributions for both the sample and the total population of Nikaia, according to the 2011 census, are provided [68]. The two bar-charts are comparable, with the exemption of the category of adults over 65, who were, in many cases, unwilling to take part in our survey. The mean sample age is 40.4.
Most of the respondents are high school graduates (38.0%), followed by university graduates (35.0%). Around 67% of the respondents have an annual family income of up to 20,000 euros, while one-third of the sample population stated that their annual income does not exceed 10,000 euros. The respondents are many civil servants or private employees (57%), while around 25% of the sample are students, unemployed, or homemakers. Concerning RES use, 239 respondents, who correspond to 60% of the sample, reported that they use renewable energy technologies (active or passive) in their everyday life. In a multiple response question about ownership of different types of renewable energy technologies, 95% of RES users have installed solar water heaters, while another 13% of them are using photovoltaic systems (PVs). Only four RES users have invested in wind energy systems and two in geothermal energy systems (Table 2).
In a question accessing the reasons for not investing in renewable energy systems (Table 3), 37.3% of non-RES users, indicated “high installation costs”, followed by lack of information (30.4%).
The internet is the preferred method for retrieving information about renewable energy (43.5%), followed by television (28.8%), as can be seen in Table 4.
Regarding respondents’ self-evaluation on their knowledge degree upon RES, 54% and 42% of the sample are adequately informed about solar power and wind power, respectively. On the contrary, respondents are inadequately informed about hydropower, geothermal, and biomass applications. The results are presented in Table 5.
In response to perceived RES benefits (see Table 6), most of the respondents (51.5%) consider environmental protection to be an utmost importance parameter, followed by the increase of energy independence. In a question concerning respondents’ opinion about “further RES expansion”, most of them (83%) gave a positive answer.
In a dichotomous type question about WTP for a further expansion of 10% of RES share, in the electricity generation mix, more than one-third of our sample gave a positive answer. Out of those respondents, a percentage of 28.9 are willing to accept an increase of 6–10 euro in their electricity bill, while a percentage of 52.4 are willing to pay more than 10 euros per quarter, as it can be seen in Table 7. By taking the mean of each class of Table 7, multiplying with frequency and dividing the total sum by the total number of cases, we estimated that the mean WTP for a 10% increase of RES penetration in electricity mix, is 26.5 euros per household, quarterly.
Our results led to higher estimation of WTP for greener electricity compared to other studies on WTP for RES electricity within the Greek context [19,51,69,70,71], as presented in Table 8. A possible explanation for this is that our survey took place in an urban area near Athens, where the need for environmental protection is a matter of top priority among the respondents. Ambient air condition in the Attica region is heavily burdened by traffic loads, heating applications, and industrial facilities [22].
To access the drivers of WTP, we applied a factorial analysis under the PCA method, by inputting all variables concerning respondents’ aspects on various RES issues. Under this methodology, each identified component interprets a percentage of the variance that has not been interpreted by previous components. In the context of social sciences, an explained percentage of 60% of the variance or less can be accepted [72]. Kaiser’s criterion (eigenvalue > 1) was used for factor identification. KMO criterion and Bartlett’s test of sphericity were applied prior to the PCA method to measure question and sampling adequacy. Regarding the number of observations in proportion to the number of variables, this ratio should be at least 5:1 and ideally 10:1 [72], a condition fulfilled by our sample. The result of this analysis via ΚΜΟ index and Bartlett test of sphericity (Table 9), revealed satisfactory values (ΚΜΟ = 0.86 and p < 0.001 on Bartlett). This conclusion implied that statistically significant correlations exist between questions, and that the sample size meets the criteria to be used for factor analysis [30].
Out of the initial number of variables, nine components were identified by the Kaiser criterion, explaining a total of 68% of the observed variance; a percentage which is considered satisfactory. A rotation of the initial factors was afterwards performed by the Varimax method. The rotation enabled the simplification of the initial factor table. Regarding the nature of the questions, respondents’ attitudes towards RES fall into the components presented in Table 10.
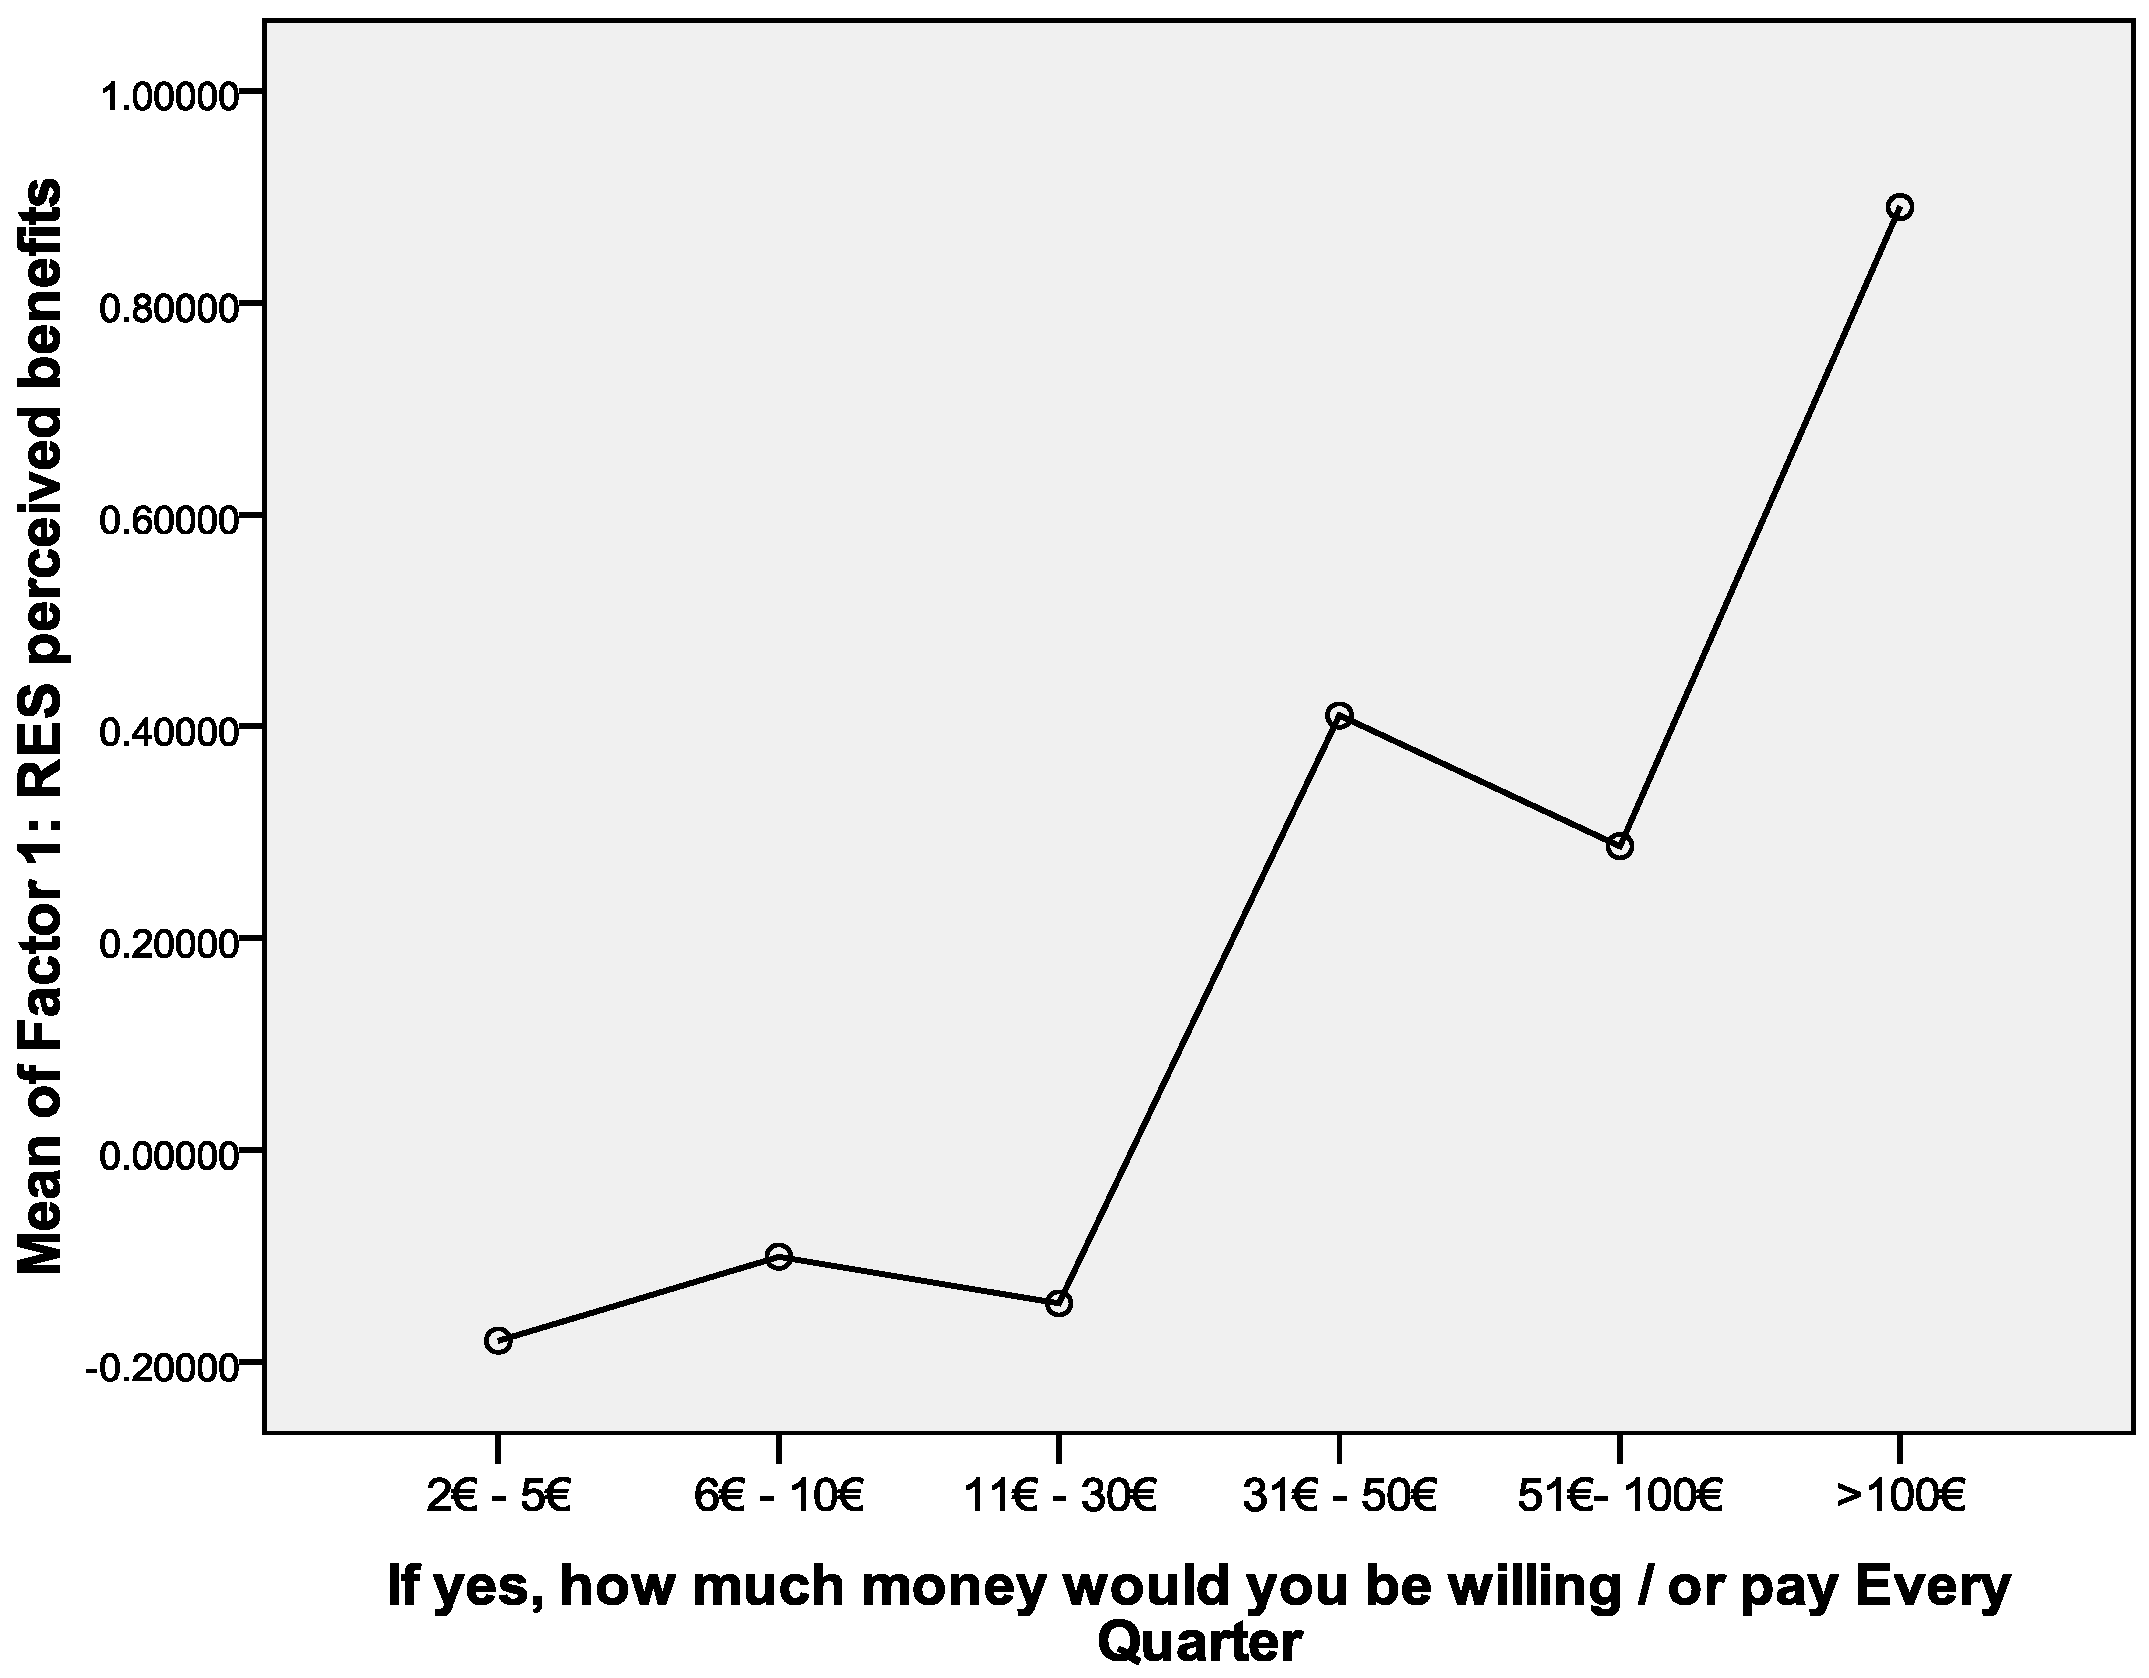
By using the F1 component named “RES perceived benefits”, a positive relationship with WTP exists, as verified by the one-way ANOVA method, presented inTable 11. When the score on perceived RES benefit rises, WTP becomes higher, as depicted in the means plot (Figure 3).
To further assess the desire for additional payment (WTP) for energy from renewable sources, we used a binary logit model in STATA/MP 13.0, setting the dichotomous variable WTP (‘yes/no’) as dependent. The independent variables we used are the socio-demographic characteristics of the sample (age, income, occupation, education, and gender) and the nine components of Table 10 (variables F1–F9), reflecting respondents’ views on RES. The reference category for the dependent variable of WTP is ‘yes’.
As seen in Table 12, McFadden’s R squared, which is the default ‘pseudo R2’ measure reported by Stata [73], equals 17.83%. The initial model, including all the variables, is presented in Table 13. Model coefficients are presented under column (B) and the odds ratio is given in the most-right column labeled “Exp(B)”.
By looking at sig. values, in column (P > z) of Table 13, we observe that the variables of OCCUPATION, INCOME, GENDER, AGE, F1, F6, and F7 do not make a significant contribution to the model, having sig. > 0.05 at 95% confidence level. Therefore, we decided to drop those variables by using the stepwise method, provided by Stata/MP 13.0. The optimal solution was found after seven iterations, as presented in Table 14.
By looking at Table 15, McFadden’s R2 of the final model, equals 17.05%, indicating a weak, although respectable capability to explain WTP variation. Hosmer & Lemeshow goodness-of-fit test statistic of the final iteration is greater than 0.05 (Table 16), indicating that the model fits the data at an acceptable level (p = 0.148 > 0.05).
All variables included in the final model are presented in Table 17, along with their coefficient, the confidence intervals, and the odds ratio. Interpreting the results of Table 17, we clarify that column “B”, includes the coefficients of the logit model while “Exp(B)” shows the odds ratios, or the marginal probabilities, for the predictors. The odds ratios are the exponentiation of the coefficients.
Thus, the final form of the model is:
Out of the initial 15 explanatory variables, 6 were statistically significant. Negative coefficients mean that a one-unit increase in those variables, minimizes the odds that the user remains in the reference category of “WTP = yes”, by 1-Exp(B). The variables negatively associated with WTP are F2 (Perceived disadvantages of RES) and F5 (Institutional promotion barriers). On the other hand, variables with a positive coefficient, F2 (Perceived benefits from RES), EDUCATION, F3 (Subsidies for RES), and F8 (Motivation by socio-political framework), are positively associated with “WTP = yes”.
For example, the odds ratio coefficient, under column Exp(B) of variable “EDUCATION” says that, holding all other explanatory variables at a fixed value, we will see 27% increase in the odds of a respondent belonging in “WTP = yes”, for a one unit increase in the educational level, since exp(0.239) = 1.270 [74]. The same explanation applies to variables F3, F4, and F8.
On the other hand, a one-unit increase in F2 (Perceived disadvantages of RES) holding all explanatory variables fixed, decreases the odds of a respondent belonging in the category “WTP = yes” by 39.2%, since 1-exp(B) = 1 − 0.608 = 0.392 [74]. The same applies to variable F5, which also has a negative coefficient.
The overall predictability of the model is depicted in Table 18. Overall, 76.2% of the respondents were correctly identified. Specifically, 93.7% of the respondents who are not willing to pay more for RES expansion (WTP = no) and 36.8% of those willing to pay the extra cost (WTP = yes), were classified in the correct category. We decided to check for differences in personal characteristics of the respondents because of the low predictability of the final model for the ‘WTP = yes’ category. For this purpose, we applied Pearson’s chi-squared test of independence between all personality characteristics variables and WTP, noticing a relationship between WTP and the dichotomous variable ‘RES user’. More specifically, RES users are more willing to pay than non-RES users. By applying a filter and selecting all respondents who are ‘RES users’, we re-run our final binary logit model and took the following table:
As we see in Table 19, our final model has significant better prediction capabilities (Pseudo R2 = 0.440) when it is applied only to RES users. Several interesting studies are also reporting that personality traits, like environmental awareness or eco-consciousness, are positively associated with environmentally responsible behavior [75,76,77].
5. Discussion and Conclusions
Concerning policy implications, in previous Greek studies, a positive public attitude was denoted [19,21,57]. It is noteworthy that the social acceptability and the perceived advantages of RES diffusion in the national energy mix stems from the adverse environmental and healthcare implications from the ongoing air pollution and ecosystems’ deterioration caused by the overexploitation of the carbon-based fossil fuels. Our survey results suggest that the prolonged economic recession in the Greek economy motivated citizens to undertake market research for cost-effective energy choices, especially regarding their household expenses. Most of the respondents have installed water heaters while more than half of them have in-depth knowledge of solar energy systems followed by wind energy technologies. Environmental protection is outlined as the most important reason for installing RES technologies, followed by reduced oil dependency. On the other hand, the respondents reported that high installation costs and lack of information are dominant reasons for not installing any kind of RES technology. Willingness to pay for an expansion of 10% of RES into the current electricity mix was estimated at 26.5 euros/quarterly on the electricity bill, higher than previous Greek studies which ranged between 11–16 euros/quarterly [19,51,69,70,71]. Our higher estimate of WTP is attributed to respondents’ perception upon the role of RES in improving the environmental quality, which plays a decisive role to the wider acceptability of green investments [17,20,25]. The results of WTP are comparable to other European countries like Spain and Slovenia. On the other hand, Japan and Australia are amongst the countries with the highest estimated WTP. According to previous studies, WTP was found to be related to income, age, education, and environmental awareness. By using a logit model, we discovered that WTP is positively related to education status, subsidies provided by the state, actions for RES expansion undertaken by the state and motivation by the socio-political framework. On the other hand, the perceived disadvantages of RES and institutional barriers negatively affected WTP.
Moreover, since WTP was found to be associated with the role of the state, local stakeholders—such as municipality and local authorities, as well as private-owned investment companies—should take that into consideration for the implementation of a successful national environmental policy [28,31]. The state must also ensure access to environmental information for citizens to stimulate investment desire and participation [19,21,57]. Citizens’ active participation promotes the implementation of the renewable energy targets agreed upon by the national governments.
Concerning the limitations of this study, it must be noted that it was undertaken at a densely populated urban area, in which citizens’ prioritization is mainly determined by the cost-effective purchase for commercial goods and services and not by the environmental protection of the nearby provinces and the surrounded suburban region. Contrarily, future research orientations under the same methodological approach, can be implemented to purely rural and island areas, in which it is anticipated that, among the local population, environmental protection and the improvement of life quality criteria should take advantage of the economically convenient and less costly energy choices that the Greek countryside offers. Finally, the inclusion of personality trait variables [75,76,77] in logit models evaluating WTP may provide better fit and better forecasting accuracy.
Author Contributions
Stamatios Ntanos, Miltiadis Chalikias, and Garyfallos Arabatzis designed the experimental framework and analyzed the data. Stamatios Ntanos and Mitiadis Chalikias carried out the implementation, performed the calculations and the computer programming. Grigorios Kyriakopoulos and Skordoulis Michalis gathered and implemented all the theoretical background of the paper, having the input from the experimental development. Arabatzis Garyfallos, Grigorios Kyriakopoulos, and Stamatios Ntanos reviewed and discussed the results of the study.
Conflicts of Interest
The authors declare no conflicts of interest.
References
- Mariani, F.; Perez-Barahona, A.; Raffin, N. Life expectancy and the environment. J. Econ. Dyn. Control 2010, 34, 798–815. [Google Scholar] [CrossRef]
- Lam, C.W.; Lim, S.; Schoenung, J.M. Environmental and risk screening for prioritizing pollution prevention opportunities in the U.S. printed wiring board manufacturing industry. J. Hazard. Mater. 2011, 189, 315–322. [Google Scholar] [CrossRef] [PubMed]
- Ockenden, C.M.; Deasy, C.; Quinton, J.N.; Surridge, B.; Stoate, C. Keeping agricultural soil out of rivers: Evidence of sediment and nutrient accumulation within field wetlands in the UK. J. Environ. Manag. 2014, 135, 54–62. [Google Scholar] [CrossRef] [PubMed]
- Van Gent, H.A.; Rietveld, P. Road transport and the environment in Europe. Sci. Total Environ. 1993, 129, 205–218. [Google Scholar] [CrossRef]
- International Energy Agency (IEA). CO2 Emissions from Fuel Combustion Highlights 2017. Available online: https://www.iea.org/publications/freepublications/publication/co2-emissions-from-fuel-combustion-highlights-2017.html (accessed on 10 January 2018).
- Bell, A.R.; Cook, B.I.; Anchukaitis, K.J.; Buckley, B.M.; Cook, E.R. Repurposing climate reconstructions for drought prediction in Southeast Asia: A letter. Clim. Chang. 2011, 106, 691–698. [Google Scholar] [CrossRef]
- Canadell, J.G.; Kirschbaum, M.U.F.; Kurz, W.A.; Sanz, M.J.; Schlamadinger, B.; Yamagata, Y. Factoring out natural and indirect human effects on terrestrial carbon sources and sinks. Environ. Sci. Policy 2007, 10, 370–384. [Google Scholar] [CrossRef]
- Boden, T.A.; Marland, G.; Andres, R.J. Global, Regional, and National Fossil-Fuel CO2 Emissions; Carbon Dioxide Information Analysis Center, Oak Ridge National Laboratory, U.S. Department of Energy: Oak Ridge, TN, USA, 2017.
- Dyson, F. Can we Control the Carbon Dioxide in the Atmosphere? Energy 1976, 2, 217–291. [Google Scholar] [CrossRef]
- Bach, W. Impact of increasing atmospheric CO2 concentrations on global climate: Potential consequences and corrective measures. Environ. Int. 1979, 2, 215–228. [Google Scholar] [CrossRef]
- Garrett, C.W. On global climate change, carbon dioxide, and fossil fuel combustion. Progress Energy Combust. Sci. 1992, 18, 369–407. [Google Scholar] [CrossRef]
- IPCC. Climate Change 2014: Synthesis Report. Contribution of Working Groups I, II and III to the Fifth Assessment Report of the Intergovernmental Panel on Climate Change, Geneva, Switzerland. Available online: https://www.ipcc.ch/report/ar5/wg3/ (accessed on 7 December 2017).
- The Paris Agreement. Work Programme under the Paris Agreement. Available online: http://unfccc.int/paris_agreement/items/9485.php (accessed on 20 January 2018).
- Vasseur, V.; Kemp, R. The adoption of PV in the Netherlands: A statistical analysis of adoption factors. Renew. Sustain. Energy Rev. 2015, 41, 483–494. [Google Scholar] [CrossRef]
- Eurostat. Share of R.E.S. in Gross Final Energy Consumption for 2018. Available online: http://ec.europa.eu/eurostat/statistics-explained/images/d/dc/Renewable_energy_statistics-2018-v1.xlsx (accessed on 3 February 2018).
- Liu, W.; Wang, C.; Mol, A. Rural public acceptance of renewable energy deployment: The case of Shandong in China. Appl. Energy 2013, 102, 1187–1196. [Google Scholar] [CrossRef]
- Caporale, D.; De Lucia, C. Social acceptance of on-shore wind energy in Apulia Region (Southern Italy). Renew. Sustain. Energy Rev. 2015, 52, 1378–1390. [Google Scholar] [CrossRef]
- Rosso-Cerón, A.M.; Kafarov, V. Barriers to social acceptance of renewable energy systems in Colombia. Curr. Opin. Chem. Eng. 2015, 10, 103–110. [Google Scholar] [CrossRef]
- Zografakis, N.; Sifaki, E.; Pagalou, M.; Nikitaki, G.; Psarakis, V.; Tsagarakis, K.P. Assessment of public acceptance and willingness to pay for renewable energy sources in Crete. Renew. Sustain. Energy Rev. 2010, 14, 1088–1095. [Google Scholar] [CrossRef]
- Arabatzis, G.; Myronidis, D. Contribution of SHP Stations to the development of an area and their social acceptance. Renew. Sustain. Energy Rev. 2011, 15, 3909–3917. [Google Scholar] [CrossRef]
- Kaldellis, J.K.; Kapsali, M.; Kaldelli, E.; Katsanou, E. Comparing recent views of public attitude on wind energy, photovoltaic and small hydro applications. Renew. Energy 2013, 52, 197–208. [Google Scholar] [CrossRef]
- Valavanidis, A.; Vlachogianni, T.; Loridas, S.; Fiotakis, C. Atmospheric Pollution in Urban Areas of Greece and Economic Crisis, University of Athens, Department of Chemistry. 2016. Available online: http://www.chem.uoa.gr/wp-content/uploads/epistimonika_themata/atmosph_pollut_greece.pdf (accessed on 8 January 2017).
- Bertsch, V.; Hall, M.; Weinhardt, C.; Fichtner, W. Public acceptance and preferences related to renewable energy and grid expansion policy: Empirical insights for Germany. Energy 2016, 114, 465–477. [Google Scholar] [CrossRef]
- Tabi, A.; Wüstenhagen, R. Keep it local and fish-friendly: Social acceptance of hydropower projects in Switzerland. Renew. Sustain. Energy Rev. 2017, 68, 763–773. [Google Scholar] [CrossRef]
- Enevoldsen, P.; Sovacool, B. Examining the social acceptance of wind energy: Practical guidelines for onshore wind project development in France. Renew. Sustain. Energy Rev. 2016, 53, 178–184. [Google Scholar] [CrossRef]
- Eleftherakis, D. Citizens towards Renewable Energy sources. Available online: http://www.skai.gr/news/environment/article/305772/stis-protovoulies-ton-politon-i-uperishusi-ton-ananeosimon-pigon-energeias/ (accessed on 25 November 2018). (In Greek).
- Shin, J.; Woo, J.; Huh, S.Y.; Lee, J.; Jeong, G. Analyzing public preferences and increasing acceptability for the Renewable Portfolio Standard in Korea. Energy Econ. 2014, 42, 17–26. [Google Scholar] [CrossRef]
- Zhai, P.; Williams, E. Analyzing consumer acceptance of photovoltaics (PV) using fuzzy logic model. Renew. Energy 2012, 41, 350–357. [Google Scholar] [CrossRef]
- Ribeiro, F.; Ferreira, P.; Araújo, M.; Braga, A.C. Public opinion on renewable energy technologies in Portugal. Energy 2014, 69, 39–50. [Google Scholar] [CrossRef]
- Sahu, Β.Κ. A study on global solar PV energy developments and policies with special focus on the top ten solar PV power producing countries. Renew. Sustain. Energy Rev. 2015, 43, 621–634. [Google Scholar] [CrossRef]
- Huijben, J.C.C.M.; Verbong, G.P.J. Breakthrough without subsidies? PV business model experiments in the Netherlands. Energy Policy 2013, 56, 362–370. [Google Scholar] [CrossRef]
- Yuan, X.; Zuo, J.; Ma, C. Social acceptance of solar energy technologies in China—End users’ perspective. Energy Policy 2011, 39, 1031–1036. [Google Scholar] [CrossRef]
- Muhammad-Sukki, F.; Ramirez-Iniguez, R.; Abu-Bakar, S.Η.; McMeekin, S.G.; Stewart, B.G. An evaluation of the installation of solar photovoltaic in residential houses in Malaysia: Past, present, and future. Energy Policy 2011, 39, 7975–7987. [Google Scholar] [CrossRef]
- Hanger, S.; Komendantova, N.; Schinke, B.; Zejli, D.; Ihlal, A.; Patt, A. Community acceptance of large-scale solar energy installations in developing countries: Evidence from Morocco. Energy Res. Soc. Sci. 2016, 14, 80–89. [Google Scholar] [CrossRef]
- Höffken, J.I. A closer look at small hydropower projects in India: Social acceptability of two storage-based projects in Karnataka. Renew. Sustain. Energy Rev. 2014, 34, 155–166. [Google Scholar] [CrossRef]
- Breffle, W.S.; Morey, E.R.; Lodder, T.S. Using Contingent Valuation to Estimate a Neighborhood’s Willingness to Pay to Preserve Undeveloped Urban Land. Urban Stud. 1998, 35, 715–727. [Google Scholar] [CrossRef]
- Roe, B.; Teisl, F.M.; Levy, A.; Russell, M. US consumers’ willingness to pay for green electricity. Energy Policy 2001, 29, 917–925. [Google Scholar] [CrossRef]
- Zarnikau, J. Consumer demand for ‘green power’ and energy efficiency. Energy Policy 2003, 31, 1661–1672. [Google Scholar] [CrossRef]
- Dalton, G.J.; Lockington, D.A.; Baldock, T.E. A survey of tourist attitudes to renewable energy supply in Australian hotel accommodation. Renew. Energy 2008, 33, 2174–2185. [Google Scholar] [CrossRef]
- Ek, K. Public and private attitudes towards “green” electricity: The case of Swedish wind power. Energy Policy 2005, 33, 1677–1689. [Google Scholar] [CrossRef]
- Hansla, A.; Gamble, A.; Juliusson, A.; Gärling, T. Psychological determinants of attitude towards and willingness to pay for green electricity. Energy Policy 2008, 36, 768–774. [Google Scholar] [CrossRef]
- Nomura, N.; Akai, M. Willingness to pay for green electricity in Japan as estimated through contingent valuation method. Appl. Energy 2004, 78, 453–463. [Google Scholar] [CrossRef]
- Whitehead, J.C.; Cherry, T.L. Willingness to pay for a Green Energy program: A comparison of ex-ante and ex-post hypothetical bias mitigation approaches. Resour. Energy Econ. 2007, 29, 247–261. [Google Scholar] [CrossRef]
- Mozumder, P.; Vásquez, W.F.; Marathe, A. Consumers’ preference for renewable energy in the southwest USA. Energy Econ. 2011, 33, 1119–1126. [Google Scholar] [CrossRef]
- Guo, X.; Liu, H.; Mao, X.; Jin, J.; Chen, D.; Cheng, S. Willingness to pay for renewable electricity: A contingent valuation study in Beijing, China. Energy Policy 2014, 68, 340–347. [Google Scholar] [CrossRef]
- Ivanova, G. Are consumers’ willing to pay extra for the electricity from renewable energy sources? An example of Queensland, Australia. Int. J. Renew. Energy 2012, 2, 758–766. [Google Scholar]
- Bigerna, S.; Polinori, P. Italian households׳ willingness to pay for green electricity. Renew. Sustain. Energy Rev. 2014, 34, 110–121. [Google Scholar] [CrossRef]
- Zoric, J.; Hrovatin, N. Household willingness to pay for green electricity in Slovenia. Energy Policy 2012, 47, 180–187. [Google Scholar] [CrossRef]
- Tourkolias, C.; Mirasgedis, S. Quantification and monetization of employment benefits associated with renewable energy technologies in Greece. Renew. Sustain. Energy Rev. 2011, 15, 2876–2886. [Google Scholar] [CrossRef]
- Kostakis, I.; Sardianou, E. Which factors affect the willingness of tourists to pay for renewable energy? Renew. Energy 2012, 38, 169–172. [Google Scholar] [CrossRef]
- Savvanidou, E.; Zervas, E.; Tsagarakis, K.P. Public acceptance of biofuels. Energy Policy 2010, 38, 3482–3488. [Google Scholar] [CrossRef]
- Kyriakopoulos, G.L.; Arabatzis, G.; Chalikias, M. Renewables exploitation for energy production and biomass use for electricity generation. A multi-parametric literature-based review, In special issue: “Biomass Utilization Technology for Building of Recycling Society”. AIMS Energy 2016, 4, 762–803. [Google Scholar] [CrossRef]
- Kyriakopoulos, G.L.; Arabatzis, G. Electrical energy storage systems in electricity generation: Energy policies, innovative technologies, and regulatory regimes. Renew. Sustain. Energy Rev. 2016, 56, 1044–1067. [Google Scholar] [CrossRef]
- Ntona, E.; Arabatzis, G.; Kyriakopoulos, G.L. Energy saving: Views and attitudes of students in secondary education. Renew. Sustain. Energy Rev. 2015, 46, 1–15. [Google Scholar] [CrossRef]
- Kyriakopoulos, G.; Kolovos, K.; Chalikias, M. Environmental sustainability and financial feasibility evaluation of woodfuel biomass used for a potential replacement of conventional space heating sources. Part II: A Combined Greek and the nearby Balkan Countries Case Study. Oper. Res. Int. J. 2010, 10, 57–69. [Google Scholar] [CrossRef]
- Chalikias, M.S.; Kyriakopoulos, G.; Kolovos, K.G. Environmental sustainability and financial feasibility evaluation of woodfuel biomass used for a potential replacement of conventional space heating sources. Part I: A Greek case study. Oper. Res. Int. J. 2010, 10, 43–56. [Google Scholar] [CrossRef]
- Tsantopoulos, G.; Arabatzis, G.; Tampakis, S. Public attitudes towards photovoltaic developments: Case study from Greece. Energy Policy 2014, 71, 94–106. [Google Scholar] [CrossRef]
- Barker, T.; Dagoumas, A.; Rubin, J. The macroeconomic rebound effect and the world economy. Energy Effic. 2009, 2, 411–427. [Google Scholar] [CrossRef]
- Dagoumas, A. Energy and climatic policies in Greece and Europe. In Energeia; KEPE: Athens, Greece, 2014; pp. 7–10. Available online: https://energypress.gr/sites/default/files/media/KEPE%20ENERGY%202014.pdf (accessed on 10 December 2017). (In Greek)
- Damianou, C. Sampling Methodology: Techniques and Applications, 3rd ed.; Aithra Publications: Athens, Greece, 1999. (In Greek) [Google Scholar]
- Ministry of Interior. Election catalogues of the Greek Parliamentary Elections on January 2015 (Excel file). Available online: http://www.ypes.gr/el/Elections/ElectionCatalogues/ElectionDepartments/ (accessed on 02 February 2018). (In Greek).
- Eng, J. Sample Size Estimation: How Many Individuals Should Be Studied? Radiology 2003, 227, 309–313. [Google Scholar] [CrossRef] [PubMed]
- Kolovos, K.G.; Kyriakopoulos, G.; Chalikias, M.S. Co-evaluation of basic woodfuel types used as alternative heating sources to existing energy network. J. Environ. Prot. Ecol. 2011, 12, 733–742. [Google Scholar]
- Kyriakopoulos, G.; Chalikias, M.S. The Investigation of Woodfuels’ Involvement in Green Energy Supply Schemes at Northern Greece: The Model Case of the Thrace. Procedia Technol. 2013, 8, 445–452. [Google Scholar] [CrossRef]
- Arabatzis, G.; Malesios, C. Pro-environmental attitudes of users and non-users of fuelwood in a rural area of Greece. Renew. Sustain. Energy Rev. 2013, 22, 621–630. [Google Scholar] [CrossRef]
- Kaldellis, J.K. Social attitude towards wind energy applications in Greece. Energy Policy 2005, 33, 595–602. [Google Scholar] [CrossRef]
- Ntanos, S.; Arabatzis, G.; Chalikias, M. The role of emotional intelligence as an underlying factor towards social acceptance of green investments. In Proceedings of the 8th International Conference on Information and Communication Technologies in Agriculture, Food and Environment, Chania, Greece, 21–24 September 2017; Volume 2030, pp. 341–351. [Google Scholar]
- Hellenic Statistical Authority. Population census 2011, Table Γ01. Permanent population by sex and age groups. Settlements with a population of >50,000. Data for Nikaia. Available online: http://www.statistics.gr/el/statistics/-/publication/SAM03/2011 (accessed on 2 February 2018). (In Greek).
- Koundouri, P.; Kountouris, Y.; Remoundou, K. Valuing a wind farm construction: A contingent valuation study in Greece. Energy Policy 2009, 37, 1939–1944. [Google Scholar] [CrossRef]
- Markantonis, V.; Bithas, K. The application of the contingent valuation method in estimating the climate change mitigation and adaptation policies in Greece. An expert-based approach. Environ. Dev. Sustain. 2010, 12, 807–824. [Google Scholar] [CrossRef]
- Kontogianni, A.; Tourkolias, C.; Skourtos, M. Renewables portfolio, individual preferences and social values towards RES technologies. Energy Policy 2013, 55, 467–476. [Google Scholar] [CrossRef]
- Hair, J.F.; Black, W.C.; Babin, B.J.; Anderson, R.E. Multivariate Data Analysis, 7th ed.; Chapter “Explanatory Factor analysis”; Prentice Hall International: Englewood Cliffs, NJ, USA, 2010. [Google Scholar]
- IDRE 2008. Multinomial Logistic Regression, Stata Annotated Output. Available online: https://stats.idre.ucla.edu/stata/output/multinomial-logistic-regression-2/ (accessed on 15 February 2018).
- Kim, H.-Y. Statistical notes for clinical researchers: Logistic regression. Restor. Dent. Endod. 2017, 42, 342–348. [Google Scholar] [CrossRef] [PubMed]
- Huijts, N.M.A.; Molin, E.J.E.; Steg, L. Psychological factors influencing sustainable energy technology acceptance: A review-based comprehensive framework. Renew. Sustain. Energy Rev. 2012, 16, 525–531. [Google Scholar] [CrossRef]
- Parant, A.; Pascual, A.; Jugel, M.; Kerroume, M.; Felonneau, M.; Guéguen, N. Raising Students Awareness to Climate Change: An Illustration with Binding Communication. Environ. Behav. 2017, 49, 339–353. [Google Scholar] [CrossRef]
- Stigka, E.; Paravantis, J.; Mihalakakou, G. Social acceptance of renewable energy sources: A review of contingent valuation applications. Renew. Sustain. Energy Rev. 2014, 32, 100–106. [Google Scholar] [CrossRef]
Figure 1.
Bar chart depicting age distribution of sample.

Figure 2.
Bar chart depicting age distribution of population.

Figure 3.
Depiction of a positive relationship between WTP and perceived RES advantages.


Table 1.
Respondents’ age distribution.
| Age | |||||
|---|---|---|---|---|---|
| Frequency | Percent | Valid Percent | Cumulative Percent | ||
| Valid | 18–30 | 113 | 28.3 | 28.3 | 28.3 |
| 31–40 | 106 | 26.5 | 26.5 | 54.8 | |
| 41–55 | 142 | 35.5 | 35.5 | 90.3 | |
| 56–65 | 34 | 8.5 | 8.5 | 98.8 | |
| >65 | 5 | 1.3 | 1.3 | 100.0 | |
| Total | 400 | 100.0 | 100.0 | ||
Table 2.
Used renewable energy technologies (multiple response).
| Technology | Frequency | % of RES Users | |
|---|---|---|---|
| Solar water heater | 227 | 95.0% | |
| Solar P/V | 31 | 13.0% | |
| Wind turbines | 4 | 1.7% | |
| Geothermal | 2 | 0.8% | |
| Biofuels | 7 | 2.9% | |
| Passive solar systems | 7 | 2.9% |
Table 3.
Main reasons for not using any kind of renewable energy technology.
| Reasons for Not Using RES | Frequency | % |
|---|---|---|
| High installation cost | 60 | 37.3% |
| I do not have the right information | 49 | 30.4% |
| Low reliability | 18 | 11.2% |
| Complex installation process | 9 | 5.6% |
| Systems hazards | 8 | 5.0% |
| Legislative environment difficulties | 8 | 5.0% |
| High maintenance cost | 5 | 3.1% |
| Difficulty of use | 3 | 1.9% |
| Possible fire spread | 1 | 0.6% |
Table 4.
Main sources of retrieving information on renewable energy sources.
| Sources of Information on RES | Frequency | % |
|---|---|---|
| Television | 115 | 28.8 |
| Radio | 18 | 4.5 |
| Newspapers/magazines | 59 | 14.8 |
| Internet | 174 | 43.5 |
| Environmental organizations | 22 | 5.5 |
| Friends | 12 | 3.0 |
Table 5.
Degree of knowledge upon various RES technologies.
| RES Type | Poor | Fair | Average | Good | Excellent |
|---|---|---|---|---|---|
| Wind | 6.0 | 20.8 | 31.5 | 24.3 | 17.5 |
| Solar | 2.8 | 13.8 | 29.3 | 28.0 | 26.3 |
| Hydrodynamic | 14.3 | 32.8 | 28.5 | 14.5 | 10.0 |
| Geothermal | 30.5 | 33.3 | 18.8 | 11.3 | 6.3 |
| Biomass | 34.3 | 35.8 | 15.5 | 9.3 | 5.3 |
Table 6.
Perceived RES benefits.
| RES Advantages | Strongly Disagree | Disagree | Neutral | Argee | Strongly Agree |
|---|---|---|---|---|---|
| Life quality | 0.3 | 1.5 | 13.5 | 40.0 | 44.8 |
| Environmental protection | 0.3 | 1.5 | 11.5 | 35.3 | 51.5 |
| Economic development | 0.3 | 1.3 | 19.3 | 41.8 | 37.5 |
| Green development | 0.5 | 2.8 | 13.5 | 39.3 | 44.0 |
| New labor positions | 0.5 | 2.3 | 20.3 | 38.5 | 38.5 |
| Reduced oil dependence | 0.0 | 1.3 | 13.3 | 40.0 | 45.5 |
| Energy independence | 0.0 | 1.5 | 16.8 | 35.0 | 46.8 |
Table 7.
Willingness to pay for a further 10% RES expansion to the electricity mix.
| How Much Money Would you be Willing/or Pay Every Quarter? | ||
|---|---|---|
| Classes | Frequency | % |
| 2€–5€ | 28 | 18.8 |
| 6€–10€ | 43 | 28.9 |
| 11€–30€ | 28 | 18.8 |
| 31€–50€ | 27 | 18.1 |
| 51€–100€ | 19 | 12.8 |
| >100€ | 4 | 2.7 |
| Total | 149 | 100.0 |
Table 8.
WTP for renewable energy expansion in Greece.
| Authors | Year | Area | WTP for green energy |
|---|---|---|---|
| Zografakis et al. [19] | 2010 | Crete Island | 16.33 euros quarterly |
| Koundouri et al. [69] | 2009 | Rhodes Island | 11.60 euros quarterly * |
| Markantonis & Bithas [70] | 2009 | Country level | 13.93 euros quarterly * |
| Kontogianni et al. [71] | 2013 | Lesvos Island | 138–180 euros one-off payment |
| Savvanidou et al. [51] | 2010 | Thrace | 0.079 €/L for car biofuel |
* calculated according to data included in the research paper.
Table 9.
KMO and Barlett test for factor analysis appropriateness.
| Kaiser-Meyer-Olkin Measure of Sampling Adequacy | 0.867 | |
|---|---|---|
| Bartlett's Test of Sphericity | Approx. Chi-Square | 9670.2 |
| df | 780 | |
| Sig. | 0.000 |
Table 10.
Main components of public attitudes towards RES.
| F1: Perceived benefits |
| F2: Perceived disadvantages |
| F3: RES energy subsidies |
| F4: Actions for expansion |
| F5: Institutional promotion barriers |
| F6: Economical obstacles |
| F7: Price compared to fossil fuels |
| F8: Motivation by the social-legal framework |
| F9: Purchase with interest free installments |
Table 11.
One-way ANOVA between the variables “willingness to pay for RES” and “perceived benefits from RES”.
Table 11.
One-way ANOVA between the variables “willingness to pay for RES” and “perceived benefits from RES”.
| F1: Perceived Benefits | |||||
|---|---|---|---|---|---|
| Sum of Squares | df | Mean Square | F | Sig. | |
| Between groups | 10.907 | 5 | 2.181 | 2.423 | 0.038 |
| Within groups | 128.767 | 143 | 0.900 | ||
| Total | 139.674 | 148 | |||
Table 12.
Initial model, pseudo R square.
| Logistic Regression | Number of Obs = | 399 |
|---|---|---|
| LR chi2(13) = | 90.57 | |
| Prob > chi2 = | 0 | |
| Log likelihood = −208.68486 | Pseudo R2 = | 0.1783 |
Table 13.
Variables included in the initial logit model for the estimation of WTP.
| WTP | Coef. | Std. Err. | Z | P > z | (95% Conf. | Interval) | Odds Ratio |
|---|---|---|---|---|---|---|---|
| (B) | (sig.) | Exp(B) | |||||
| EDUCATION | 0.242 | 0.101 | 2.390 | 0.017 | 0.043 | 0.440 | 1.273 |
| OCCUPATION | 0.038 | 0.075 | 0.500 | 0.618 | −0.110 | 0.185 | 1.038 |
| INCOME | 0.003 | 0.004 | 0.920 | 0.356 | −0.004 | 0.011 | 1.003 |
| GENDER | −0.170 | 0.250 | −0.680 | 0.495 | −0.660 | 0.319 | 0.843 |
| AGE | −0.086 | 0.139 | −0.620 | 0.536 | −0.358 | 0.186 | 0.918 |
| F1 | 0.108 | 0.124 | 0.870 | 0.384 | −0.136 | 0.352 | 1.114 |
| F2 | −0.506 | 0.126 | −4.010 | 0.000 | −0.753 | −0.259 | 0.603 |
| F3 | 0.425 | 0.132 | 3.230 | 0.001 | 0.167 | 0.682 | 1.529 |
| F4 | 0.517 | 0.134 | 3.870 | 0.000 | 0.255 | 0.780 | 1.678 |
| F5 | 0.444 | 0.128 | 3.460 | 0.001 | 0.192 | 0.696 | 1.559 |
| F6 | 0.110 | 0.122 | 0.900 | 0.370 | −0.130 | 0.349 | 1.116 |
| F7 | −0.020 | 0.120 | −0.160 | 0.870 | −0.255 | 0.216 | 0.981 |
| F8 | 0.501 | 0.129 | 3.890 | 0.000 | 0.248 | 0.754 | 1.650 |
| Constant | −1.868 | 0.894 | −2.090 | 0.037 | −3.620 | −0.115 | 0.154 |
Table 14.
Stepwise regression, variables removed according the sig. < 0.05 criteria.
| . Stepwise, pr (.05): Logistic WTP EDUCATION OCCUPATION INCOME GENDER AGE F1 F2 F3 F4 F5 F6 F7 F8 |
|---|
| Step 1: p = 0.8703 >= 0.0500 removing F7 |
| Step 2: p = 0.6116 >= 0.0500 removing OCCUPATION |
| Step 3: p = 0.4735 >= 0.0500 removing GENDER |
| Step 4: p = 0.4370 >= 0.0500 removing AGE |
| Step 5: p = 0.4595 >= 0.0500 removing F6 |
| Step 6: p = 0.2982 >= 0.0500 removing INCOME |
| Step 7: p = 0.3404 >= 0.0500 removing F1 |
Table 15.
Final model, pseudo R square.
| Logistic Regression | Number of Obs = | 399 |
|---|---|---|
| LR chi2(13) = | 86.62 | |
| Prob > chi2 = | 0 | |
| Log likelihood = −210.65756 | Pseudo R2 = | 0.1705 |
Table 16.
Goodness of fit test, Hosmer and Lemeshow.
| Step | Chi-Square | df | Sig. |
|---|---|---|---|
| 1 | 34.359 | 8 | 0.000 |
| 2 | 30.616 | 8 | 0.000 |
| 3 | 37.694 | 8 | 0.000 |
| 4 | 23.014 | 8 | 0.003 |
| 5 | 17.928 | 8 | 0.022 |
| 6 | 17.442 | 8 | 0.026 |
| 7 | 12.063 | 8 | 0.148 |
Table 17.
Variables included in the final logit model for the estimation of WTP.
| WTP | Coef. | Std. Err. | z | P > z | (95% Conf. | Interval) | Odds Ratio |
|---|---|---|---|---|---|---|---|
| (B) | (sig.) | Exp(B) | |||||
| EDUCATION | 0.239 | 0.098 | 2.430 | 0.015 | 0.046 | 0.432 | 1.270 |
| F8 | 0.487 | 0.126 | 3.860 | 0.000 | 0.240 | 0.734 | 1.627 |
| F3 | 0.404 | 0.128 | 3.160 | 0.002 | 0.153 | 0.655 | 1.498 |
| F4 | 0.534 | 0.129 | 4.130 | 0.000 | 0.280 | 0.788 | 1.706 |
| F5 | −0.469 | 0.116 | −3.730 | 0.000 | −0.716 | −0.223 | 0.599 |
| F2 | −0.498 | 0.123 | −4.040 | 0.000 | −0.740 | −0.256 | 0.608 |
| Contant | −2.080 | 0.534 | −3.890 | 0.000 | −3.126 | −1.033 | 0.125 |
Table 18.
Logit model overall prediction capabilities.
| Observed | Predicted | |||
| WTP | Percentage Correct | |||
| yes | no | |||
| WTP | yes | 39 | 67 | 36.8 |
| no | 15 | 223 | 93.7 | |
| Overall percentage | 76.2 | |||
Table 19.
Logit model, prediction capabilities when applied to RES users.
| Observed | Predicted | |||
| WTP | Percentage Correct | |||
| yes | no | |||
| WTP | yes | 54 | 35 | 60.7 |
| no | 21 | 125 | 85.6 | |
| Overall percentage | 76.2 | |||
© 2018 by the authors. Licensee MDPI, Basel, Switzerland. This article is an open access article distributed under the terms and conditions of the Creative Commons Attribution (CC BY) license (http://creativecommons.org/licenses/by/4.0/).
Share and Cite
MDPI and ACS Style
Ntanos, S.; Kyriakopoulos, G.; Chalikias, M.; Arabatzis, G.; Skordoulis, M. Public Perceptions and Willingness to Pay for Renewable Energy: A Case Study from Greece. Sustainability 2018, 10, 687. https://doi.org/10.3390/su10030687
AMA Style
Ntanos S, Kyriakopoulos G, Chalikias M, Arabatzis G, Skordoulis M. Public Perceptions and Willingness to Pay for Renewable Energy: A Case Study from Greece. Sustainability. 2018; 10(3):687. https://doi.org/10.3390/su10030687
Chicago/Turabian StyleNtanos, Stamatios, Grigorios Kyriakopoulos, Miltiadis Chalikias, Garyfallos Arabatzis, and Michalis Skordoulis. 2018. "Public Perceptions and Willingness to Pay for Renewable Energy: A Case Study from Greece" Sustainability 10, no. 3: 687. https://doi.org/10.3390/su10030687
Note that from the first issue of 2016, this journal uses article numbers instead of page numbers. See further details here.