Low Carbon Scenarios for Europe: An Evaluation of Upscaling Low Carbon Experiments
by
 , and
, and
Christophe Cassen
1,*, 
Meriem Hamdi-Chérif
2,
Giancarlo Cotella
3,
Jacopo Toniolo
3,
Patrizia Lombardi
3 and
Jean-Charles Hourcade
1 1
Centre National de la Recherche Scientifique-Centre International de Recherche sur L’environnement et le Développement (CIRED-CNRS), Nogent sur Marne 94736 CEDEX, France
2
Centre International de Recherche sur L’environnement et le Développement (CIRED-CNRS), Nogent sur Marne 94736 CEDEX, France
3
Dipartimento Interateneo di Scienze, Progetto e Politiche del Territorio (DIST), Politecnico di Torino, Viale Mattioli, 39, 10125 Torino, Italy
*
Author to whom correspondence should be addressed.
Sustainability 2018, 10(3), 848; https://doi.org/10.3390/su10030848
Submission received: 19 February 2018
/
Revised: 8 March 2018
/
Accepted: 10 March 2018
/
Published: 16 March 2018
(This article belongs to the Collection Advanced Methodologies for Sustainability Assessment: Theory and Practice)
Abstract
:This paper focuses on transformational processes in a post Paris agreement context. It uses IMACLIM-R, an E3 (Environment–Energy–Economy) model allowing for the integration of urban forms, transport dynamics, environmental policies and behaviors. Building upon the study of a set of local low carbon experiments throughout the European Union (EU), the paper explores two contrasted stylized scenarios of the low carbon transition in Europe. It highlights that carbon pricing policies are useful guides for transition but cannot achieve the ambitious objective without significant transition costs. It shows that low carbon experiments in the transport and energy sectors are critical dimensions of complementary measures in favor of green infrastructures. Broadening and upscaling low carbon experiments helps overcome the inertias of the transport sector by fostering radical changes in infrastructures, thereby introducing deep transformations in mobility behavior. This can then generate positive macroeconomic outcomes, even though they are also dependent on specific financial support, calling for a renegotiation of the social contract based on specific fiscal reforms and measures to secure funding for these initiatives. The paper concludes with some research avenues for improving this preliminary work and calls for a better understanding of the complexity of the socio-economic patterns of both the transition and the conditions for an effective implementation.
1. Introduction
The adoption of the Paris Agreement is considered a historical milestone in the long and complex history of climate policy negotiations [1]. Its successful implementation will now be highly dependent upon the ability of the 192 involved countries to accelerate the low carbon transition toward the 2 °C objective and even further to 1.5 °C [2]. Meeting these objectives will indeed require a drastic reduction of emissions and, therefore, huge technical and social transformations. To that end, parties have planned to regularly take stock of their commitments with the hope that this will raise the ambition of the overall climate action. Against this background, the EU has set ambitious climate targets by 2050 [3,4,5], now included within its own National Determined Contribution (NDC) [6]. More fundamentally, turning the Paris agreement principles into action and mobilizing effective drivers at different scales have become key issues. In line with the Lima Paris Action Agenda, now called Global Action Agenda, the Paris agreement thus gives a prominent role to non-state actors and stakeholders, including civil society, the private sector, cities and other subnational authorities, to complement national governments’ actions. This clearly echoes the growing importance of the low carbon initiatives taken by these actors over several years, in particular at the city level (e.g., the C40 cities networks).
From a research perspective, the role of territories in low carbon transition has, in recent years, become the subject of growing attention. A series of studies have focused on the development and consolidation of low carbon experiments by communities. They analyzed their content, actors’ strategies and the linkage with national regulations (e.g., [7,8,9,10,11,12,13,14]). In the same vein, [15,16] have more extensively studied a range of low carbon experiments throughout Europe, mostly located at the city level, analyzing the underlying societal processes at play.
Overall, these case studies reflect a bifurcation in lifestyles triggered not solely by the penetration of low carbon technologies. They also provide contexts and mechanisms that encourage significant behavioral change [11,17,18]. They are, however, extremely diverse and context-dependent, raising the issue of their upscaling as put forward by [13,14] using the framework of transition theory [19,20].
Our objective in this paper is to evaluate quantitatively this upscaling and related deep transformation in lifestyles and demand side solutions. This has indeed been underestimated in ‘socioeconomic emission scenarios’ by Energy Economy Environment (E3) models. These are complex numerical models that represent interactions among environmental, technological and human systems in a single integrated framework. They are used to generate quantified scenarios about the long-term evolutions of such interactions, usually on a global scale [21].
This paper aims at partly bridging this gap by representing, in a stylized manner, underlying trends of the qualitative evidence collected by [15,16,22] into the E3 model IMACLIM-R. It develops European scenarios which assess the socio-economic implications of an upscaling of low carbon experiments. More specifically, we focus on the mechanisms at play by identifying successful measures which support the development of low carbon experiments in transport and low carbon energy production modes. Transport is indeed a key sector in the low carbon transition characterized by strong inertias [23,24,25]. The sector is responsible for about one quarter of all energy-related CO2 emissions worldwide, with private vehicles accounting for around half of transport energy use and emissions. Energy production is supposed to face more rapid decarbonization by 2050 [26]. Following this, this article then scrutinizes the interplay between low carbon experiments in those fields and carbon pricing policies aimed at fostering the low carbon transition [27].
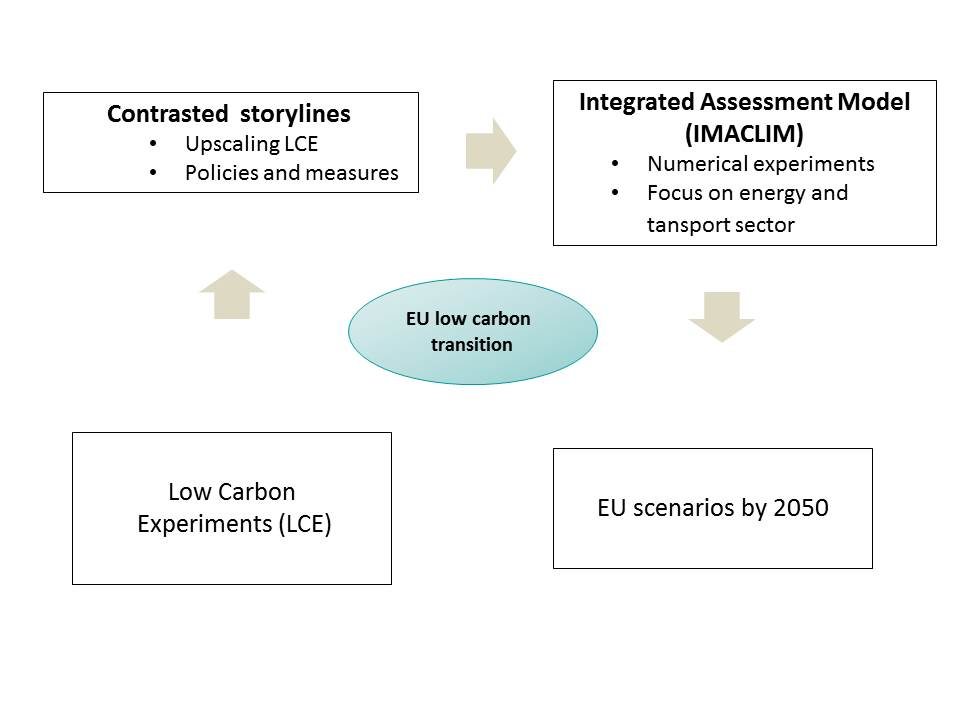
The paper is structured as follows. Section 2 presents the salient socio-economic features of a set of low carbon experiments drawing on a dataset from the achieved MILESECURE-2050 project (http://www.milesecure2050.eu/). Section 3 describes two alternative narratives and scenarios that consider different types of climate policies and upscaling of low carbon experiments, with a focus on two key sectors: transport and the energy production. Section 4 explains in further detail how the two narratives have been translated into many scenarios within the IMACLIM-R model. Section 5 presents some of the main findings obtained through the scenarios assessment. A concluding section rounds off the contribution discussing some of the implications of the presented results for policy-making as well as opening perspectives on future research.
2. Low Carbon Experiments in the Fields of Transport and Energy Production: Key Features
This section identifies key features of low carbon experiments analyzed within the EUFP7 MILESECURE-2050 project. [15,16,22] examined 90 local initiatives, located in 19 European countries that were already experimenting, at least partially, using an energy transition process. From this wider group of 90 experiences, 23 experiences were selected as highly successful. These low carbon experiments cover a large field of activities, namely, energy production, housing, mobility and transport, and services and industry. As mentioned in the introductory section, the paper concentrates on those that directly relate to the mobility/transport and low carbon energy production initiatives that represent, respectively, 30% and 15% of the representative low carbon experiments considered.
Concretely, in the mobility/transport sector, they consist in promoting greener modes of transport (e.g., public transport, car sharing, or cycling), developing multimodal hubs to reduce roads’ congestion, increasing better accessibility and coverage, etc. For instance, the purpose of the Amsterdam plan (2040) is to generalize the use of cycling within the city and its agglomeration, building on successful ongoing developments. Bremen (Germany) has also become a leading EcoMobile city by developing multimodal hubs which bring together transit, cycling, car sharing, and taxis in one location. The city has significantly improved conditions for walking and biking, enhancing car sharing and upgrading intermodal information systems. Part of these initiatives are conducted in a systemic way and within new forms of city planning, as in the case of Vitoria Gazteis (Spain), a municipality that concentrates its efforts on “superblocks” areas to reduce overall traffic flows by reorganizing transport networks.
Energy production initiatives strive predominantly for energy self-sufficiency by fostering renewables. Samsoed island in Denmark is a successful example of a territory which has succeeded in basing its energy production entirely on renewable fuel and has already been the subject of specific studies [10]. Juhnde, for its part, has become the first Bio Energy Village in Germany by substituting all fossil fuels for both electricity and heat production with biomass, and by setting a district heating grid that provides for 145 houses. Thus, each case study provides a new context for energy end-user behavior change and new types of governance (more decentralized and grassroots oriented).
From a quantitative perspective, these initiatives intend to significantly impact on citizens’ energy consumption and behaviors, though broad and systemic evaluations are missing. In Vitoria Gazteis, all the measures included within the Modern Plan (e.g., the increase of up to 30% of travels by bus or bike, of pedestrian areas by more than 50% and of bicycle lanes by 350% (from 38 km to 148 km), are estimated to induce 15% savings in fuel for each inhabitant. In Bremen, 60% of trips are already made by sustainable means, which comprises 14% trips by public transportation, 20% walking, and 25% biking [15]. Overall, the objective of these local initiatives is to significantly reduce CO2 emissions to almost zero by 2050.
This paper is an attempt to provide quantification via an E3 model of the overall economic impacts of such initiatives, considering radical changes in behaviors and lifestyles. Building upon this broad overview of low carbon experiments, the next sections will assess the socio-economic implications of their upscaling through the predisposition of specifically dedicated climate policies (in particular carbon pricing policies) and through other measures within the transport and energy production sectors.
3. How to Upscale Low Carbon Experiments: Two Alternative Narratives
This section sketches out two different stylized narratives that describe alternative transition pathways. Each awards a more or less relevant weight to broadening and upscaling low carbon experiments in the transport and energy production. To varying degrees, these two transition pathways lead to a reconfiguration of technologies, business models and production systems, as well as of the preferences and behaviors of consumers.
3.1. Carbon-Price Only Policy Scenario (CPO): A Top-Down Low Carbon Transition
This scenario considers a low carbon transition triggered only by carbon pricing policies, considered by the literature to be the main instrument for decarbonization. Carbon pricing policies are only implemented in this scenario for pure climate aims, to comply with the EU official climate objectives. The planned emissions reductions are of −20%, −40% and −80% respectively in 2020, 2030 and 2050, compared to the 2005 levels, according to the official EU NDC [6]. These objectives are independent from other goals (e.g., energy security, air pollution limitation, employment, etc.). This policy scenario may at first glance appear unrealistic, but it is consistent with the underlying established economic wisdom that favors a uniform carbon price used to minimize the costs of reaching a given decarbonization target [28]. It should be interpreted as a scenario in which a ‘shadow carbon price’ plays a pivotal role by being equal to a marginal abatement of greenhouse gases emissions costs throughout all economic sectors, no matter how this shadow price is transmitted throughout the economy. This can be done through a carbon tax, ex-post carbon pricing (carbon trading), or by implicit carbon pricing (notional value) used by firms for their internal management.
These economic wide instruments provide signal affecting agent behaviors for different components of economic activities, automatically triggering a transition pathway consistent with the EU climate objectives. In this scenario, no specific policies favoring innovative modes of transport, spatial reorganization and energy production are implemented on top of carbon pricing policies. Furthermore, the scenario does not assume deep changes in people’s lifestyle: both the top-down political and technical features of this scenario limit the involvement of local communities in participation processes focusing on energy transition.
3.2. Social Energy Transition Scenario (SET): Upscale Low Carbon Experiment
The Social energy transition (SET) scenario considers complementary drivers of the low carbon transition to carbon pricing. They are encapsulated in specific measures which consist in leveraging low carbon experiments in sectors that experiment high inertias, notably the transport sector. This is in line with the spirit of the Paris Agreement, which advocates that each country develops its own climate policies in function of its economic and social specificities. As in the CPO scenario, the EU plays an exemplary role in the climate negotiations but activates other levers for triggering its low carbon transition. Following the recommendations of the preamble of the Paris Agreement and articles 134 and 135 of the Decision calling for an upscale of the involvement of non-stakeholders, particularly civil society and local communities, an increasing number of low carbon experiments are part of a wider movement throughout the EU. Citizens and local authorities share a high awareness of climate change and are deeply committed to accelerating the low carbon transition through innovative experiments. More fundamentally, rather than being analyzed separately, this scenario builds upon the synergies between sectoral policies (such as transport/mobility and urban infrastructures) and climate objectives within low carbon experiments.
Contrary to the CPO scenario, carbon pricing is not the only guiding instrument of decarbonization. It is complemented by sectoral measures in which low carbon experiments, driven by local authorities or citizens, find a stimulating eco-system to flourish in. This is particularly relevant for transport, which is a high-energy and carbon-intensive sector characterized by weak price sensitivity.
In this context, the majority of European cities commit to significantly reducing the use of private cars, and it is expected that, by 2050, the majority of daily traveling will occur using sustainable public transportation. A redirection of investments in transportation infrastructures and urban planning toward traffic regulation is then considered. Massive investments are undertaken to significantly increase the number of bus lanes, subways, specific car sharing areas and rail transports. Public transport develops at the expense of private vehicle cars. Soft modes of transport (biking or walking) are also promoted thanks to a large movement of public space requalification in core cities and thanks to built forms that are less car-oriented, aiming at giving more space for pedestrians, bicycles and public transport. Connectivity and sharing are thus two central features of the transport and mobility systems, thereby contributing to the emergence of digital/smart cities. Intermodal hubs that put together all modes of transport spread in most cities. Thanks to an ecosystem of dynamic start-ups, the setting of digital solutions, such as dedicated platforms, contributes to connecting people in a better way and to sharing knowledge (e.g., state of the traffic, alternative ways and transport modes). This also contributes to restructuring production/distribution logistics, thereby inducing a decrease of freight transportation needs (e.g., through improved back loading, shorter or more transport-efficient ordering cycles etc.). Teleworking also develops and decreases the mobility needs for commuting, shopping and access to services.
Overall, the redirection of investments in transportation and urban planning, the improvement of traffic regulation and the increase in the share of non-gasoline-based transportation modes reduce “constrained mobility needs” and trigger significant changes in people’s mobility behaviors [29,30].
In parallel, the development of renewable energy accelerates with the increasing number of sustainable communities and micro and small low carbon energy solutions. A more decentralized energy transition based on participated decision-making emerges [31,32], though the IMACLIM-R model cannot address this issue properly. Local smart grid concepts are generalized to make distributed electricity generation possible on a large scale and to manage the electricity storage capacity created by the batteries of electric vehicles (EV) and hybrid vehicles. Distributed Energy Resources (such as EV plugged into the grid) for electric systems is complemented by distributing energy resources into the heating grid. The SET scenario takes into account potential small-scale producers (such as private houses and condominiums) that sell the energy excess of their heating systems to the grid. Overall, the SET scenario’s attention to small scale energy distribution also aims to increase the resilience of the energy system. Similarly, the alternatives that compose multi modal transport systems strengthens the resilience of the mobility system when faced with traffic congestion or traffic accidents.
4. From Narratives to Quantitative Assessments
4.1. The Modelling Framework
The purpose of E3 models is to analyze global comprehensive climate change mitigation across all environment and sectors, in order to achieve certain mitigation targets. In this section we provide a quantitative assessment of the two narratives described above and translate them into model scenarios to be implemented in the IMACLIM-R model.
As an E3 model, IMACLIM-R is a multi-region and multi-sector Computable General Equilibrium (CGE) that represents the intertwined evolution of economic growth, energy demand behavior and technical systems (Figure 1). It describes dynamic trajectories in a one-year step through the recursive succession of macroeconomic annual static equilibria and technical dynamic modules (Figure 1). It includes 12 regions, one of which is the EU28. The model is built not only to facilitate and allow the dialogue between engineers and economists but also to integrate other dimensions (such as environmental policies, human behaviors, urban forms, etc.) that enable a broader multidisciplinary dialogue among a large socio-scientist community (e.g., sociologists, geographers, political scientists, etc.).
By integrating the sectorial dynamics within a macro-economic closure, IMACLIM-R ensures a robust assessment of the challenges posed to the economy by low carbon transition pathways. In particular, it represents the dynamics of structural change (dematerialization of growth patterns) that results from the interplay between technological, institutional and spatial dynamics and patterns [33,34,35] and that is a salient feature of the societal processes underlying low carbon experiments. As mentioned in Section 2, low carbon experiments relate to changes in technologies and behaviors, in particular regarding energy production and transport practices. IMACLIM-R provides some innovative features to assess the multi-dimensional aspects of these low carbon experiments, beyond the pure technological dynamics that concern the electricity generation and concentrates on aspects related to the “lifestyle” dimension. This is done through an important vector that is linked to territorial and urban zoning policies, as well as to issues related to energy consumption, namely the transportation sector.
Transport is indeed a major issue to consider when dealing with bifurcation in lifestyles [24]. IMACLIM-R proposes a framework that helps disentangle the role of transport in long-term socio-economic trajectories and the potentials offered by specific measures in this sector to face significant energy and carbon related issues. Contrary to most E3 models that are used for carbon mitigation assessments, IMACLIM-R includes a stylized representation of ‘behavioral’ determinants, as a means of explicitly representing the interplay between transportation, energy and growth patterns [25]. This is a real added value, since most modelling tools are mainly based upon sectoral approaches that have either a ‘technology-based’ or ‘behavioral-based’ nature [24]. Indeed, in E3 models, behavioral and infrastructure options cannot easily be operationalized through monetary costs and are entangled with quality of life, norms, and cultural values [36]. Behavior and the end use of energy are represented as a simple rational choice between available alternatives, though recent tentative to improve behavioral realism of energy consumer in the transport sector [37].
In IMACLIM-R, the standard representation of transport technologies is supplemented by an explicit representation of the “behavioral” determinants of mobility that allows for an assessment of the potentials offered by specific sectoral measures to face emissions mitigation costs (see supplementary material). Passenger mobility is considered as a service provided by four transportation modes: terrestrial public transport, air transport, road transport (private vehicles) and non-motorized transport (walking and biking). Public transport” includes both urban public transports (buses, metros… etc.) and inter-city trains, as the model does not differentiate between inter- and intra-city trips. Three types of personal vehicles are represented: standard, hybrid and electrical vehicles. Each vehicle is characterized by its capital cost, which decreases endogenously in function of learning-by-doing process, its operating and maintaining costs and its energy intensity.
The model represents the constrained mobility induced by firms’ and households’ localization choices. This concerns daily travels that households have no choice but to realize in order to satisfy specific travel purposes (essentially commuting, shopping and access to services). They are exogenously represented by basic need parameters (one parameter for each transportation mode), and they implicitly define the spatial distribution of housing and economic activities.
Three freight transportation modes are considered: air, water and terrestrial transport. The freight transportation’s production intensity is measured via input–output coefficients, which define a linear dependence of freight mobility in a given mode to production volumes of a given sector. The higher the production volumes, the higher the freight mobility demand, if no specific policy toward the reduction of this volume is implemented. This representation implicitly captures two important features that drive the modal breakdown and the intensity of freight mobility needs, namely (i) the spatial organization of the production processes in terms of specialization/concentration of production units and (ii) the constraints imposed on distribution in terms of distance to the market and just-in-time processes.
Finally, as mentioned in Section 3, in the CPO and SET scenarios, the EU adopts its official objectives, leading with respect to 2005 to a 20%, 40% and 80% GHG emission reduction in 2020, 2030 and 2050, respectively. These objectives are translated into a regional CO2 emission profile which is prescribed exogenously for the period of 2010–2050. At each date, a maximum level of CO2 emissions from the production and use of fossil energies (coal, oil and gas) in final goods and in transformation processes is set for the EU. The European CO2 price is then endogenously and annually calculated by the model, so that the increase in the cost of fossil energies leads to a decrease of their use that is consistent with the emission constraint.
The next section describes how these narratives have been translated into modeling assumptions, rather than focusing on a comprehensive description of IMACLIM-R. For further details on the transportation sector in IMACLIM-R, the reader can refer to [38] and the supplementary material; for details on the model itself, see [39,40] or the IAM WIKI (http://themasites.pbl.nl/models/advance/index.php/Model_Documentation_-_IMACLIM).
4.2. Translation of the Low Carbon Experiments into Model Parameters
Integrating the rich material of low carbon experiments into IAMs represents a main challenge that somewhat exceeds the capacity of the IMACLIM model. As far as we know, there is no study dealing with this issue in the literature; the only studies are limited to place-specific models which consider a small number of locations, investigate infrastructures effects, demand side response policies and urban development [24,30]. The value added of a model such as IMACLIM-R is then to identify the mechanisms at play in the long-term dynamics of the low carbon transition. It does this by providing a quantitative assessment of policies and measures that allow for the transition. We thus integrate some of the key dynamics which underlie these low carbon experiments in the macro-economic general equilibrium framework of IMACLIM-R. Since the level of aggregation of the model represents a real gap with the complexity and heterogeneity of the low carbon experiment, we used proxies detailed in the next sub-sections, which provide a first-order approximation of their economic impact.
4.2.1. Within the Transportation Sector
Behavioral Side
The two alternative scenarios are distinguished by the nature of the transport-related policies that are considered or introduced in parallel to the carbon tax.
The CPO scenario considers a continuation of current trends of investment choices driving mobility demand, i.e., no changes with respect to those implemented in a benchmark scenario that considers no climate policies, the so-called No Emission Regulation (NER) scenario. It is assumed in particular that:
- (i)
- Constrained mobility evolves proportionally to total mobility in order to (i) take into account all basic mobility purposes, such as commuting, shopping and access to services, and (ii) have a proxy in order to represent the increase of urban sprawl as households gain better access to transport modes with increased performance. The ratio of the constrained mobility over the total households’ mobility demand is set to 50% throughout the studied period. This is a conservative assumption that does not consider measures for reducing constrained mobility and overcoming inertias in the transport sector.
- (ii)
- The allocation of investments in transportation infrastructures follows modal mobility demand and is implicitly driven by the objective of avoiding congestion. This means that for each transportation mode, the construction of infrastructures (road, railways and airports) is linked to the increase of the mobility demand of this mode (e.g., the more pkm are satisfied by private vehicles, the more roads will be built).
- (iii)
- The organization of production/distribution processes remains similar throughout the period, which means that the freight transport’s production intensity remains constant. For instance, when transportation costs increase due to energy or carbon price increases, the dependence of the production processes on transport remains constant.
In the SET scenario, the carbon pricing policy is complemented by measures to change the ‘behavioural’ determinants of transport in the course of the low-carbon transition (both directly and indirectly). Spatial planning policies and changes in investment decisions for long-lived transport-related infrastructures are represented. Indeed, urban characteristics can significantly impact transport demand (e.g., by incentivizing modal shifts from car transport to cycling), building size and behaviors [36]. This is done in a very synthetic way, as it encapsulates rich policy packages that are implemented at different spatial scales. The measures affect three crucial determinants of transportation activities that are explicitly represented in IMACLIM-R: the constrained mobility, transport capacities and freight transportation’s production intensity. More precisely, we assume:
- (i)
- A progressive reduction of households’ basic mobility from 50% of total mobility in 2020 to 30% in 2050 and after (vs. a constant 50% in the CPO and NER scenarios). This represents a spatial reorganization at the urban level (denser cities) and the implementation of soft measures in less mobility-dependent conglomerations.
- (ii)
- Shifts in the modal structure of investments in hard transportation infrastructures favoring public modes instead of private vehicles (walkable neighborhoods, public transit systems, highways, buildings). This is done through a limitation of building infrastructures for road and air transport, which induces a saturation of the corresponding transportation capacities. We assume a maximum threshold to the mobility offered by these two modes targeted at 3500 km/capita and 1000 km/capita, respectively, instead of there being no limitation in the CPO scenario [25].
- (iii)
- Reorganizations of production/distribution logistics inducing a decrease of freight transportation needs (e.g., improved back loading, more space-efficient packaging, shorter or more transport-efficient ordering cycles, etc.). A 2% yearly decrease of the freight transportation’s production intensity is assumed in the SET scenario.
Technological Side
When it comes to low-carbon end-use technologies in the transportation sector, two contrasted assumptions have been considered, whether it be for passenger mobility (e.g., the penetration of electric vehicles) or for freight mobility with parameters related to the energy efficiency of freight, or whether it be for both of them (e.g., biofuels penetration). These assumptions are translated into specific parametrizations.
For instance, as shown in Table 1, the penetration of vehicles in the model follows a classical S curve of market diffusion. The parametrization of the model allows, in the SET scenario, for the strong penetration of electric cars to reach a maximum 50% of the total car fleet at the end of the period, compared to 20% in the CPO scenario. The freight fuel consumption elasticity to fuel prices is also higher in the SET scenario.
4.2.2. Low Carbon Electricity Production Modes
Like for transport technologies, the two climate policy scenarios have been differentiated according to contrasted assumptions concerning the availability and diffusion of some low-carbon technologies for the electricity generation. The lever for action used in this paper to translate the low carbon experiments has been the renewable resources, with a particular focus on Photovoltaic (PV) and Wind (Onshore and Offshore) technologies. As described in the corresponding narratives (Section 3), the SET scenario is much more optimistic than the CPO scenario in terms of the penetration and diffusion of the renewable technologies. In this scenario, the parametrization allows for a higher availability with lower costs and higher potentials for PV and wind technologies (see Table 2).
5. Low Carbon Experiments as a Significant Driver of the Transition: Results from the IMACLIM-R Model
The two alternative scenarios, CPO and SET, are compared in the following sections to a No Emission Regulation scenario (NER), in which there is no public support for the adoption and implementation of drastic measures against CO2 emissions. The NER scenario is used as a benchmark for better disentangling the mechanisms at stake when considering carbon pricing and the development or zero or low carbon experiments.
5.1. Macroeconomic Impacts for the EU
The macroeconomic costs generated by the implementation of the EU climate policies described in the previous sections are evaluated by looking at the difference between the EU GDP in the climate scenarios (CPO and SET) and the GDP in the NER scenario. Despite GDP growth rates remaining positive over the whole period in both climate scenarios, both scenarios face significant GDP losses (see Table 3).
However, the magnitude of the losses differs between the CPO and the SET scenarios. They remain constant in the CPO scenario over the 2020–2030 decade (reaching 8%) while they decrease to 3% in 2030 in the SET scenario (Table 3). In both scenarios the losses also increase over the last two decades, but in the SET scenario, losses are halved when compared to the CPO scenario. This difference is the direct result of a lower carbon price that applies to the economy in the SET scenario (Table 4).
In both scenarios, the temporal profile of carbon prices is therefore a key dimension for understanding macroeconomic costs and follows the decarbonization level of the economy. Between 2020 and 2030, a relatively moderate CO2 price contributes in tapping most mitigation potentials in the power, residential, and industrial sectors, which represent the core of emissions reductions at that point in time [23]. Between 2030 and 2050, a steep increase of carbon prices is necessary for tackling the remaining emissions, particularly in the transportation sector, a sector with a low sensitivity to price signals [40]. Notably, the decarbonization of the transport sector is further complicated (and costlier) when transportation needs are higher. Carbon prices then increase from 249 $/tCO2 to 984 $/tCO2 in the CPO scenario vs. 134 $/tCO2 to 756 $/tCO2 in the SET scenario. The reader can be surprised by carbon prices far higher than those that often circulated in public debates, for instance in the report of the High Commission on Carbon Prices [27]. However, these figures are well within the range of magnitude obtained by the IPCC in 2030 (30–400$/tCO2) [26]. Between 2030 and 2050, the IPCC prices increase sharply (70–900$/tCO2) and so do our prices after 2030. In the SET scenario, the deployment of low-carbon infrastructures in the transportation sector after 2025, the reorganization of urban forms and the higher deployment of low-carbon energy technologies help smooth the low carbon transition. It accelerates the decarbonization of the economy and thus, after 2020, it lowers the level of the carbon price required to comply with the EU climate objectives.
5.2. Behind the Stage: The Mechanisms at Play
In the absence of a companion policy to offset this mechanism, higher energy costs entailed by carbon prices propagate throughout all sectors and result in higher production costs and higher selling prices of final goods. This in turn impacts households’ budgets and firms’ production capacities.
As illustrated in Table 5, the CPO scenario shows a higher share of energy costs in production costs for the industrial sector than is the case in the NER scenario. This increase in production costs is then passed on to industrial good prices, impacting the other sectors and households’ purchasing power. This generates a drop in the total final demand, a contraction of production, higher unemployment and additional weakening of households’ purchasing power.
Obviously, the lower the carbon price is, the lower its economic impact is. A lower CO2 price in the SET scenario decreases the energy costs with respect to the CPO scenario (e.g., 20% lower in 2030 and 2040), illustrating the deployment of the low carbon experiments.
Another mechanism at play that generates macro-economic costs relates to the households’ energy expenditures (Table 6). While in the NER scenario the share of energy expenditure in households’ budgets remains almost constant by 2050, it increases between 2010 and 2020 in the CPO and SET scenarios and then declines by 2050. Indeed, in the first phase, the carbon tax increases the cost of energy for households. The decline is then stronger in the SET scenario than in the CPO scenario (7% vs. 11% in 2050) in a context, as mentioned above, in which the carbon price is much lower than in the CPO scenario.
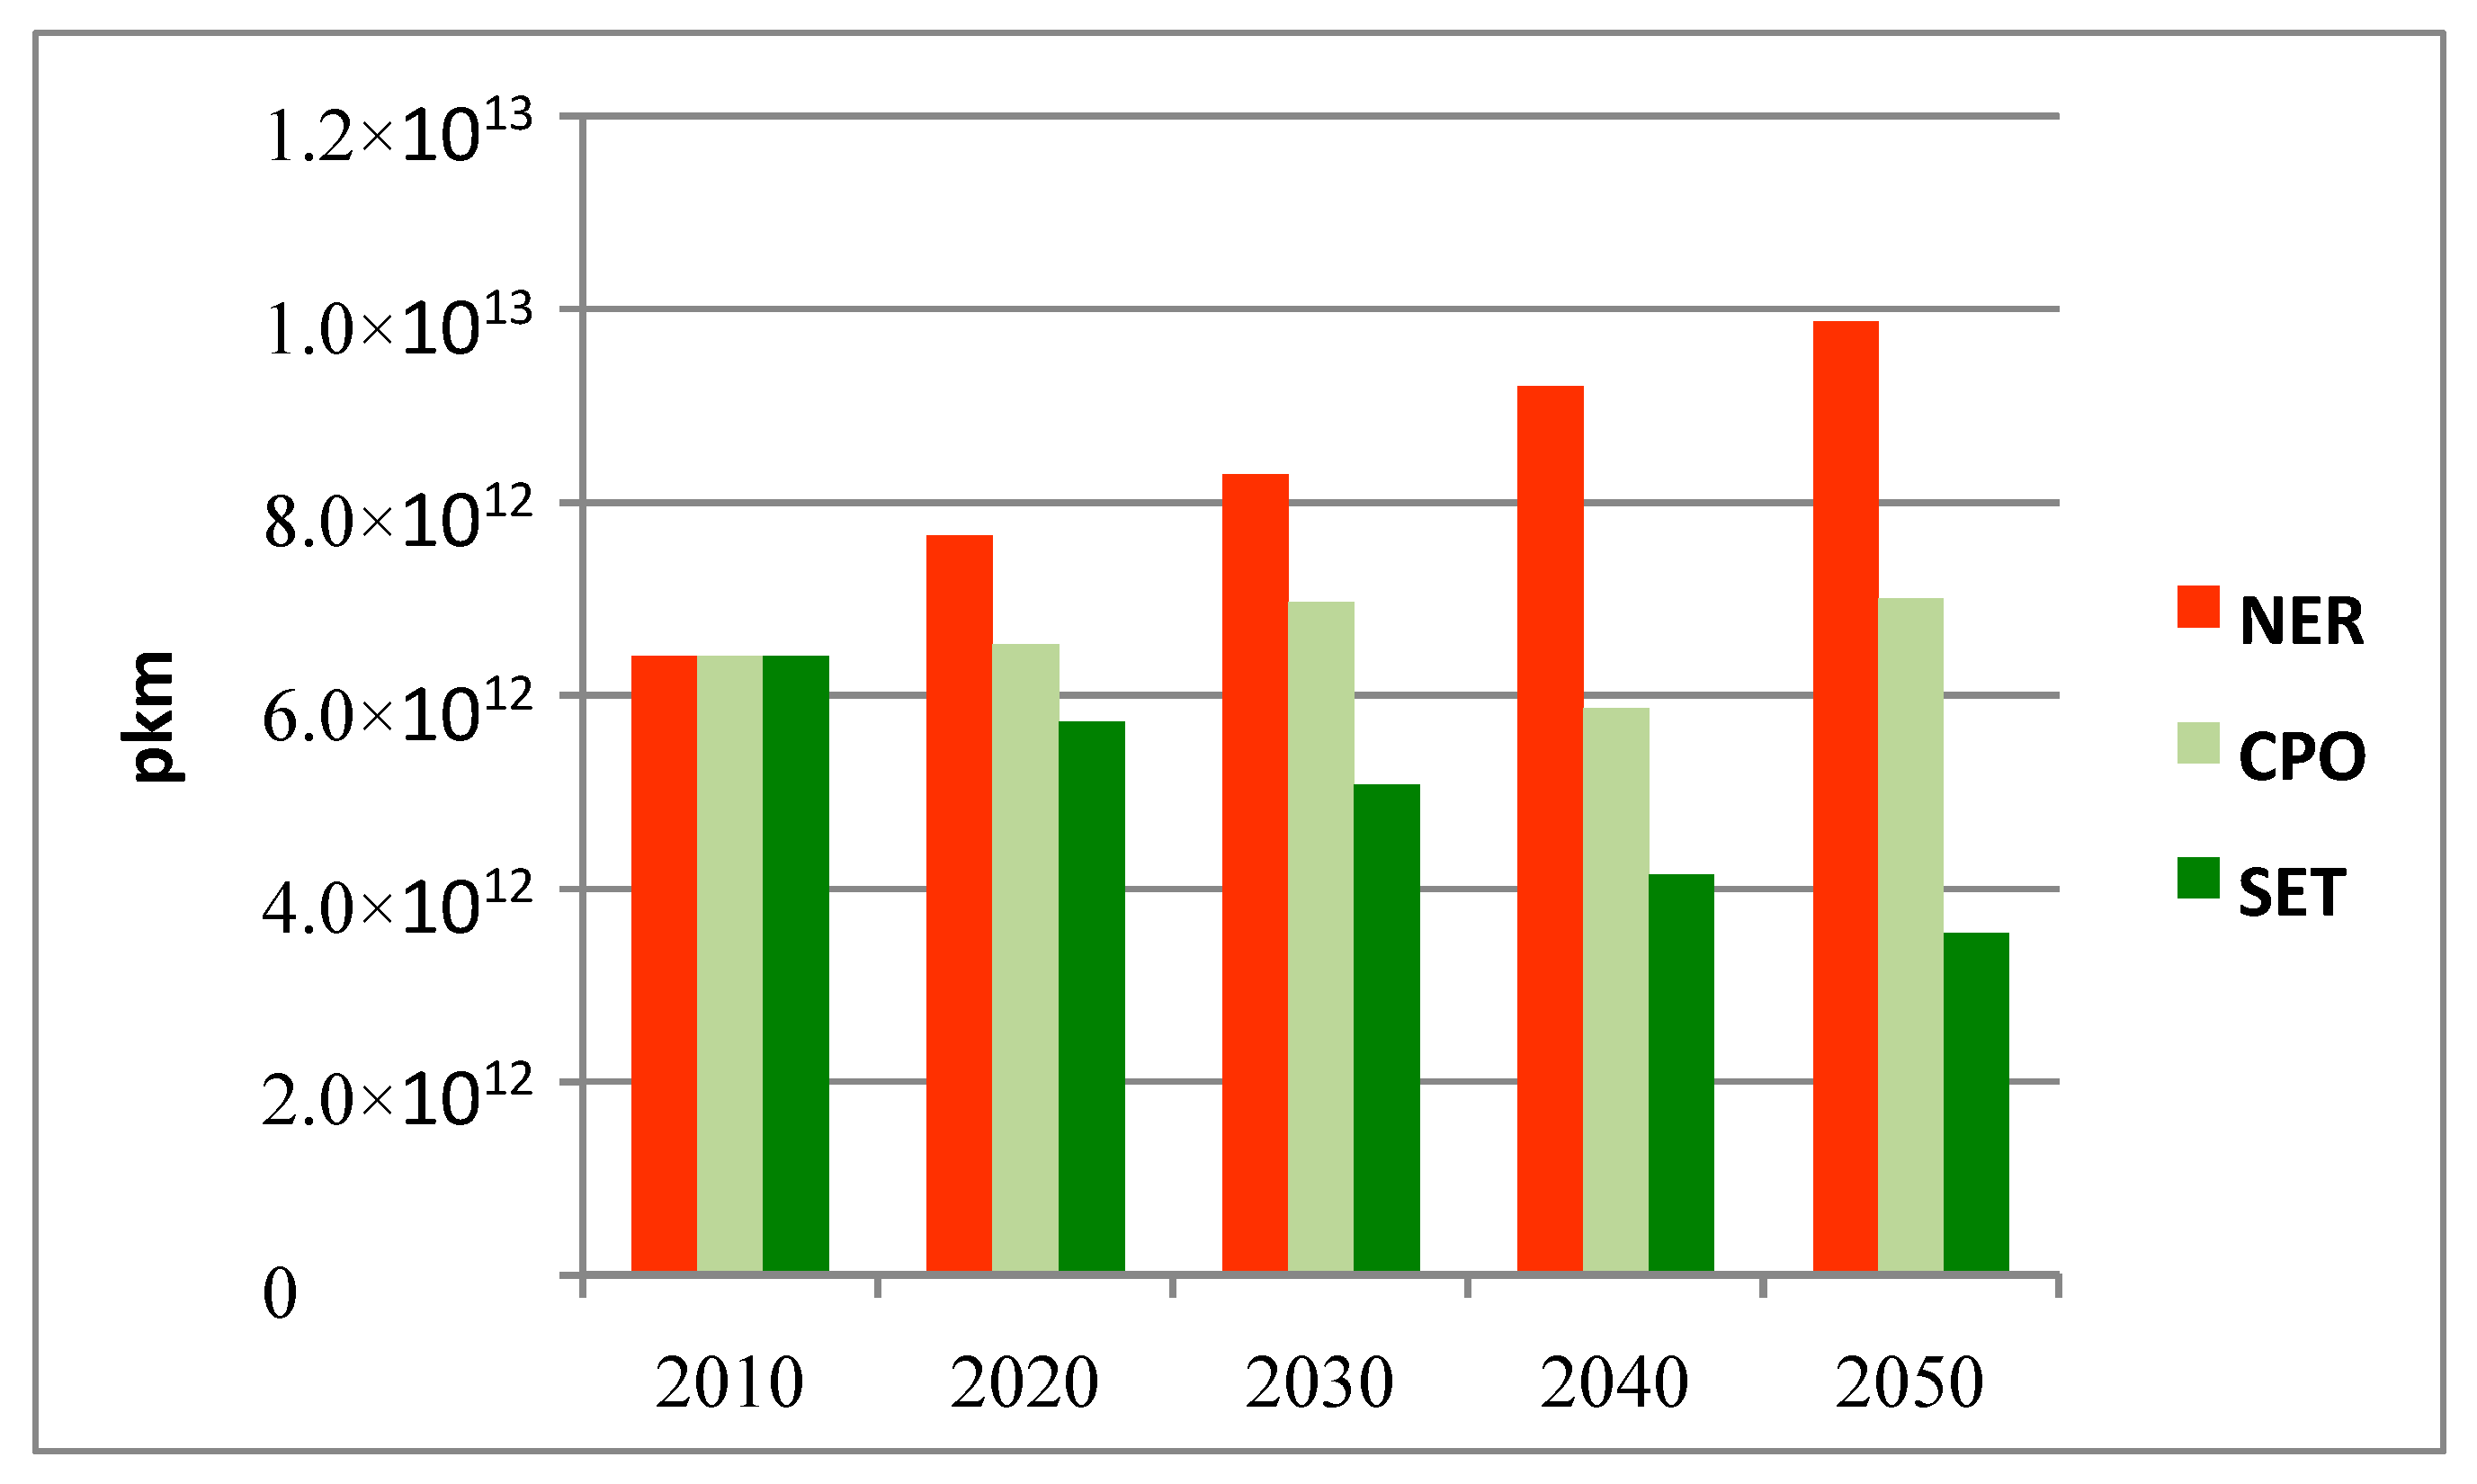
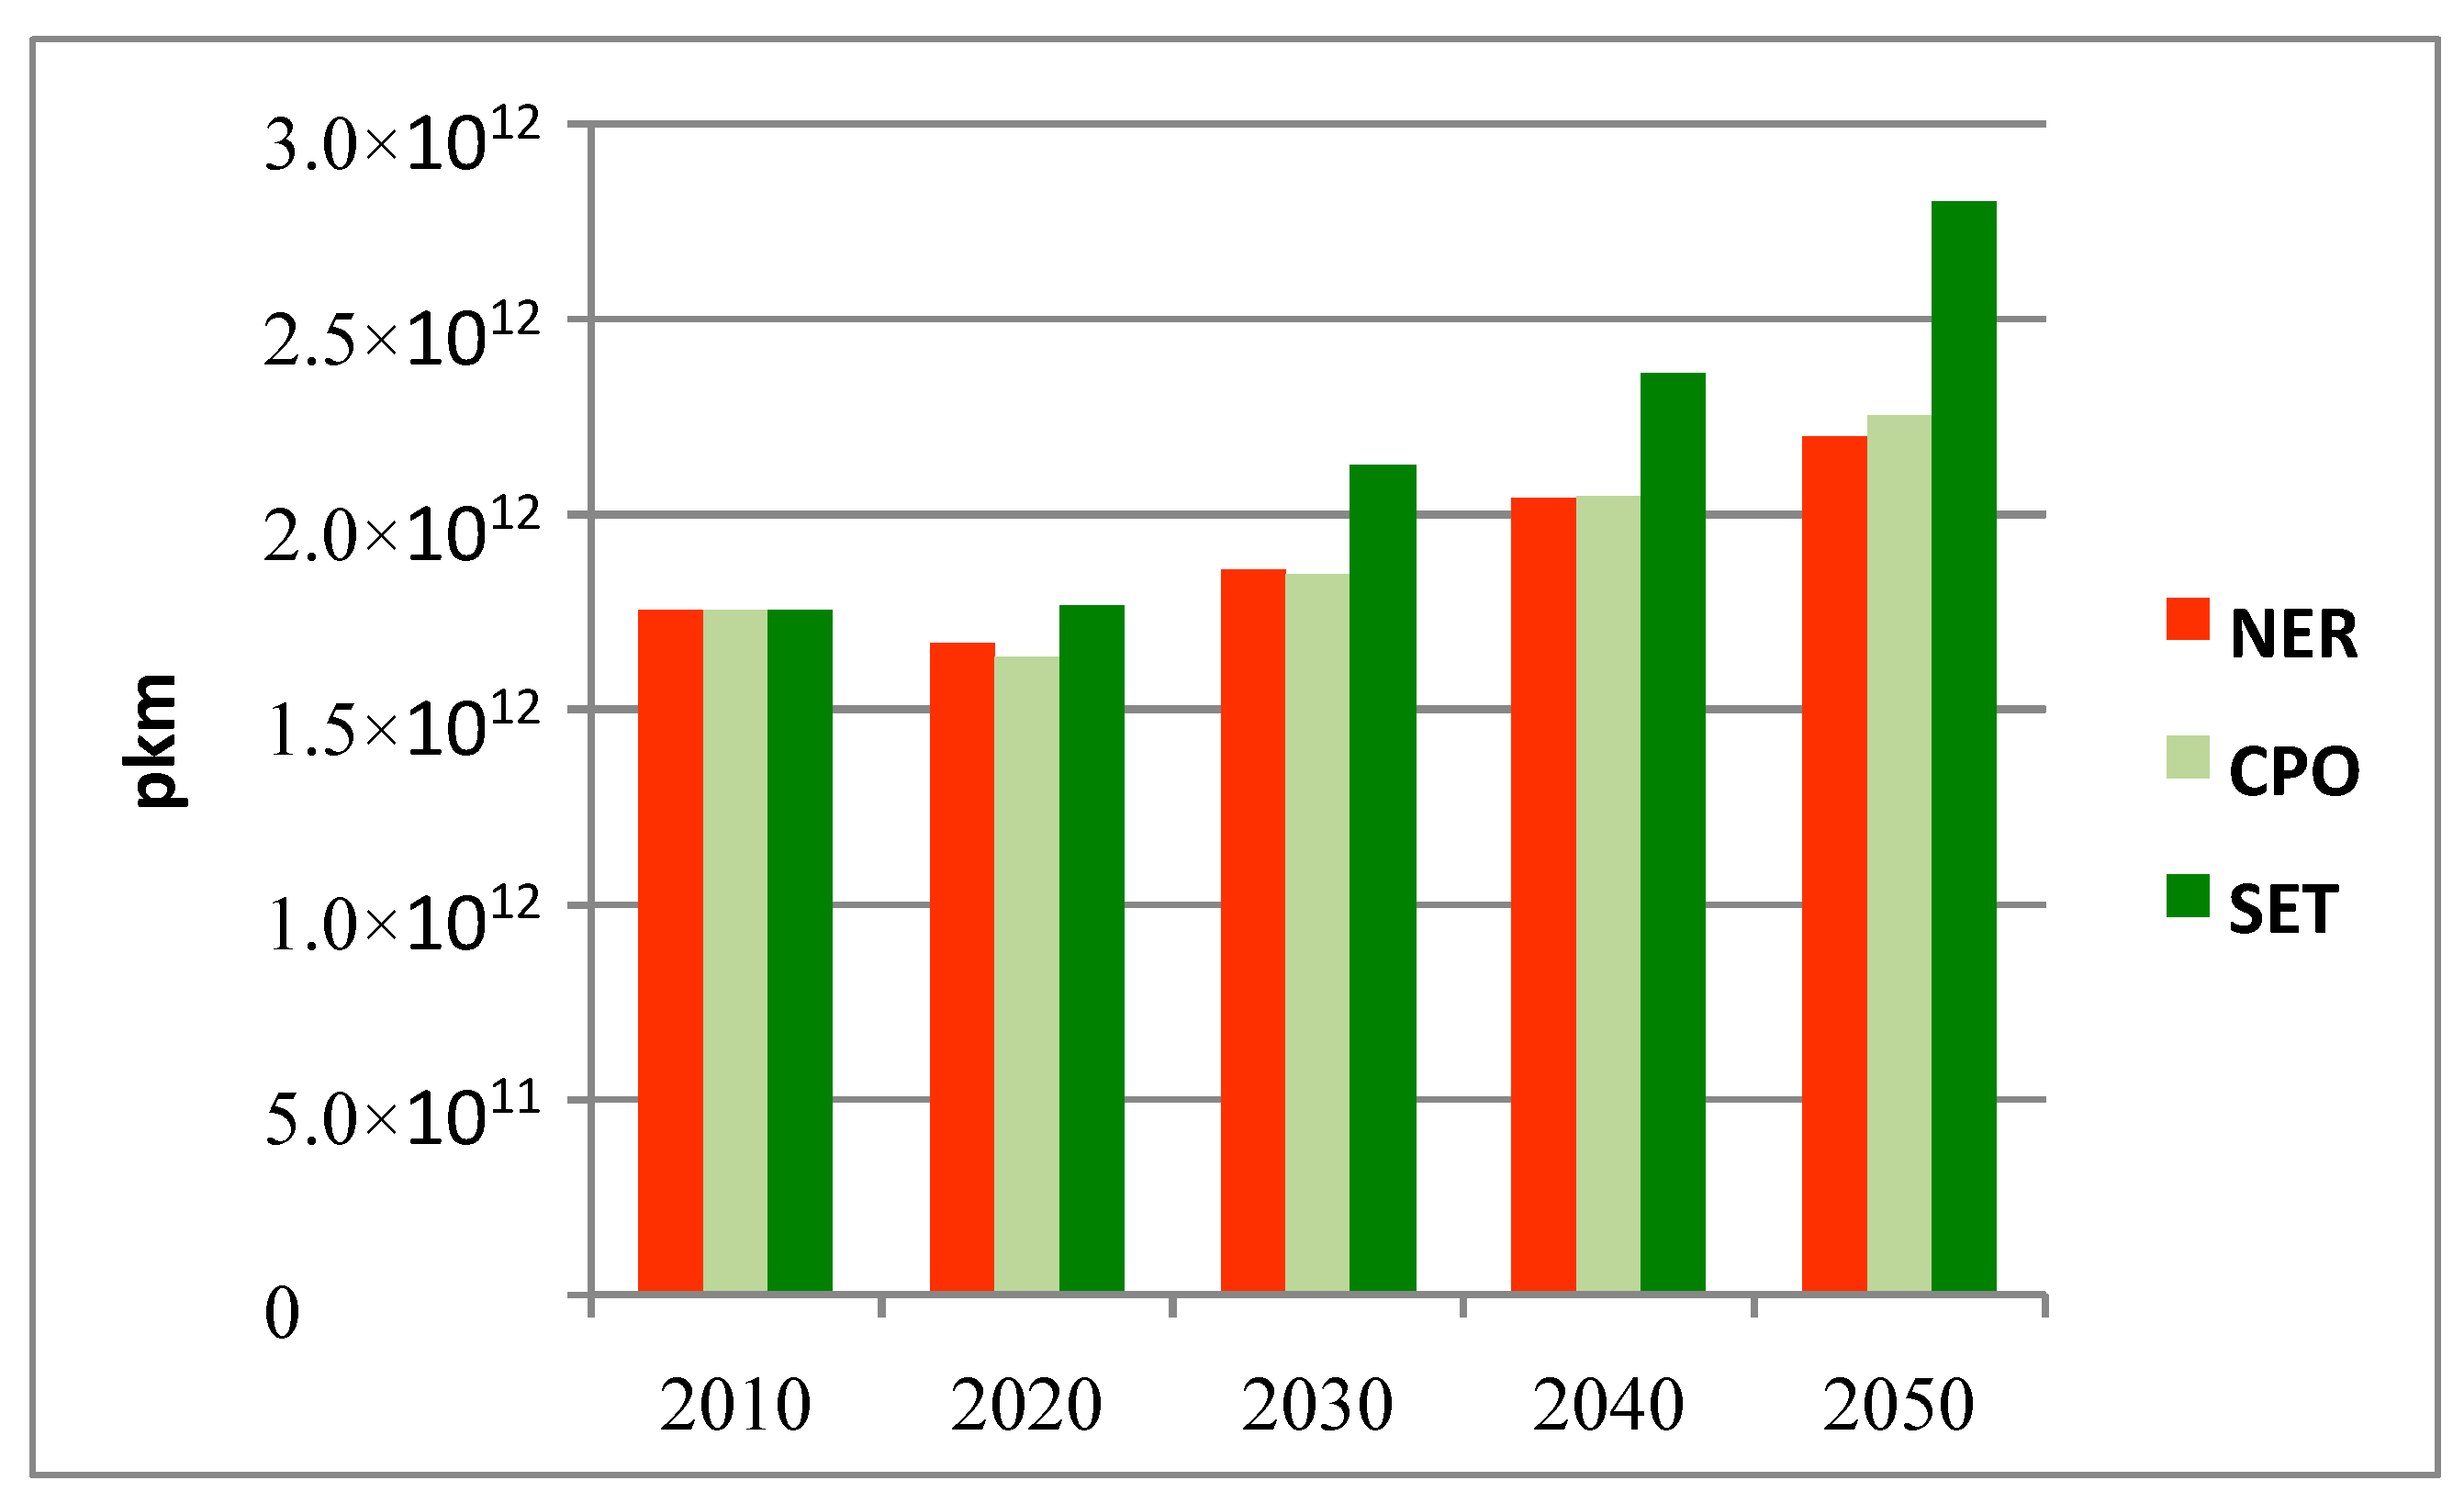
One can note that the share of energy expenditure in 2050 is also lower in the SET scenario than in the NER scenario. This outcome is a direct effect of the assumptions made in the SET scenario on the demand side regarding urban planning policies and transportation infrastructure measures that play a key role in terms of energy consumption. They imply twofold consequences. Firstly, in the SET scenario a reorganization of urban infrastructures decreases mobility needs, as shown in Figure 2, via the gradual decrease of the total passenger transport, representing half of the total amount in the NER scenario in 2050. Secondly, a relative shift toward low-carbon transportation modes starts after 2020. In 2030, the use of low-carbon public transport is 15% higher in the SET scenario than in the two other scenarios, and 25% higher by the mid-century (Figure 3).
Public transport then develops at the expense of personal vehicles. Figure 4 outlines that the mobility satisfied by personal vehicles in the SET scenario is, respectively, 30% and 50% lower in 2030 and 2050 than in the CPO scenario.
This trend goes together with a significant decarbonization of the transport sector in the SET scenario. Half of the vehicles in the total car fleet are electric or hybrid vehicles in 2050 (Table 7). These results are consistent with some recent studies [42,43]. They go also together with behavioral changes and innovative forms of city planning [44].
They benefit from a growing decarbonized electricity generation where renewable energies (wind and power only) exceed 50% in 2050 (Table 8) while the power and transport sectors face a slower decarbonization in the CPO scenario.
5.3. A Crucial Challenge: Triggering the Financing of Low Carbon Experiments
As a consequence of higher production costs, the high deployment of green infrastructures in transport and REN in the SET scenario, triggered by low carbon experiments and accompanying policies, does not prevent this scenario from negative impact growth when compared to the NER scenario. Consequently, this section addresses this issue and considers a new social contract whose purpose is to foster green investment and lower production costs. [15,16] insist in particular on some difficulties that low carbon experiments encounter throughout their early developmental stages. Financial risks can indeed increase the vulnerability of these experiments, in particular those that are the most capital intensive. In practice, CPO and SET scenarios show that although transition costs are reduced, the deployment of low carbon experiments does not completely avoid them.
In light of this, we address the remaining macroeconomic costs in the SET scenario by considering a tax reform based on the recycling of the carbon tax revenues into lower payroll taxes and based on directing savings toward low carbon investments and projects instead of liquid assets or real estate [45]. This new set of incentives has a twofold objective: lowering labor costs and limiting the investment risk that arises from part of these low carbon experiments by improving their capacity investment (through better access to loans). Thus, the financial availabilities of municipalities and other local/regional authorities are drastically increased and allow for ambitious actions to subsidize local renewables, as well as for the development of local/regional infrastructures in transport and energy distribution and management.
Implementing such measures into the model shows significant improvements in terms of macroeconomic costs (Table 9).
Though a carbon tax continues to generate some losses until 2040, these losses are very negligible thanks both to the stimulating effect on growth of higher investments in green infrastructures and to labor tax cuts. They reach a maximum of 0.5% in 2040, while they amounted to 8% when no tax reform was considered. After 2040, with respect to the NER scenario, the deployment of the low carbon experiments and related behavioral changes induce a positive effect on the entire economy, leading to macro-economic gains (+1.1% in 2050).
6. Conclusions and Discussion
After the adoption of the Paris Agreement, prompting transformational processes has become a key challenge for Europe, in order for it to put into practice its relatively ambitious commitments, especially in a context where the EUETS is currently on a drip. Indeed, the transition toward a low carbon society requires a radical overhaul of the existing system; huge efforts in policy-making, technological innovation and behavioural change are all necessary [29,46]. One of the merits of the presented work is to acknowledge how an effective low carbon transition would imply huge behavioral changes for virtually all stakeholders—firms, consumers, and governments—and how, if not carefully steered, it may generate unintended consequences.
The present contribution tried to shed some light on this matter and clarify some conditions for an effective and ambitious transition, simulating the role of low carbon experiments as a driver of the low carbon transition. This is done through the application of the E3 model IMACLIM-R and the development of two differing main scenarios. Our findings highlight the fact that carbon pricing policies are useful guides for the transition but that they cannot on their own achieve the ambitious objective, rather requiring significant transition costs. The simulations demonstrate that low carbon experiments in the transport and energy sectors, such as the ones in the SET scenario, are critical complementary measures for lowering transition costs. Indeed, they help overcome the inertias of the transport and mobility sector by fostering radical changes in infrastructures, thereby introducing radical changes in behaviors.
This paper at the very least shows that providing adequate financing is a key condition for the deployment of low carbon experiments. The ability to finance decarbonization and to re-negotiate implicit social contracts (fiscal reforms and measures to the secure funding for the various initiatives) is, however, highly dependent upon the political context in each individual EU country or region and will also strongly depend on how decarbonization proceeds abroad, both in other countries and at the global level.
This study is a first and partial assessment with the IMACLIM-R model; further improvement in the model is necessary, following three main directions. First, the range of low carbon experiments considered within this modeling exercise was limited to two sectors. Innovative experiments in the building sector deserve more attention as the decarbonization of this sector will be another key challenge in the transition. Buildings currently account for 30% to 40% of the total final energy demand and over 30% of all energy-related CO2 emissions. Potentials of reduction, even at the EU level, are significant [47] and the multiplication of eco-neighborhoods and eco-districts in many cities often relies on an integrated (or aiming to be integrated) vision of mobility patterns, housing design and job location [44]. Second and in the same vein, the current tentative to promote local food production (e.g., by supporting short food circuits) should be taken into account more. Broader changes in lifestyles and behaviors could include potential changes in the food diets and production at the local level and innovative forms of collaborative energy production modes. Third, these findings call for a more in-depth examination of the link between climate policies and other development issues, which is certainly the primary condition for a successful transition. However, more systemic estimates of the potential co-benefits (and potential side effects) of a low carbon experiment upscale (such as on energy security, health improvement or job creation) should be conducted.
These research orientations, which relate to the necessary conditions for catalyzing the transition, therefore require interdisciplinary and multi-scale collaborations (including with higher spatial and jurisdictional resolution models and big models). This is key to better understanding the complexity of the socio-economic patterns of the transition and making its implementation more effective.
Supplementary Materials
The following are available online at https://www.mdpi.com/2071-1050/10/3/848/s1.
Acknowledgments
The authors would like to express their gratitude to all the partners of the transnational consortium that is responsible for the development of the FP7 Project MILESECURE-2050: Multidimensional Impact of the Low-carbon European Strategy on Energy Security, and Socio-Economic Dimension up to 2050 perspective (www.milesecure2050.eu) (2012–2015). This article has in particular benefited from the collaboration with Instytut Energetyki IEN (Zygmunt Parczewski) and Energsys (Adam Umer, Marek Niemyski) and Laboratory of Citizenship Science (Gabriele Quinti, Giovanni Ciaiti) within MILESECURE-2050. Additional gratitude goes to the colleagues of the Société de Mathématiques Appliqués et de Sciences Humaines (SMASH) and Politecnico di Torino involved in the project for the continuous proactive collaboration during the research work and support from the Long-term modelling chair for sustainable development (Ponts Paristech-Mines Paristech) funded by Ademe, Grt-Gaz, Schneider Electric, EDF, French ministry of Environment.
Author Contributions
Christophe Cassen and Meriem Hamdi-Chérif both conceived and designed the methodology to assess low carbon experiments with the IMACLIM model. Christophe Cassen developed the “problematique”, the articulation between quantitative and qualitative results. He lead the manuscript draft and the review response process and resubmission tasks to the journal. Meriem Hamdi-Chérif modeled the scenarios with the IMACLIM model and contributed substantively to write the manuscript draft and to the review response process. Giancarlo Cotella and Jacopo Toniolo provided insights respectively on the urban and energy issues. Giancarlo Cotella contributed actively to the resubmission process. Patrizia Lombardi was the Principal Investigator of the MILESECURE-2050 project and with Jean Charles Hourcade help put together the rationale of the paper and to improve the overall quality of the text.
Conflicts of Interest
The authors declare no conflict of interest
References
- Bodansky, D. The Paris Climate Change Agreement: A New Hope? Am. J. Int. Law 2016, 100, 288–319. [Google Scholar] [CrossRef]
- UNFCCC. Adoption of the Paris Agreement. 2015. Available online: http://unfccc.int/resource/docs/2015/cop21/eng/l09r01.pdf (accessed on 9 March 2018).
- European Commission. Proposal for a Decision of the European Parliament and of the Council on the Effort of Member States to Reduce Their Greenhouse Gas Emissions to Meet the Community’s Greenhouse Gas Emission Reduction Commitments up to 2020; European Commission: Brussels, Belgium, 2008. [Google Scholar]
- European Commission. Energy Roadmap 2050; COM (2011) 885 Final; European Commission: Brussels, Belgium, 2011. [Google Scholar]
- European Commission. A 2030 Framework for Climate and Energy Policies; Green Paper; COM (2013) 169 Final; European Commission: Brussels, Belgium, 2013. [Google Scholar]
- European Council. Submission by Latvia and the European Commission on Behalf of the European Union and Its Member States; Latvian Presidency of the Council of the European Union: Brussels, Belgium, 2015.
- Smith, A. Emerging in between: The multi-level governance of renewable energy in the English regions. Energy Policy 2007, 35, 6266–6280. [Google Scholar] [CrossRef]
- De Witt, J. Opportunities for economic and community development in energy and climate change. Econ. Dev. Q. 2008, 22, 107–111. [Google Scholar]
- Peters, M.; Fudge, S. Motivating Individual Carbon Reduction through Local Government-Led Community Initiatives in the UK. Available online: http://www.score-network.org/files/24121_CF2_session_3-4.pdf#page=20S (accessed on 9 March 2018).
- Saastamoinen, M. Samsø—Renewable Energy Island Programme, Denmark. Case Study for WP2 (Analysis of Success Factors, Underlying Models and Methods of Target Group Interaction) of the EC FP7 Project Changing Behaviour. 2009. Available online: http://www.energychange.info/casestudies (accessed on 9 March 2018).
- Middlemis, L.; Parrish, B.D. Building capacity for low-carbon communities: The role of grass roots initiatives. Energy Policy 2010, 38, 7559–7566. [Google Scholar] [CrossRef]
- Nadaï, A.; Labussière, O.; Debourdeau, A.; Régnier, Y.; Cointe, B.; Dobigny, L. French policy localism: Surfing on Positive Energie Territories (Tepos). Energy Policy 2015, 78, 281–291. [Google Scholar] [CrossRef]
- Williams, J. Can low carbon city experiments transform the development regime? Futures 2016, 77, 80–96. [Google Scholar] [CrossRef]
- Williams, J. Lost in translation: Translating low carbon experiments into new spatial contexts viewed through the mobile-transitions lens. J. Clean. Prod. 2017, 169, 191–203. [Google Scholar] [CrossRef]
- Caiati, G.; Quinti, G.; Santangelo, M.; Crivello, S.; Sitko, I.; Kazakopoulus, P. Report on Comparative Analysis, D2.2 of MILESECURE-2050 Project. 2014. Available online: http://www.milesecure2050.eu/en/public-deliverables (accessed on 9 March 2018).
- Caiati, G.; Quinti, M. European Distributed Renewable Energy Case Studies. In Low-Carbon Energy Security from a European Perspective; Lombardi, P., Gruening, M., Eds.; Elsevier: Amsterdam, The Netherlands, 2016. [Google Scholar]
- Middlemiss, L. Influencing individual sustainability: A review of the evidence on the role of community-based organisations. Int. J. Environ. Sustain. Dev. 2008, 7, 78–93. [Google Scholar] [CrossRef]
- Heiskanen, E.; Johnson, M.; Robinson, S.; Vadovics, E.; Saastamoinen, M. Low-carbon communities as acontext for individual behavioural change. Energy Policy 2010, 38, 7586–7595. [Google Scholar] [CrossRef]
- Rotmans, J. Societal Innovation: Between Dream and Reality Lies Complexity; Erasmus Research Institute of Management: Rotterdam, The Netherlands, 2005. [Google Scholar]
- Loorbach, D.; Rotmans, J. The practice of transition management: Examples and lessons from four distinct cases. Futures 2010, 42, 237–246. [Google Scholar] [CrossRef]
- Creutzig, F. Evolving Narratives of Low-Carbon Futures in Transportation. Transp. Rev. 2015. [Google Scholar] [CrossRef]
- Caiati, G.; Quinti, G.; Kazakopoulos, P.; Sitko, I. Report on Integrated Analysis of Local Anticipatory Experiences in Energy Transition, D2.1 of MILESECURE-2050 Project. 2013. Available online: http://www.milesecure2050.eu/en/public-deliverables/2 (accessed on 9 March 2018).
- International Panel on Climate Change (IPCC). Climate Change Mitigation; Metz, B., Davidson, O.R., Bosch, P.R., Dave, R., Meyer, L.A., Eds.; Cambridge University Press: Cambridge, UK, 2007; p. 863. [Google Scholar]
- Sims, R.; Schaeffer, R.; Creutzig, F.; Cruz-Núñez, X.; D’Agosto, M.; Dimitriu, D.; Figueroa Meza, M.J.; Fulton, L.; Kobayashi, S.; Lah, O.; et al. Transport. In Climate Change 2014: Mitigation of Climate Change; Contribution of Working Group III to the Fifth Assessment Report of the Intergovernmental Panel on Climate Change; Edenhofer, O., Pichs-Madruga, R., Sokona, Y., Farahani, E., Kadner, S., Seyboth, K., Adler, A., Baum, I., Brunner, S., Eickemeier, P., et al., Eds.; Cambridge University Press: Cambridge, UK, 2014. [Google Scholar]
- Waisman, H.; Guivarch, C.; Lecocq, F. The transportation sector and low-carbon growth pathways: Modelling urban, infrastructure, and spatial determinants of mobility. Clim. Policy 2013, 13, 106–129. [Google Scholar] [CrossRef] [Green Version]
- Clarke, L.; Jiang, K.; Akimoto, M.; Babiker, M.; Blanford, G.; Fisher-Vanden, K.; Hourcade, J.-C.; Krey, V.; Kriegler, E.; Löschel, A.; et al. Assessing Transformation Pathways. In Climate Change 2014: Mitigation of Climate Change; Edenhofer, O., Pichs-Madrugada, R., Sokona, Y., Eds.; Cambridge University Press: Cambridge, UK, 2014; pp. 413–510. [Google Scholar]
- Stern, N.; Stiglitz, J. Report of the High Level Commission on Carbon Prices. The World Bank: Washington. Available online: https://static1.squarespace.com/static/54ff9c5ce4b0a53decccfb4c/t/59b7f2409f8dce5316811916/1505227332748/CarbonPricing_FullReport.pdf (accessed on 9 March 2018).
- Tirole, J. Politique Climatique: Une Nouvelle Architecture Internationale; Conseil d’Analyse Economique: Paris, France, 2009; p. 358. [Google Scholar]
- Valkenburg, G.; Cotella, G. Governance of energy transitions: About inclusion and closure in complex sociotechnical problems. Energy Sustain. Soc. 2016, 6, 1–11. [Google Scholar] [CrossRef]
- Creutzig, F.; Jochem, P.; Edelenbosch, O.Y.; Mattauch, L.; Van Vuuren, D.P.; McCollum, D.; Minx, J. Transport: A roadblock to climate change mitigation? Science 2015, 350, 911–912. [Google Scholar] [CrossRef] [PubMed]
- Lilliestam, J.; Hangera, S. Shades of green: Centralisation, decentralisation and controversy among European renewable electricity visions. Energy Res. Soc. Sci. 2016, 17, 20–29. [Google Scholar] [CrossRef]
- Foxon, T.J.; Pearson, P.J.G.; Arapostathis, S.; Carlsson-Hyslop, A.; Thornton, J. Branching points for transition pathways: Assessing responses of actors to challenges on pathways to a low carbon future. Energy Policy 2013, 52, 146–158. [Google Scholar] [CrossRef]
- Hourcade, J.C. Modelling long-run scenarios: Methodology lessons from a prospective study on a low CO2 intensive country. Energy Policy 1993, 21, 309–326. [Google Scholar] [CrossRef]
- Sassi, O.; Crassous, R.; Hourcade, J.C.; Gitz, V.; Waisman, H.; Guivarch, C. IMACLIMR: A modelling framework to simulate sustainable development pathways. Int. J. Glob. Environ. Issues 2010, 10, 5–24. [Google Scholar] [CrossRef]
- Grubb, M.; Hourcade, J.-C.; Neuhoff, K. Planetary Economics; Routledge: London, UK; New York, NY, USA, 2014; p. 520. [Google Scholar]
- Creutzig, F.; Fernandez, B.; Haberl, H.; Khosla, R.; Mulugetta, Y.; Seto, K.C. Beyond Technology: Demand-Side Solutions for Climate Change Mitigation. Annu. Rev. Environ. Resour. 2016, 41, 173–198. [Google Scholar] [CrossRef]
- McCollum, D.L.; Wilson, C.; Pettifor, H.; Ramea, K.; Krey, V.; Riahi, K.; Bertram, C.; Lin, Z.; Edelenbosch, O.Y.; Fujisawa, S. Improving the behavioral realism of global integrated assessment models: An application to consumers’ vehicle choices. Transp. Res. Part D Transp. Environ. 2016, 55, 322–342. [Google Scholar] [CrossRef]
- Cassen, C.; Hamdi-Chérif, M.; Houcade, J.-C. Report on Policy Implications of the Integrated Analysis and on the Numerical Information, 2015 Deliverable 4.3 of MILESECURE-2050 project. Available online: http://www.milesecure2050.eu/en/public-deliverables (accessed on 9 March 2018).
- Waisman, H.; Guivarch, C.; Grazi, F.; Hourcade, J.C. The Imaclim-R model: Infrastructures, technical inertia and the costs of low carbon futures under imperfect foresight. Clim. Chang. 2012, 114, 101–120. [Google Scholar] [CrossRef]
- Hamdi-Cherif, M.; Waisman, H.-D. Global carbon pricing and the “Common but differentiated responsibilities”—The case of China. Int. Environ. Agreem. Politics Law Econ. 2016, 16, 671–689. [Google Scholar] [CrossRef]
- Rozenberg, J.; Hallegatte, S.; Vogt-Schilb, A.; Sassi, O.; Guivarch, C.; Waisman, H.; Hourcade, J.-C. Climate change and energy security: Climate policies as a hedge against the uncertainty on future oil supply. Clim. Chang. 2010, 101, 663–668. [Google Scholar] [CrossRef] [Green Version]
- IEA. Global EV Outlook 2017; IEA: Paris, France, 2017; p. 71. [Google Scholar]
- Enerdata. Up to 50% of the Global Car Fleet, Could Be Electric in 2050. Executive Brief. 2018. Available online: https://www.enerdata.net/publications/executive-briefing/half-car-fleet-electric-2050.html (accessed on 9 March 2018).
- Seto, K.C.; Dhakal, S.; Bigio, A.; Blanco, H.; Delgado, G.C.; Dewar, D.; Huang, L.; Inaba, A.; Kansal, A.; Lwasa, S.; et al. Human Settlements, Infrastructure and Spatial Planning. In Climate Change 2014: Mitigation of Climate Change; Edenhofer, O., Pichs-Madrugada, R., Sokona, Y., Eds.; Cambridge University Press: Cambridge, UK, 2014. [Google Scholar]
- Hourcade, J.C.; Aglietta, M.; Perissin-Fabert, B. The low carbon transition between the animal spirits of finance and the fault lines of the world economy. In Moving the Trillions a Debate on Positive Pricing of Mitigation Actions; Sirkis, A., Ed.; Brazil Center on Climate: Rio de Janeiro, Brazil, 2015; p. 157. [Google Scholar]
- Valkenburg, G.; Bijker, W.E.; Swierstra, T.E.; Bichard, E.; Caiati, G.; Cassen, C.; Cotella, G.; Gruning, M.; Quinti, G. Secure and Low-Carbon Energy Is Citizens’ Energy—A Manifesto for Human-Based Governance of Secure and Low-Carbon Energy Transitions; The MILESECURE2050 Project: Maastricht, The Netherlands; Torino, Italy, 2015. [Google Scholar]
- Lucon, O.; Urge-Vorsatz, D.; Azni Zain, A.; Akbari, H.; Bertoldi, P.; Cabeza, L.F.; Eyre, N.; Gadgil, A.; Harvey, L.D.D.; Jiang, Y.; et al. Buildings. In Climate Change 2014: Mitigation of Climate Change; Edenhofer, O., Pichs-Madrugada, R., Sokona, Y., Eds.; Cambridge University Press: Cambridge, UK, 2014. [Google Scholar]
Figure 1.
Recursive and modular architecture of IMACLIM-R.
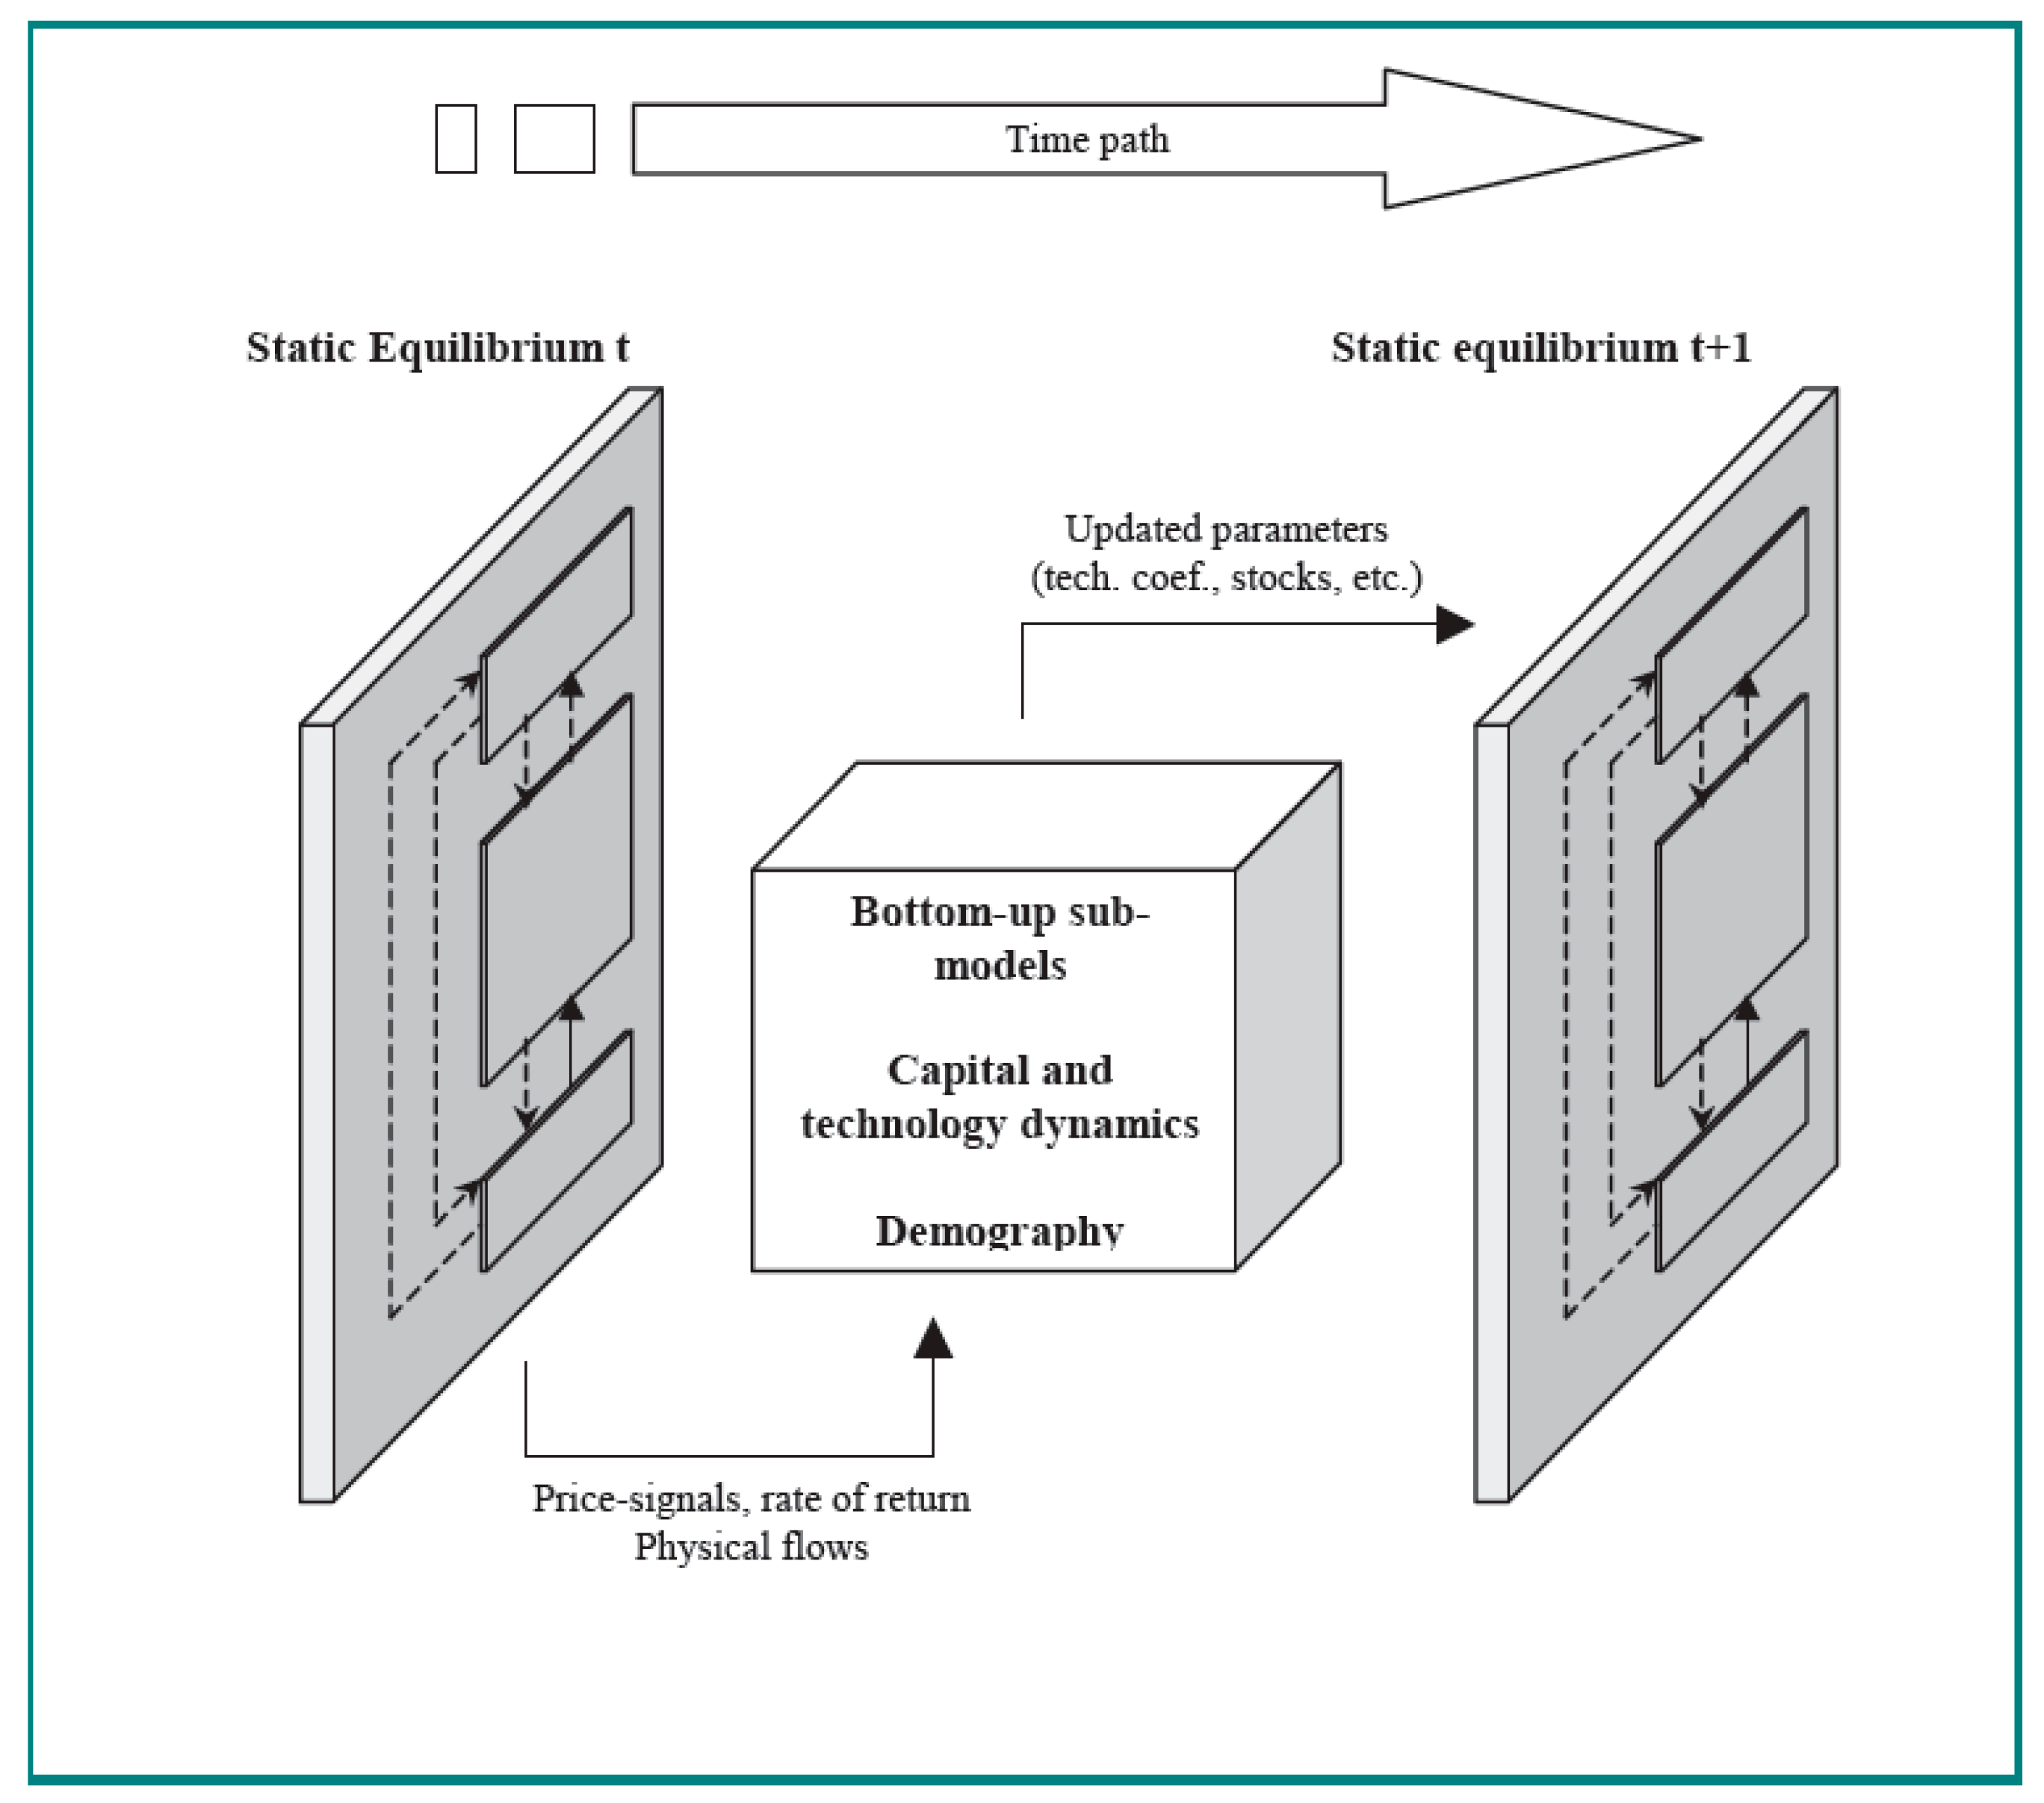
Figure 2.
Total passenger transport (pkm).
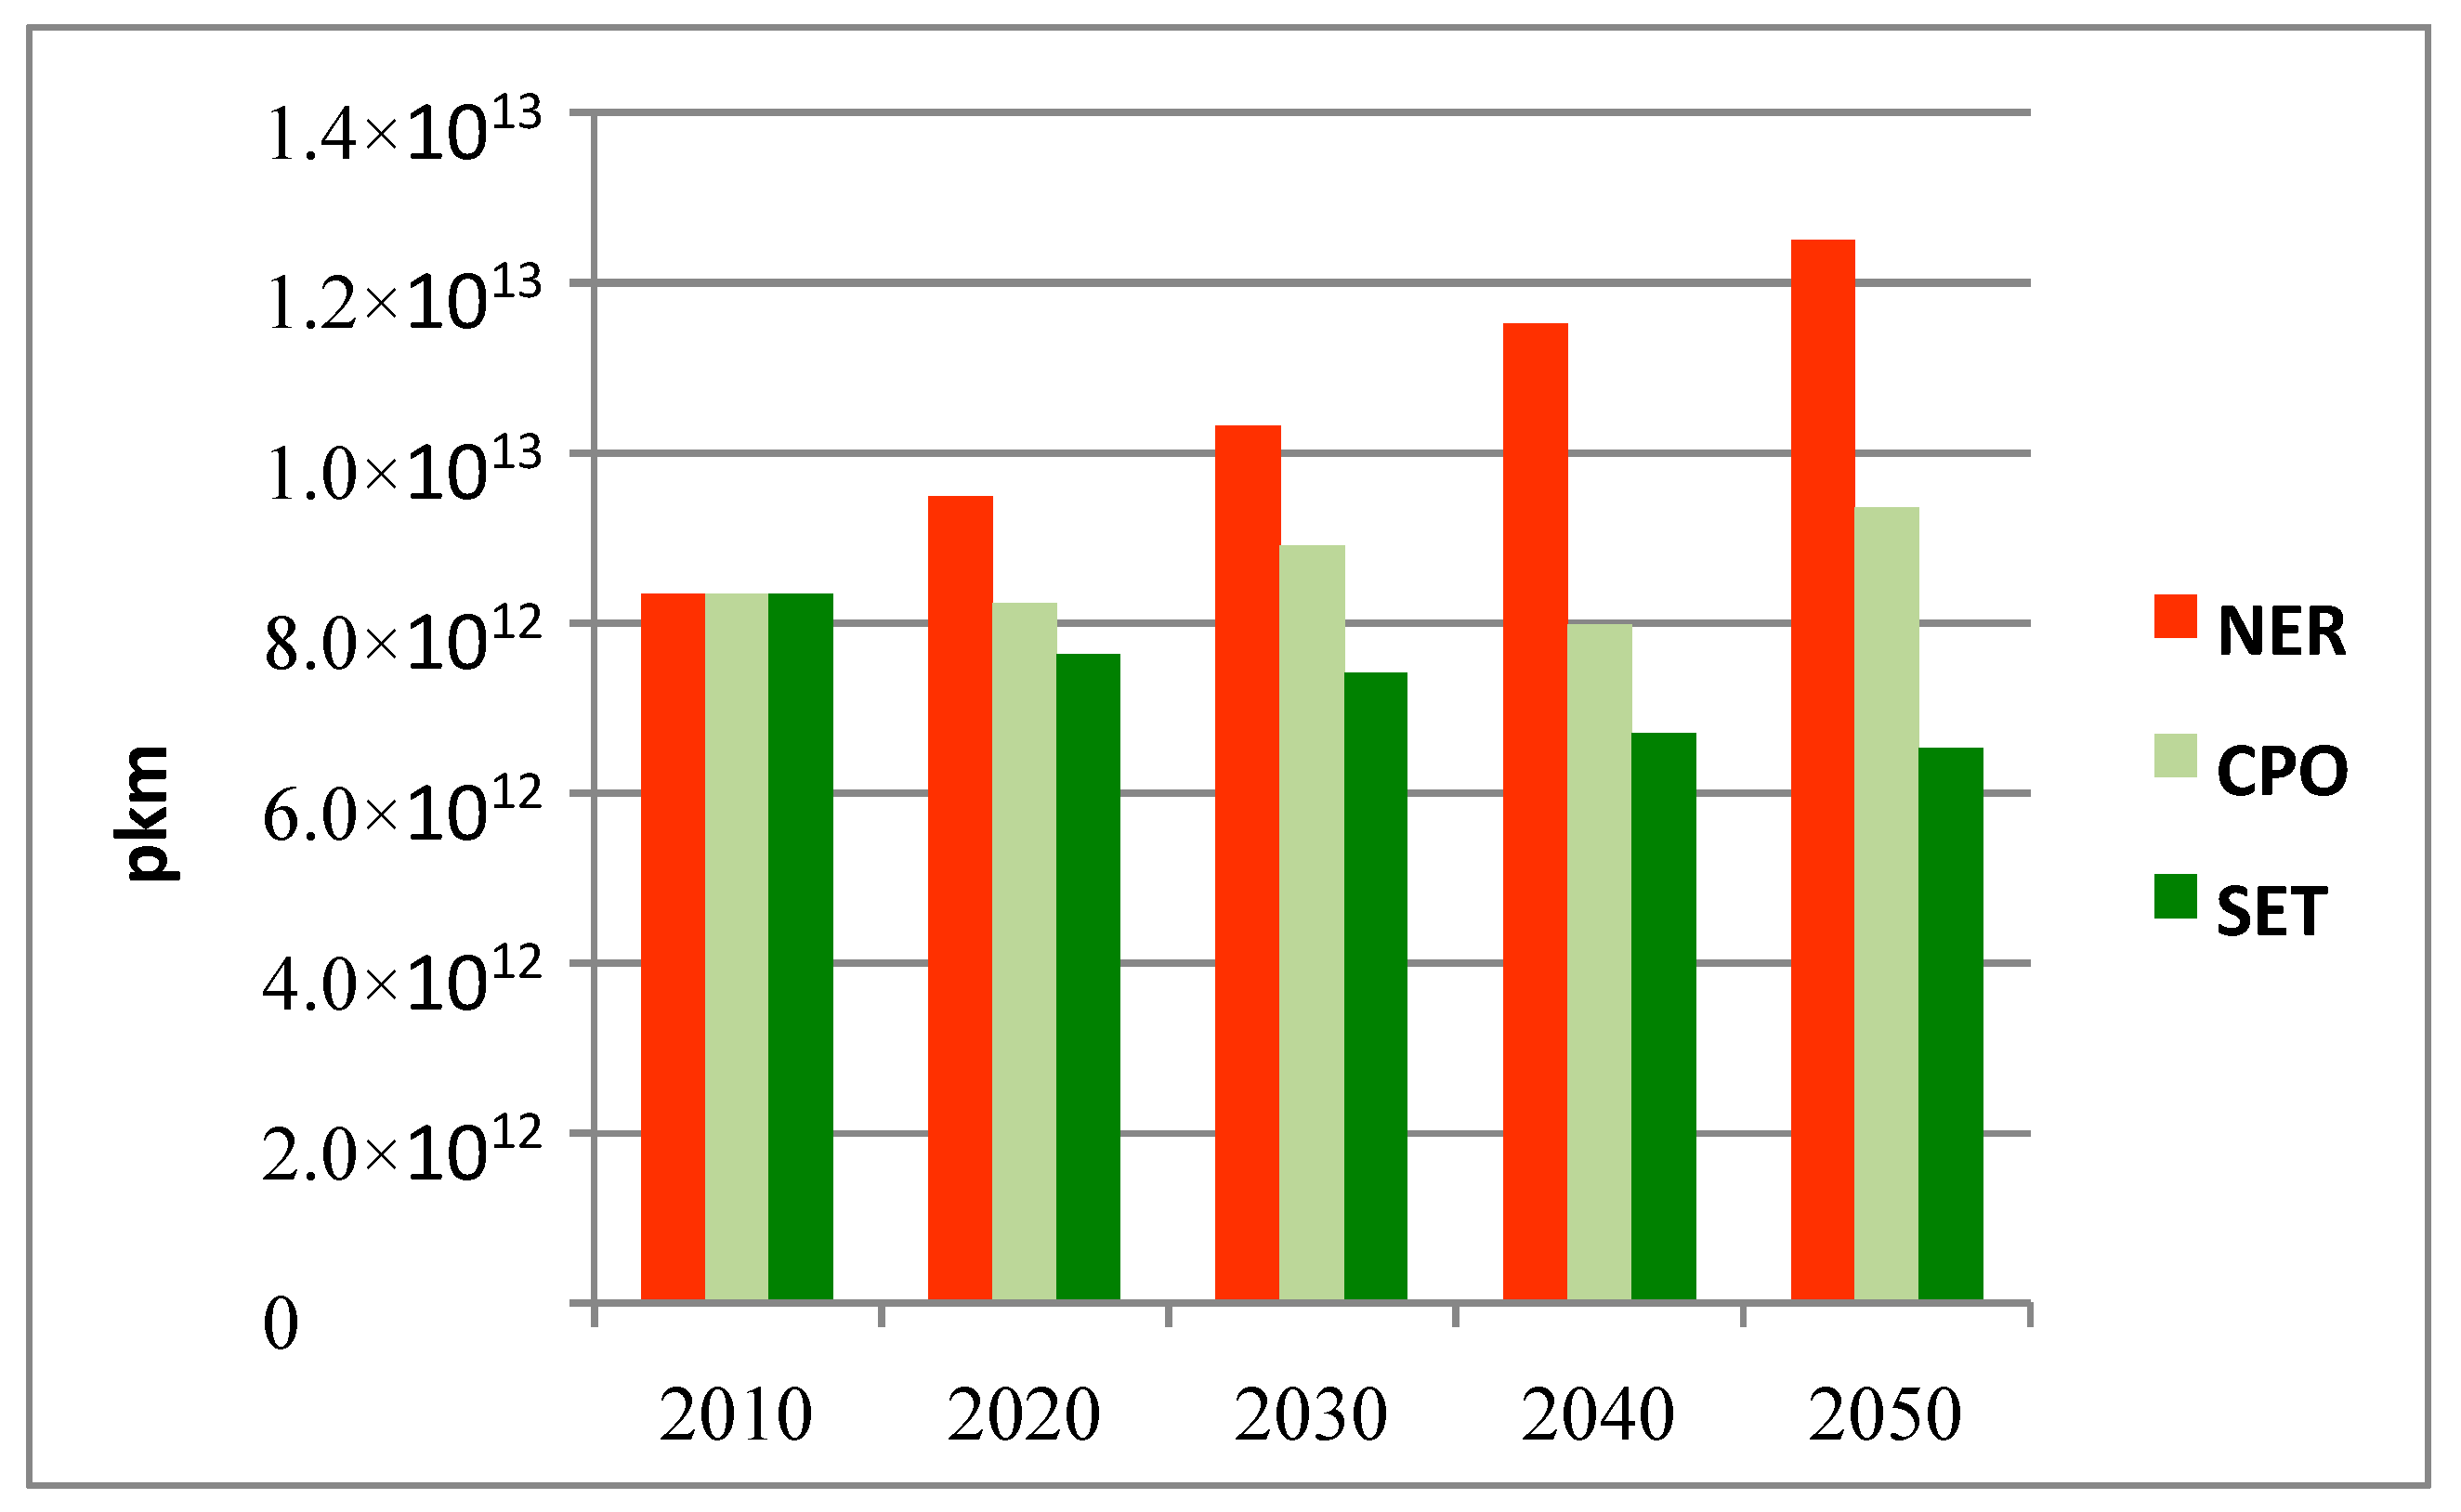
Figure 3.
Mobility satisfied by low-carbon modes including public transportation (pkm).

Figure 4.
Mobility satisfied by personal vehicles (pkm).

Table 1.
Electric vehicle parametrization in the SET, CPO and NER scenarios.
| SET Scenario | CPO & NER Scenarios | |
|---|---|---|
| Start of market penetration | 2010 | No significant penetration over the period 2010–2050 (a maximum of 20% in 2050) |
| Bottleneck phase | 3 years | |
| Maximum market share at the end of the phase | 2.5% | |
| Growth phase | 15 years | |
| Maximum market share at the end of the phase | 45% | |
| Maturation phase | 16 years | |
| Maximum market share at the end of the phase | 50% |
Table 2.
Parametrization of power generation decarbonisation.
| SET Scenario | CPO Scenario | ||
|---|---|---|---|
| Wind (Onshore and Offshore) | Maximum market share in 2050 | 30% | 15% |
| Learning rates for investments costs [41] | 10% | 3% | |
| PV | Maximum market share in 2050 | 15% | 10% |
| Learning rates for investments costs [41] | 8% | 3% |
Table 3.
EU 28 GDP variations with respect to the NER scenario.
| 2010 | 2020 | 2030 | 2050 | |
|---|---|---|---|---|
| CPO | −1% | −8% | −8% | −14% |
| SET | −1% | −5% | −3% | −7% |
Table 4.
EU CO2 prices ($ per/tCO2).
| 2010 | 2020 | 2030 | 2050 | |
|---|---|---|---|---|
| CPO | 0 | 140 | 249 | 984 |
| SET | 0 | 101 | 134 | 756 |
Table 5.
Share of energy costs in the production costs of the industrial sector.
| 2010 | 2020 | 2030 | 2050 | |
|---|---|---|---|---|
| NER | 6.7% | 5.7% | 4.3% | 2.2% |
| CPO | 8.6% | 8.7% | 6.3% | 4.1% |
| SET | 8.6% | 7.6% | 5.2% | 3.6% |
Table 6.
Share of energy in households’ budgets for Europe.
| 2010 | 2020 | 2030 | 2050 | |
|---|---|---|---|---|
| NER | 9% | 10% | 10% | 9% |
| CPO | 9% | 16% | 14% | 11% |
| SET | 9% | 12% | 10% | 7% |
Table 7.
Decarbonization of the transport sector.
| 2010 | 2020 | 2030 | 2050 | |
|---|---|---|---|---|
| NER | 0% | 0% | 0% | 0% |
| CPO | 2% | 7% | 14% | 39% |
| SET | 2% | 11% | 21% | 51% |
Effective share of Electric and Hybrid vehicles in total car fleet.
Table 8.
Decarbonization of the energy sector.
| 2010 | 2020 | 2030 | 2050 | |
|---|---|---|---|---|
| NER | 1% | 3% | 7% | 14% |
| CPO | 1% | 21% | 36% | 47% |
| SET | 1% | 22% | 43% | 58% |
Effective share of Wind + PV in the electric production.
Table 9.
GDP variations with respect to the NER scenario, with and without recycling of carbon tax and climate finance mechanisms.
Table 9.
GDP variations with respect to the NER scenario, with and without recycling of carbon tax and climate finance mechanisms.
| 2020 | 2030 | 2040 | 2050 | |
|---|---|---|---|---|
| SET | −5% | −3% | −8% | −7% |
| SET_TaxReform | −0.3% | −0.2% | −0.5% | 1.1% |
© 2018 by the authors. Licensee MDPI, Basel, Switzerland. This article is an open access article distributed under the terms and conditions of the Creative Commons Attribution (CC BY) license (http://creativecommons.org/licenses/by/4.0/).
Share and Cite
MDPI and ACS Style
Cassen, C.; Hamdi-Chérif, M.; Cotella, G.; Toniolo, J.; Lombardi, P.; Hourcade, J.-C. Low Carbon Scenarios for Europe: An Evaluation of Upscaling Low Carbon Experiments. Sustainability 2018, 10, 848. https://doi.org/10.3390/su10030848
AMA Style
Cassen C, Hamdi-Chérif M, Cotella G, Toniolo J, Lombardi P, Hourcade J-C. Low Carbon Scenarios for Europe: An Evaluation of Upscaling Low Carbon Experiments. Sustainability. 2018; 10(3):848. https://doi.org/10.3390/su10030848
Chicago/Turabian StyleCassen, Christophe, Meriem Hamdi-Chérif, Giancarlo Cotella, Jacopo Toniolo, Patrizia Lombardi, and Jean-Charles Hourcade. 2018. "Low Carbon Scenarios for Europe: An Evaluation of Upscaling Low Carbon Experiments" Sustainability 10, no. 3: 848. https://doi.org/10.3390/su10030848
Note that from the first issue of 2016, this journal uses article numbers instead of page numbers. See further details here.