1. Introduction
What would a world look like in which there was no more waste? How could everyday products be designed to be reused several times? What if, in future, manufacturers had to return the entirety of each product to the value-added cycle after the end of its life cycle?
In particular, the small and medium enterprise (SME) sector is globally perceived to be underperforming in terms of environmental friendliness [
1]. Environmental targets are often considered to conflict with economic objectives and improvement proposals suggested for material efficiency become secondary concerns [
2] (p. 1282).
An evaluation of barriers to improve material efficiency in industrial companies, concerning circular economy considerations has been provided by Ritzén et al. [
3]. The origins of the circular economy approach emanate from several schools of thought and theories that challenge the established economic system, based on overconsumption due to the finiteness of natural resources [
4]. One of the first authors considered to have influenced the development of the circular economy concept is Boulding (1966) [
5]. He envisaged a “spaceman economy” that would operate by reproducing the initial limited stock of inputs and recycling waste outputs. According to Braungart et al., 2007, the cradle-to-cradle design demonstrates the need to maintain and even enhance the value, quality, and productivity of resources in order to have a net positive environmental impact [
6].
According to Pagell and Wu (2009) [
7], reverse logistics and closed-loop supply chains have not been sufficiently addressed by the green supply chain management literature. Gunasekaran and Spalanzani (2012) [
8] stress the importance of reverse logistics, remanufacturing, and recycling in green supply chain management. Mitra (2014) [
9] (p. 41) states that there are many issues to be considered in reverse logistics, for example the degree of centralisation of collection, inspection, and recovery facilities; integrating material recovery into production operations; or outsourcing of recovery activities.
There is a lack of solutions of sufficiently low complexity to encourage manufacturing enterprises to implement material efficiency measures within their own borders and along their supply chains towards a circular economy. Most approaches require complete datasets, putting too much strain on firms’ limited resources. Further, disruption concerning product design and production technologies requires the redesign of existing supply chain setups. Circular economy aspects require the development of operating networks which are financially attractive for the business partners over the long term.
Therefore, the following two hypotheses are posed: (1) Even with uncertain or estimated consumption data, a sound basis for material efficiency improvements within manufacturing company borders and along the supply chain can be created; (2) Circular economy activities will play a significant role in material efficiency improvements.
In this paper, the material efficiency potential within the company borders of a sample manufacturing enterprise along its supply chains and through waste recovery by circular economy activities is assessed. Simulations were conducted in order to analyse the robustness of the determined material efficiency gains under assumption-based datasets for the material consumptions within the supply chains.
The remaining part of this paper is structured as follows: materials and methods are described briefly and a short theoretical background is provided concerning material and energy efficiency in general, and along supply chains and the circular economy specifically. The results comprise the main part of the paper. The results include a development of the calculation routine for material efficiency improvements of supply chain elements. This is followed by an investigation of possible optimisation potentials in the supply chain of the sample manufacturing enterprise and subsequent inclusion by the sample firm. Then the impact of circular economy activities is assessed. Following this, the results are discussed, and a conclusion and outlook finalises the paper.
2. Materials and Methods
The deterministic calculations for the example manufacturing enterprise and its supply chains have been performed based on MS-Excel
® spreadsheets. The setup of the individual supply chains has been documented in sufficient detail based on the experience of the authors, accessible branch information and to some extent on assumptions. As these assumptions and the accessible information contain uncertainties, simulations have been performed varying the uncertain parameters. For example, the material efficiencies and possible improvements for waste reduction of single process steps were simulated in order to investigate the impact on the overall material efficiency of the supply chains. The statistical computing environment R [
10] has been used to conduct the simulations.
3. Theoretical Background
3.1. Material and Energy Efficiency
Material and energy efficiency η is defined as the output of usable material in the form of pre-, semi-, intermediate, final, and auxiliary products or used energy in relation to its input material or energy amounts (see Equation (1)) or flows (if divided by time):
in which η
n is defined as the material efficiency, m
out n as the material output, and m
in n as the material input of the supply chain element n.
In order to quantify the overall efficiency of supply chains, the expenditures on all stages of the process chain must be included, from extraction of primary resources, the processing of products and their delivery to the consumer [
11] (p. 9), to the recycling of wastes and used products back into the economic cycle. Analysing a series of processes sequentially, the total efficiency η
total can be derived according to Equation (1) by multiplication of the efficiency of each single process step or supply chain element.
As the energy source in most industrial applications relies upon non-renewable sources (fossil and nuclear fuels), material and energy efficiency are interrelated according to the energy content of the materials used.
Several authors have investigated waste generation and material efficiencies in worldwide manufacturing over several branches, finding that there is significant room for improvement within company borders and along supply chains [
12,
13,
14,
15,
16,
17].
Following the logic of Equation (2), energy and material efficiency improvements need to cover whole supply chains. In addition, Loiseau et al., 2016 [
18] state that circular economy or product service systems may produce stronger improvements than efficiency improvement measures of traditional linear manufacturing systems. However, these innovative and often disruptive concepts call for societal transformations [
18] (p. 368).
3.2. Circular Economy Specifics
The circular economic approach rethinks established linear economic systems, which assume that resources are infinite [
19,
20,
21,
22]. The transition towards a circular economy aims to repeatedly reintroduce materials and energy from discarded products into the economic cycle at the same value-added level [
23]. Nevertheless, there are barriers to achieving this aim along the whole supply chain. Rizos et al. [
19] conducted a detailed literature review to identify potential barriers. Luken et al., Mittal and Bey et al. supplement this survey of barriers [
24,
25,
26]. Some drivers, which are analysed in Dervojeda et al. [
27], enable the change towards a circular economy. A decisive success factor is also the corporate culture and consumer purchasing preferences [
28,
29,
30]. Rizos et al. [
19] encompassed a further overview of actual circular economy specifics.
4. Results
In order to evaluate the potential for material efficiency measures in supply chains and through circular economy activities, a manufacturing enterprise was chosen for evaluation which had already been assessed by one of the authors concerning material efficiency improvements. The company supplies surface-coated decorative automotive parts, consisting mainly of aluminium and wooden inlays. This enterprise is regarded as a focal company because it has a significant impact on total material efficiency, is able to disrupt supply chains by influencing technology choice or design alternatives, and thus is able to impact circular economy aspects. This focal enterprise depends on a range of supply chains that have been documented in sufficient detail. Five main supply chains of pre-products, auxiliary as well as operating materials, have been modelled for the assessment. The investigations do not cover electrical and thermal energy fuel supplies. Cost data are not available in sufficient detail for the supply chains, so the investigations do not include cost matters.
For each element of the supply chains for the different products and materials the current material efficiency status has been assessed. In a second step, possible improvements for each supply chain element were estimated. Based on this information, the total material efficiency improvement of each single supply chain and all assessed supply chains in total were calculated.
In the following subchapters, first the overall impact of material efficiency improvements of the supply chain for the example manufacturing enterprise is evaluated. Then the overall impact, including the example enterprise, and finally the potential impact of circular economy activities are calculated.
4.1. Calculation of Efficiency Improvements in the Supply Chains
The material demand of a supply chain element n of the supply chain m after material efficiency improvement by the factor x
w can be calculated according to Equation (3) as follows:
in which b represents the status before optimisation, a the status after optimisation, x
w the improvement in waste reduction, and η
m,nb the material efficiency of the above mentioned supply chain element before its optimisation.
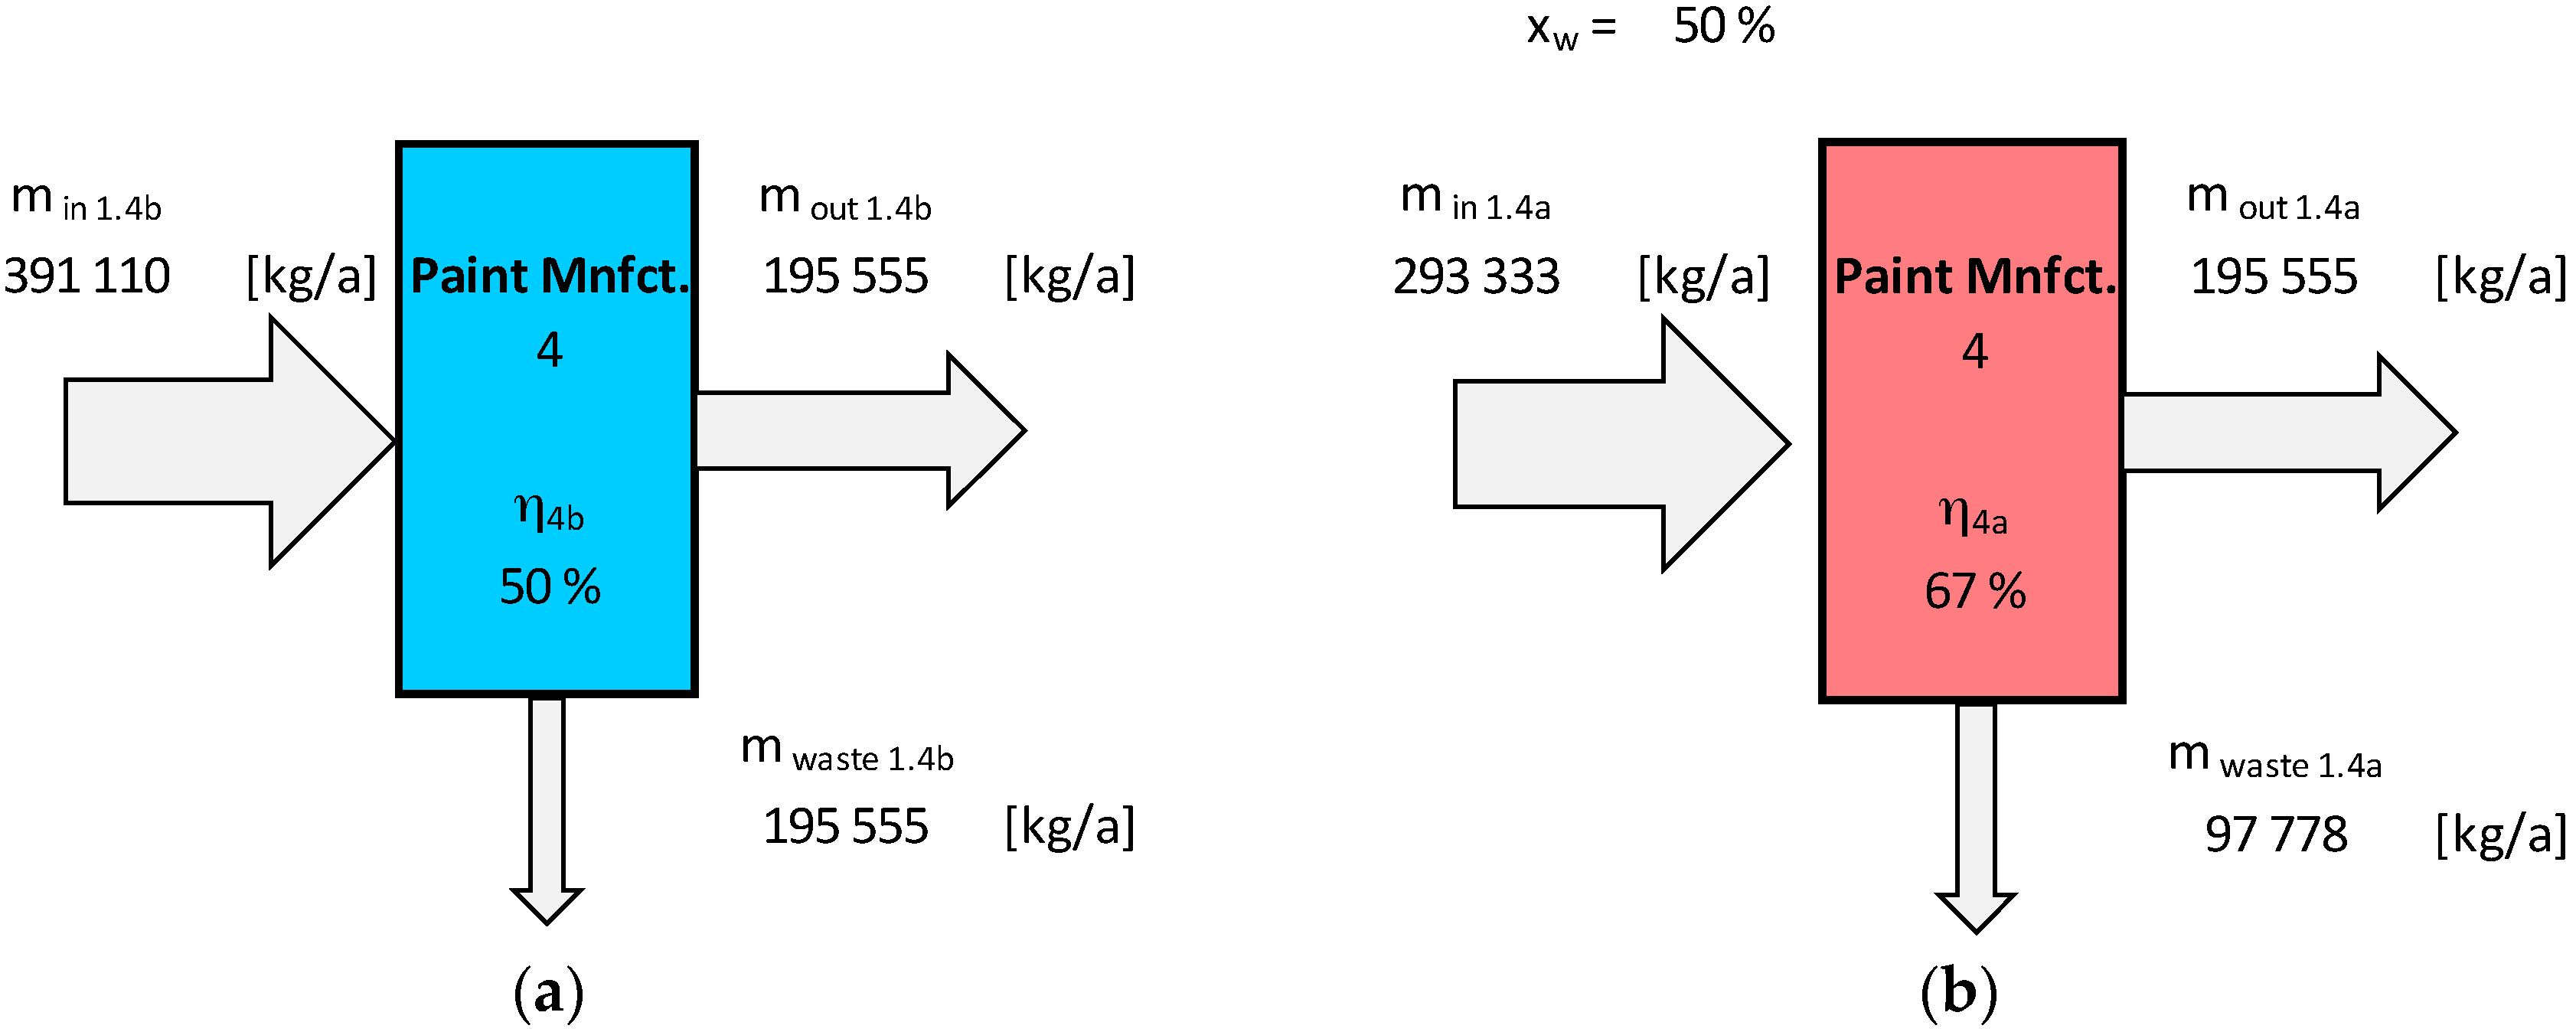
Figure 1 shows an example calculation for the supply chain element number 4 in paint manufacturing, which is the last supply chain element of supply chain number 1, where m
waste represents the mass of waste per year of the supply chain element.
Equation (3) has been divided on both sides by time in order to receive material consumptions per unit of time. Before its optimisation, a material efficiency η
4b of 50% has been estimated, resulting in material demand m
in 1.4b of 391,110 kg/a before its optimisation (see
Figure 1a). After optimisation of this supply chain element by the waste reduction factor x
w of 50%, the input material demand m
in 1.4a decreased to 293,333 kg/a. In
Figure 1 m
out 1.4a and m
out 1.4b are equivalent because the example supply chain element is the last in the supply chain before the material is supplied to the aforementioned example manufacturing enterprise. For the upstream elements, the material demands calculated according to Equation (3) have been used for the required material output of the forerunners. Therefore the forerunner element number 3 of the supply chain 1 in
Figure 1 after optimisation requires only 293,333 kg/a, instead of 391,110 kg/a before optimisation.
The material inputs and waste outputs of all investigated supply chains and the elements were calculated accordingly. The total material efficiency of each supply chain was determined before and after optimization, as well as the overall efficiency of all parallel operational supply chains. Some supply chain elements showed little room for improvement, while others, like the example in
Figure 1 showed significant optimisation potential. The material and waste flows of the supply chains and the focal company have been compiled on spreadsheets. The most important data are condensed in the following tables.
The values of total material efficiency of all supply chains were calculated according to Equation (2). The material demand, waste amount, and material efficiency of each supply chain and the summarised result of all supply chains are listed in
Table 1. Improvements of the focal enterprise are excluded at this point and are presented in
Section 4.2 in order to represent clearly the improvement possibilities of the supply chains alone. The supply chain’s overall material efficiency resulted in 59% before optimisation and 68% after optimisation. Therefore the material demand of the supply chains for the focal company has been reduced after optimisation by 13% and overall waste has been reduced by 31%. According to these calculations there is room for improvement for the total material efficiency in the investigated case. However, the improvement possibilities concerning the material demands are limited.
The calculations were performed only on a material mass basis, not on a cost basis as mentioned above. Water is the consumable with the highest mass but has little monetary value compared to the other materials. The water supply chain is already very efficient and has little room for improvements. Therefore, its optimisation potential is low compared to other assessed supply chains. This explains the limited room for improvement, seen from the perspective of material mass.
Here, a detailed analysis of the implications for costs requires more research. In general, the cost structure of firms also depends on the prices of the relevant inputs. These inputs are the products of the suppliers. Thus, the latter will face less demand for their outputs as buyers become more efficient in their use of material. Consequently, prices will change due to this shift of demand. How much this will change the costs of production and the sales of the suppliers depends on the variations of supply and demand. A complete presentation requires an input–output model that includes both price and quantity effects.
As mentioned previously, the efficiencies of each supply chain element and their possible waste reduction improvement x
w have been estimated based on the authors’ experiences, accessible branch information, and to some extent assumptions. The total quantity of waste m
waste of all supply chains is subject to uncertainties concerning the supply chain elements’ efficiencies η
n and the estimated waste reduction improvements x
w n. Therefore a simulation was run in which the parameters η
n and x
w n were random variables, using estimated values for η
n and x
w n as the basis. These values vary in a range of ±10%. In order to provide meaningful values for η
n, the maximal value was limited to 95%. Consequently, the range for material efficiencies η
n with a base value of 95% was shifted to the left, and therefore the means of the simulation results are not equal to the results of the deterministic calculation. The random values were distributed in the ±10% interval by drawing random values from a beta-distribution with α = β = 2. In order to achieve a reliable result, 10,000,000 simulations have been conducted. The simulation was implemented using the statistical computing environment R [
10].
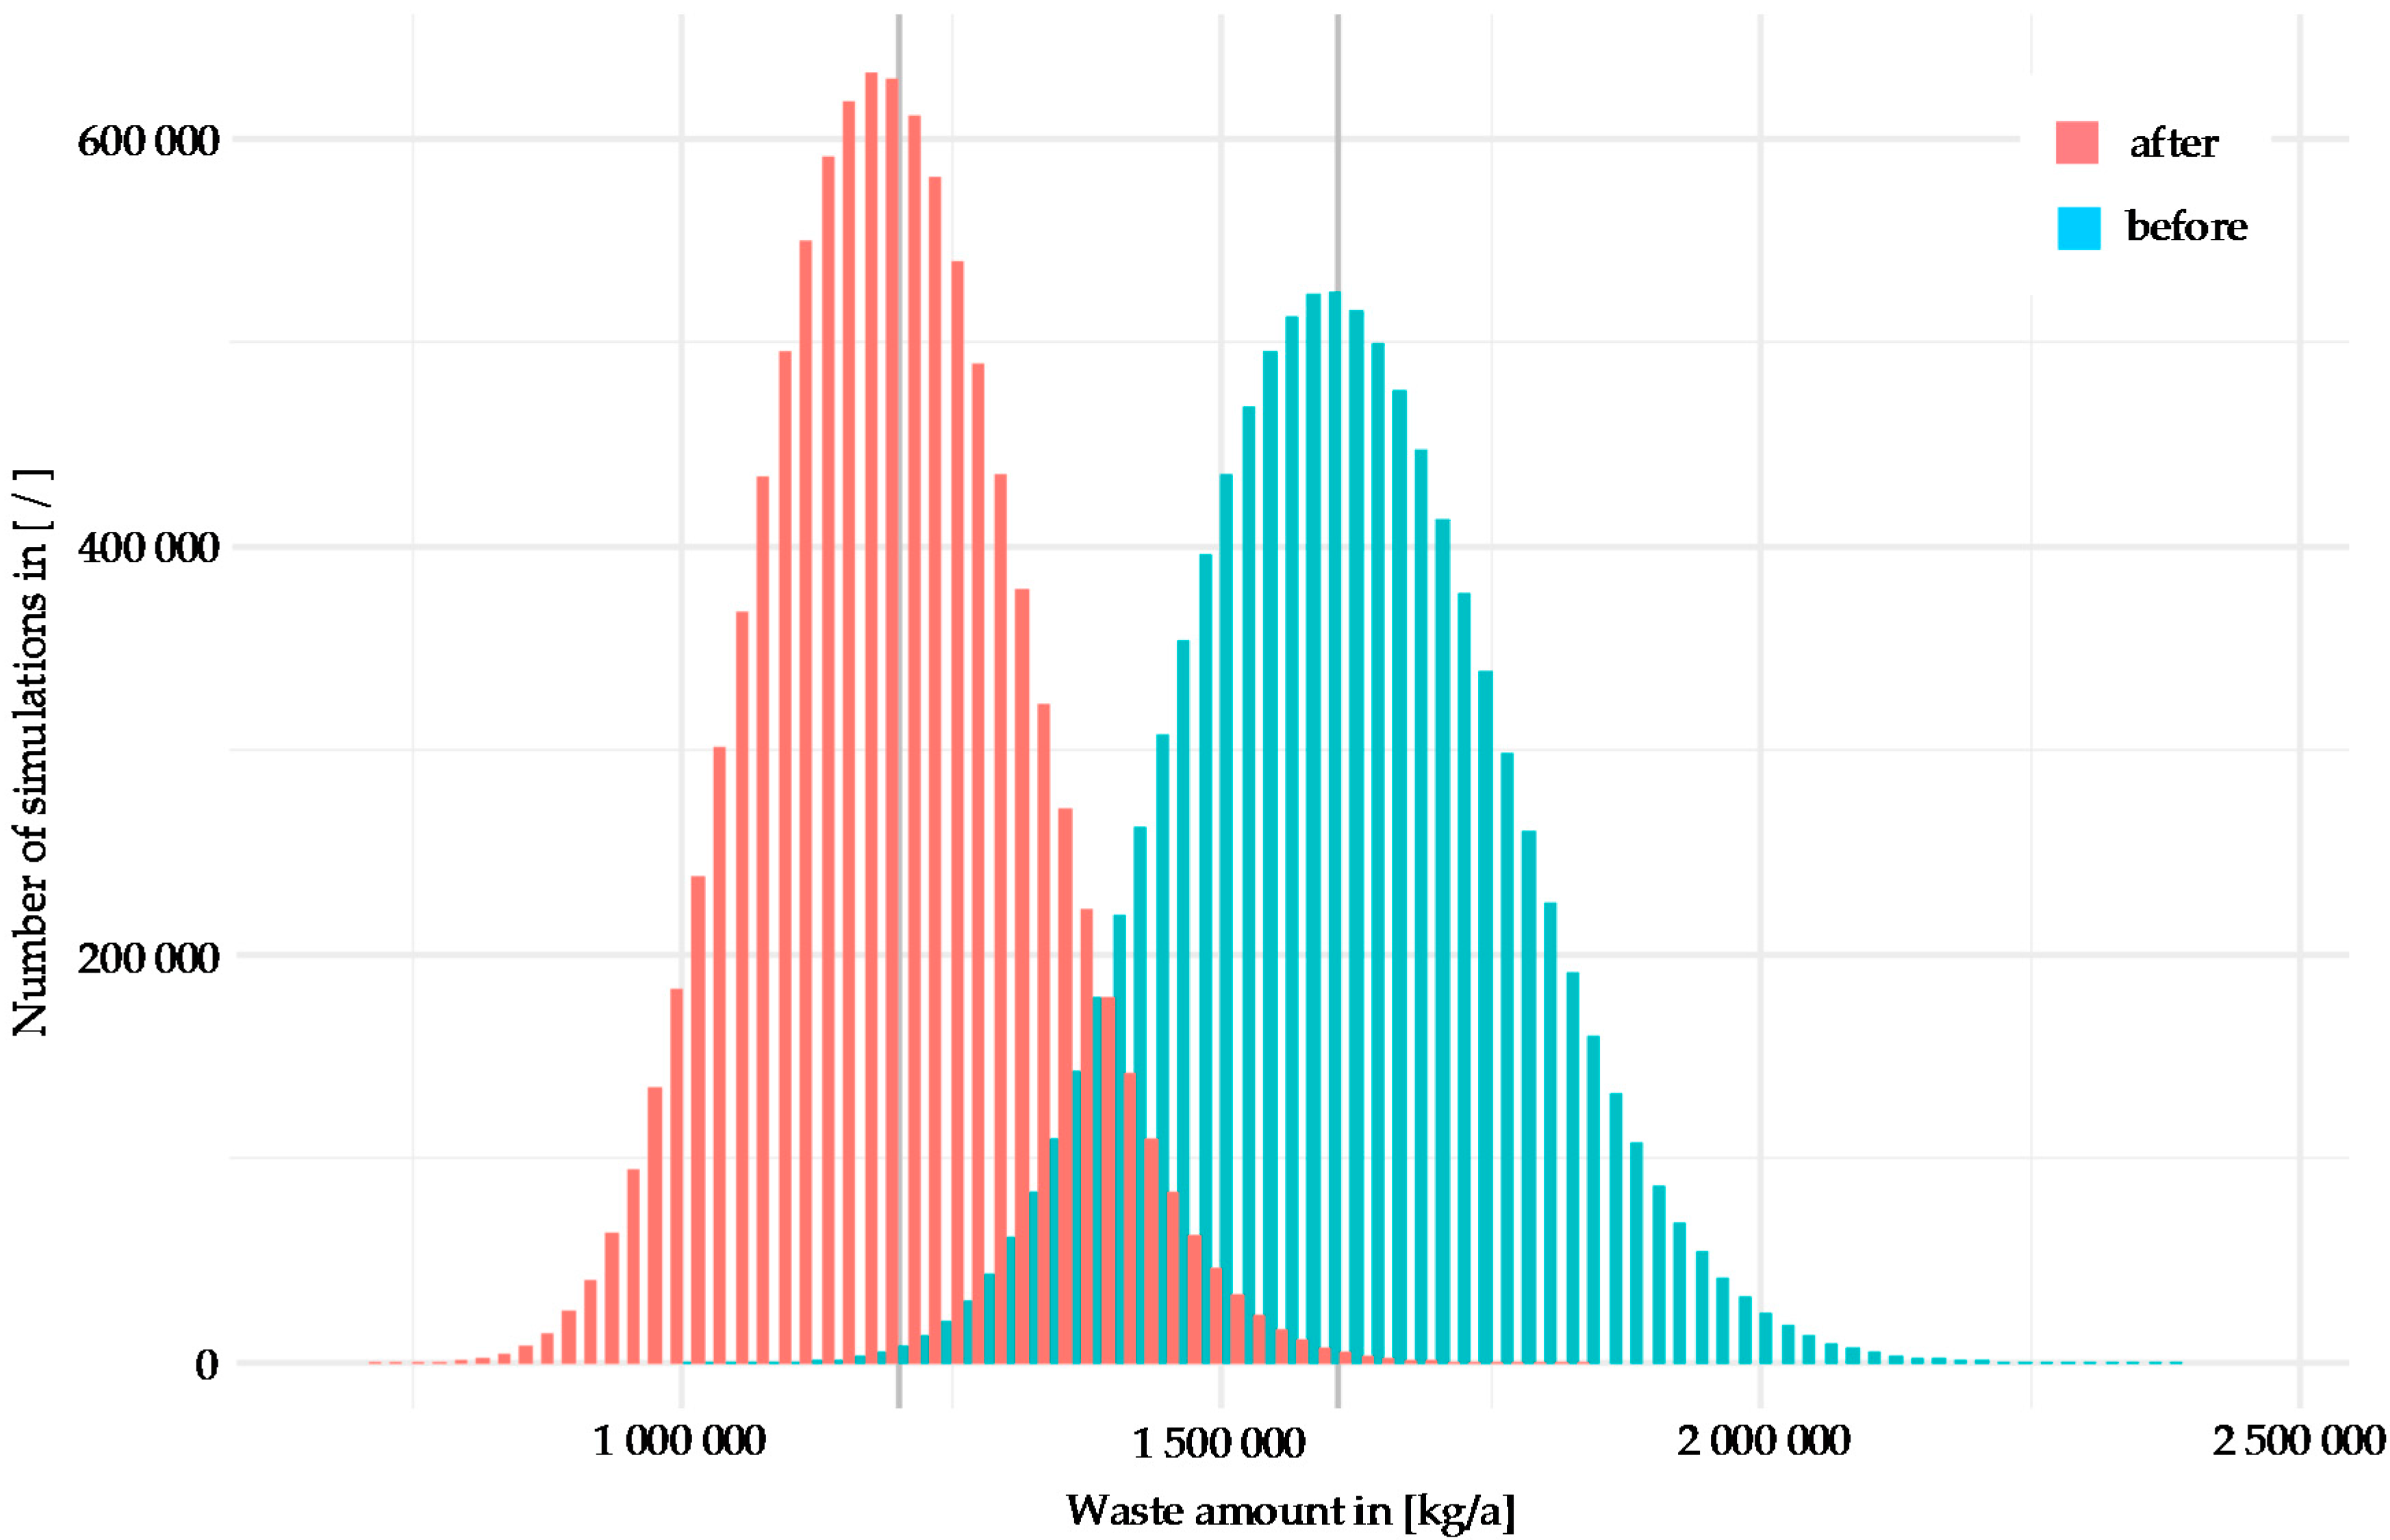
Figure 2 shows a histogram of the simulated values of waste quantity for the supply chains alone (no optimisation of the focal enterprise), with a grey line indicating the mean. It should be noted that the distribution is not symmetric—the mean is not equal to the mode of the distribution. According to the investigations, some supply chain elements are most likely operated in a material efficiency range between 90 and 95% (e.g., raw oil supply, aluminium oxide production and electrolysis). The limitation of 95% for the maximum material efficiency for each supply chain element results in mean waste amount values for all supply chains that are significantly higher than the deterministic results shown in
Table 1 above, which are based on the initial information. A supply chain element operated according to the investigations at 95% will fluctuate in the simulation between 85 and 95%, and cannot exceed 95% material efficiency.
Therefore, in this simulation there will be no improvement. It indicates the projected waste quantity where the material efficiencies of such supply chain elements are 10% lower than estimated. More than 60% of all extracted raw materials are refined in supply chain elements functioning with a material efficiency range between 90% and 95%, as shown by the histograms in
Figure 2. Therefore, the simulation is indicative of the worst-case scenario. The mean values of the simulations show that the total waste quantity of all supply chain elements will be reduced by approximately 25%, instead of 31% as determined with the initial information (shown in
Table 1). Note that the overlapping area does not imply that no material efficiency improvement can be realised in the worst case; the result should be interpreted as a shift of the distribution to the left so that, for any given values of η
n, a reduced waste quantity will result.
4.2. Impact of Efficiency Improvements in the Supply Chain Including the Example Focal Enterprise
In
Section 4.1 the improvements of the supply chains for the focal enterprise have been determined to isolate how much material quantity reduction can be obtained by optimising these supply chains alone. In the next step, the focal enterprise has been included in the calculations. Former investigations by one of the authors have shown that the enterprise has two optimisation options. One option is based on the existing production technology and therefore does not require any alteration to the supply chain setup. The second option proposed optimisation to a much greater extent, requiring a significant production technology change that would disrupt the supply chain setup significantly. This latter scenario is not investigated in this paper, as the goal here is to assess the improvement potential of the existing supply chain network of the focal company.
Within the parameters of the first option, the focal company is able to reduce its paint and auxiliary material consumption by a factor x
m of at least 35%. The water consumption will decrease by a factor of 20%. The wood veneer and the aluminium consumption remain unchanged, and likewise the product mass output.
Table 2 shows the results under these side conditions. The auxiliary material and the water are transformed entirely into waste. Therefore the material efficiency for these two material groups before and after optimisation is valued as zero. Nevertheless auxiliary material use is reduced after optimisation of the focal enterprise and the corresponding supply chain by more than 19,000 kg/a, or almost 44%. Water demand is reduced by approximately 177,000 kg/a, or 21%.
The wood veneer material consumption improvement of 4% is generated solely by the supply chain partners. Regarding aluminium material, only small improvements are feasible. The extremely small material efficiency concerning the paint consumption in
Table 2 compared to
Table 1 indicates that the required paint is the primary material consumption weak point of the focal company. At the same time, paint consumption is a significant cost factor for this manufacturing enterprise. The paint supplier however, has little interest in supporting the focal company, because a significant improvement would ruin the current sales volumes. Including optimisation measures within the focal enterprise would result in a total waste avoidance of 752,729 kg/a, representing a reduction of 34%.
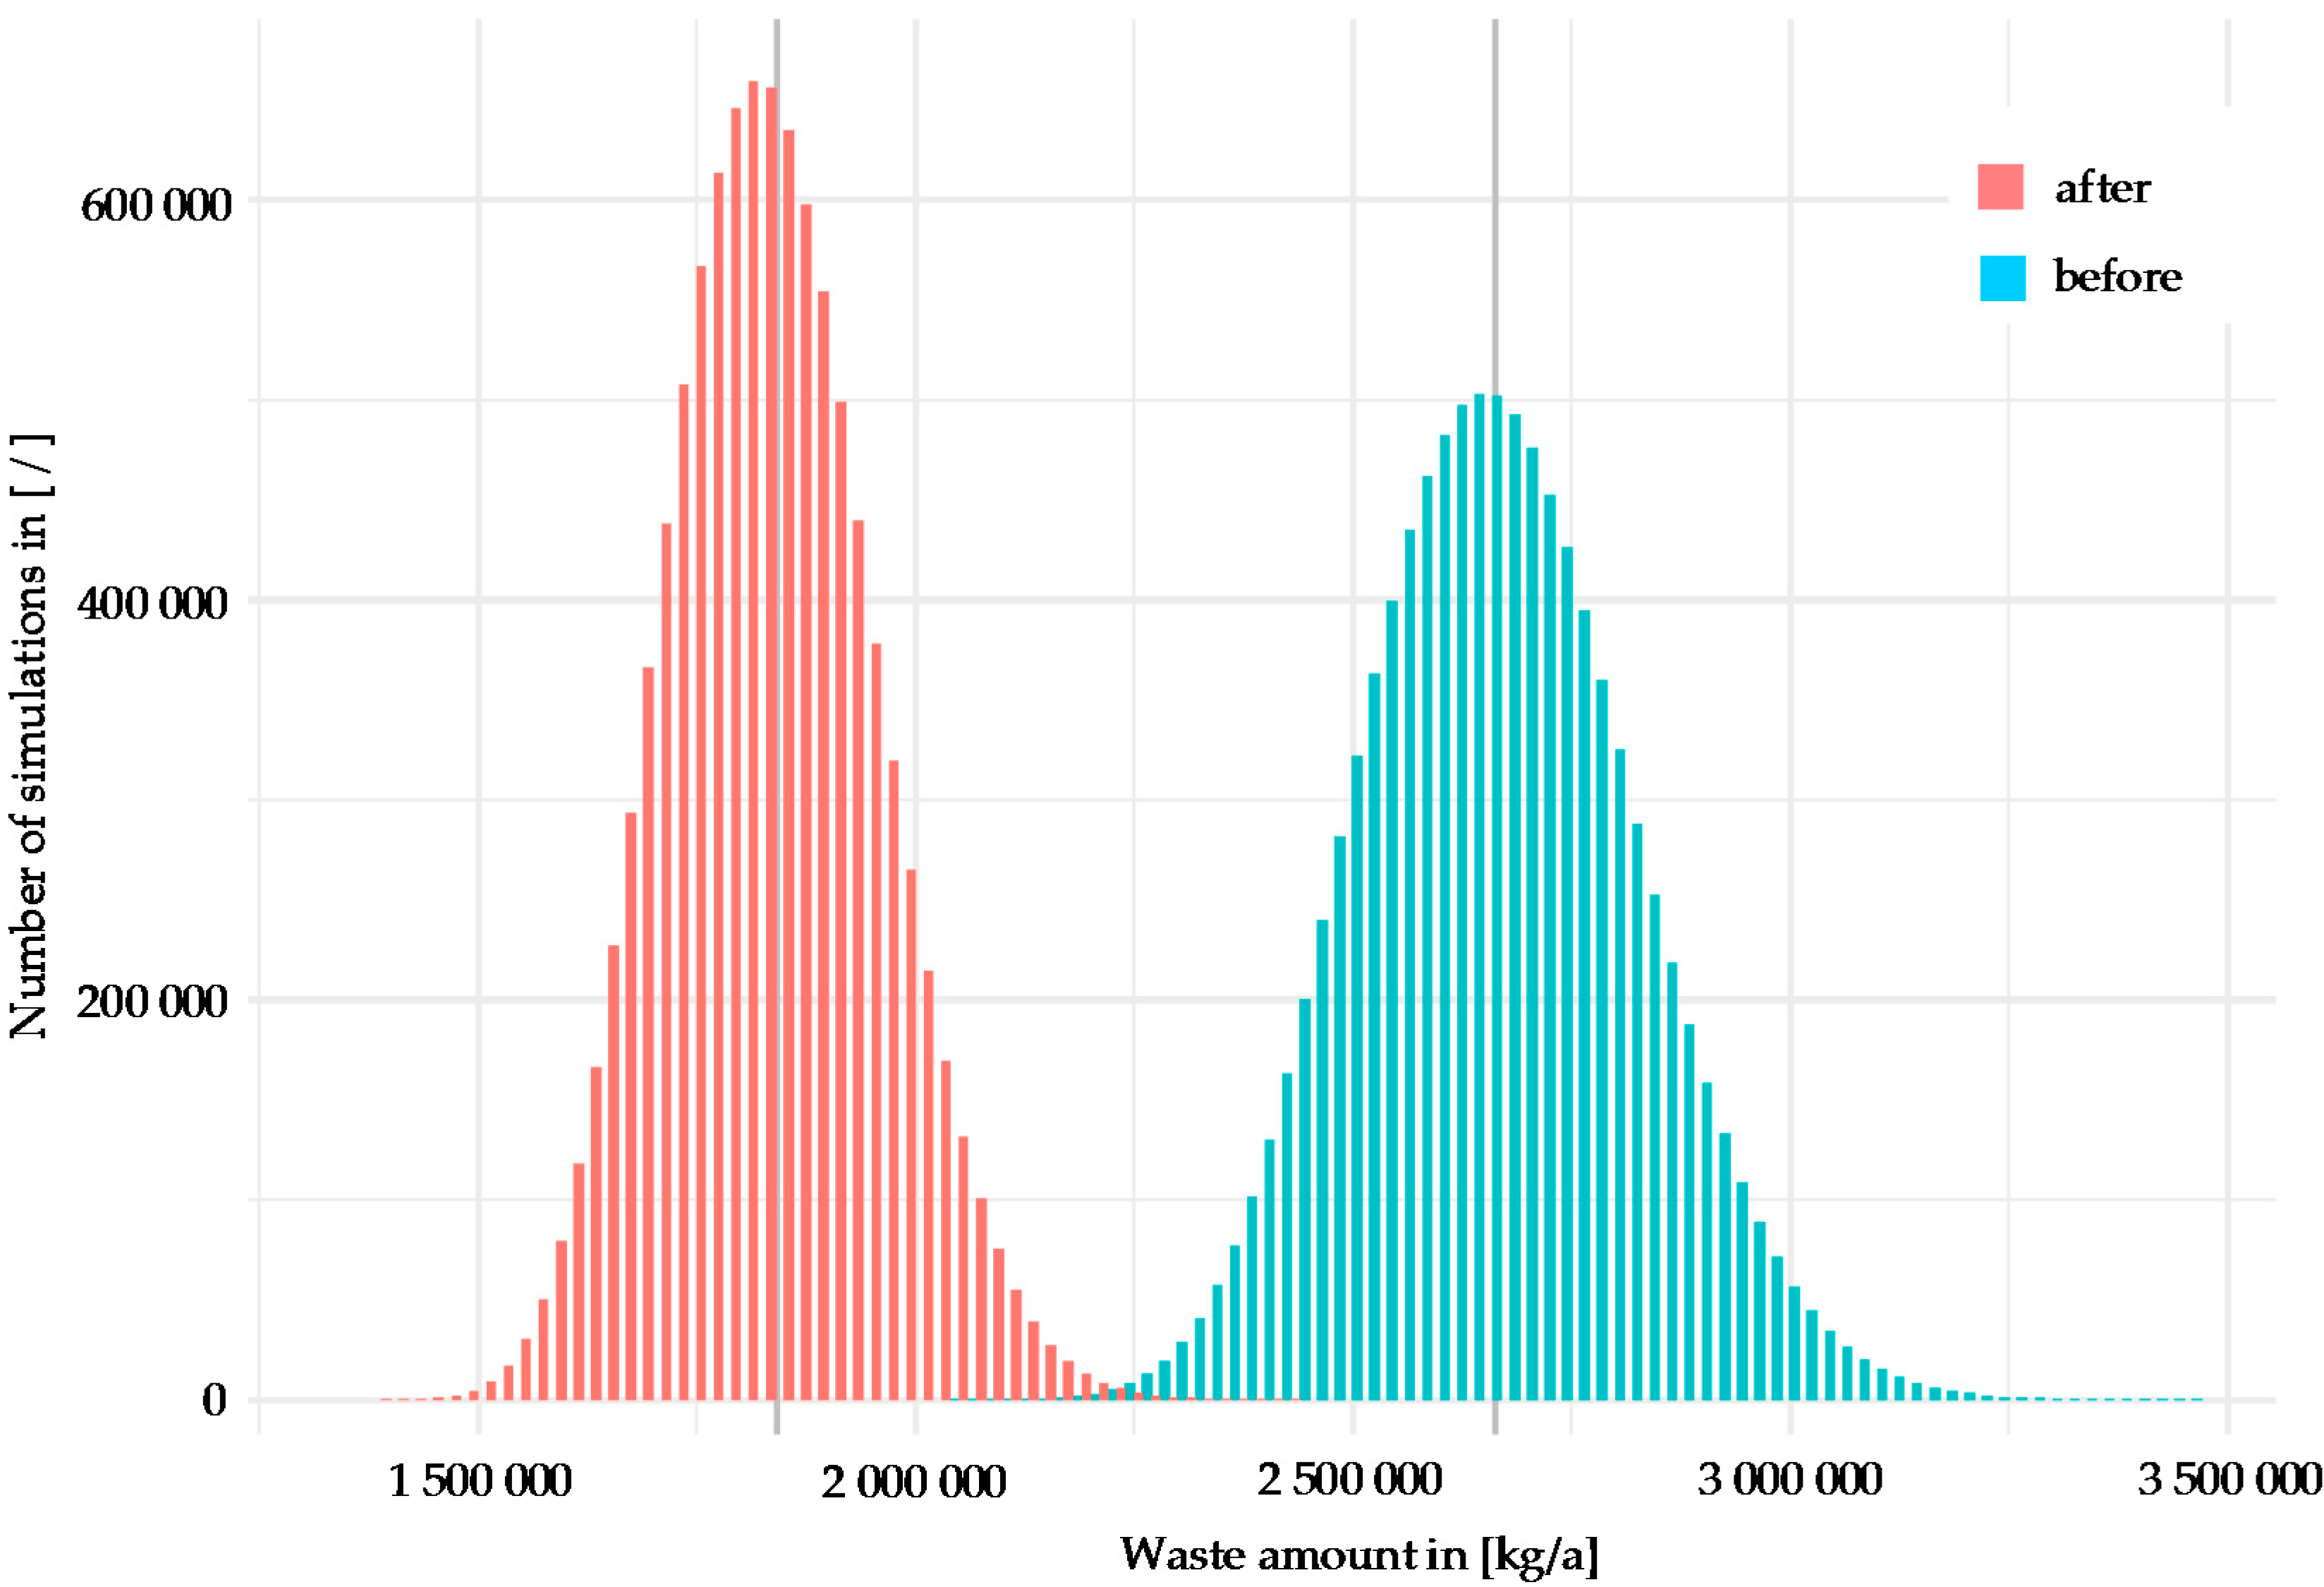
The simulation described in
Section 4.1 has also been performed, including improvements both in the supply chains and the focal manufacturing company. The results for the waste amounts for the supply chains and the focal enterprise before and after optimisation are displayed in
Figure 3. As in the previous section, the mean values are indicated by a grey line.
The mean value for the waste quantity before optimisation is approximately 20% above the value for the deterministic calculation results shown in
Table 2. After optimisation this increases to approximately 25%. These differences arise from the aforementioned setup of the simulation, in which efficiencies are limited to 95%. The associated random variable of a deterministic variable with a value of 95% will range from 77.72% to 95% in the simulation, with a mean of 86.36%. This explains the observed loss of overall efficiency, while improvement factors contributed further to this effect. Taking the mean value before and after optimisation, the simulation shows a 44.57% waste reduction. The deterministic calculation based on the original assumptions resulted in a 34% waste reduction as stated above.
4.3. Possible Impact of Circular Economy Activities for the Example Enterprise
Until this point, only improvements within the supply chain for the focal manufacturing enterprise and the firm itself have been assessed. Circular economy aspects have not yet been considered.
Circular economy networks need to be developed for the future. An effective extension of existing supply chains towards a circular economy requires a systematic change of technological and non-technological innovations. Together with the application of circular economy concepts, they can radically reshape life cycle value creation and drive fundamental changes across entire value chains, without restriction to specific sectors or materials [
31,
32,
33]. Therefore, investigations based on existing networks for the supply of material and products as described in
Section 4.1 cannot be performed at this point of time for circular economy networks. However, it is possible to estimate the share of circular economy activities, assuming a certain future return factor from such actions. Based on the assumption that 50% of all wastes created in the supply chain and the focal company are reintroduced into the supply chain at the same value-added level, 1,110,433 kg/a of material can be returned through circular economy activities. This represents 39% of the material input for the scenario where no optimisation efforts are established within the supply chains and the focal company (starting point of the investigations).
As described in
Section 4.1, after optimisation of the supply chains and the focal company, 42,734,068 kg/a of material can be returned. This represents 35% of the requested material input for the optimised case.
These calculations do not include product return. The example enterprise delivered 646,641 kg/a of product output. If the same 50% return rate as mentioned above can be realised, circular economy activities unburden the material supply side by 1,433,535 kg/a (50%) prior to optimisation of the supply chain and the focal company. After optimisation of both elements, material supply is released by 1,057,390 kg/a (50%).
It should be noted that these assumptions do not include material or energy consumption through circular economy activities.
4.4. Comparison Supply Chain, Focal Enterprise and Circular Economy Material Efficiency Activities
Based on the results in
Table 1 and
Table 2, results have been calculated for 50% waste recovery through circular economy activities at any stage of the product life cycle before and after optimisations in the supply chain and the focal company. No simulations were run concerning the alteration of circular economy activities because the intention was to see the indicative effect of such activities.
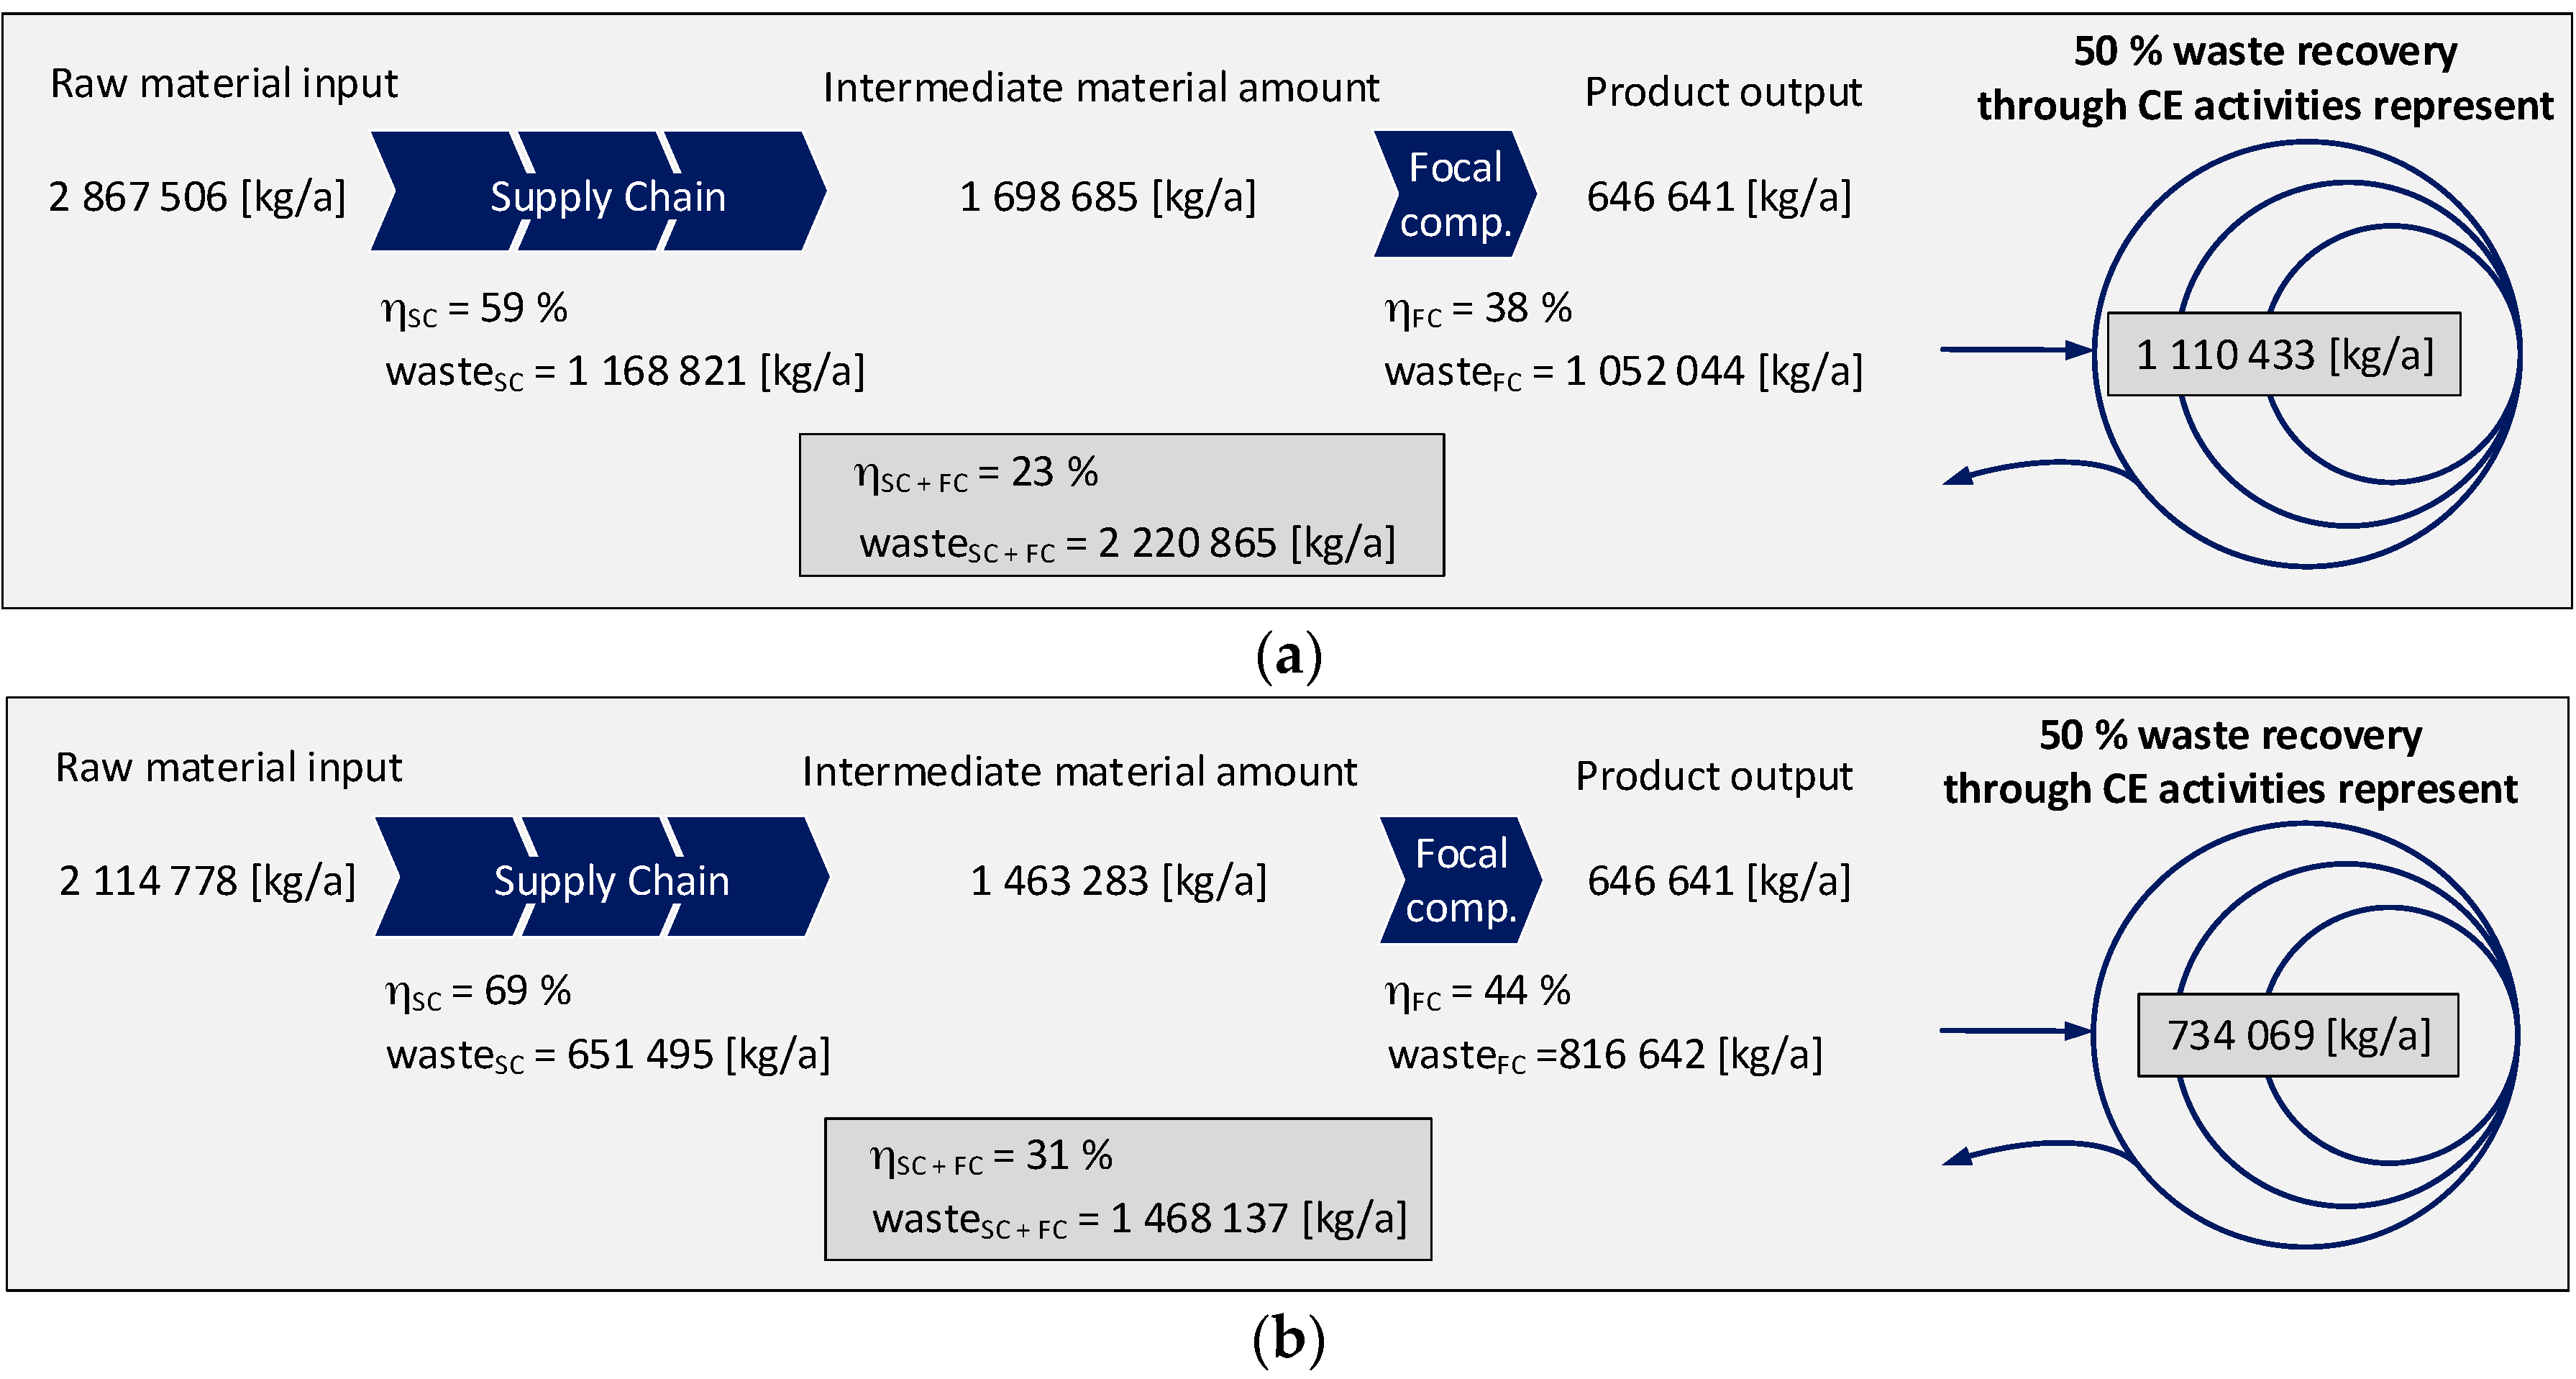
Figure 4 shows the optimisation potentials for the supply chain, the focal company, and through circular economy activities. It can be seen that in the investigated case, the supply chain efficiency before and after optimisation is significantly higher than the material efficiency of the focal company. In absolute terms however, the supply chain before optimisation (see
Figure 4a) creates 1,168,821 kg/a of waste (see also
Table 1), representing approximately 11% more than the waste output of the focal company. As mentioned in
Section 4.3, circular economy activities would decrease material extraction from the environment by 39%. Again, material and energy consumptions to operate circular economy activities are not included here. Nevertheless, the potential of circular economy activities is clearly evident.
After optimisation (see
Figure 4b), the outlook changes concerning the amount of waste in the supply chain and focal company. The focal company creates 816,642 kg/a of waste, 25% more than its supply chain. The potential of circular economy activities remains high (35%). See
supplementary materials for detailed information concerning the supply chain.
If product returns can be realised through circular economy activities to the same extent as waste return into the supply chain, implementing such circular economy actions represents the strongest tool to minimise material extraction from the environment.
5. Discussion
The potential to improve material efficiency in manufacturing supply chains and through circular economy aspects in this paper is related to one example manufacturing enterprise for the automotive industry and its main supply chains. The investigations are solely mass related and do not include energy- or cost-related parameters. The results differ when other enterprises and their supply chains are investigated. The example enterprise was chosen because the possible internal material efficiency improvements were known from previous examinations of this company. Furthermore, the supply chains of this enterprise are diverse and allow varying insights according to the supply chain chosen for analysis. For instance, one of the supply chains is related to water supply, which has the largest share of consumption in this case and offers large material efficiency improvements for this company. However, water is not scarce within the region in which the company operates and represents, in this example, a low value material.
As mentioned previously, energy efficiency improvements on the company level and within the supply chains are excluded in this investigation even though these are mass related, since the energy supply is based on the use of fossil and nuclear fuels. The main supply chains of the example company has been investigated in detail. The simulation method was tested by using different parameter settings for several plausible scenarios, for example by checking that the means of the simulation results coincide with the deterministic results when using symmetric random distributions.
Possible circular economy scenarios for the example manufacturing enterprise and its supply chain have not been examined within this analysis. Only the effect of a flat 50% waste reintroduction into the economic circle for material supply has been explored in order to show the potential effect of such measures. This simplified examination of circular economy measures already indicates how important such activities are for the future for decoupling economic growth from global material extraction.
For the example company the material efficiency scenario is based on optimisation of the existing production technologies and supply chain. The example company also has the option to abandon its existing production methods and to invest in new manufacturing technologies. This would lead to more efficient use of material and would disrupt one major supply chain. For this reason, the investigated enterprise can be seen as a focal company, which is able to shape new supply and circular economy networks. The analysis of the effect of such a disruption by technology change is the purpose of future investigations of this team of authors.
Economic investigations have been excluded within this specific exercise. An economic analysis would require detailed knowledge concerning the material prices, and the pricing and profit margins within different supply chains. Such data are not available in sufficient detail, are difficult to convert to foreign currencies, and are subject to significant fluctuation. However, economic investigations that particularly focus on cash flow and sales volume considerations are important for the actors of the supply chain. Material efficiency improvements of one actor, in this example case the focal company, will improve cash flow. The suppliers of this actor however, will lose sales volume and the question arises as to if and how these suppliers can be motivated to take material efficiency actions in a linear economy setup. In the examined example case, the paint supplier was unwilling to support material efficiency efforts. Consequently the example company looked for technology alternatives, which would in turn disrupt the existing paint supply chain.
6. Conclusions and Outlook
The investigations have clearly shown that even with uncertain or estimated consumption data, a sound basis for material efficiency improvements within manufacturing company borders and along the supply chain can be created. In addition, material efficiency measures should not be concentrated solely on the single company level, even though there may be some major improvement possibilities in some areas, as shown in the example case. The focus should also be on the supply chain partners as well as the move toward a circular economy. Within the supply chain, it is important to concentrate on those suppliers with the largest potential for material efficiency improvements and on those who would benefit most from such actions. For the majority of suppliers, material efficiency activities seem to be less attractive since improvement possibilities may be limited while still losing sales volume. Evidently, a significant potential for material savings lies within circular economy activities. In addition, taking into account economic considerations, it could be interesting for suppliers and consumers to establish business model innovations which include circular economy aspects. These business models need to ensure a fair distribution of the benefit potentials for all involved parties along the supply chain. As this requires increased transparency, digitalisation is seen from the perspective of the authors as an important enabler for transformation.
In general, under economic considerations the following future research question arises: “do supply chain disruptions triggered by technology, product, and business design changes, represent an important tool for the reduction of material extraction?” Moving forward from this question, there is a need for further research in the field of digitalisation of the transactions between the manufacturing network partners, and proper and effective establishment of innovative business models for circular economy purposes.
The computer simulation method utilised in this paper provides a basis for decision-making using parameter studies and offers insights into the reliability of the results that cannot be achieved by simple calculations alone (quantiles of the distribution can be employed to determine lower and upper bounds of the outcomes). The authors especially consider interactive computer simulations to be a very promising tool in this respect and plan to focus future research in this direction.


