Depopulation and the Aging Population: The Relationship in Italian Municipalities

Department of Political Sciences, Roma Tre University, 00146 Rome, Italy
*
Author to whom correspondence should be addressed.
Sustainability 2018, 10(4), 1004; https://doi.org/10.3390/su10041004
Submission received: 20 February 2018
/
Revised: 16 March 2018
/
Accepted: 27 March 2018
/
Published: 28 March 2018
(This article belongs to the Section Sustainable Urban and Rural Development)
Abstract
:In European countries, many territories have experienced and are still experiencing a depopulation, caused by a deficit of births relative to deaths, a negative net migration, or both. At the same time, many of these territories are also facing the population aging process, caused by a decrease in births and prolonged rise in longevity. Depopulation and the population aging processes are strongly connected. The aim of this work is to study the relationship between depopulation and the aging population and the sustainability of the two phenomena. We studied these phenomena in the Italian territories in the period of 1951–2011. The study was conducted by using the census data of the Italian municipalities. The correlation coefficient between depopulation and aging population indicators was calculated in order to investigate the relationship between the two phenomena. A regression model was applied in order to understand if population aging is linked to population variation. Finally, the municipalities, which experienced continuing depopulation, are examined in depth. Our results show that a strong depopulation trend contributed to subsequent levels of population aging, but recent population aging has also contributed to ongoing depopulation, creating a vicious circle. Long-term depopulation and continuing population aging does not seem to be sustainable in the near future.
1. Introduction
Demographic changes have affected both population size and its structure. At the end of the twentieth century, birth reduction and the increase of life expectancy in European countries should have resulted in a negative or stable population growth rate [1]; however, immigration counteracted these processes and contributed to a population increase [2]. Nonetheless, at subnational levels, many territories experienced, and are still experiencing, a population decrease. This can be caused by a deficit of births relative to deaths, a negative net migration (immigration minus emigration), or both. The negative balance of births and deaths is often combined with a negative net migration [3]. The emigration from marginal areas began with industrialization and has not come to an end [4]. This has caused a significant negative variation in population in many territories—a process known as depopulation. This has been present in various territories of the European continent for a long time [3].
At the same time, the decline in fertility and improvements in mortality rates are determining population aging in many countries and in different parts of the world [5,6]. The fall in births and in mortality rate in older age is influencing the age structure of the population. This is particularly true in Italy, where the prolonged fall of fertility rates, and consequently of births, has coincided with a sharp, prolonged rise in longevity [7]. Mortality improvement has sometimes been presented as the primary driver of long-term population aging, but the primacy has usually been given to fertility decline [8]. Not only the histories of fertility and mortality, but also that of migration are written into the population age structure [9]. The effect of migration on population aging is generally regarded as minor in most situations, but internal migration can have a great impact on the aging of local populations [10]. So, the demographic dynamics has caused and will continue to cause population aging, which is the increase in the population above the age of 65 in absolute terms, both as compared to the younger population and as a proportion of the total population [11]. Population aging is unquestionably the most important demographic force of the first half of the twenty-first century [12].
From a demographic point of view, depopulation is strongly connected with population aging [13]. Depopulation is determined by a deficit of births relative to deaths and/or a negative net migration. The deficit of births over deaths means fewer babies, and so, “over time, a decline in the number of babies will mean fewer young people and proportionally more people at older ages” [14]. Negative net migration is mostly determined by intense emigration. Migrants tend to be young, so the process of population aging can be accelerated in territories with high numbers of people who migrate elsewhere [15]. On the other hand, young adults leave higher-aged areas because of the lack of economic and social possibilities.
Emigration, depopulation, low birth rates, and high levels of aging marginalize rural areas and put access to basic services at risk [16]. Depopulation processes, particularly combined with population aging, constitute a serious challenge for society, the economy, and policy [17]. Indeed, one of the European Union’s economic policy guidelines is to ensure social and territorial development and cohesion [18].
In Italy, the population has increased generally, but after 1995, without foreign immigration, a depopulation would have been verified [19]. Demographic and socio-economic transformations lead to important changes in population distribution among the Italian territories and in the population age structure of the different Italian regions.
Depopulation processes in Italy and in other developed areas are happening in parallel with global and national population growth. So, while some countries and sectors are facing problems and challenges connected with rapid population increase, other countries and sectors are dealing with the effects of fast depopulation [20].
Since the 1970s, low levels of fertility (under the replacement fertility rate) and ongoing reductions in mortality have allowed the Italian population to become one of the oldest in the world [7]. The process of population aging in Italy has not been uniform across space and time, but rather it varies widely across different geographical areas of the country. Many small Italian areas are experiencing a much higher level of population aging [21]. So, depopulation and population aging, as well as the spatial distribution of population, constitute one of the main challenges for Italian society. The combination of a very old population, highly depopulated areas, and large regional differences has made the population dynamics in Italy very interesting to study.
The general aim of this work is to understand the sustainability of depopulation and the aging population together. We want to study the phenomena of depopulation and population aging in the Italian territories in the period of 1951–2011, by analyzing the most detailed administrative level, the municipalities (also known as local administrative units or LAUs). In this study, the census data of the population between 1951 and 2011 was used.
The first aim is to observe and describe the depopulation evolution in the various Italian territories. The second aim is to study the relationship between depopulation and population aging. In particular, this analysis aims to verify whether the most depopulated municipalities are the most aged. Furthermore, we want to verify how depopulation contributed to population aging in different time periods in the Italian municipalities. Our hypothesis is that strong depopulation has contributed to high levels of population aging, but also that the recent population aging has contributed to constant depopulation, creating a vicious circle. The third aim is to analyze if depopulation in the aged municipalities can be sustainable in the near future.
2. The Historical and Demographic Context
Since World War II, the Italian population has experienced relevant changes, because of the demographic dynamics of births, deaths, and migration. Indeed, in the relatively short time between 1961 and 2011, Italy experienced epochal demographic changes: since 1950s, the reduction in infant mortality; in the 1960s, the “baby boom”; since1970s, the reduction in adult and senile mortality; and in the 1980s and 1990s, the decrease in fertility. The low level of fertility (under the replacement fertility rate) determined a natural population decline [22]. The constant mortality reduction allowed Italy to reach the same high levels of life expectancy as most other developed countries [23]. Lastly, during the period between 1961 and 2011, Italy turned from an emigration country to an immigration country [19].
In Italy, the population continued to increase until the 1980s. After a period of stability, it started to increase again in the 1990s, thanks to foreign population. Since the 1970s, the reduction of births caused the decrease in the natural balance. It remained positive until 1995 and then turned negative. After 1976, net migration became positive, and since 1995, it has been relevant to the population increase [24].
Many Italian areas have experienced and are continuing to experience a depopulation similar to other developed regions. In particular, the Central and Northern populations have increased in comparison to the Southern and island populations. In some small areas, some subpopulations have disappeared or decreased, while others have drastically increased [25].
These demographic trends affected the population age structure, which now appears very altered. The proportion of the population over 65 years was 22.2% in 2011, while the share of people under 15 years 13.6%. The aging index, the ratio of people over 65 years and people under 15 years, is equal to 163.6. However, since the 1990s, immigration has not only contributed to a slight increase in the Italian population but has also made the population aging process less drastic [26].
In a deeper analysis of the territorial levels (major socio-economic regions, regions, provinces, and municipalities), internal migration was found to have an important role. Since the 1950s, migration has become fundamental in shaping the Italian demographic dynamic. Between the end of World War II and the middle of the 1970s, migration trajectories were distributed in many directions [27]. For example, internal migration patterns went from the South to the Center and Northwest, from the East to the West, from small and medium centers to larger urban aggregates, from the mountains to the hills and plains, and from rural to industrial areas [28]. During this period, industrialization and socio-economic development had a more positive impact on the standard of living in urban areas in comparison to rural areas [25]. These differences in socio-economic development were mirrored in the demographic trends. The migration from rural areas to urban centers made these rural areas more vulnerable [29].
Since the middle of the 1970s, the level of migration has reduced and migration from the South to the North has also decreased. Long-distance migration decreased both in absolute value and in proportion to short-distance migration. Nevertheless, migration from rural to urban areas has continued to be relevant [27].
Internal migration has contributed to shape economic differences between the Italian territories [30], and it has also been responsible for the depopulation of some areas. This migration has had an important role and a double impact on the Italian territories. On one hand, migration has depopulated some areas, but on the other hand, it has populated other areas. So, at the same time, it has contributed both to marginalize some areas and to make other territories more developed [31].
Emigration and its impact on fertility and population aging has continued to contribute to rural depopulation. Past demographic trends were so intense that their consequences will continue to be strong in the medium- and long-term. Population decline causes social and economic changes that can exacerbate the issue [29]. Then, dynamics such as fertility decreases and strong emigration patterns, diffused in peripheral areas, are spreading out in other areas. Depopulation and its evolution in the various Italian territories depend on a combination of the various characteristics of the relevant area. The typology of the territory, the role of agriculture, the industrialization process, and the different demographic dynamics contribute to shape the depopulation evolution.
Nevertheless, few recent studies have been conducted on depopulation in Italy, except in small areas such as some Alpine regions.
3. Data and Methods
This study was conducted by using ISTAT (National Institute of Statistics) census data of the Italian municipalities (LAUs) for the period of 1951–2011. An effort was made to adopt a unified and comparable territorial breakdown, which was based on the location of the boundaries in 2011. Municipality boundaries and total resident population were recorded in the ISTAT database “8mila Census”. In the case of the aggregation of two or more municipalities, the population over 65 years was calculated for every census year as the sum of two or more municipal populations over 65 years. In case of disaggregation of two or more municipalities, the population over 65 years was calculated for every census year as a division of two or more municipal populations over 65 years, in proportion to the total population. There are 8092 municipalities, which are heterogeneous in population and territorial size, but they are the most detailed territorial units. Because depopulation is a phenomenon recorded in a local population, the most detailed administrative unit is the only appropriate level at which to study depopulation.
Depopulation is measured by the negative numerical variation in the population of the areas. To this end, the population variations between different years were calculated for every inter-census period. In this paper, the depopulation indicator between two census years was the negative percentage variation in the resident population in two censuses:
where i was the i-mo municipality; t was the considered census year and t + 10 was the next census year; and P was the total resident population.
%NVARi(t + 10,t) = 100 × [(Pi(t) − Pi(t + 10))/Pi(t)] i = 1… 8092.
The negative percentage variation in the population for the inter-census period between 1951 and 2011 in each municipality was calculated.
The indicator of the population aging was constructed for the census years from 1961 to 2011 in each municipality. This indicator was the proportion of the population over 65 years in the census year:
where i was the i-mo municipality; t was the considered census year; P65+ was the resident population over 65 years; and P was the total resident population.
%P65+i(t) = 100 × (P65+i(t)/Pi(t)) i = 1… 8092.
First of all, a detailed descriptive analysis was conducted to depict the depopulation evolution in the Italian municipalities.
Pearson’s correlation coefficient between depopulation and population aging indicators was calculated in order to investigate the relationship between the two phenomena. The percentage variation between the population at the beginning of the period and at the end of the period was used as a depopulation indicator. The percentage of people over 65 years was used as an indicator of population aging.
The test for association between two variables was applied using Pearson’s product moment correlation coefficients.
A regression model was applied in order to understand whether population aging was linked to population variation in the Italian territories. This model was applied to every census year (1961, 1971, 1981, 1991, 2001, and 2011) for each municipality. The dependent variable was the percentage of the old population (indicator of population aging) in every census year. The explicative variable was the relative variation in the population (indicator of depopulation) in the pre-inter-census period. Finally, the municipalities that show depopulation in every considered period were examined in depth. The question is whether long-term depopulation and strong population aging are sustainable in the near future.
4. Results
In the considered period, there was high depopulation in the first two decades (between 1951 and 1961 and between 1961 and 1971), when most of the municipalities were involved in this process. The means of the depopulation indicators were high, despite the fact that the Italian population experienced an increase during these two periods. In the next decades, depopulated municipalities were always less. The means of depopulation indicators and the variability of the phenomenon decreased. In general, depopulation decreased, but the reductions were not so relevant. In the last decade, the number of depopulated municipalities declined significantly (Table 1).
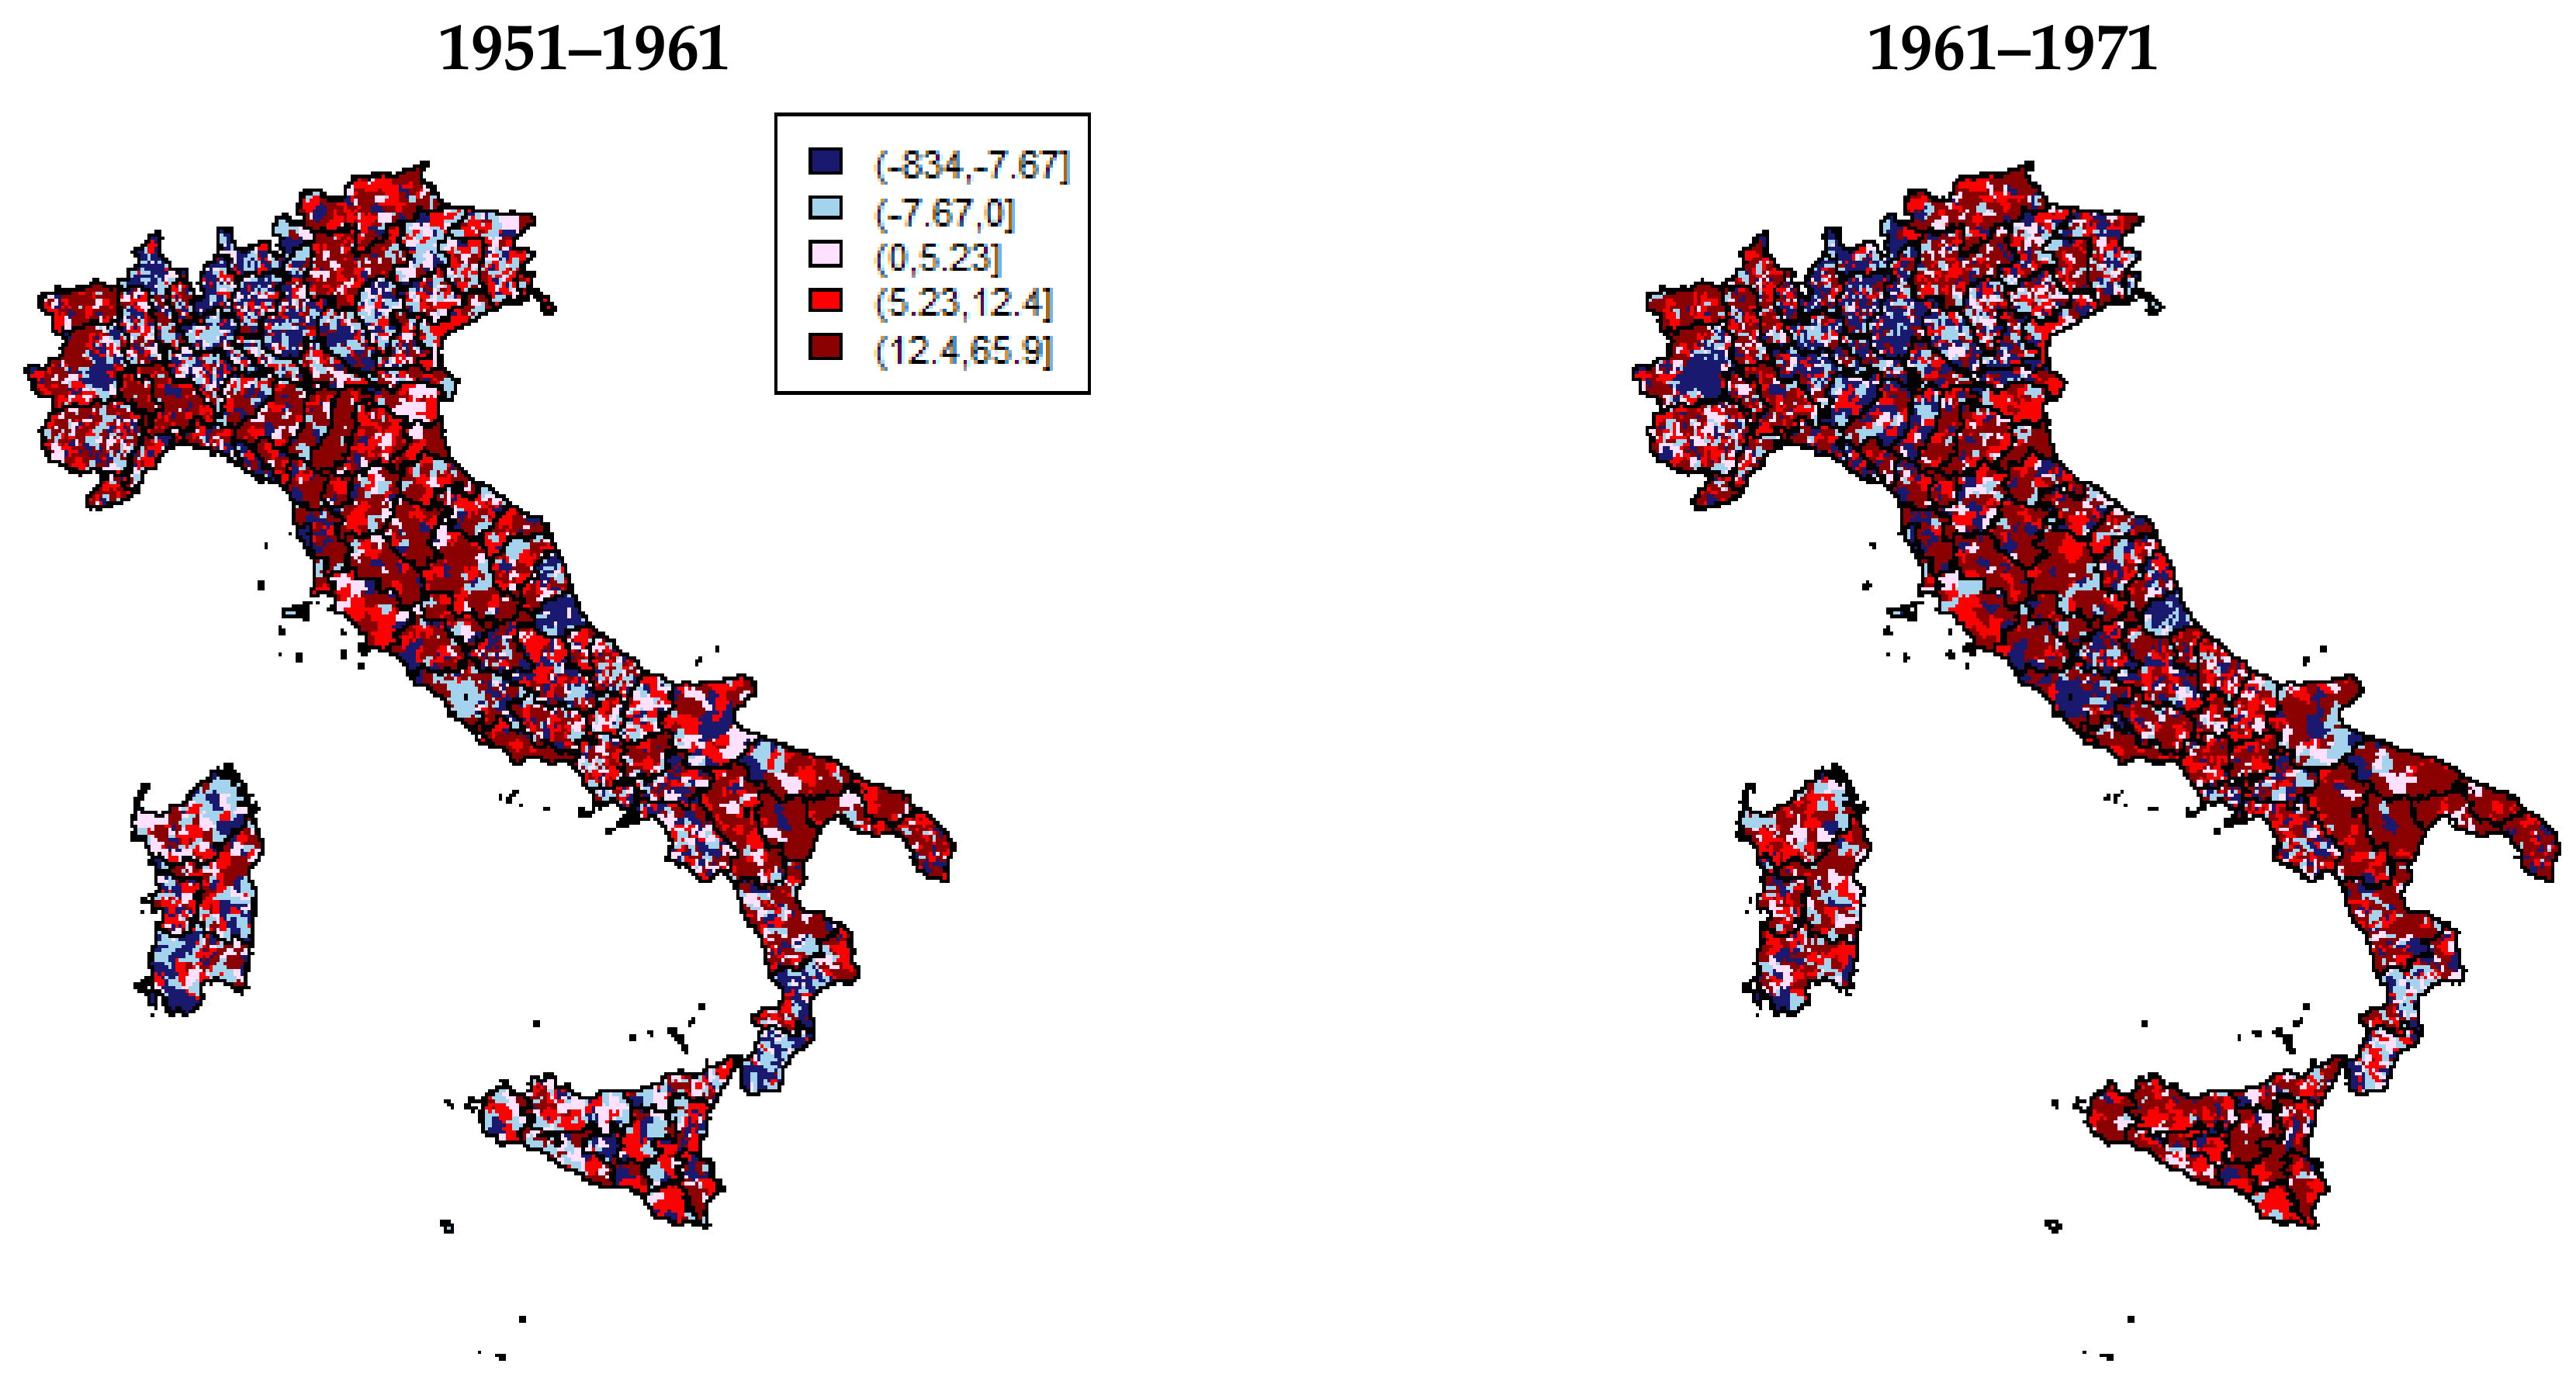
In the first two decades, from 1951 to 1961 and from 1961 to 1971, depopulation in the Italian municipalities was more intense than in the following periods. Depopulation influenced the majority of both mountain and rural municipalities. In the first period, it affected the Northern municipalities to a greater extent. In the second decade, it had a greater impact on the Southern and island municipalities. These areas contributed more to the high level of internal migration verified during the 1960s (Figure 1). In this period, migration towards industrialized and urban areas exacerbated the phenomenon in low-population areas. The depopulation was mirrored in the consequent abandonment of rural and mountain areas. In the municipalities, the mean of the depopulation indicator increased from 12.4 to 14.8, so the depopulation was widespread and involved most of the municipalities: 63.9% in the first period and 65.5% in the second period. Meanwhile, the growth rate of the Italian population increased from 5.8 to 7.7%. These trends prove that an increase of the population in a small number of municipalities is stronger than that of the national population. In the Southern and island socio-economic regions, the situation was more critical because 75% of the municipalities experienced a negative variation in the population (Table 2).
After a period of concentration and polarization settlement among the municipalities, there is a period of stagnation and decline in depopulation [32]. In particular, between 1971 and 1981, fewer municipalities depopulated. In this period, the Italian population continued to increase by a growth rate of 4.5%, and only 49.1% of the municipalities experienced depopulation. This is in line with the so-called phenomenon of deurbanization [33]. On one hand, escape from the city occurs; whilst on the other hand, the real boundaries of the cities become wider. In general, the period of 1951–1971 was a phase of urbanization, while the following thirty years was a phase of deurbanization [34].
The decade between 1981 and 1991 seems to be stationary for both the Italian population and migration flows. The mean of the depopulation indicator was 7.6%. The percentage of depopulated municipalities still decreased (48%). This was also seen in the Southern and island socio-economic regions (49%).
Between 1991 and 2001, a new acceleration of depopulation occurred in the Southern and island municipalities. In the Southern and island socio-economic regions, most of the municipalities (66%) started to experience a negative variation in population, while in the North only 36% of the municipalities experienced depopulation. In the Northern socio-economic region, especially in the Northeast, a population increase occurred in municipalities that had depopulated in the previous periods. This positive variation in the population can be attributed more to the migration dynamic rather than the natural dynamic. This demonstrated a new capacity of attraction for many of the Northern municipalities. Indeed, the positive migration balance between Italy and foreign countries can explain this attraction.
Finally, between 2001 and 2011, the number of depopulated municipalities decreased further, but in the South and island regions it remained similar to those of the previous period.
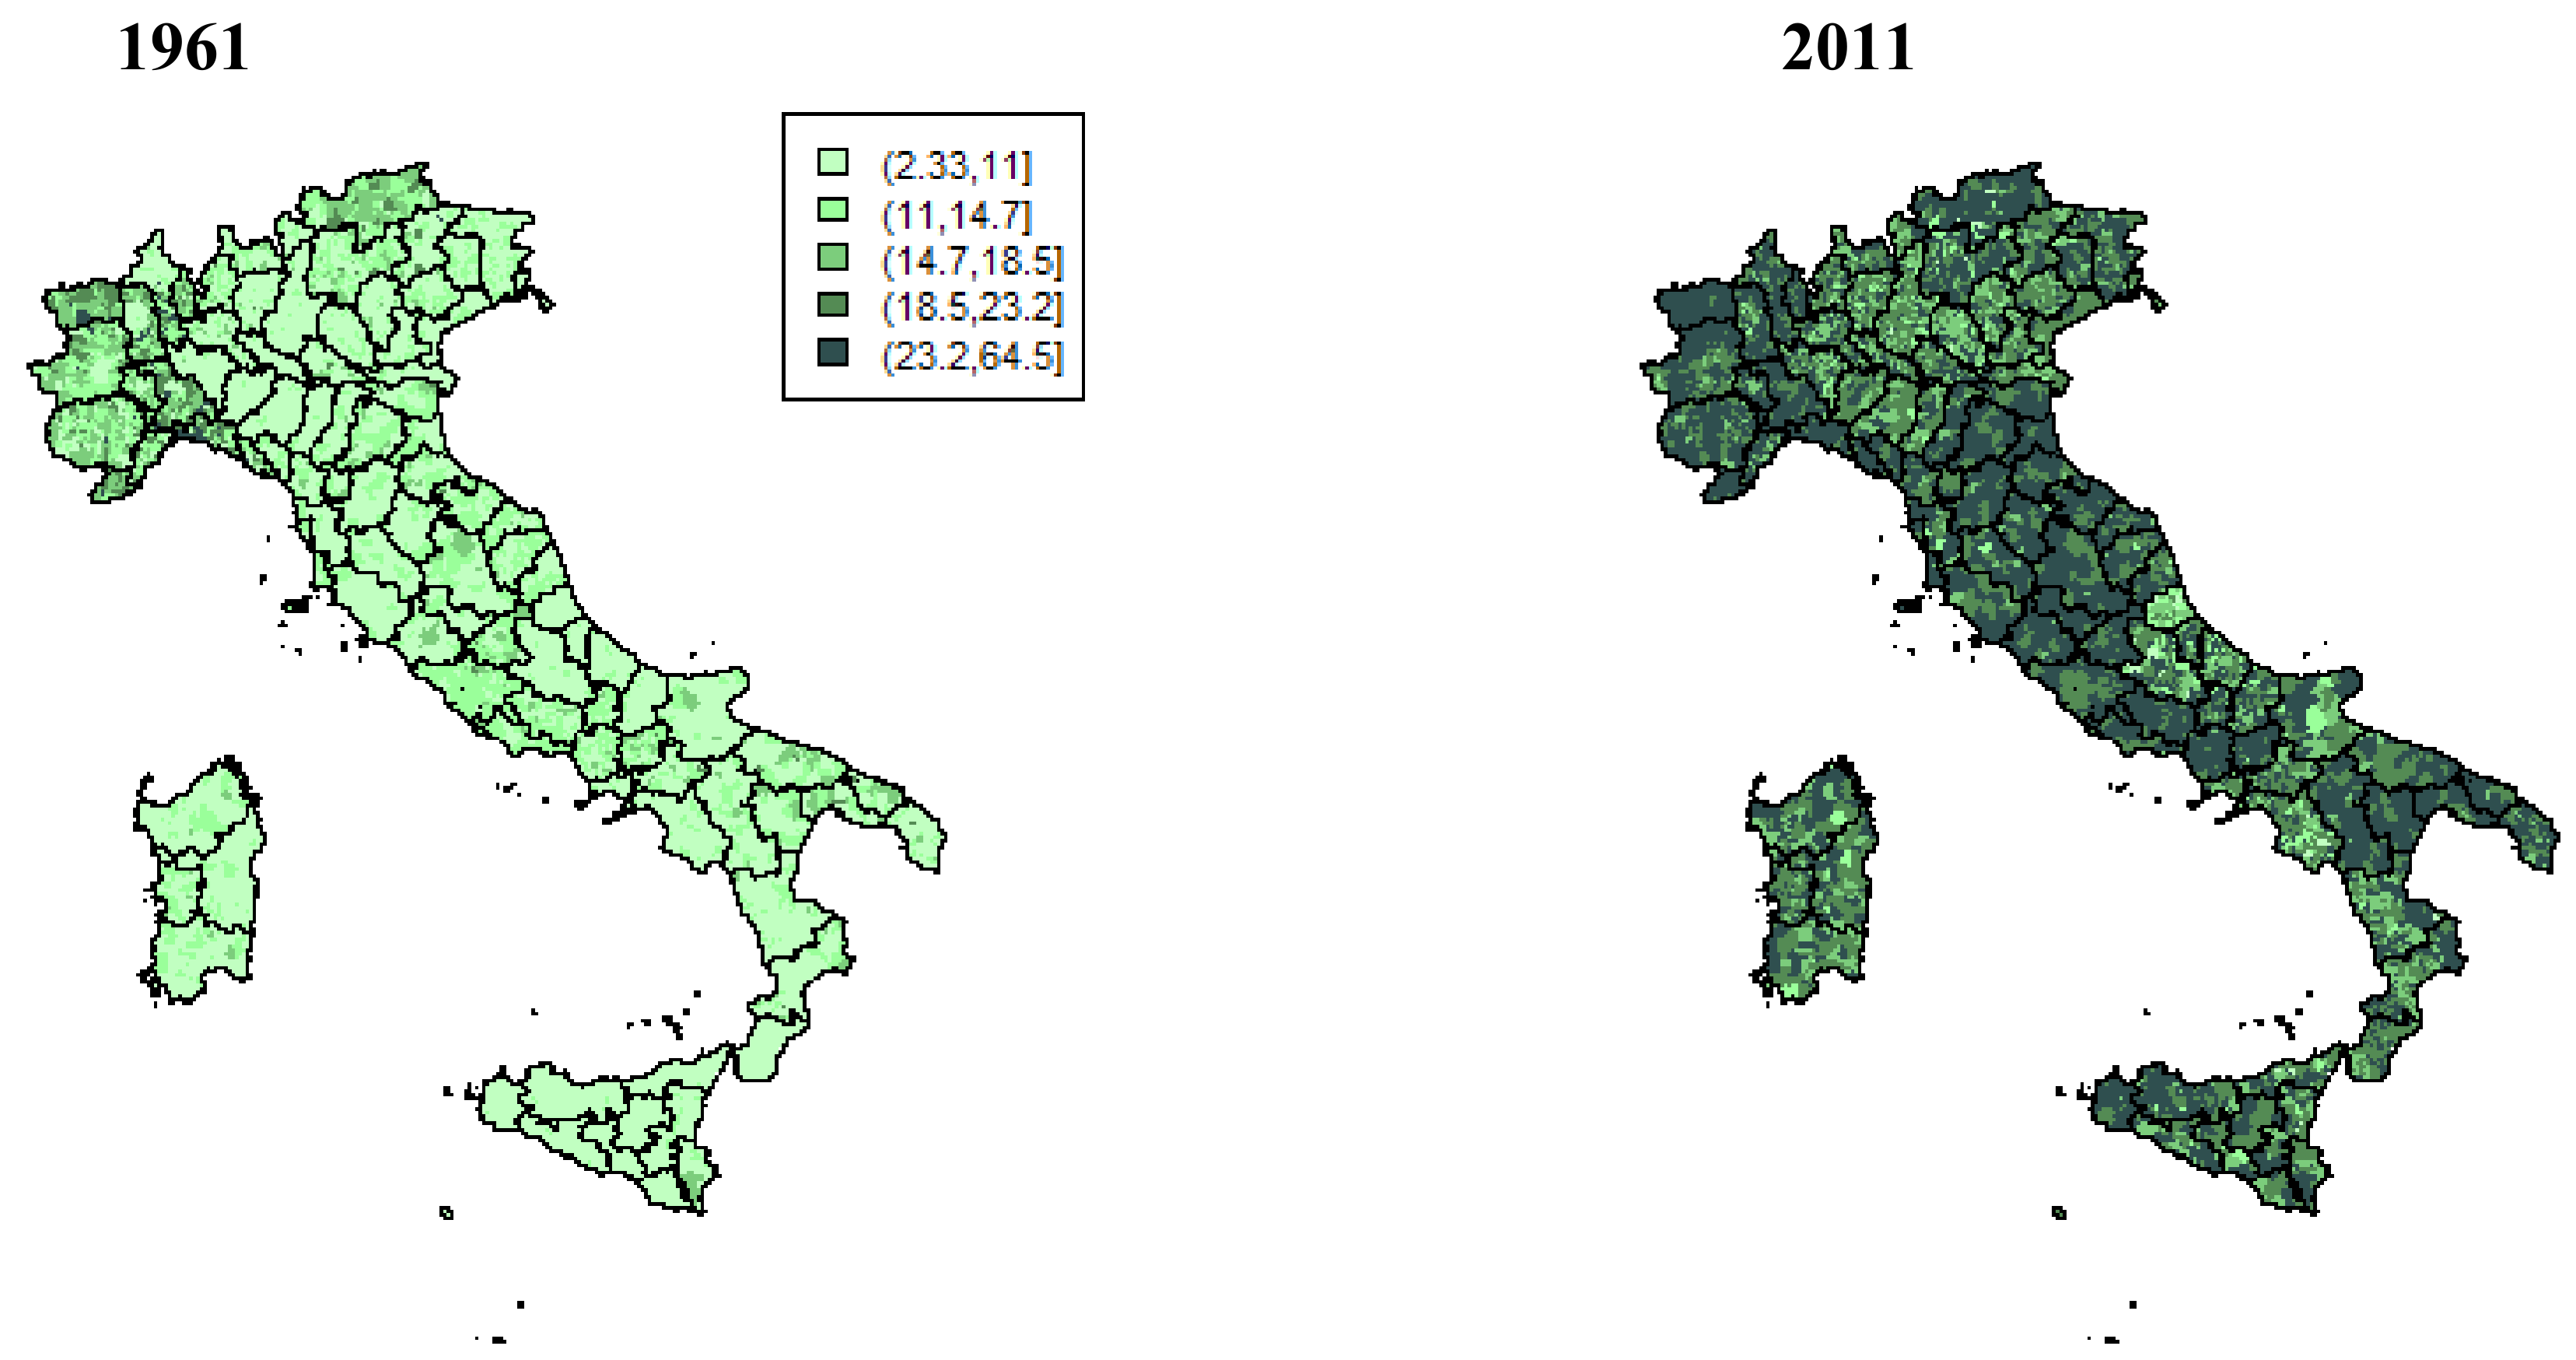
Around the end of the century and the beginning of the new millennium, population aging became the biggest problem in developed countries [35]. In fact, the demographic evolution after World War II provided the basis of population aging. As underlined previously, the increase in life expectancy and decrease in fertility altered the age structure of populations. They were associated with strong emigration to both national and subnational geo-areas. Initially, population aging was observed in the Northwest, which was the first region to experience economic development (Figure 2). In parallel, areas close to industrial centers were the first to send a young labor force and consequently, accelerate the population aging of those areas. The process involved all of the Italian territories, thanks to the diffusion of modern demographic behavior. In 2011, population aging appeared intense and widespread except for in some Southern areas, where the lack of economic development has partially slowed down the decrease in fertility rates. In the South of Italy, the fertility decline diffused later than in other regions. The maintenance of some traditional behaviors depended also on the scarce diffusion of female employment. Also, the presence of foreigners reduced the intensity of the population aging in some Northeastern areas [36].
At a first glance, there is no link between depopulation and population aging, except for in some municipalities of the Central Appennino and, obviously, in some Northwestern municipalities.
The relationship between depopulation and population aging can be biunivocal. So, there are two relationships: first, between depopulation in one period and population aging at the end of the period and second, between population aging at the beginning of the period and depopulation in the next. The first correlation points out that the depopulation process is connected to the population aging process recorded at the end of the period. On the contrary, the second correlation underlines the link between the population aging process and the subsequent depopulation caused by a youth exodus from aging areas. The Pearson’ coefficients of correlation between the depopulation during the inter-census period and the population aging at the end of the period are always positive and statistically significant. The values are almost always more than 0.5, except for in the first two decades (1951–1961: 0.36; 1961–1971: 0.45; 1971–1981: 0.60; 1981–1991: 0.52; 1991–2001: 0.60; and 2001–2011: 0.58). This demonstrates that a high level of depopulation corresponds to a high level of population aging at the end of the period. The second correlation between the level of population aging at the beginning of the period and the depopulation in the next inter-census period is always positive and statistically significant, but the values are always more contained (1961–1971: 0.25; 1971–1981: 0.45; 1981–1991: 0.43; 1991–2001: 0.48; and 2001–2011: 0.52). The maximum value is equal to 0.5 for depopulation between 2001 and 2011 with a population aging as of 1 January 2001.
The values of both correlations point to the existence of a link between the two phenomena. This link is very complex, but the relationship between the depopulation in a period and the population aging recorded at the end of the period is more significant.
Regression analysis was conducted to explore in depth the relationship between the two phenomena. The variation in the population coefficient was used to explain the population aging at the end of the period. The results demonstrated that an increase in depopulation corresponded to an increase in population aging. In the first two periods, the coefficients were very low, despite their significance. The capability of explanation of the model (expressed by the coefficient of determination, denoted R2) was under 0.2. Since 1981, the population aging seems to be better explained (the R2 is equal to 0.36) by the depopulation recorded in the previous period. The effect of the population variation increases in the models applied in recent periods, but not in the last period (Table 3).
The demographic dynamics in the previous decades influence the population aging levels. These are also influenced by the previous dynamics, because demographic dynamics are, by their nature, characterized by long periods and profound inertia [37]. A more complex model was applied to the population aging recorded on 1 January 2011. In this model, the explicative variables are the population variables in the periods of 1961–1971, 1971–1981, 1981–1991, and 2001–2011. With an R2 superior to 0.5, the model shows how the population aging in municipalities is connected with depopulation occurring in all the considered periods. The population variable coefficients are positive and always significant (Table 4). The depopulation verified in 1991–2001 had a major effect but was similar to that in 2001–2011 (Table 4).
As hypothesized, the relationship between population aging and depopulation is continuing to be very important. The model shows that past and present depopulation is continuing to influence population aging at a sub-territorial level.
Ongoing depopulation and very high levels of population aging can cause a very altered age structure in the population and very low demographic dynamics, which identify situations of demographic malaise [38].
So, an analysis of municipalities that have experienced continuing depopulation from the year 1951 (depopulated municipalities) has been conducted. We have found that 18% of Italian municipalities (a total of 1475) always experience depopulation. Of these municipalities, 50% of are in the Southern and island socio-economic regions and represent 27% of the total Southern and island municipalities. On 1 January 1951, these municipalities included 10% of the Italian population and on 1 January 2011 they included only 3% of the population. Based on the negative growth rate of the last decade (equal to −71.4 per 1000 inhabitants), this population of 2 million people is going to be reduced by half in less than 10 years. The number of these populations is variegated, but more than 50% of the depopulated municipalities have a population of less than 1000 inhabitants, and only 7% have more than 10,000. Three municipalities have less than 50 inhabitants and only one municipality has more than 20,000.
On 1 January 1951, population aging in the depopulated municipalities, equal to 12%, was on average a little bit higher than the national level, equal to 10%. Meanwhile, the differences have increased. On 1 January 2011 population aging, equal to 23.9% in Italy, reached 30.7% in the depopulated municipalities. In particular, the ratio between old and young is on average equal to 300:100.
This continuous depopulation seems to have drastically contributed to the high population aging in these municipalities. Already intense population aging is not sustainable, but to manage it together with continuous depopulation seems impossible.
5. Discussion and Conclusions
The high levels of depopulation and population aging are continuing to be very significant.
In the second half of the 1900s, ongoing depopulation in some Italian areas stressed the population aging process.
The results of both descriptive and explorative analyses lead to interesting results—these highlighted relationships, which were only partially known. Depopulation studies in general focus only on small territories and not the total national context. Furthermore, the relationships between depopulation and the aging population are known, but not through statistical analysis. Finally, these relationships have not been studied in recent times, that is after the 1970s.
The relationship between depopulation and population aging is alarming. This relationship is direct and double. On one hand, the depopulation process contributed to the subsequent levels of population aging. On the other hand, the population aging process contributed to the subsequent depopulation. In particular, depopulation has emphasized population aging. Past and present depopulation is continuing to influence population aging at a sub-territorial level.
The results underlined the difference between Northern and Southern regions: the economically and socially developed North could overcome important demographic problems, while the Southern regions—which are behind the Northern ones from a demographic point of view—are now facing important challenges, without having appropriate instruments to solve them.
In Italy, the role of immigration in the recovery of areas that were depopulated seems to be contained, despite many scientists finding this role to be relevant [39]. In particular, in the Southern macro region, immigration did not contribute to repopulation.
Depopulation and the aging population have reached such alarming levels that areas of demographic malaise can be identified [38]. Demographic recovery in some areas is really difficult without external action.
It is important to underline that the two considered phenomena are both determined by other dynamics, which have not been considered directly in this model. Here, the attention was focused only on the link between depopulation and population aging, without taking into account other variables. Further analysis will allow us to examine in depth the relationships with and the importance of other demographic and social variables.
Depopulation and population aging are the complex result of demographic dynamics. These processes pose important socio-economic and environmental issues, in particular in territories in which depopulation is intense. In these territories, political and economic sustainability is strongly questioned.
These results encourage further detailed studies. The role of demographic components and territorial differences should be evaluated further.
Author Contributions
Cecilia Reynaud and Sara Miccoli worked collectively. Cecilia Reynaud suggested the model and Sara Miccoli contributed to the literature review. Both authors analyzed the data, discussed the results of the model and wrote the paper.
Conflicts of Interest
The authors declare no conflict of interest.
References
- Coleman, D.; Rowthorn, R. Who’s afraid of population decline? A critical examination of its consequences. Popul. Dev. Rev. 2011, 37, 217–248. [Google Scholar] [CrossRef] [PubMed]
- Harper, S. The important role of migration for an ageing nation. J. Popul. Ageing 2016, 9, 183–189. [Google Scholar] [CrossRef]
- Doignon, Y.; Oliveau, S.; Blöss-Widmer, I. L’Europe méridionale depuis 20 ans: Dépeuplement, dépopulation et renouveau démographique. Espace Popul. Soc. Space Popul. Soc. 2016. [Google Scholar] [CrossRef]
- Livi Bacci, M. La Popolazione Nella Storia d’Europa; Laterza: Roma/Bari, Italy, 1998; ISBN 9788842055778. [Google Scholar]
- Schoeni, R.F.; Ofstedal, M.B. Key themes in research on the demography of aging. Demography 2010, 47, S5–S15. [Google Scholar] [CrossRef] [PubMed]
- Lutz, W.; Sanderson, W.; Scherbov, S. The coming acceleration of global population ageing. Nature 2008, 451, 716–719. [Google Scholar] [CrossRef] [PubMed]
- Golini, A. Possible policy responses to population ageing & population decline. The case of Italy, Policy responses to population decline & ageing. Popul. Bull. U. N. 2000, 44, 150–170. [Google Scholar]
- Murphy, M. Demographic determinants of population aging in Europe since 1850. Popul. Dev. Rev. 2017, 43, 257–283. [Google Scholar] [CrossRef]
- Wilson, C.; Sobotka, T.; Williamson, L.; Boyle, P. Migration and intergenerational replacement in Europe. Popul. Dev. Rev. 2013, 39, 131–157. [Google Scholar] [CrossRef]
- Rowland, D.T. Global Population Aging: History and Prospects. In International Handbook of Population Aging; Uhlenberg, P., Ed.; Springer: Dordrecht, The Netherlands, 2009; ISBN 978-1-4020-8356-3. [Google Scholar]
- Kaare, C.; Doblhammer, G.; Rau, R.; Vaupel, J.-W. Ageing populations: The challenges ahead. Lancet 2009, 374, 1196–1208. [Google Scholar] [CrossRef]
- United Nations, Department of Economic and Social Affairs, Population Division. World Population Ageing 2015; (ST/ESA/SER.A/390); United Nations: New York, NY, USA, 2015. [Google Scholar]
- Hospers, G.J.; Reverda, N. Demographic Changes. In Managing Population Decline in Europe’s Urban and Rural Areas; Hospers, G.J., Reverda, N., Eds.; Springer: Cham, Switzerland, 2015; ISBN 978-3-319-12411-7. [Google Scholar]
- Kinsella, K.; Phillips, D.R. Global Challenge of Ageing: The Challenge of Success; Population Bulletin; Population Reference Bureau: Washington DC, USA, 2005. [Google Scholar]
- Rechel, B.; Grundy, E.; Robine, J.M.; Cylus, J.; Mackenbach, J.P.; Knai, C.; McKee, M. Ageing in the European union. Lancet 2013, 381, 1312–1322. [Google Scholar] [CrossRef]
- OECD. Rural Policy Reviews: Italy; OECD: Paris, France, 2009; p. 228. ISBN 9789264056237. [Google Scholar]
- Kholer, T.; Elizbarashvili, N.; Meladze, G.; Svanadze, D.; Meessen, H. The Demogeographic Crisis in Racha, Georgia: Depopulation in the Central Caucasus Mountains. Mt. Res. Dev. 2017, 37, 415–424. [Google Scholar] [CrossRef]
- European Commission. Europe 2020: A Strategy for Smart, Sustainable and Inclusive Growth. 2010. Available online: http://eur-lex.europa.eu/LexUriServ/LexUriServ.do?uri=COM:2010:2020:FIN:EN:PDF (accessed on 1 February 2018).
- Strozza, S. Foreign immigration in Italy: A forty-year-old history. In Proceedings of the 48th Scientific Meeting of the Italian Statistical Society, Salerno, Italy, 8–10 June 2016; Pratesi, M., Pena, C., Eds.; SIS: Salerno, Italy, 2016. ISBN 9788861970618. [Google Scholar]
- Alados, C.L.; Errea, P.; Gartzia, M.; Saiz, H.; Escós, J. Positive and negative feedbacks and free-scale pattern distribution in rural-population dynamics. PLoS ONE 2014, 9, e114561. [Google Scholar] [CrossRef] [PubMed]
- Miccoli, S.; Reynaud, C. Invecchiamento demografico: Dinamiche nelle province italiane. Eyesreg 2016, 6, 53–56. Available online: http://www.eyesreg.it/wp-content/uploads/Pdf/Volume-6-Numero-2.pdf#page=26 (accessed on 19 January 2018).
- Watkins, S.C. From local to national communities: The transformation of demographic regimes in Western Europe, 1870–1960. Popul. Dev. Rev. 1990, 16, 241–272. [Google Scholar] [CrossRef]
- Caselli, G.; Vaupel, J.W.; Yashin, A.I. Mortality in Italy: Contours of a century of evolution. Genus 1985, 41, 39–55. [Google Scholar] [PubMed]
- Baldi, S.; De Azevedo, R.C. La Popolazione Italiana: Storia Demografica dal Dopoguerra ad Oggi; Il Mulino: Bologna, Italy, 2005; ISBN 978-88-15105080. [Google Scholar]
- Rizzo, A. Declining, transition and slow rural territories in southern Italy Characterizing the intra-rural divides. Eur. Plan. Stud. 2015, 24, 231–253. [Google Scholar] [CrossRef]
- Gesano, G.; Strozza, S. Foreign migrations and population aging in Italy. Genus 2011, 57, 83–104. [Google Scholar]
- Golini, A.; Reynaud, C. South-North population movements in Italy forty years later. Riv. Ital. Econ. Demografia Stat. 2010, LXIV, 101–122. [Google Scholar]
- Birindelli, A.M.; Gesano, G.; Sonnino, E. Lo spopolamento in Italia nel quadro dell'evoluzione migratoria e demografica (1871–1971). In Un Secolo di Emigrazione Italiana: 1876-1976; Rosoli, G., Ed.; Centro Studi Emigrazione: Roma, Italy, 1976; ISBN 8885438059. [Google Scholar]
- Martínez-Filgueira, X.; Peón, D.; López-Iglesias, E. Intra-rural divides and regional planning: An analysis of a traditional emigration region (Galicia, Spain). Eur. Plan. Stud. 2016, 25, 1237–1255. [Google Scholar] [CrossRef]
- Volpi, R. Storia Della Popolazione Italiana Dall'unità a Oggi; Nuova Italia: Firenze, Italy, 1989. [Google Scholar]
- Morettini, G. La popolazione totale e per età nelle province italiane dal 1881 al 2001. Un’analisi descrittiva. Pop. Stor. 2006, 7, 83–104. [Google Scholar]
- Bartaletti, F. La popolazione delle città alpine italiane. Rev. Géogr. Alp. 2001, 89, 75–86. [Google Scholar] [CrossRef]
- Costa, M. Some preliminary ideas about urban diffusion on a local scale. In Urban and Regional Issues; Gałczyńska, B., Węcławowicz, G., Eds.; Conf. Papers, 24; IGiPZ PAN: Warszawa, Poland, 1995. [Google Scholar]
- Conforti, L.; Mela, A.; Perino, G. Aree Urbane e Tendenze Insediative Nell’italia del Nord; Ires. Istituto di Ricerche Economico-Sociali del Piemonte: Torino, Italy, 2013. [Google Scholar]
- Golini, A. Demographic trends & population policies. Futures 2001, 33, 27–41. [Google Scholar] [CrossRef]
- Golini, A.; Basso, S.; Reynaud, C. Invecchiamento della popolazione in Italia: Una sfida per il paese e un laboratorio per il mondo. G. Gerontol. 2003, 6, 528–544. [Google Scholar]
- Livi Bacci, M. Storia Minima Della Popolazione del Mondo, 2nd ed.; Il mulino: Bologna, Italy, 2011; ISBN 978-88-15-266491. [Google Scholar]
- Golini, A.; Mussino, A.; Savioli, M. Il Malessere Demografico in Italia: Una Ricerca sui Comuni Italiani; Il Mulino: Bologna, Italy, 2001; ISBN 978-88-15-078209. [Google Scholar]
- Collantes, F.; Pinilla, V.; Sáez, L.A.; Silvestre, J. Reducing-Depopulation in Rural Spain: The Impact of Immigration. Popul. Space Place 2014, 20, 606–621. [Google Scholar] [CrossRef]
Figure 1.
%NVARi for the inter-census periods (1951–1961, 1961–1971, 1971–1981, 1981–1991, 1991–2001, and 2001–2011). Source: our own elaboration on ISTAT data.
Figure 1.
%NVARi for the inter-census periods (1951–1961, 1961–1971, 1971–1981, 1981–1991, 1991–2001, and 2001–2011). Source: our own elaboration on ISTAT data.

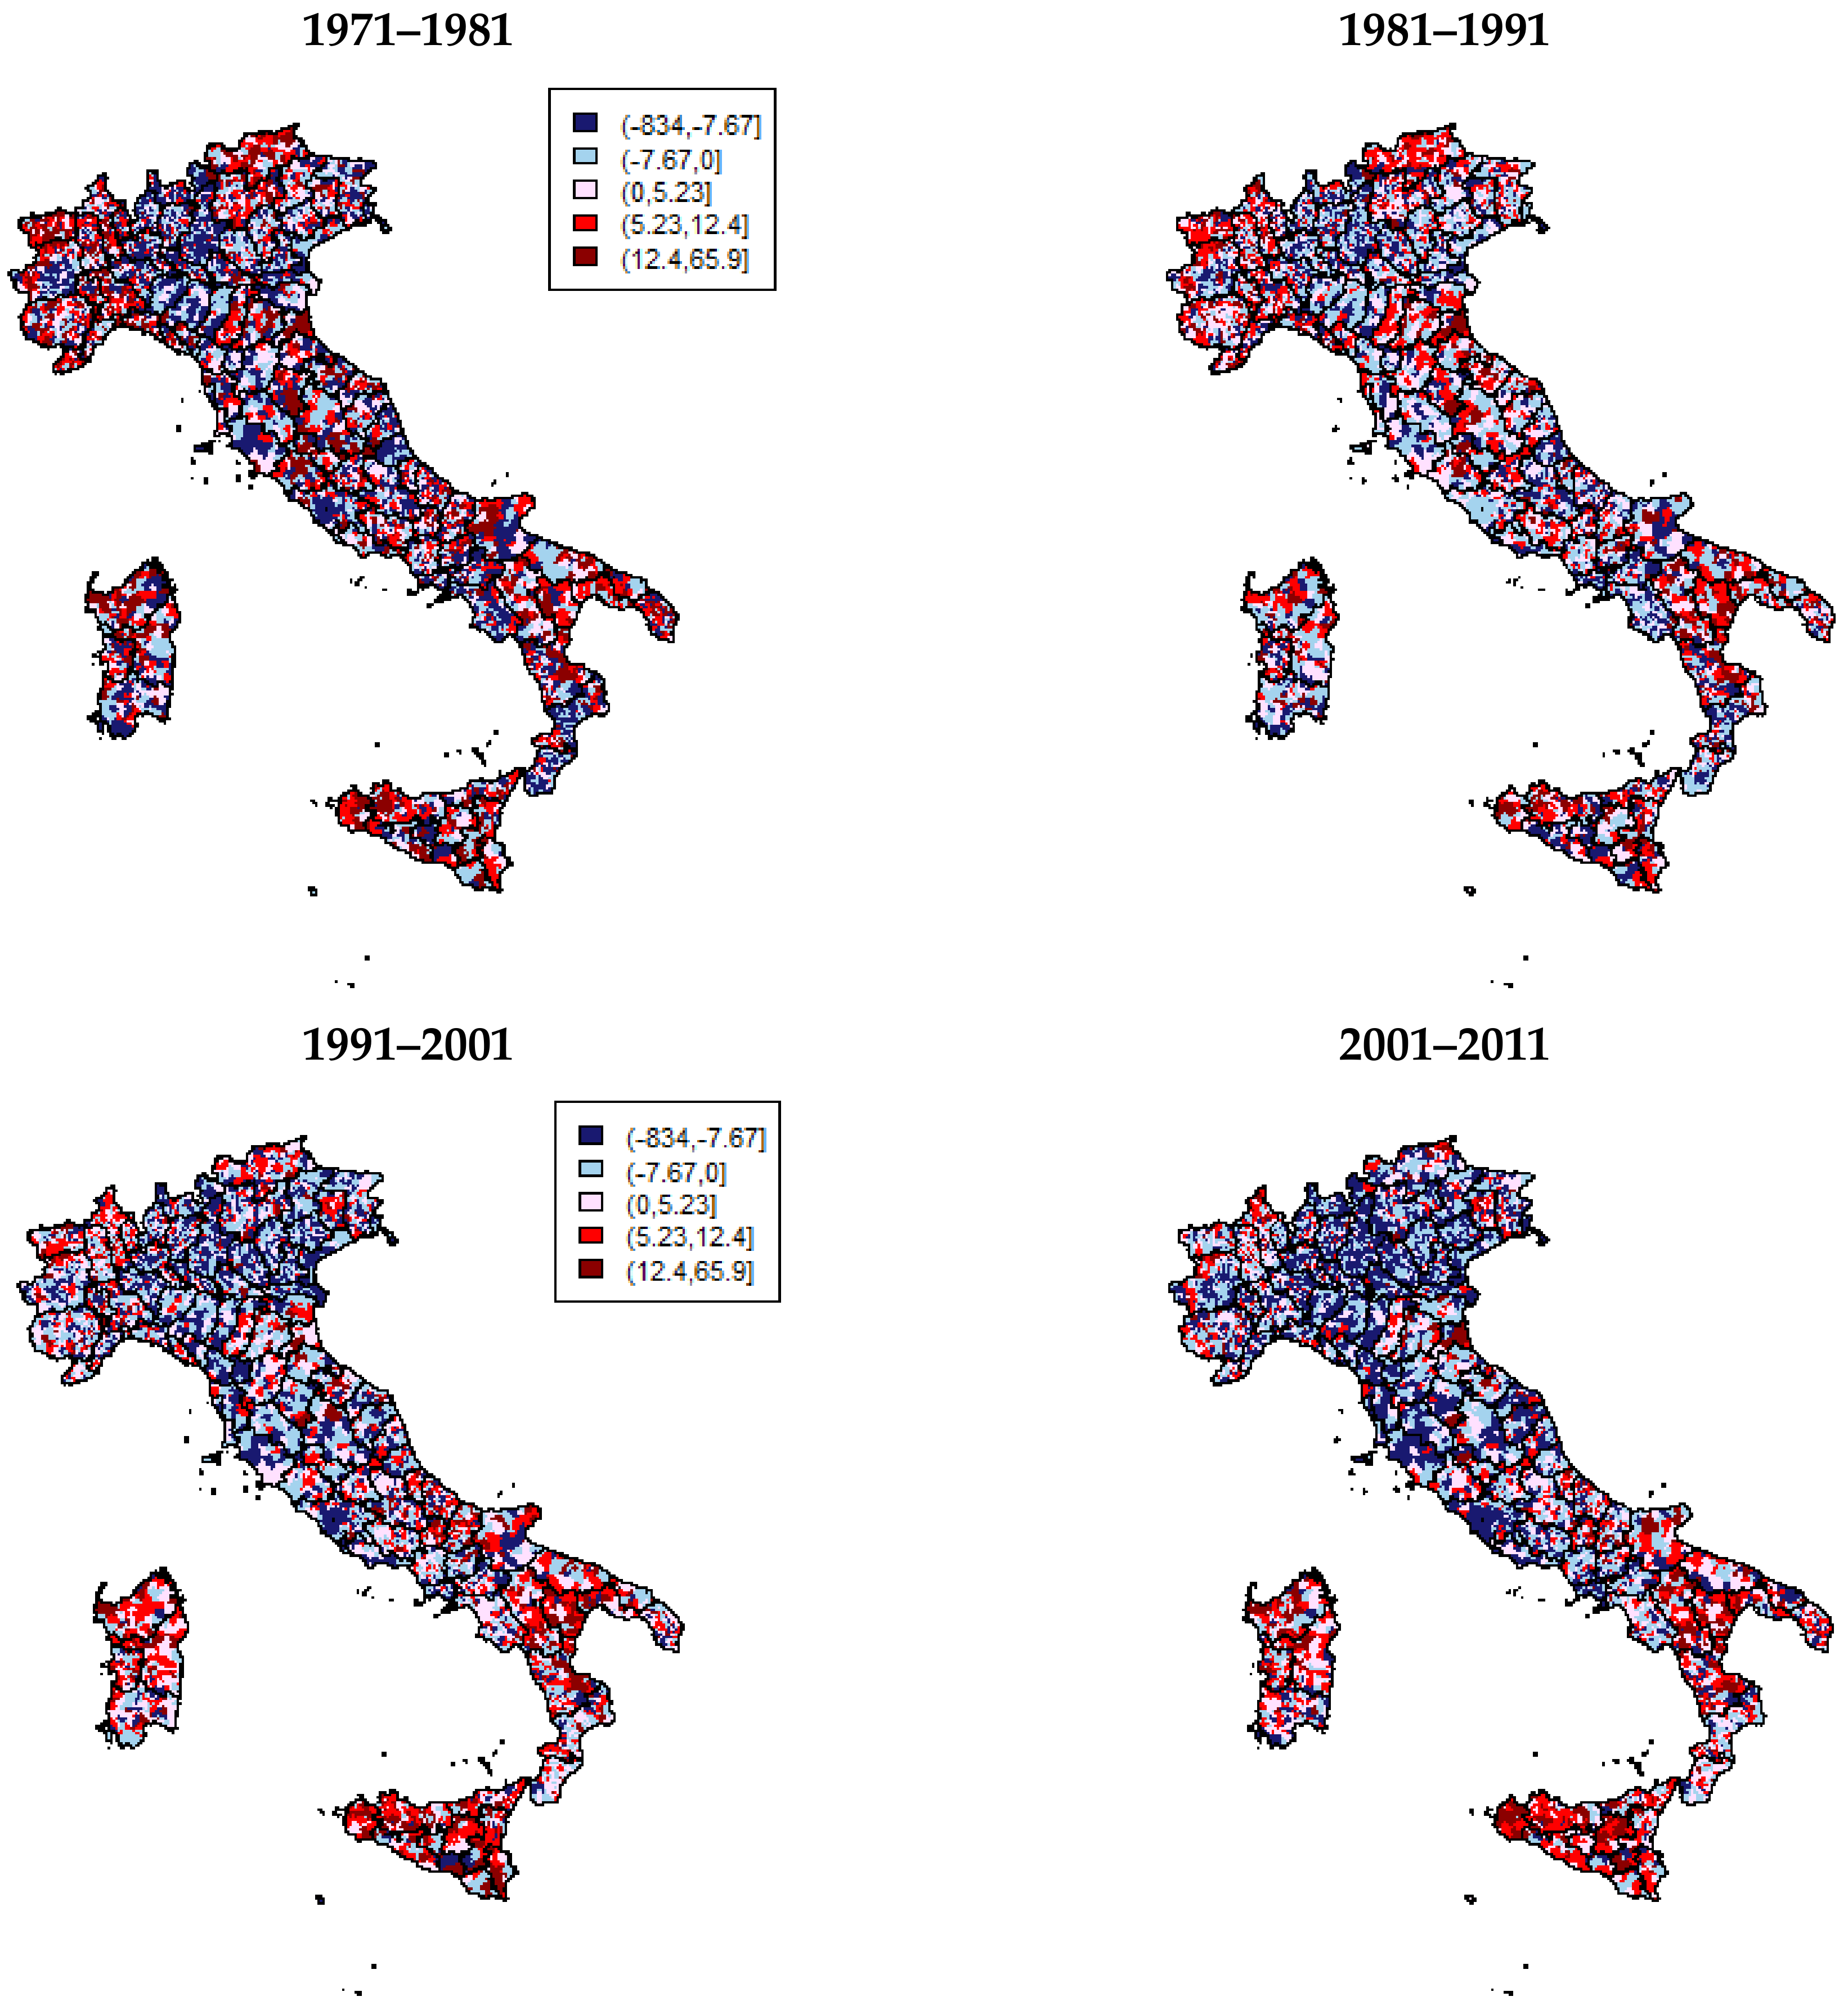
Figure 2.
The proportion of the population over 65 years in Italian municipalities (%P65+i(t)) on the census years 1961 and 2011. Source: our own elaboration on ISTAT data.
Figure 2.
The proportion of the population over 65 years in Italian municipalities (%P65+i(t)) on the census years 1961 and 2011. Source: our own elaboration on ISTAT data.

Table 1.
Depopulation in Italian municipalities. Descriptive statistics of the negative percentage variation in the population residents (%NVARi) for inter-census periods (1961–1971, 1971–1981, 1981–1991, 1991–2001, and 2001–2011).
Table 1.
Depopulation in Italian municipalities. Descriptive statistics of the negative percentage variation in the population residents (%NVARi) for inter-census periods (1961–1971, 1971–1981, 1981–1991, 1991–2001, and 2001–2011).
| Inter-Census Period | Mean | Standard Deviation | Depopulated Municipalities (Absolute Values) | Depopulated Municipalities (Per Cent Values) |
|---|---|---|---|---|
| 1951–1961 | 12.41 | 8.12 | 5170 | 63.9 |
| 1961–1971 | 14.82 | 9.61 | 5293 | 65.4 |
| 1971–1981 | 9.55 | 7.24 | 3968 | 49.0 |
| 1981–1991 | 7.57 | 6.52 | 3901 | 48.2 |
| 1991–2001 | 7.31 | 6.21 | 3731 | 46.1 |
| 2001–2011 | 7.23 | 6.02 | 3226 | 39.9 |
Source: our own elaboration on ISTAT data.
Table 2.
Depopulated municipalities by major socio-economic region in inter-census periods (1961–1971, 1971–1981, 1981–1991, 1991–2001, and 2001–2011). Percentage values.
Table 2.
Depopulated municipalities by major socio-economic region in inter-census periods (1961–1971, 1971–1981, 1981–1991, 1991–2001, and 2001–2011). Percentage values.
| Inter-Census Period | Northern Socio-Economic Region | Center Socio-Economic Region | Southern and Island Socio-Economic Region |
|---|---|---|---|
| 1951–1961 | 63.93 | 73.83 | 59.95 |
| 1961–1971 | 57.94 | 73.29 | 75.60 |
| 1971–1981 | 47.61 | 47.29 | 52.25 |
| 1981–1991 | 48.73 | 44.08 | 48.89 |
| 1991–2001 | 35.54 | 42.37 | 66.33 |
| 2001–2011 | 28.00 | 30.32 | 64.65 |
Source: our own elaboration on ISTAT data.
Table 3.
Parameter estimates of different regression models and coefficients of determination (R2). Effects of the variation in population in the previous inter-census period (Var(t − 10,t)) on the proportion of the population over 65 years (P65+(1.1.t)) on 1 January 1961, 1 January 1971, 1 January 1971, 1 January 1991, 1 January 2001, and 1 January 2011.
| Model: Dependent Variable | Explanatory Variables | Coefficient | Sig. |
|---|---|---|---|
| 1: P65+(1.1.1961) | Intercept | 10.73 | *** |
| Var(1951–1961) | 0.07 | *** | |
| R2 = 0.12 | |||
| 2: P65+(1.1.1971) | Intercept | 13.54 | *** |
| Var(1961–1971) | 0.09 | *** | |
| R2 = 0.20 | |||
| 3: P65+(1.1.1981) | Intercept | 16.93 | *** |
| Var(1971–1981) | 0.22 | *** | |
| R2 = 0.36 | |||
| 4: P65+(1.1.1991) | Intercept | 18.58 | *** |
| Var(1981–1991) | 0.23 | *** | |
| R2 = 0.27 | |||
| 5: P65+(1.1.2001) | Intercept | 21.74 | *** |
| Var(1991–2001) | 0.35 | *** | |
| R2 = 0.36 | |||
| 6: P65+(1.1.2011) | Intercept | 24.88 | *** |
| Var(2001–2011) | 0.28 | *** | |
| R2 = 0.34 |
Signif. Codes: 0’***’0.001’**’0.01’*’0.05’.’0.1’’; Source: our own elaboration on ISTAT data.
Table 4.
Parameter estimates of regression model and coefficient of determination (R2). Effects of the variation in population in the previous inter-census periods (Var(t − 10,t)) on the proportion of the population over 65 years (P65+(1.1.2011)) on 1 January 2011.
Table 4.
Parameter estimates of regression model and coefficient of determination (R2). Effects of the variation in population in the previous inter-census periods (Var(t − 10,t)) on the proportion of the population over 65 years (P65+(1.1.2011)) on 1 January 2011.
| Explanatory Variables | Coefficient | Sig. |
|---|---|---|
| Intercept | 24.65 | *** |
| Var(2001–2011) | 0.12 | *** |
| Var(1991–2001) | 0.13 | *** |
| Var(1981–1991) | 0.08 | *** |
| Var(1971–1981) | 0.07 | *** |
| Var(1961–1971) | 0.01 | *** |
| R2 = 0.51 |
Signif. Codes: 0’***’0.001’**’0.01’*’0.05’.’0.1’’; Source: our own elaboration on ISTAT data.
© 2018 by the authors. Licensee MDPI, Basel, Switzerland. This article is an open access article distributed under the terms and conditions of the Creative Commons Attribution (CC BY) license (http://creativecommons.org/licenses/by/4.0/).
Share and Cite
MDPI and ACS Style
Reynaud, C.; Miccoli, S. Depopulation and the Aging Population: The Relationship in Italian Municipalities. Sustainability 2018, 10, 1004. https://doi.org/10.3390/su10041004
AMA Style
Reynaud C, Miccoli S. Depopulation and the Aging Population: The Relationship in Italian Municipalities. Sustainability. 2018; 10(4):1004. https://doi.org/10.3390/su10041004
Chicago/Turabian StyleReynaud, Cecilia, and Sara Miccoli. 2018. "Depopulation and the Aging Population: The Relationship in Italian Municipalities" Sustainability 10, no. 4: 1004. https://doi.org/10.3390/su10041004
Note that from the first issue of 2016, this journal uses article numbers instead of page numbers. See further details here.