1. Introduction
Sustainable companies anticipate the future needs of society [
1] and adjust their business priorities to new needs, making sure they have the resources to continue doing business [
2,
3,
4]. Thus, in the context of corporate social responsibility (CSR) awareness of companies and the growth of activities, questions arise about whether there is an intention for CSR activities, what is the source of financing for these activities and how they influence the performance and value of companies [
5]. Investors are becoming more interested in the social and environmental impact of companies and they want to invest in companies with a good CSR performance [
6,
7,
8,
9].
CSR activities are diverse and include: community investments, philanthropy, marketing campaigns with CSR elements, workplace health and safety activities, employee training courses, company policies for the protection of human rights and the fight against corruption, transparency in the reporting of CSR activities, and environmental protection activities (energy consumption, water, emissions of waste, and amount of waste generated) [
10,
11,
12,
13].
Their measurement is sometimes difficult, so that users of information sometimes have to estimate or equate the information reported by companies, each in its own way, to be brought to a common denominator [
14,
15]. Activities such as donations are equated with community investment and waste management costs are assimilated to environmental protection expenditures. Thus, non-financial reporting plays an increasingly important role and aims to increase transparency and performance [
16,
17], as well as to encourage companies to adopt a more sustainable business strategy [
18].
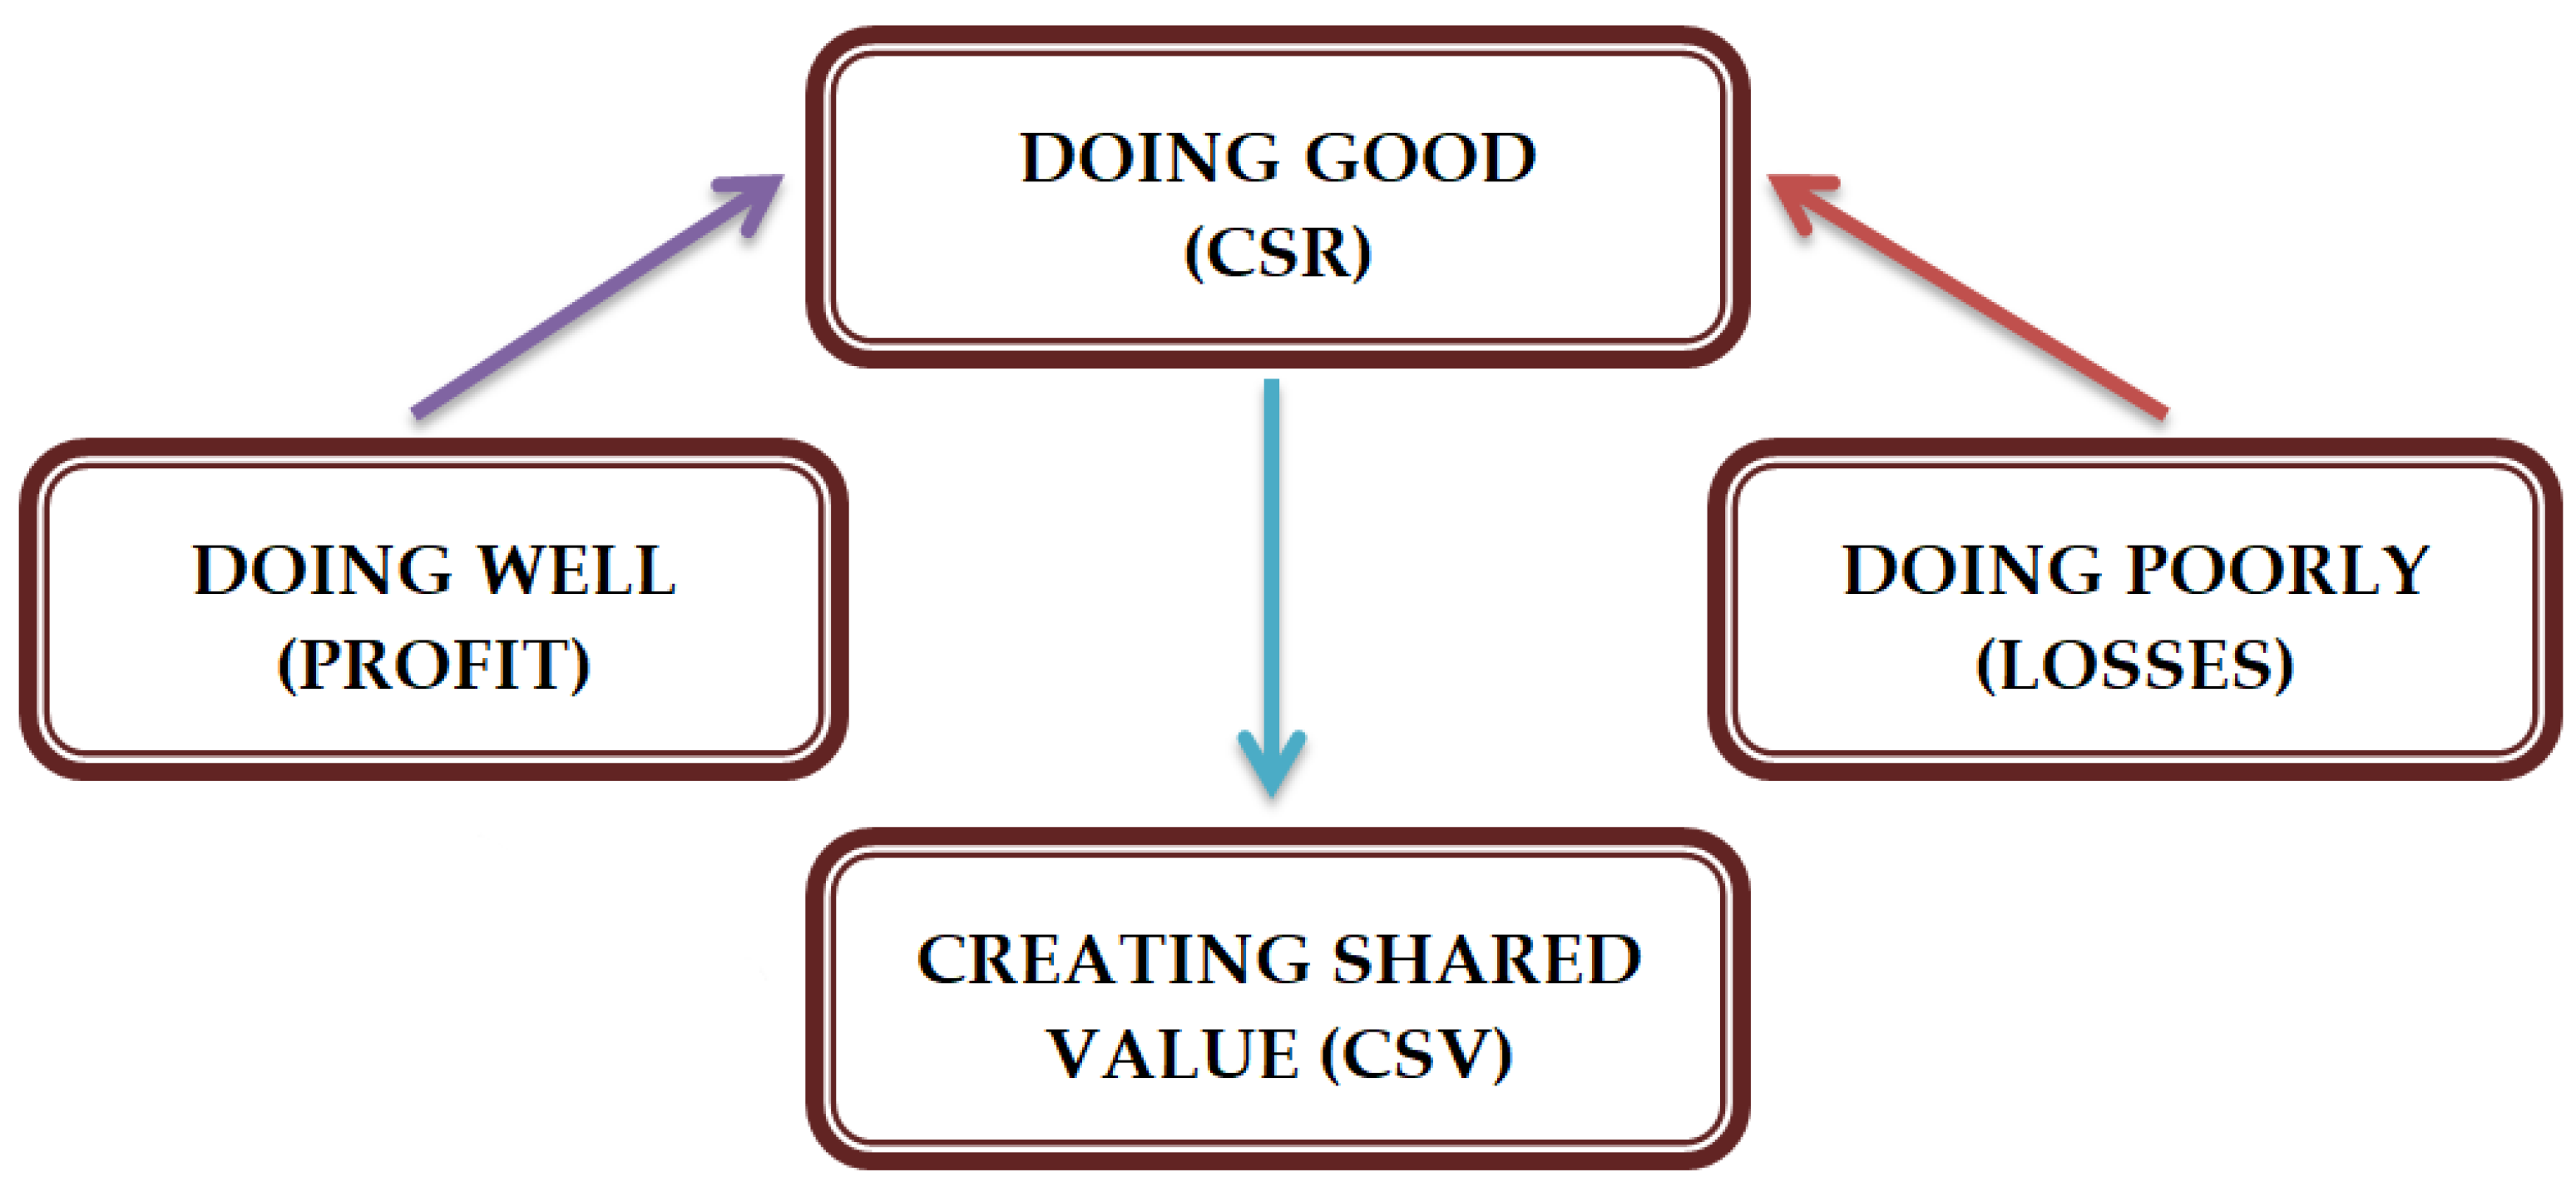
The objective of the paper is to identify how strong the correlation between CSR and profit is, and how companies behave in the periods they have losses: do they continue to do CSR activities, reduce the activities, or give them up? Thus, CSR is attributed to the concept of “doing good” and profit to the expression of “doing well”, from which a “positive business” can be built [
19].
Figure 1 is a graphical representation of the objective of our article, profit and loss influenced the CSR activities, and the fact that CSR leads to the Creating Shared Value (CSV) concept of Porter and Kramer [
9] which is a strategy regarding the positive relationship between company and society, and CSV tends to replace CSR in the future.
To better understand the relationship between CSR activities and the financial performance of the listed companies, we create a theoretical framework regarding the “doing well” and “doing good” concepts, as their connotations are not yet finally settled among researchers. The empirical research considers the information reported by companies in the annual financial statements a d the directors’ reports, such as the sustainability reports of the companies that voluntarily published CSR information.
This paper is organized as follows:
Section 2 contains a short literature review regarding the link between CSR and performance, while
Section 3 presents the research hypotheses and describes the research methodology.
Section 4 presents the main findings of our study and
Section 5 concludes and gives some future research directions.
2. Literature Review
Corporate social responsibility topics have been analyzed by researchers around the world. Fifka [
20] studied whether there are different approaches to empirical research on determinants of responsibility reporting starting from the geographic regions and found that there were different approaches but resulted minor differences. Krisnawati [
21] developed a chronology of theories applicable to CSR, their evolution, the link between them and the current state of knowledge.
Freeman et al. [
22] considered that the interests of the various stakeholder groups are common and that the value creation process is best handled by managing stakeholder relations. Another fundamental aspect of stakeholder theory is to identify stakeholders and how companies interact with them, in other words, which stakeholders matter in decision-making processes, and whether they have an advantage.
Donaldson and Preston [
23] identified two stakeholder groups: one in which management has an obligation or duty and one that affects or is affected by the entity. Their conclusion is that, although management may need to take into account the interests of both groups, only the first group is legitimate enough that management decisions act in its best interests.
Stakeholder theory is closely related to value creation for the entity and the stakeholder. Dumitru et al. [
24] studied the relationship between stakeholder theory and value creation through integrated reporting and found that communication is an important element for value creation, and that there are discrepancies in the content of disclosure reports that address different stakeholder categories (investors, customers, and employees).
For our study, the most relevant is the stakeholder theory [
25] because it could be interpreted as an essential condition for CSR. It combines the wellbeing of the stakeholders with ethical obligations, thus also maximizing the wealth for the society. Another important aspect of this theory is the transparency through the extending of non-financial reporting. It also offers guidance regarding the balance of the stakeholder interests based on sustainability and the necessary management tools for business operation [
26]. An important category of stakeholders is employees and “CSR can have positive effects on employees’ motivation, morale, commitment, and loyalty to the firm” [
27].
In a broader way, CSR represents achieving success in an ethical manner with respect to people, community and environment. If philosopher Aristotle referred to good deeds, later the utilitarians, beginning with Bentham [
28] and Mill [
29], concentrated on this concept in accordance with its effects and consequences, while Kant [
30] had another vision, bringing the ethics of duty into consideration.
In this vision, the attitude of a company to do good has as its goal the long-term economic outcome, where for Kant the intention of an action is important, not its effect, when its ethical and moral value is considered. He referred to the concepts of “necessary or owed duty towards others” and “meritorious duty to others” showing that “the natural end that all beings have is their own happiness”.
The ethical elements applied to the CSR concept are manifested at the individual level by “being a better person” and at the group level refers to the social behavior of the company and the people within it, to “doing well” and “doing good” values.
From all these theoretical positions, results an increasing concern of correlating the company’s well-being with the well-being of society and the environment in which it operates. In this group, the environmental concerns and the integration of companies could be integrated, as well as the way in which the rights and freedoms of the individual are respected as active members of the company’s activities, which also attracts some concepts derived from the theory of law, such as the social contract, universal and constitutional rights and labor law.
From the research done on key words “doing well”, “doing good” and CSR, it was found that several researchers were concerned about defining these concepts in published articles. Most have considered that “doing well” is associated with a profit-generating business [
31], i.e., with being profitable [
32,
33], while “doing good” with CSR. Kotler and Lee [
7] mentioned in their book the practical aspects of CSR and formulated six options for “doing good” and twenty-five best practices for “doing the most good for the company and the cause”.
The two concepts are often used together to capture the attention and understand that it can create a win–win situation [
19]. Laszlo [
34] is the promoter of the responsibility–profitability relationship and asserted that CSR brings value to the company in the long term.
The opposite concept of “doing well” is “doing poorly” [
35] that is equivalent to financial losses from companies, but which can be recovered later through CSR actions. In addition, the opposite of “doing good” is “doing bad” [
36]. These expressions have been assimilated to a new concept, corporate social irresponsibility (CSI), that describes the effect of harmful activities in which a company engages [
37].
From the literature review, over the last twenty years, it was found that there are theoretic, qualitative and quantitative papers that have studied the correlation between the two concepts “doing well” and “doing good”. We selected the most relevant papers in the literature, from Web of Science and other important databases.
From the theoretical point of view, Kittilaksanawong [
38] analyzed the conceptual framework of CSR to identify long-term social objectives in line with stakeholders’ expectations and proposed new CSR strategies and pointed out that the practical implementation of CSR involves costs but should be considered as long-term investment. Kreps and Monin [
31] studied cases of inconsistency between private and public moralization, identified some of the precursors of moral consciousness, analyzed the expected positive or negative consequences and highlighted the reasons why corporative actors show ambivalence in their public statements, exposing moral frameworks and appreciating psychological complexity and multiple factors influencing moral decision.
Falk and Heblich [
39] advocated the idea that CSR is a “win–win strategy”, showed the evolution of CSR over time and argued for the planning process and the strategy of the CSR activities, as a requirement to meet the stakeholders’ needs. Varadarajan and Kaul [
40] proposed elements of innovation of the relationship through “alleviating negative environmental impacts and social impacts of value chain activities”.
Rojas et al. [
41] highlighted that “the stakeholder approach may benefit from a number of theoretical tools developed in the fields of organizational economics, business strategy and finance”. Sneirson [
42] analyzed the arguments behind the stakeholder theory and identified the following common justification: subsidies (grants) received by corporations from the state, the size and economy of corporations, the economic effect of their activities, the separation of shareholders from the control activity, and managerial discretion.
Based on the analyzed studies, Aspelund et al. [
43] found that the stakeholder theory was frequently invoked and “the international firms engage in CSR activities in order to satisfy external stakeholders, rather than a deeply held commitment to ‘do good’”. He supports more the idea of firmly adhering to the company’s ethical code, without accepting influences from the host country, which may sometimes interfere with the company’s behavior and decisions, as well as with the social rigors of the location, especially those who have a transnational positioning and are trying to adapt to local conditions and requirements.
The conclusion of most theoretic articles showed a positive relationship between “doing well” and “doing good”, but this relationship could change under an inefficient market [
44]. The opinion expressed by Karnani [
44] was contradicted by Rivoli and Waddock [
45] who claimed that CSR is not “an illusion, but an integral part of human progress”.
In the qualitative research, on the analyzed topic, the authors used as methods: the review of the sustainability reports, experimental studies and case studies.
Sherman [
46] analyzed the sustainability reports and provided an overview of the Triple Bottom Line (TPL) concept and the way it changes how corporations report their CSR activities. He concluded that there is a need for TBL reports to provide relevant, comparable, and externally verified information about an organization to assess its relative economic, environmental and social performance.
Popowska and Ratkowska [
47], based on the analysis of the sustainability reports of 13 multinational companies from products sector, proposed a definition and presented a method of analyzing corporate global commitment to the CSR approach, provided insight into how companies can create value for different stakeholder group and showed that businesses are aware of the needs and expectations of different stakeholders and know how to fulfill them.
In experimental studies, Chernev and Blair [
48] demonstrated that social goodwill can change the consumers’ perceptions of the products of companies that are involved in social activities and are perceived to have better performances, so “doing good can really translate into a doing well”. In another experimental study, Wilson, et al. [
49] summarized the design principles for ensuring a socially responsible product and their impact on the world as a whole by minimizing the negative environmental impact.
Looser and Wehrmeyer [
50] studied, through a qualitative analysis of a focus group of managers from multinational companies and from small and medium companies (SMEs) from Switzerland, the behavior regarding CSR, the differences in motives for CSR between large companies (LC) and SMEs and “concluded that “doing good” matters more for some than “doing well”, but those who do good do not necessarily care whether they do well by doing good”.
The studied qualitative research highlighted a strong relationship between CSR and performance and the companies must be more socially responsible for a better reputation and to meet the need of the stakeholders.
Table 1 summarizes the quantitative research about “doing well” expressed by corporate financial performance and “doing good” expressed by several indicators of CSR, together or separately, within the main hypotheses formulated, the sample and the period of investigations, the methods, the dependent variable (DV) and independent variables (IV), and also the results that were obtained. The criterion that led to the inclusion of articles in
Table 1 is their objective to study the relationship between financial performance and CSR, expressed in different ways and through various indicators. From the literature analysis, articles that used the expressions “doing well” and “doing good” only as metaphorical forms without meeting the mentioned criteria are excluded.
The relationship between CSR and profit has been the focus of research for nearly fifty years, so Margolis et al. [
62,
63] made a chronology of empirical research in this field. The summary presented in
Table 1 and the other empirical research [
64,
65] show that the relationship between them has been studied in both directions, both as dependent variables and as independent variables. In most cases, CSR was the independent variable, and the corporate financial performance (CFP) as a dependent variable. The results of Margolis et al. studies showed a positive effect, but small. The relationship was stronger for charitable contributions and weaker for corporate policies and transparency. Their conclusion was that the link between CSR and CFP remains an open research topic. Hamilton et al. [
66] investigated the relation between the returns of socially responsible portfolios and conventional portfolios. They found no significant relationship: social responsibility factors have no effects on expected stock return or companies’ cost of capital.
Of the papers presented in
Table 1, some authors considered stakeholder theory in their research. Fisman et al. [
52] asked the question “Is there a conflict between maximizing shareholder value and maximizing stakeholder or social value?” and concluded that CSR activity is compatible with the framework of “doing well by doing good”. Lee et al. [
59] found neutrality between CSR and financial performance. They considered their results are in accordance with stakeholder theory, because the investments in CSR, even if they are useful and effective, do not guarantee the improvement of performance in the short term. Price and Sun [
36] mentioned that the ability of managers to get involved in CSR needs to be assessed by considering the costs and benefits of companies as they bring detriment to stakeholders.
The analyzed articles show that there are different ways to explore the CSR–Performance relationship. The most important aspects of the selected studies referred to the operationalization of CSR and performance and also to the method chosen to investigate a possible relationship. In the analyzed empirical studies, the sample used referred to large companies, listed in stock exchanges and the listed period was at least two years.
Studies provided evidence for the suitability of Q Tobin and ROA indicators to measure the financial performance. Indicators used to measure CSR vary from one study to another because of the chosen sample and the research hypotheses defined by the authors, but also because of the complexity of CSR activities, so the most common variable is an index of CSR from well-known databases or created by authors.
We agree with the use of Q Tobin and ROA as indicators of financial performance, but with the condition that the company register profit, otherwise these indicators become less significant. We also consider that the most appropriate indicators of CSR measurement are indices tested in many sustainability reports (Global Reporting Initiative (GRI), KLD, and ESG) over a long period of time, because an index created by authors can be less accurate but it can be used in situations in which the standard index is not applied. CSR indicators can also be expressed by the value of spending on CSR actions, one of the most used indicators being corporate philanthropy [
60] or corporate giving.
In the reviewed articles, authors showed the conceptual features of “doing well” and “doing good” and the relationship between them. In
Table 1 aims at highlighting their contribution to research on CSR topics.
The aforementioned economic literature helped us in the empirical research to decide the nature of the collected data, the indicators considered to formulate the research hypotheses and to interpret the results obtained.
3. Materials and Methods
3.1. Sample
CSR activities of listed companies are officially assessed by independent institutions. Thus, the key assessments are based on the United Nations Sustainable Development Goals, EU 2014/95/EU, Global Reporting Initiative and the Dow Jones Sustainability Index. Companies listed on the Bucharest Stock Exchange (BSE) have not been included in the above-mentioned ratings. However, a private CSR agency [
67] conducted the Romania CSR Index 2017 study, which evaluated 100 of the largest companies in Romania, using a set of 43 indicators. The survey found that companies’ level of interest in CSR is increasing and many companies continue to focus on community involvement, as well as investments in facilities that help to increase energy efficiency or use renewable energy.
The companies listed on the stock exchange represent an important segment in any economy, and the way in which companies manage their business, reflected in the obtained results, represents an important factor in establishing the transaction cost and the number of transactions. From the research on the relationship between profit and CSR, in the case of companies listed on BSE, it resulted a significant influence of the environmental information on the global performance of the Romanian listed companies [
68] and also the impact of CSR on company values [
69]. Feleaga et al. [
70] studied the importance of CSR and corporate governance and identified some differences between countries.
Lungu et al. [
71] realized an archival analysis related to the Romanian researchers’ concerns about CSR and found that they have studied the impact of CSR on stakeholders and financial performance and found positive [
72] and negative correlations [
73]. In addition, Dumitru et al. [
74] carried out a comparative analysis of the state of the reporting practices of non-financial information between the companies in Romania and Poland before applying the European Directive 2014/95/EU and found that “Poland experienced a higher extent of voluntary reporting, but Romania faced prior regulatory demands for non-financial reporting”.
To emphasize the relationship between corporate social responsibility and profit. This study considered the companies listed at BSE, excluding all financial institutions (due to their field of activity), those that are suspended or lack data, and those that are not listed throughout the studied period (2011–2016). Thus, 53 companies were used in the model.
3.2. Measures
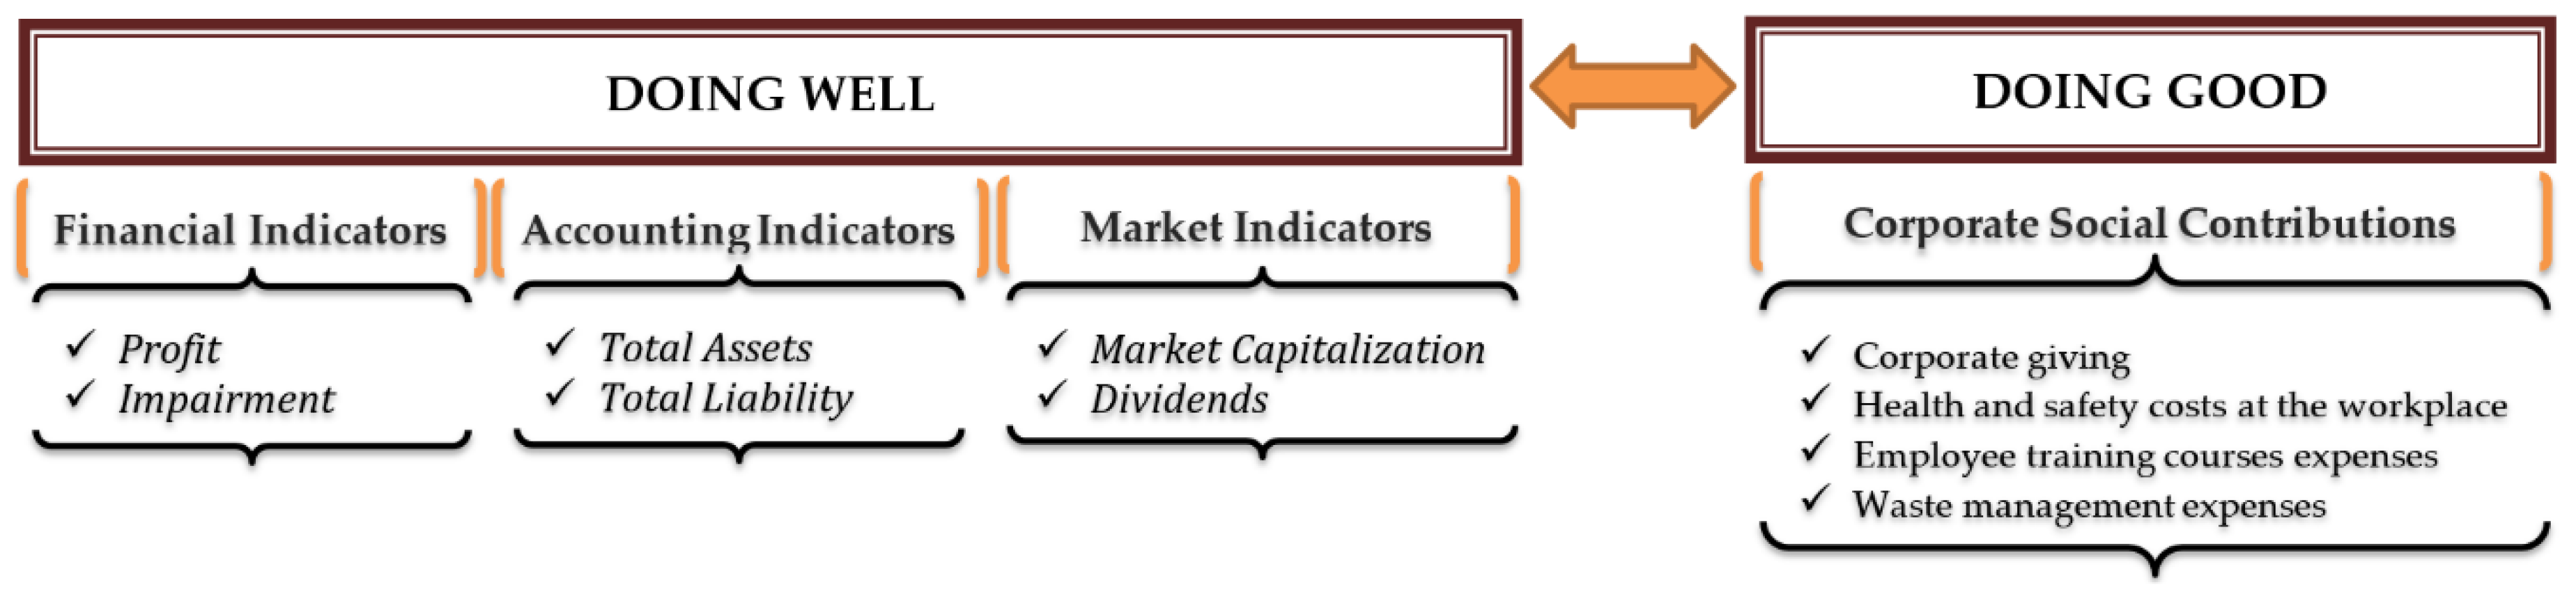
The indicators that express profitability are based on accounting data and information provided by the financial market (
Figure 2). For each of them, financial data regarding the values of profit, turnover, total impairment, total assets, total liabilities, number of shares and their market price at 31 December were manually collected from the Bucharest Stock Exchange and each company’s website.
From all of the CSR indicators identified in the literature review, we found in the reports of listed companies, information on four activities (
Figure 2), namely corporate giving, health and safety costs at the workplace [
11,
58,
75], employee training courses expenses [
27,
58,
75] and waste management expenses [
56,
67,
68], but without complete information on the amounts spent. The only category of expenses for which we found the amounts spent was corporate giving, which was measured as percent of turnover [
59,
76,
77].
Our dependent variables, CSR and profit, both as dummy variables, were also independent variables in some models to test the reciprocity of the correlation, to highlight which one has a bigger influence over the other. A dummy variable was chosen to express the profit because we could not calculate the profitability indicators ratios because some companies registered losses. CSR is a multidimensional construct [
78] but we chose corporate giving to measure it because it was the only information available in the annual reports of the analyzed companies.
The following indicators are control variables included in the analysis, to control the reliability of the model and reduce the risk of biases. The size of the profit depends on the turnover [
79] and by analyzing the accounting policies of the companies, this indicator is one of the hardest to manipulate by a company’s management, which means that there is a high degree of certainty for the value of this indicator. Another indicator that influences the profitability and value of companies is assets impairment which negatively influences the stock price, as this affects the future financial performance [
80].
Distributed dividends were considered a market indicator because it is a form of communication with the shareholders of the well-being of the companies [
81]. Thus, a dummy variable, dividend, was created, which takes the value 1 if the companies distributed the dividends and 0 if not. Market capitalization is an indicator that influences economic growth [
82] and is used in another studies as control variable for size of the firms [
83,
84], the same as assets [
85].
The model also included a dummy variable, ownership, that takes value 1 if the company has a majority private shareholder and 0 if the majority of shareholders are state-owned. Size is another dummy variable that takes value 1 if the company is a large company and 0 if the company is a small and medium enterprise (SME).
The first phase of the empirical study is observing the variables dynamics using descriptive statistics and checking for stationarity using Harris–Tzavalis test. All of the testing and estimation was carried out using Stata Statistical Software: Release 13 (StataCorp LP, College Station, TX, USA).
Based on the literature review, three research hypotheses were formulated and tested.
Hypotheses 1 (H1). There is a significant correlation between “doing good” and “doing well”
To validate this hypothesis, the paper sought to assess the statistical significance of “doing well”, expressed by accounting and market indicators, over the “doing good”, expressed by corporate social contributions (as dummy) and by corporate giving (as percent of Turnover), for the listed companies, using a panel data econometric model containing 318 observations of 53 companies for a period of six years.
The research was done from two perspectives: in the first one, the impact of “doing well” over the “doing good” was tested and, in the second one, the influence of “doing good” over the “doing well” was tested.
For the first perspective, the following econometric model was applied in two situations: first, when CSR was a dummy variable (if the company had at least one of the four CSR indicators mentioned above it took the value 1, if not, 0), it used a logistic regression to analyze the decision to make CSR; and, second, we took into account just one of the CSR indicators, corporate giving (CG, expressed as percent of Turnover) as the dependent variable and used a multivariate linear regression:
where
αi represents the unknown intercept of every company,
β1–8 are the coefficients of each explanatory variable,
εit is the error term,
i = 1–53 companies and
t represents the years analyzed (2011–2016).
For the logistic regression, the fitting of the model was tested using Pearson and Hosmer–Lemeshow goodness-of-fit tests. We verified whether the model is correctly specified with the Specification link test and, after that, a collinearity diagnostic was performed.
For the multivariate regression, the variance inflation factor (VIF) was calculated for the independent variables to test for multicollinearity, we checked for homoscedasticity with the Modified Wald test and for cross-sectional dependence using Pesaran CD test. In addition, the Wooldridge test was used to verify if there is a first-order autocorrelation in the panel data. After all tests were performed, we decided to use a feasible generalized least squares (FGLS) regression.
To validate the second perspective, the paper sought to assess if there is a reverse correlation between the concepts: whether “doing good”, more exactly, the existence of CSR, influenced “doing well” for all the companies. A logistic regression was used because the dependent variable, profit, was a dummy, testing the following model:
The studied articles referred to the companies that register profit and showed its correlation with CSR, thus we decided to do the same and formulated our second hypothesis.
Hypotheses 2 (H2). Companies are “doing good” while “doing well”
In this situation, only the companies that were doing well (registered profit) in all the studied period were analyzed and whether the size of “doing well” had a significant impact on the amount of “doing good” (expressed by the indicator corporate giving as percent of turnover) was tested. The same multivariate regression model (Equation (1)) was used for a panel data containing 30 companies for a period of six years, resulting in 180 observations.
Continuing the line of thought, we wanted to emphasize the behavior of the companies in the years they register losses with regard to the CSR activities, thus the third hypothesis was formulated.
Hypotheses 3 (H3). Companies are “doing good” while “doing poorly”
For this hypothesis, we analyzed the companies that were doing poorly (registered losses) in the studied period and tested if this situation affected the decision to “do good”. There were 23 companies that registered losses in at least one year. To validate it, a pairwise correlation between the two main indicators of “doing good” and “doing well” for the situations that met the criterion of “doing poorly” in the studied period was performed.
4. Results and Discussion
The empirical research began with descriptive statistics of all the analyzed indicators and testing for unit root using Harris–Tzavalis test for stationarity. It was validated for the variables that were included in the model (all the indicators that were expressed in RON (the EURO/RON exchange rate fluctuated from 4.3 to 4.5 between 2011 and 2016) were converted into natural logarithms) at 5% level of confidence (the results are presented in
Table 2).
We obtained that, on average, 76% were “doing good” (had CSR activities) and the amount of corporate giving varied from 0% to 1.72% of their turnover.
Regarding the accounting indicators, in our group, 81% were “doing well” (registered profit), the biggest value being 4.83 billion RON and the biggest loss was 1.07 billion RON. On average, the impairment was 77.29 million RON, varying from 0.15 million RON to 5.68 billion RON. Total assets of the companies were, on average 1.28 billion RON, the smallest amount was 11.48 million RON and the biggest 43.17 billion RON. Liabilities were 326 million RON on average with a maximum of 6.96 billion RON and the minimum of 0.92 million RON.
The market indicators show us that, on average, the market capitalization was 606.1 million RON, reaching the highest value of 26.61 billion RON and the lowest value of 14.31 million RON. In addition, 47% distributed dividend in the studied period.
In our group, there are 43% large companies and 88% from all the companies have a majority of private shareholders.
The correlations between all the variables are presented in
Table 3. One of our dependent variables, CSR (as dummy), was positively correlated with all the indicators, except for the ownership and the biggest correlation was with profit (as dummy) of 0.5119. If we consider corporate giving (as percent of turnover), it is also positively correlated with all of the indicators, except for liabilities (−0.1052) and the strongest correlation is with profit (as dummy), 0.23, and with dividends (0.26). The strongest direct correlation of the profit (as dummy) is with dividends (0.45) and a negative one with ownership (−0.17).
The fitting of the model was tested, with all the independent variables, using Pearson and Hosmer–Lemeshow goodness-of-fit tests from which we obtained a chi2(310) of 240.92 with a P-value of 0.9941 indicating that the null hypothesis should be accepted. Our model was specified correctly because the Specification link test resulted a LR chi2(2) of 134.79 with p-value 0.000, Pseudo R-squared of 0.3880 and the prediction squared does not have an explanatory power, validating that the model is correctly specified. Furthermore, the collinearity diagnostics revealed a mean VIF of 6.19 smaller than 7, which means there was no multicollinearity issues and all regressions are statistically significant because the values obtained for Wald chi2 were bigger than the threshold at 1% level of confidence.
The results of the logistic regression (
Table 4) show that the most important indicator that influenced the decision to “do good” (have CSR activities) is to “do well” (have profit), between those two indicators there is a positive relation, similar to other studies for Romanian listed companies [
72,
75]. The odds of doing CSR for the companies with profit are 8.31 times greater than the odds of the companies which registered losses. If we took out of the model the variables that were not validated (impairment, liabilities, dividends and ownership), the odds increased to 9.24.
The econometric analysis was continued with an OLS regression to test for multicollinearity and obtained a mean VIF of 6.67. To decide what type of regression should be used, the Hausman test was applied and obtained that chi2(4) was 12.91 with a p-value of 0.0445 leading us to accept the alternative hypothesis. We performed a regression with fixed effects and tested for homoscedasticity with the Modified Wald test, obtaining a chi2(53) of 82 with a p-value of 0.000, thus rejecting the null hypothesis. To check for cross-sectional dependence of the residuals Pesaran CD test was used and accepted the null hypothesis of independence (the p-value was 0.6692). Finally, the existence of first-order autocorrelation in our panel data was verified using Wooldridge test and obtained an F (1,52) of 5.380 with a p-value of 0.0243, leading us to reject the null hypothesis of no first-order autocorrelation.
In accordance with the results obtained from the aforementioned tests, the most appropriate model is a cross-sectional linear panel-data model, using feasible generalized least squares (FGLS). This allows estimation in the presence of autocorrelation, with independent residuals and heteroscedasticity. In addition, iterated GLS estimator was used instead of two-step GLS estimator.
In
Table 5, it can be observed that all regressions are statistically significant; the values obtained for Wald chi2 were bigger than the threshold at 1% level of confidence. Performing the regression using all the indicators resulted that if the companies are “doing well” (have profit) it could increase the value of corporate giving by 0.03% of the turnover. We tested again the model, eliminating the market indicators and keeping only the accounting ones and the explaining power of the profit increased to 0.05. After that was excluded from the model the accounting indicators leaving only the market indicators and the non-financial ones. In this case, the fact that the companies distributed dividends, which could also be considered a “doing well” situation, had the biggest influence on corporate giving, leading to an increase of 0.04%.
Another analysis was made to investigate if “doing good” (if the companies had CSR activities) had an influence on the “doing well” (recording profit) for all the companies. From the logistic regression a high relation between them was obtain (
Table 6). The odds of recording profit for the companies that had CSR activities are 14.48 times greater than the odds of the companies that did not have CSR. Our result is similar to the one obtained by Skare and Golja who found that “a CSR corporation is 6 times more likely to have better financial performance than a non-CSR corporation” [
86].
To validate the second hypothesis, we tested if the values of the profits have had a significant influence on the values of the corporate giving (as percent of turnover).
The amount of corporate giving (as percent of turnover) is not influenced by the size of the profit (
Table 7) because the independent variable profit was not validated. The results showed that market capitalization influenced the most the amount of corporate giving. If market capitalization increased by 1%, the CG could increase by 0.6%. In addition, if the companies distributed dividends, the value of corporate giving could increase by 0.2%. Therefore, the concept of creating share value by Kramer and Porter [
9] is confirmed: the goal of a company is to create value and not just profit, and, to maximize this value, managers should make decisions on the long term, for all stakeholders [
87]. Overall, the second hypothesis is validated: companies are “doing good” when they “doing well”.
For the third hypothesis, we considered only the companies that did not have profit in all years. In our group, there are 23 companies that registered losses in at least one year; two had losses in all six years; five in four years; and 16 in fewer than three years, leading to 62 observations. Of these, seven are large companies and 16 SMEs, and all 23 have a majority of private shareholders.
A pairwise correlation between the two main indicators studied in this paper, “doing good” (the situation in which the companies had CSR activities) and “doing poorly” (the situation in which the companies registered losses), for 62 observations that met this criterion, was performed. The results presented in
Table 8 showed that, in 33% of the situations, the firms that registered losses continued to have social contributions, because in the long run these actions could generate profit, thus partially validating our hypothesis that the companies were “doing good” even while they are “doing poorly”.
CSR activities are provided in the annual budget based on the financial results of the previous year, so the profit of the current year may also be influenced by external factors, such as market conjuncture, commodity prices and economic crises.
Analyzing the particularities of each company, we observed that large companies, the ones that are subsidiaries of multinational enterprises, are more involved in CSR activities even when they record losses, as these actions are demanded by the policies of the parent entity which controls them [
88]. This result is corroborated with the finding of the study by Looser [
50] on the case of companies from Switzerland, from which large companies have come to understand that “ethics pays”. In addition, Burke and Logsdon [
89] considered that CSR “pays off” for organizations as well as for stakeholders and leads to value creation.
Thus, it can be said that there is a close link between “doing well” and “doing good” because companies that made profit had CSR activities, which also led to a positive relationship of CSR with market capitalization and implicit value creation of the company. Thus, due to the CSR activities made, the stakeholder acknowledged the value of the companies by increasing the market capitalization.
One-third of the companies that experienced losses during the analyzed period are aware of the need to fulfill a “duty to others” [
30] and have incurred social expenses, which may implicitly lead to increased reputation and recognition of interest for the needs of the stakeholders.
Our results are consistent with stakeholder theory because the analyzed companies were involved in CSR in a proportion of 76%, which is the answer to the question that we asked at the beginning of our study. The largest impediment is that the companies did not publish the information very explicitly; they were not found in a single report; and they had to be collected from various sources and compiled to have the overall picture of each CSR company. In addition, by engaging in CSR, the studied companies have demonstrated that they have applied the principles of business ethics, but we still believe that the CSR strategy and policies need to be improved, including an improvement in the communication with the stakeholder [
90]. To accomplish this mission, we consider it necessary to report in detail all elements that explicitly reflect the actions they are involved in. For this reason, we will leave open future research to analyze whether new reports that will be published are able to provide the complete and real information necessary to stakeholders as required by the European Directive 2014/95/EU which became effective in Romania at the beginning of 2017.
5. Conclusions
The present paper aims at identifying how significant the correlation between CSR and profit is, and how companies behave in periods they have losses, whether they continue to do CSR activities, reduce the activities or give them up [
91]. This idea was not of interest for many researches since the listed companies on other stock exchange had a high performance, and was found in only few studies about the companies that have negative financial performance [
92].
The first hypothesis is validated by analyzing it from two points of view: in the first one the impact of “doing well” over the “doing good” was tested and in the second one the influence of “doing good” over the “doing well” was tested.
The results for the first perspective show that the odds of doing CSR for the listed companies with profit are 8.31 times greater than the odds of the companies which registered losses; in addition, it could increase the value of corporate giving by 0.03% of turnover. In addition, if companies distributed dividends, which could also be considered a “doing well” situation, it could lead to an increase of corporate giving of 0.04% of turnover. The second perspective analyzes the odds of recording profit for the companies that had CSR, resulting they are 14.48 times greater than the odds of companies that did not have CSR activities. The significant positive correlation between corporate giving and performance is in accordance with the results of other studies on CSR [
93,
94].
For the next hypothesis, we obtained that the amount of corporate giving (as percent of turnover) is not influenced by the size of the profit, but if the companies distributed dividends, the value of corporate giving could increase by 0.2% of turnover. In conclusion, we can say that the companies are “doing good” when are they are “doing well”. The results concord with the conclusions of Margolis [
63] and other researchers [
60,
80].
The third hypothesis is validated by obtaining that, 33% of the time, firms that are “doing poorly” continued to have CSR activities, to “do good”. Muirhead et al. [
91] also observed that companies that are not doing well financially are involved in CSR activities with the motivation that CSR will be pay off.
This paper contributes to the literature by providing a review of the “doing good” and “doing well” concepts, separately on qualitative and quantitative methods. This could be useful to the other researchers to better understand the concepts and to formulate their research hypotheses. In addition, knowledge of CSR strategies is important for all the stakeholders. The empirical results of this research demonstrated that there is a relationship between “doing well” and “doing good” using logistic and contemporaneous econometric analysis of the panel data [
55] and the originality consists also on the analysis of CSR activities for the companies that registered losses.
Empirical research contributes to generating academic knowledge about topics of CSR, our findings complete the existing research in this field. We believe the CSR–profit relationship is still an unresolved puzzle [
54] and remains a research topic which can be improved by new theories and models [
21].
In the last years, the international trend towards adopting a CSR strategy is followed by local companies in Romania, which are in the process of improving their medium-term strategies regarding community involvement [
95]. CSR is a key concept for sustainability and managers should understand that reporting the activities bring benefits to the stakeholders and to the company. The reporting should not be limited to mandatory requirement without disclosing detailed additional information. Our paper has some limitations regarding the data relating to characteristics of the sustainability reports for the listed companies and the fact that there is no standardized model [
89] to be followed by all of them, as was noted by Sherman [
46] who said that the reports must be relevant and comparable. In addition, for the SMEs, the stakeholders need more information so that they can play a useful part in decision making [
96].
In the last years, the investment in socially responsible companies has grown substantially in Europe. Under the influence of the economic policies defined by the European Commission over these years, many companies quoted on European stock markets consider it advantageous to publish sustainability reports, thus providing that information to their financial stakeholders. The implementation of Directive 2014/95/EU will contribute to providing more consistent and comprehensive data to improve research in the field of CSR for EU countries [
97,
98,
99,
100,
101]. If CSR activities are considered investments, the question of their evaluation and recognition as assets and their impairment testing is another topic of debate for researchers.
A future research direction refers to a regional comparative analysis with other European countries building a macro-structural indicator similar to the one from the study of Schwan [
102]. Our results can help policy makers adopt necessary regulatory reform to improve the CSR practices and enhance organizational legitimacy. Continued research on these lines ensures the factors that take strategic decisions in the companies the opportunity to give them a significant competitive advantage in the current competitive environment, and for the investors the attitude towards risk [
103,
104].

 ,
, 


