Article

The Use of a Decision Support System for Sustainable Urbanization and Thermal Comfort in Adaptation to Climate Change Actions—The Case of the Wrocław Larger Urban Zone (Poland)

Department of Spatial Economy, Faculty of Environmental Engineering and Geodesy, Wrocław University of Environmental and Life Sciences, ul. Grunwaldzka 55, 50-357 Wrocław, Poland
Sustainability 2018, 10(4), 1083; https://doi.org/10.3390/su10041083
Submission received: 14 March 2018 / Revised: 2 April 2018 / Accepted: 4 April 2018 / Published: 4 April 2018

Abstract

:
The increasing level of antropopression has a negative impact on environmental resources and has reached the level of our planetary boundaries. One limitation is land use change caused by urbanization. Global policies prove the need to undertake action in order to develop more sustainable human settlements, which would be adapted better to potential future climate change effects. Among such changes are the increase of average temperatures and extreme events like heat waves. Those changes are more severe in urban areas due to land use development, and result in the urban heat island effect (UHI), which has a negative impact on the thermal comfort of citizens. The paper presents a decision support system that can be used for the assessment of areas to the potential exposure to the UHI effect. The system integrates scenario analysis, land use modelling in cellular automata (Metronamica), and an indicator-based assessment in a geographic information system (ArcGIS). The applicability of the model is illustrated through developing scenarios for the future land use allocation of the Wrocław Larger Urban Zone (Poland). The results of the calculations show which scenario is the least vulnerable to UHI effects. Moreover, for each scenario, cores of urban areas were identified, in which certain urban design patterns accounting for adaptation to climate change could be implemented. The study provides a guideline for local authorities on where to focus actions in order to create more sustainable urban structures and to better adapt to climate change and environmental extremes.

1. Introduction

The problem of climate change and the need to define environmental restrictions for human activity was already raised in the early 1970s by the Club of Rome. Their report from 1972 broadly describes the issues of the use of non-renewable natural resources and environmental pollution, as well as the necessity to define boundaries to growth and the state of balance for future development. These issues are still valid today, as evidenced by the Report for the Club of Rome to commemorate the 40th Anniversary of “The Limits to Growth”. The vision of development included in the report refers to the horizon of the year 2052. According to the current view, many factors influence the condition of the environment, including both direct factors affecting natural resources or the climate, as well as a number of indirect factors that affect the whole environment. These indirect factors include, inter alia: emissions to the environment, consumption, inequalities and social tensions, energy consumption, life expectancy and fertility, and population and lifestyle. We can measure many of these aspects effectively [1,2,3,4], which is necessary for the effective management of available resources. Therefore, when assessing the state of the environment, the elements related to the environment should also be considered. The report noted that the basis for these changes in the next years will consist of two basic factors: urbanization and healthcare services [5]. The concept of including developmental limitations is being developed by many scientists under the name of ‘planetary boundaries’ [6,7,8,9]. One of the limitations is the change in land use. Researchers estimate that the threshold of this component has not yet been reached [10], although it is already near to the estimated limit (Figure 1). Therefore, there is an urgent need to limit current the consumption patterns of spatial resources and for a rational use of the areas that are subject to the processes of urbanization.
However, changing the functioning model of local communities on a global scale requires theories and concepts that are supported by real actions overseen by the governments of all countries in the world. In order to reach it, in 1992 the United Nations Earth Summit in Rio de Janeiro adopted the United Nations Framework Convention on Climate Change [11], defining the assumptions of international cooperation to limit global warming. Since 1995, annual Conferences of the Parties (COP) of the UNFCCC have been organized. The COP is the highest UNFCCC body responsible for the overview of the implementation of UNFCCC provisions. One of the best-known COP effects was the Kyoto Protocol (COP 3 in 1997) and the Paris Agreement (COP 21 in 2015). In 2015, over 150 countries agreed also on 17 ambitious Sustainable Development Goals, which are included in the 2030 Agenda for Sustainable Development [12]. These goals concern sustainable cities and communities, responsible consumption and production, health and well-being, as well as climate actions. In the Agenda, the importance of interactions between individual goals was emphasized, and attention was paid to the phenomenon of synergy between the implemented activities. Taking into account the aforementioned planetary boundaries that are related to changes in land use, one of the actions in this matter is the Sustainable Urbanization Strategy adopted in 2016—the UNDP’s support for sustainable, inclusive and resilient cities in the developing world [13].
Due to rapid urbanization, new development is very often located on hazard-prone sites, including river banks and flood plains, which increases the exposure and vulnerability to climate and disaster risk [13]. This vulnerability to climate and disaster risk is also driven by socio-economic variables, which include poverty [14], access to social safety nets [15], and other inequities [16]. Therefore, the Sustainable Urbanization Strategy highlights that cities should institute effective planning and administrative systems to avoid the continued development in inappropriate locations [13]. In the case of some countries, there are statutory land development and allocation procedures in the context of sustainable urban renewal [17]. Unfortunately, legal regulations are not available in all countries to effectively support sustainable development [18]. However, even without such regulations, local governments should strictly control the scale of land use and limit the disorderly expansion of urban boundaries to make the cities grow smartly [19]. It is predicted that further investments and efforts will be directed towards adaptation interventions, which will essentially translate into new investments in infrastructure designed to relocate vulnerable populations and activities into safer locations [20]. As urban development is driven by a large variety of factors [21], there is no single appropriate solution. Therefore, different approaches that are based on scenario analysis and indicator-based impact assessment are often used in land use modelling [22,23]. Land use modelling can be based on the use of descriptive methods, such as stock-flow diagrams [24], or mathematical relations that can be presented in formulas [25], which are categorized as spatial econometric methods [26,27,28]. In case of the use of spatial econometric methods, it is possible to incorporate decision support systems to optimize problems, which refer to geographical dimensions [29]. The use of spatial decision support systems should always be based on the spatiotemporal analysis of land use change, which is a common field of academic research [30,31,32]. Based on those analyses, one is able to determine urban growth patterns [33]. This is crucial to predict potential future changes, and to incorporate decision support systems in environmental management [34]. As decision support systems are not independent systems and they are used by decision-makers, there is a need for these technological solutions to be supported by a methodological framework [35] that describes how such systems can be used by people. Or, in other words, what kind of information do they provide?
The use of projections of the future state of decision support systems can successfully integrate drivers of climate and land use changes and enable their impact assessment [36]. One of the most common relations between land development and climate issues in the urban heat island (UHI) effect. Although the UHI phenomenon was first documented over a century ago, the effect of the UHI on the urban climate and environment has only been the focus of research for the last three decades [37]. As one of the key causes of the UHI is urbanization, urban sprawl, and population increase [38], there is a need to include it as a potential effect of urban development during the planning process. The UHI interacts in different scales, from the human body to city size [39] and therefore its impact should be analyzed using a more complex approach. Due to the spatial and temporal distribution of UHI the range of temperature increase can vary from 2 °C to over 7 °C [40]. In order to better understand the real impact of UHI it is crucial to highlight how big an impact it has on thermal comfort [41]. It is assumed that due to the August 2003 heatwave the additional death toll exceeded 70,000 people in Europe [42]. Obviously, a heatwave presents a different mechanism, as it refers to a temporal, quick and significant increase in temperature. The UHI does not share the same rapid and dynamic changes, however, it does have an influence upon increases in the usage of heating and cooling systems [38,43,44,45]. The UHI modelling is a complex matter due to the multi-factor characteristics of the phenomenon [46]. In case of already developed areas, it is possible to include drivers such as the location of each building and the heights and shapes of all objects in the assessment [47]. Still, researchers interpret the results with reserve. Assessing the potential impact of future developments is far less accurate, however, this challenge should be taken up in the planning of sustainable urban structures. There are some insights from studies that might be useful for this purpose. Firstly, the UHI is not related to administrative borders and it may spread to the surrounding areas [48]. Secondly, a very important aspect of the spatial structure is the location of bodies of water, which help to transport fresh air [49]. Moreover, the UHI can be reduced also thanks to green infrastructures, as the cooling effect of a park extends far beyond its boundaries [50]. Finally, thermal stress may vary according to conditions in the urban structure within a distance shorter than 1 km [51]. The three drivers presented above do not support sufficient information to model the UHI in detail, but they might be helpful in decision support systems to identify areas that are at a higher risk of the UHI. As a result, people living in those locations might be exposed to the negative environmental impacts of climate conditions. This, in turn, influences their thermal comfort and their quality of life, which are key indicators in describing the living conditions of human living [52].
As stated above, a very important element of the urban structure that can help mitigate the problem of the UHI is green infrastructure. The European Strategy on Green Infrastructure defines green infrastructure as “a strategically planned network of high quality natural and semi-natural areas with other environmental features, which is designed and managed to deliver a wide range of ecosystem services and protect biodiversity in both rural and urban settings” [53]. By implementing green infrastructure it is possible to better adapt to climate change, which means learning to live with more frequent and extreme weather events and everyday conditions [54]. Through the municipal involvement to incorporate it into policies and practices, it is possible to reduce the overall heat stress vulnerability [55]. Green infrastructure has become such an important element of the urban structure that Meerow and Newell [56] have designed a spatial planning model focused strictly on it. Their approach allows for the identification of trade-offs, synergies, and hotspots for future green infrastructures, and the model can be implemented in other cities [56]. Opposite to the UHI, there is an approach that calculates the so-called Park Cool Island (PCI). Based on studies conducted in Sweden, The Netherlands, Portugal, and Israel, depending on local conditions, the PCI can decrease the urban temperature from 1 °C up to even 6 °C [57]. It is also connected to spatial planning patterns and traditions. According to Nastran et al., the share of forest does not affect the UHI in all European countries in the same way. However, their study showed that a higher share of forests is associated with a lower UHI magnitude in Southern and Eastern Europe, however, they did not observe such a relation in Western Europe [58].
Based on the literature review, there is a lack of practical applications of UHI assessments in decision support systems used for spatial planning purposes. Therefore, the aim of the research is to propose an assessment method for urban areas in relation to their exposure to the UHI effect. The applicability of this assessment model is illustrated through a scenario-based approach to study changes in land development, in which the case of the Wrocław Larger Urban Zone (Poland) [59] is presented. The model uses a decision support system based on cellular automata, which is currently used as a highly specialized knowledge-based tool [60,61]. Each scenario was assessed according to the possibility of UHI appearance in specific parts of the area. The study area includes suburban zones in order to analyze the impact of different land uses to thermal comfort conditions [48]. The final effect of the analyses was the indicator-based assessment of built-up areas that are exposed to the UHI impact.

2. Materials and Methods

The research was based on a four-step methodology: (1) modelling of trends in urban development changes based on cellular automata, (2) development of scenarios of different policy implementation, (3) projection of potential future land uses according to defined scenarios, and (4) urban structures assessment (core analysis) of the context exposure to the UHI impact.
The study area is the Wrocław Larger Urban Zone (WLUZ), which includes the city of Wrocław and 10 surrounding communities: 3 urban-rural municipalities and 7 rural municipalities (Figure 2). The WLUZ area is a common study area of other research on urban development studies [59,62].

2.1. Cellular Automata Modelling

The modelling of trends in urban development changes was carried out using Metronamica software (version 4.3.0). Metronamica is a spatial decision support system based on cellular automata, which allows for the preparation of projections of potential future changes in land use in different scenarios [61,63]. Each scenario can be assessed based on indicators that are calculated from a raster format of the used data [60]. The calibration and verification stages require two separate time-horizons of land use changes [64]. In the research the CORINE Land Cover (CLC) data for three different years were used, namely 2000, 2006, and 2012. For the calibration stage, 2000–2006 land use changes were applied, and for the verification stage, 2006–2012 land use changes were used. The resolution of satellite images used for the CORINE Land Cover project was different for each time horizon. For instance the last CLC 2012 used High Resolution Layers, reaching a 20 m × 20 m resolution [65]. However, the data converted to CLC 2012 was later verified by the European Environmental Agency in the 100 m × 100 m resolution [65]. Therefore, the most precise resolution for the 2000, 2006, and 2012 CLC is 100 m × 100 m. The same resolution was used for the cellular automata modelling in this research.
The cellular automata modelling in Metronamica contains four basic elements that are taken into account in future land use projections [66]. The first element is the neighborhood influence, which describes how surrounding land uses (such as housing, industry, agriculture, forest, water, etc.) attract or repel new cells of modelled land use. The examination is based on a so-called active modelling of land use classes (such as housing and industry). The second element is the accessibility influence, which may increase the potential of allocating new cells (some areas have a higher potential to invest due to a highway that enables quick access to the city) or decrease it (such as linear infrastructure, which is impassable and forces people to take a long detour). The third element is the suitability influence, which may be described by different social, environmental, or economic drivers (such as parts of an area that are prestigious while others have a bad reputation, existing flood plains that limit or exclude areas from urban development, division into administrative units that have different real estate tax rates). The last element is the zoning influence, which describes the legal status of an area (for instance, whether a specific land use class is stimulated, allowed or restricted in some locations). Each of these four elements influence the total potential value of each cell for a specific land use class. Once the demand for each land use class is defined by the user, new cells are located in the highest total potential cells.

2.2. Scenario-Based Approach

The potential future urban development was described according to the scenario analysis. Scenario methods are part of the concept of strategic management and belong to so-called macro-analysis groups [67]. Scenario analyses take into account the subject and purpose of the scenario, its space-time scale or the type of indicators used to assess it [68,69]. The derivation of scenarios of urban development was based on policy implementations that were developed from spatial planning documents. These were then adopted on national (National Spatial Management Concept), regional (Voivodship Spatial Management Plan), and local (Study of the Conditions and Directions of the Spatial Management of a Commune) levels.

2.3. Land Use Modelling

Based on (1) the model of trends in urban development and (2) the zoning layers describing the administrative actions that are included in the spatial policies on different levels, the projections of potential future land uses were prepared using three separate scenarios. All of the projections were developed in previously calibrated cellular automata in order to integrate the first two steps. The projections were prepared in Metronamica.

2.4. UHI Impact

The urban structure in each scenario was assessed in the context of exposure to the UHI. Two software packages were used at this step. In Metronamica, the urban clusters indicator layer was prepared. It presents all types of land uses, which are classified as urban development forms (in the current research: high density housing, low density housing, infrastructures, services and industries). The output layers were analyzed in ArcGIS (version 10.3.1) in order to identify the urban areas exposed to the UHI. Three factors influenced the core analyses, namely:
  • The first factor takes into account wind chill, which is connected to the proximity of water bodies. This factor is especially important in the case of Wrocław, as there are five rivers in the city, and the main river (Odra) is divided into parallel branches in the city center, reaching around 50 m in width. Bodies of water may serve as ventilation corridors. Based on this factor, urban areas within a 300 m buffer zone from bodies of water were excluded from the UHI exposure calculations [49,70].
  • The second factor, similar to the first one, takes into account the temperature reduction caused by the proximity of green infrastructure. In the case of high density green areas, these may reduce the thermal stress as the green infrastructure does not heat up as much as the built-up area. Shading by vegetation keeps the air cooler by acting as a solar radiation interceptor that reflects and absorbs radiant energy [71]. As the temperature between neighboring areas tends to equalize, urban areas in a close proximity of green infrastructure—300 m from urban green areas and forests [50]—were also excluded from the UHI exposure assessment.
  • The third factor reflects the mechanism of warming up the centers of urban clusters. In the case of Wrocław, it is assumed that the temperature of the area is influenced by the surrounding areas within a range of 500 m [70]. Temperature of areas in the transitional zone can be partly reduced by the neighborhood from one side. The temperature in areas at the urban edge is reduced by heat fluxes (so-called city-country breezes) [71]. Therefore, in order to select urban areas exposed to the UHI impact, a core analysis was made in two ranges: 250 m–500 m from the patch edge (m-UHI–moderate exposure to UHI) and more than 500 m from the patch edge (h-UHI—high exposure to UHI). The core analysis was calculated by inner-buffer zones.

3. Results

3.1. Calibration and Verification of the Cellular Automata Model

Trends in urban development modelling were defined in cellular automata based on three kinds of rules: 13 neighborhood rules describing the influence of existing land uses on the allocation of new land use cells, two accessibility layers describing the impact of the road network on new land uses, and six suitability rules represented by layers differentiating the level of land use transformation potential into other classes. The correctness of the calibration (time horizon: 2000–2006) and verification (time horizon: 2006–2012) process was assessed by three indicators: Fuzzy Kappa (both values over 0.97), Fuzzy Interference System (both values over 0.83), and Aggregated Cells (both values over 0.98), which, due to the land use modelling studies, can be considered as fitting values [72].

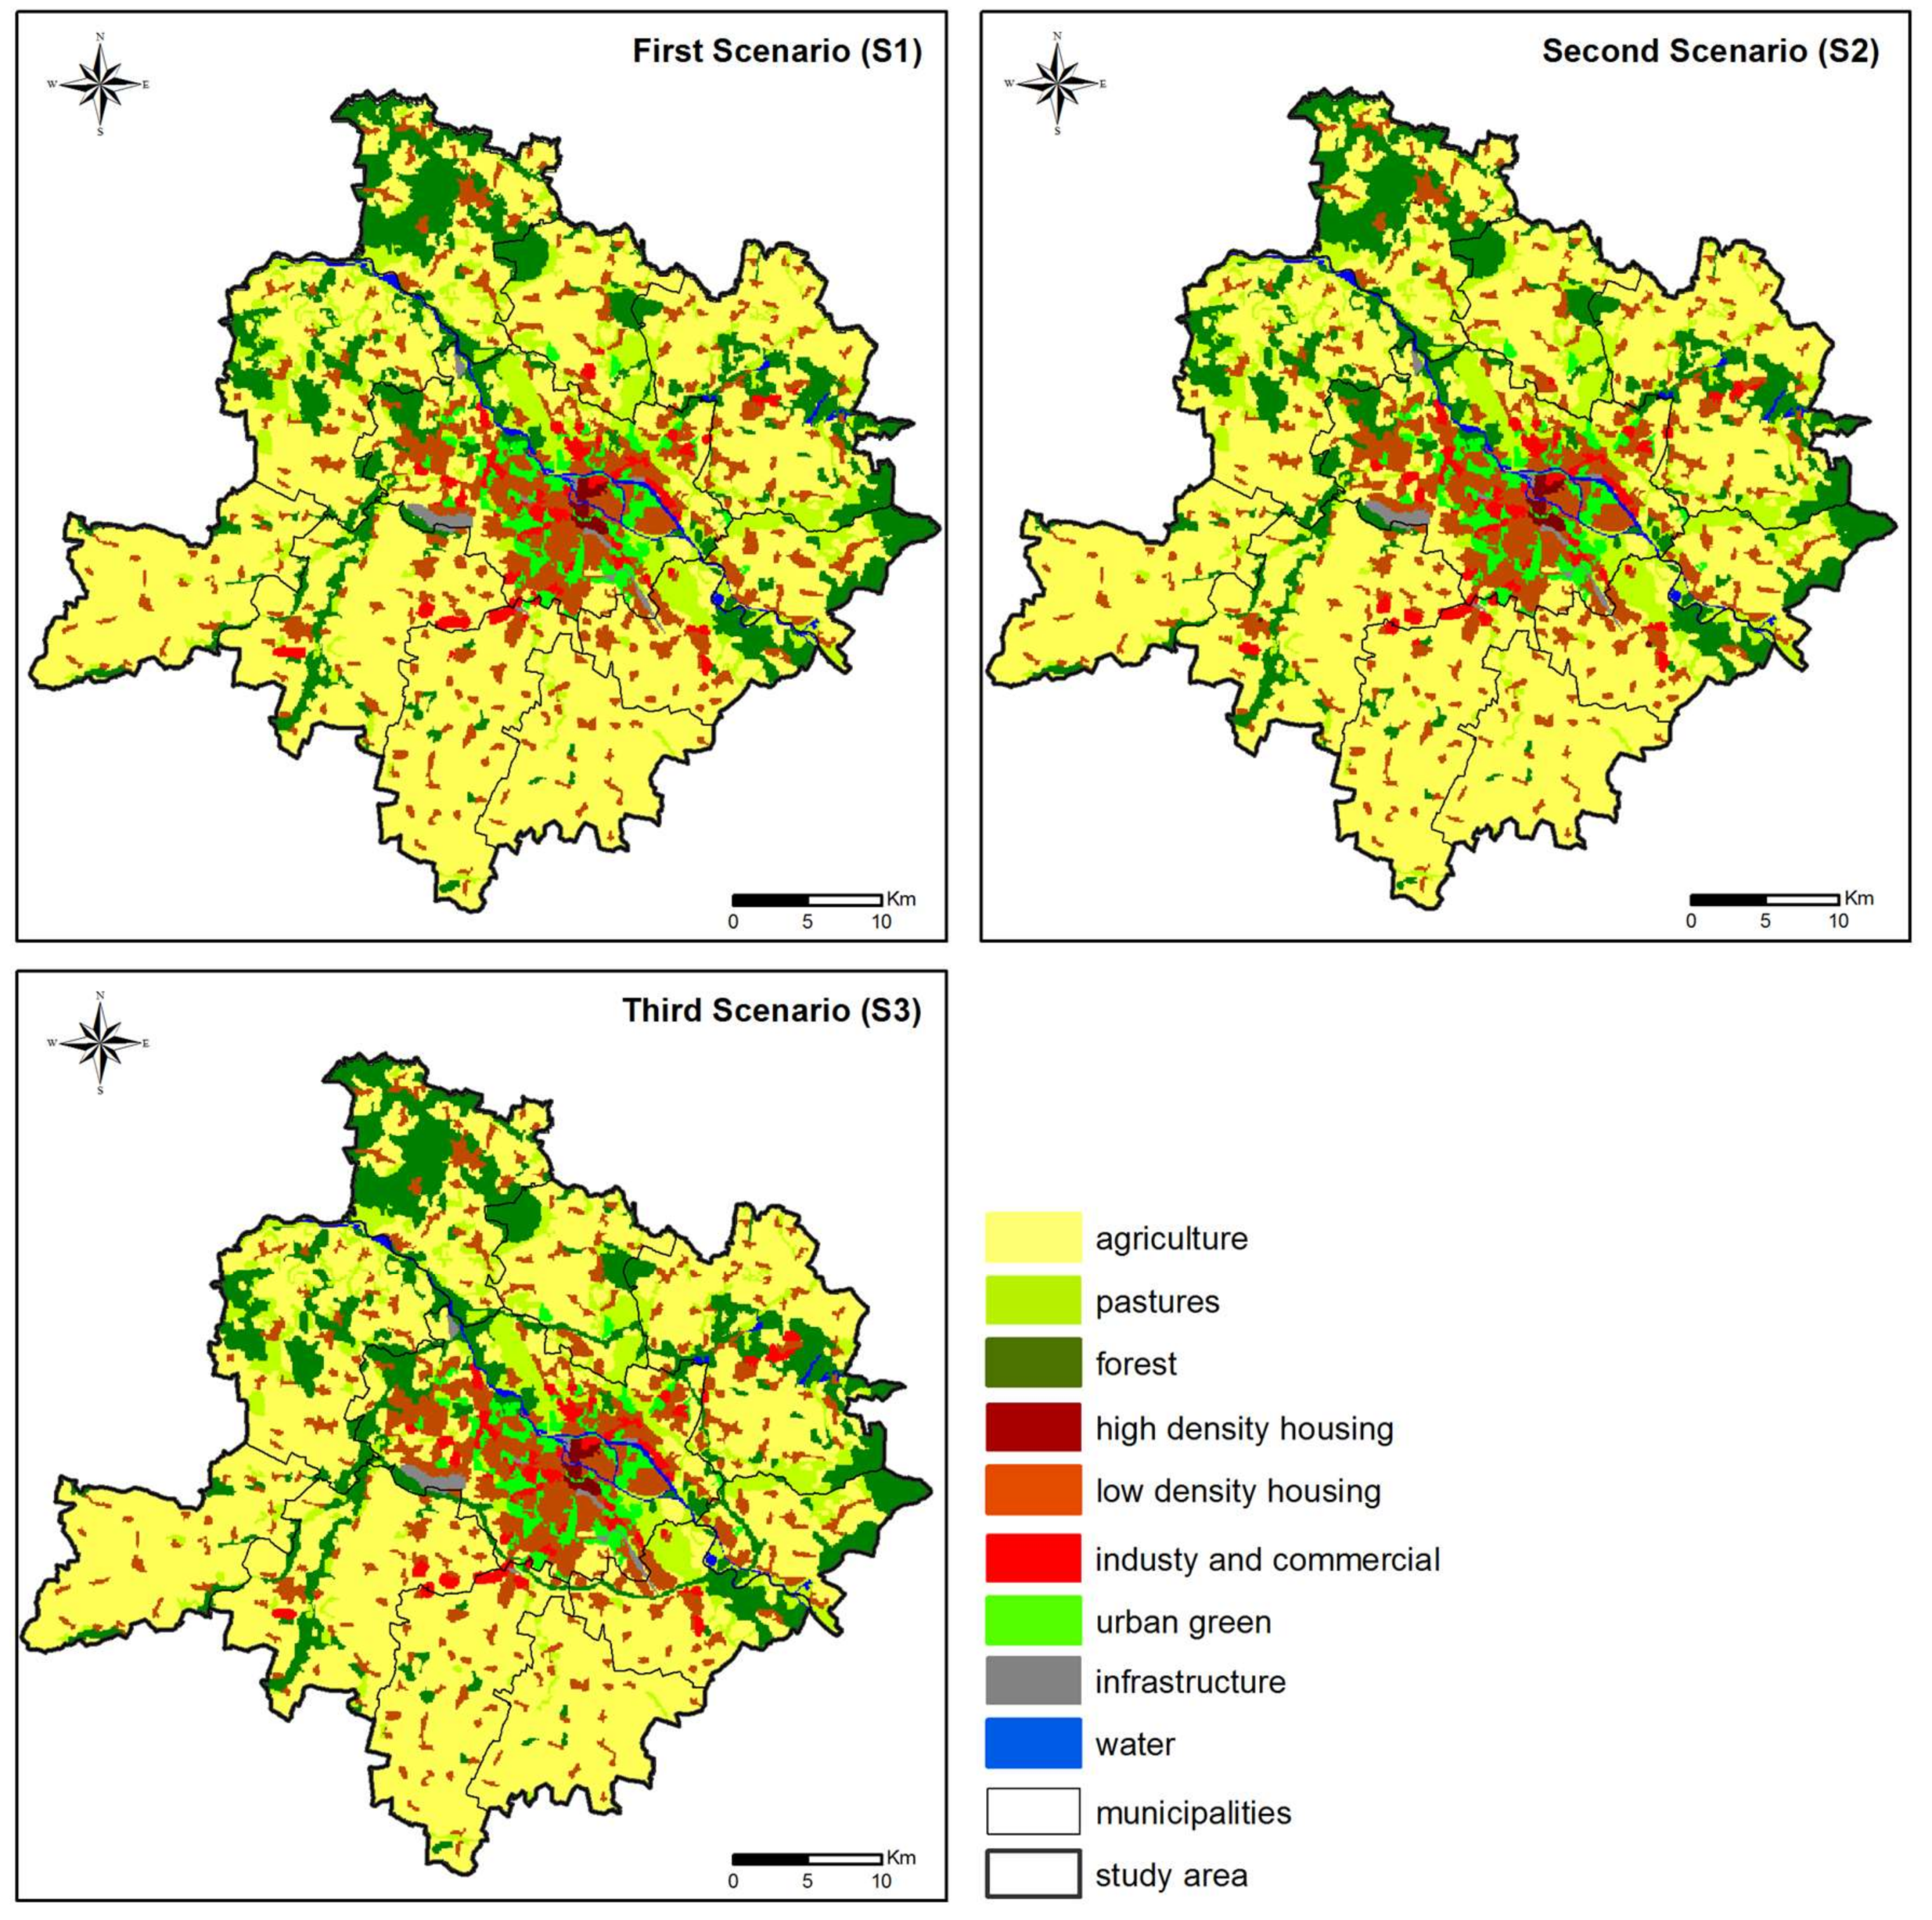
3.2. Development Scenarios

Subsequently, three urban development scenarios were defined based on spatial planning documents. The first scenario (S1) was based on local policy (Study of the Conditions and Directions of the Spatial Management of a Commune), which results in the unfavorable process of urban sprawl [73]. The second scenario (S2) was defined on regional policy (Voivodship Spatial Management Plan), which aims to mitigate urban sprawl and stimulate the creation of sub-centers in towns surrounding the core city. The third scenario (S3) was based on national policy (National Spatial Management Concept), which concentrates on green belt formation around a central city. All developed scenarios were used in a previously calibrated model as zoning rules influencing the use of land change.

3.3. Land Use Projections

Both trends in urban development and scenarios of spatial policy implementation allowed the projection of the potential future land uses for 2030. In each scenario, the same number of citizens was assumed, which excluded the possibility of different exposures to UHI effects due to the different demands of the urban built-up areas. The results of the scenario projections are presented in Figure 3.
The old city center and the downtown area of Wrocław were the areas that had the highest density of built-up areas in the starting year of the modelling period, and, therefore, the scenarios do not vary in that part of the study area. The most significant differences that can be observed are located on the fringe of the central city and in the suburban municipalities. Newly built-up areas are the most scattered in S1, which is connected with suburbanization processes when citizens of the central city decide to move from densely populated and crowded neighborhoods to less populated areas in the suburban zones. New residential housing estates are located in smaller patches, surrounded by agricultural areas, pastures, and forests. In the case of S2, institutional support for developing organized satellite towns resulted in the location of high-density housing areas within two urban units. In spite of their high density, the size of those urban clusters is small, which is significant for further UHI assessment. S3 presents the early stage of a green belt concept, which surrounds the central city. As the green belt creates a border that supports urban development within a delineated area, it results in locating new built-up area in the direct neighborhood of the existing one. It leads to the form of a compact city, which might be beneficial from the perspective of higher population concentrations. At the same time, it is challenging for local authorities to implement actions to mitigate the negative environmental effects that are related to climate change and the UHI [74].

3.4. UHI Exposure Assessment

For each land use scenario, an assessment of urban structures according to their exposure to the UHI effect was made, based on the core analysis described in Section 2. The indicator-based results are presented in Table 1 and in Figure 4. In order to illustrate the results of the analyses more clearly, a detailed zoomed-in map of S3 is provided.
The results of the UHI exposure assessments are highly related to the land use projections described in Section 3.3. The land use patterns that are more scattered create smaller urban development cores, which are identified in the core analysis. Therefore, such land use distribution results in a lower UHI exposure level. In contrast, the more clustered urban forms result in larger urban cores and a higher level of UHI exposure.
The highest exposure to the UHI effect was calculated for S3. This is caused by large urban clusters, which are not intermittent with urban green areas (according to the spatial resolution of the CORINE database). In addition, the data source does not include information about green roofs or green walls, which can reduce the UHI effect on a local scale. In Polish conditions, such solutions have not been very popular yet, however, for future research or international study areas it might be relevant to incorporate data that would allow the inclusion of those elements in the city structure.
The results of the land use modelling and UHI assessment present urban areas, which are exposed to the UHI impact, mainly because these large urban clusters are not separated by green infrastructure or bodies of water. The mediaeval market square is in the range of a moderate UHI impact. This area is surrounded by the old city moat, which is presently used as a combination of green and blue infrastructures. It is a good example of how previous functions can be replaced by new ones to help reduce the problem of thermal stress. However, most of the high-UHI impact patches cover downtown areas developed in the early 20th century. Because water bodies are relatively constant, there is a space to redesign and expand the existing green infrastructure. The results enable the ability to identify those parts of the city that require municipal actions and public investments to design more sustainable urban structures that are well-adapted to climate change and thermal stress. Such solutions may—at one time—fulfil two different needs: urban adaptation to climate change and age-friendly city challenges, as the most vulnerable group to thermal stresses are elderly people [75].

4. Discussion

The assessment of the exposure of urban structures to the impact of the UHI proves that the most effective land use policy, from the perspective of mitigating the impact of one climate change effect, is S1—the scenario of local development. Both the m-UHI and h-UHI indices have the lowest values. As mentioned before, this scenario allows for the unfavorable process of urban sprawl [73]. However, in the context of UHI, the scenario guarantees built-up areas that are developed in smaller patches. These smaller patches are located around open areas and green infrastructure. S2 and S3 are scenarios with a higher exposure to the UHI. In the case of S2, the h-UHI index was 11% higher than in the case of S1. This is caused by a higher density of built-up areas. S3 led to an even higher h-UHI index, which was 15% higher than in the case of S1. S3 does not change the density of the new development when compared to S1. Because of the green belt around the city, it does not allow for the spread of residential areas into the rural areas. As a result, residential areas are connected together and create larger urban clusters.
On the one hand, the S1 policy provides low levels of big urban clusters, which are more vulnerable to the effects of climate change. On the other hand, built-up areas are spread across rural areas and this process impacts other unfavorable environmental effects [76,77]. Therefore, a holistic assessment of the environmental impact of each of the urban developments should include a multitude of factors. At the current scale, only land use policy was taken into account. Specific urban design patterns may reduce unfavorable environmental effects and may improve both outdoor and indoor thermal comfort by climate change adaptation actions, such as green roofs or green walls, single trees located along streets, linear parks, and so on [78]. Those elements are not included in the present scale of analysis. Therefore, the results of the study might be helpful to identify areas where it is more important to focus on suitable design patterns.
The calculated indicators show the number of people influenced by climate change might be different. The population density in urban areas should not be assessed based only on the density of the housing areas. People spend a lot of time outside of their households due to their patterns of work, shopping, recreation, and leisure. Depending on local conditions, the distance of everyday trips may vary and exceed even 55 km [79]. Average distances are also longer on weekdays than during the weekends [80]. Future research may want to explore the possibility of incorporating urban metabolism analyses, which may assess the volume of people spending time in specific parts of the city. The analyses of age distributions of a local population might also be helpful, as older adults are more vulnerable to environmental conditions and require thermal comfort in urban areas. As Wong et al. [81] noticed, the UHI has a significant impact on public health and UHI control measures should ideally be incorporated into strategic planning.
The proposed model has some limitations, which must be discussed. First of all, the calculation method does not include detailed analyses at the architectural level, focusing on single building locations or small green infrastructure solutions, like green roofs or green walls. Such detailed assessment is possible [38,47], however, it is not suitable to incorporate such assessment types into existing spatial decision support systems. Metronamica, which was used for the land use change projections, is predesigned for larger areas. The type of data used for such purposes is generalized, and can be used to assess mesoscale climate conditions [71]. Therefore, the suggested solution is to focus on the land use level rather than on the architectural level. A similar scale of the UHI phenomenon is used in other studies as well [46,82]. The next limitation is connected with wind conditions. The present study takes the heat flux [71] and ventilation of linear corridors in urban space [49] into account. However, it does not include the dominant wind direction resulting from regional conditions. On the one hand, it could improve the results by allowing for the identification of urban districts that might be chilled by the air that comes from the non-urbanized areas. On the other hand, it would require data that are not commonly used in decision support systems, which are predominantly used by urban planners. Therefore, such a solution would be less applicable in the practice of land use planners. The UHI effect is a complex phenomenon that is influenced by many factors (daily variation of UHI [51], used surface materials [38] or more complex sub-indicators [40] and so on). Due to the inter-domain character of indicator-based matrices used in supporting land use planning, there is a need to include one simple and easily understandable UHI factor. Lastly, the uncertainty of future land use projections is also a very important limitation. The cellular automata land use model is calibrated and verified based on 2000, 2006, and 2012 time horizons. It effectively presents the land use distribution patterns based on current trends. However, future projections may be subject to change, if there is a significant change in the drivers influencing new urban developments, such as life style (change in dream destinations from suburbs to downtown), economic conditions (prices of petrol may increase so that long everyday trips from home to work may become too restraining), legal regulations (new laws supporting urban development in locations which were restricted), and so on. Therefore, land use projections are reliable for as long as the external drivers remain stable.
The basic output for urban planning practice is the identification of those parts of the city that have the highest exposure levels to the UHI effect. In all scenarios the most vulnerable part of the study area were the early 20th century areas in downtown Wrocław. As that part of the city is unlikely to be rebuilt and the urban design pattern is rather positively assessed by people, there will not be much expansion of green infrastructure initiatives in terms of cover area in those 20th century neighborhoods. That is why it would be important to invest in high greenery, as it is more effective in temperature stress reduction. The proposed solution can be used outside of the study area because the parameters used in the methodology (Section 2.4. UHI impact) are also defined for other areas.

5. Conclusions

The study presented an approach of the indicator-based assessment of the exposure of built-up areas to the UHI. Three different scenarios of urban development based on spatial planning documents were analyzed. The lowest impact of UHI was observed in the scenario that was based on local documents. However, the local scenario allowed for an unfavorable urban development process of urban sprawl. Therefore, the integrated assessments of land use policy should be applied.
The results of the study might be helpful in the identification of areas where actions for the improvement of the built environment are particularly important. The land use analysis defined cores of built-up areas in which architectural design patterns should be implemented. Such an implementation should follow the idea of sustainable urbanization. Reducing the UHI effect in those places would be crucial for improving the thermal comfort of residents and users of the outdoor space.
Land use change caused by ongoing urbanization processes is dangerously approaching our planetary boundaries [10]. In order to follow the patterns of sustainable development and to avoid a situation where our consumption exceeds our ability to renew resources, there is a need to limit further quantitative land use development. There are certain ways to assess how much we can grow, without exceeding the planetary boundaries. One of them is the assessment of environmental carrying capacity, which can be measured on a local scale by comparing the ecological footprint and the biocapacity. There are preliminary studies available for the Wrocław Larger Urban Zone to evaluate the relation between those two elements [83]. So far they have been focused on food production services.
Currently there is no clear answer to reaching the boundaries of our land use system. Due to the precautionary principle, current actions should focus on improving existing urban structures. This study shows that using the former city moat as a green infrastructure helps to reduce thermal stress in the city center. The biggest challenge right now is to plan appropriate green infrastructures in the downtown area. It should be considered as a priority in order to make the city more sustainable and better adapted to climate change. It is also important that the design takes place in all three dimensions, as high greenery has a favorable impact on the climate on the mesoscale.
Sustainable urbanization should include different aspects of suitable land use location, and in the context of accelerating climate change patterns, adaptation actions should be incorporated into the process of urban planning. The use of a decision support system allowed for the construction of a local model for the scenario-based analysis of the impact of the UHI effect on potential future urban structures.

Conflicts of Interest

The author declares no conflict of interest.

References

  1. Dąbrowska, J.; Bawiec, A.; Pawęska, K.; Kamińska, J.; Stodolak, R. Assessing the Impact of Wastewater Effluent Diversion on Water Quality. Pol. J. Environ. Stud. 2017, 26, 9–16. [Google Scholar] [CrossRef]
  2. Jawecki, B.; Lorenc, M.W.; Tokarczyk-Dorociak, K. Quarries in the landscape of the county of Strzelin—Native rock materials in the local architecture. Z. Deutsch. Gesellsch. Geowissensch. 2015, 166, 205–225. [Google Scholar] [CrossRef] [PubMed]
  3. Żyromski, A.; Biniak-Pieróg, M.; Burszta-Adamiak, E.; Zamiar, Z. Evaluation of relationship between air pollutant concentration and meteorological elements in winter months. J. Water Land Dev. 2014, 22, 25–32. [Google Scholar] [CrossRef]
  4. Kazak, J.; Szewrański, S. Indicator-based environmental assessment of spatial planning with the use of CommunityViz. In Proceedings of the 10th International Symposium Geoinformatics for City Transformations, GIS Ostrava 2013, Ostrava, Czech Republic, 21–23 January 2013. [Google Scholar]
  5. Randers, J. 2052: A Global Forecast for the Next Forty Years; Chelsea Green Publishing House: White River Junction, VT, USA, 2012. [Google Scholar]
  6. Galaz, V.; Biermann, F.; Folke, C.; Nilsson, M.; Olsson, P. Global environmental governance and planetary boundaries: An introduction. Ecol. Econ. 2012, 81, 1–3. [Google Scholar] [CrossRef]
  7. Biermann, F. Planetary boundaries and earth system governance: Exploring the links. Ecol. Econ. 2012, 81, 4–9. [Google Scholar] [CrossRef]
  8. Steffen, W.; Smith, M.S. Planetary boundaries, equity and global sustainability: Why wealthy countries could benefit from more equity. Curr. Opin. Environ. Sustain. 2013, 5, 403–408. [Google Scholar] [CrossRef]
  9. Baum, S.D.; Handoh, I.C. Integrating the planetary boundaries and global catastrophic risk paradigms. Ecol. Econ. 2014, 107, 13–21. [Google Scholar] [CrossRef]
  10. Steffen, W.; Richardson, K.; Rockström, J.; Cornell, S.E.; Fetzer, I.; Bennett, E.M.; Biggs, R.; Carpenter, S.R.; de Vries, W.; de Wit, C.A.; et al. Planetary boundaries: Guiding human development on a changing planet. Science 2015, 347, 1259855. [Google Scholar] [CrossRef] [PubMed]
  11. United Nations. United Nations Framework Convention on Climate Change; United Nations: New York, NY, USA, 1992. [Google Scholar]
  12. United Nations. Transforming our World: The 2030 Agenda for Sustainable Development; A/RES/70/1; United Nations: New York, NY, USA, 2015. [Google Scholar]
  13. United Nations. Development Programme. Sustainable Urbanization Strategy UN DP’s Support to Sustainable, Inclusive and Resilient Cities in the Developing World; United Nations: New York, NY, USA, 2016. [Google Scholar]
  14. Świąder, M.; Szewrański, S.; Kazak, J. Spatial-Temporal Diversification of Poverty in Wroclaw. Procedia Eng. 2016, 161, 1596–1600. [Google Scholar] [CrossRef]
  15. Sinoo, M.M.; van Hoof, J.; Kort, H.S.M. Light conditions for older adults in the nursing home: Assessment of environmental illuminances and colour temperature. Build. Environ. 2011, 46, 1917–1927. [Google Scholar] [CrossRef]
  16. Świąder, M.; Szewrański, S.; Kazak, J. Poverty Risk Index as A New Methodology for Social Inequality Distribution Assessment. IOP Conf. Ser. Mater. Sci. Eng. 2017, 245, 072021. [Google Scholar] [CrossRef]
  17. Tan, Y.; Xu, H.; Zhang, X. Sustainable urbanization in China: A comprehensive literature review. Cities 2016, 55, 82–93. [Google Scholar] [CrossRef]
  18. Stacherzak, A.; Hełdak, M.; Raszka, B. Planning documents and sustainable development of a commune in Poland. WIT Trans. Ecol. Environ. 2012, 162, 23–34. [Google Scholar] [CrossRef]
  19. Lu, X.; Ke, S. Evaluating the effectiveness of sustainable urban land use in China from the perspective of sustainable urbanization. Habitat Int. 2017. [Google Scholar] [CrossRef]
  20. Zoomers, A.; van Noorloos, F.; Otsuki, K.; Steel, G.; van Westen, G. The Rush for Land in an Urbanizing World: From Land Grabbing Toward Developing Safe, Resilient, and Sustainable Cities and Landscapes. World Dev. 2016, 92, 242–252. [Google Scholar] [CrossRef]
  21. Kröger, M.; Schäfer, M. Scenario development as a tool for interdisciplinary integration processes in sustainable land use research. Futures 2016, 84, 64–81. [Google Scholar] [CrossRef]
  22. Hermanns, T.; Helming, K.; König, H.J.; Schmidt, K.; Li, Q.; Faust, H. Sustainability impact assessment of peatland-use scenarios: Confronting land use supply with demand. Ecosyst. Serv. 2017, 26, 365–376. [Google Scholar] [CrossRef]
  23. Płuciennik, M.; Hełdak, M.; Szczepański, J.; Patrzałek, C. Application of Spatial Models in Making Location Decisions of Wind Power Plant in Poland. IOP Conf. Ser. Mater. Sci. Eng. 2017, 245, 072016. [Google Scholar] [CrossRef]
  24. Geng, B.; Zheng, X.; Fu, M. Scenario analysis of sustainable intensive land use based on SD model. Sustain. Cities Soc. 2017, 29, 193–202. [Google Scholar] [CrossRef]
  25. Bua, L.; van Duin, J.H.R.; Wiegmans, B.; Luo, Z.; Yin, C. Selection of city distribution locations in urbanized areas. Procedia Soc. Behav. Sci. 2012, 39, 556–567. [Google Scholar] [CrossRef]
  26. Kazak, J.; van Hoof, J.; Szewranski, S. Challenges in the wind turbines location process in Central Europe—The use of spatial decision support systems. Renew. Sustain. Energy Rev. 2017, 76, 425–433. [Google Scholar] [CrossRef]
  27. Forys, I.; Putek-Szelag, E. Methods of linear ordering in estimation of potential of Polish market of agricultural property. Actual Probl. Econ. 2014, 151, 542–550. [Google Scholar]
  28. Janik, G.; Olszewska, B.; Pływaczyk, L.; Łyczko, W.; Albert, M.; Nowicka, E. Applicability of Geostatistical Tools and Fractal Theory for the Estimation of the Effect of a River on Water Relations in Adjacent Area. River Res. Appl. 2016, 32, 1342–1354. [Google Scholar] [CrossRef]
  29. Pontius, R.G.; Si, K. Spatial Decision Support Systems. In International Encyclopedia of the Social & Behavioral Sciences, 2nd ed.; Wright, J.D., Ed.; Elsevier: Oxford, UK, 2015; Volume 23, pp. 136–141. [Google Scholar] [CrossRef]
  30. Gong, J.; Li, J.; Yang, J.; Li, S.; Tang, W. Land Use and Land Cover Change in the Qinghai Lake Region of the Tibetan Plateau and Its Impact on Ecosyst Serv. Int. J. Environ. Res. Public Health 2017, 14, 818. [Google Scholar] [CrossRef] [PubMed]
  31. Noszczyk, T.; Rutkowska, A.; Hernik, J. Determining Changes in Land Use Structure in Małopolska Using Statistical Methods. Pol. J. Environ. Stud. 2017, 26, 211–220. [Google Scholar] [CrossRef]
  32. Chai, J.; Wang, Z.; Zhang, H. Integrated Evaluation of Coupling Coordination for Land Use Change and Ecological Security: A Case Study in Wuhan City of Hubei Province, China. Int. J. Environ. Res. Public Health 2017, 14, 1435. [Google Scholar] [CrossRef] [PubMed]
  33. Cai, Y.; Zhang, H.; Pan, W. Detecting Urban Growth Patterns and Wetland Conversion Processes in a Natural Wetlands Distribution Area. Pol. J. Environ. Stud. 2015, 24, 1919–1929. [Google Scholar] [CrossRef]
  34. Ghodousi, M.; Atabi, F.; Nouri, J.; Gharagozlou, A. Air Quality Management in Tehran Using a Multi-Dimensional Decision Support System. Pol. J. Environ. Stud. 2017, 26, 593–603. [Google Scholar] [CrossRef]
  35. Nyerges, T.; Ballal, H.; Steinitz, C.; Canfield, T.; Roderick, M.; Ritzman, J.; Thanatemaneerat, W. Geodesign dynamics for sustainable urban watershed development. Sustain. Cities Soc. 2016, 25, 13–24. [Google Scholar] [CrossRef]
  36. Rukundo, E.; Doğan, A. Assessment of Climate and Land Use Change Projections and their Impacts on Flooding. Pol. J. Environ. Stud. 2016, 25, 2541–2551. [Google Scholar] [CrossRef]
  37. Akbari, H.; Kolokotsa, D. Three decades of urban heat islands and mitigation technologies research. Energy Build. 2016, 133, 834–842. [Google Scholar] [CrossRef]
  38. Mohajerani, A.; Bakaric, J.; Jeffrey-Bailey, T. The urban heat island effect, its causes, and mitigation, with reference to the thermal properties of asphalt concrete. J. Environ. Manag. 2017, 197, 522–538. [Google Scholar] [CrossRef] [PubMed]
  39. Mirzaei, P.A. Recent challenges in modeling of urban heat island. Sustain. Cities Soc. 2015, 19, 200–206. [Google Scholar] [CrossRef]
  40. Dos Santos, A.R.; De Oliveira, F.S.; Da Silva, A.G.; Gleriani, J.M.; Gonçalves, W.; Moreira, G.L.; Silva, F.G.; Branco, E.R.F.; Moura, M.M.; Da Silva, R.G.; et al. Spatial and temporal distribution of urban heat islands. Sci. Total Environ. 2017, 605–606, 946–956. [Google Scholar] [CrossRef] [PubMed]
  41. Van Hoof, J.; Schellen, L.; Soebarto, V.; Wong, J.K.W.; Kazak, J.K. Ten questions concerning thermal comfort and ageing. Build. Environ. 2017, 120, 123–133. [Google Scholar] [CrossRef]
  42. Heaviside, C.; Vardoulakis, S.; Cai, X.-M. Attribution of mortality to the urban heat island during heatwaves in the West Midlands, UK. Environ. Health 2016, 15, 27. [Google Scholar] [CrossRef] [PubMed]
  43. Bazan-Krzywoszańska, A.; Mrówczyńska, M.; Skiba, M.; Łączak, A. Economic conditions for the development of energy efficient civil engineering using RES in the policy of cohesion of the European Union (2014–2020). Case study: The town of Zielona Gora. Energy Build. 2016, 118, 170–180. [Google Scholar] [CrossRef]
  44. Skiba, M.; Mrówczyńska, M.; Bazan-Krzywoszańska, A. Modeling the economic dependence between town development policy and increasing energy effectiveness with neural networks. Case study: The town of Zielona Góra. Appl. Energy 2017, 188, 256–266. [Google Scholar] [CrossRef]
  45. Boerenfijn, P.; Kazak, J.K.; Schellen, L.; van Hoof, J. A multi-case study of innovations in energy performance of social housing for older adults in the Netherlands. Energy Build. 2018, 158, 1762. [Google Scholar] [CrossRef]
  46. Takebayashi, H.; Senoo, M. Analysis of the relationship between urban size and heat island intensity using WRF model. Urban Clim. 2017. [Google Scholar] [CrossRef]
  47. Nakata-Osaki, C.M.; Souza, L.C.L.; Rodrigues, D.S. THIS—Tool for Heat Island Simulation: A GIS extension model to calculate urban heat island intensity based on urban geometry. Comput. Environ. Urban Syst. 2018, 67, 157–168. [Google Scholar] [CrossRef]
  48. Hardin, A.W.; Liu, Y.; Cao, G.; Vanos, J.K. Urban heat island intensity and spatial variability by synoptic weather type in the northeast U.S. Urban Clim. 2017. [Google Scholar] [CrossRef]
  49. Yang, L.; Qian, F.; Song, D.-X.; Zheng, K.-J. Research on Urban Heat-island Effect. Procedia Eng. 2016, 169, 11–18. [Google Scholar] [CrossRef]
  50. Green Infrastructure and the Urban Heat Island. Forestry Research. Available online: https://www.forestry.gov.uk/pdf/urgp_evidence_note_004_Heat_amelioration.pdf/$FILE/urgp_evidence_note_004_Heat_amelioration.pdf (accessed on 5 February 2018).
  51. Soltani, A.; Sharifi, E. Daily variation of urban heat island effect and its correlations to urban greenery: A case study of Adelaide. Front. Archit. Res. 2017, 6, 529–538. [Google Scholar] [CrossRef]
  52. Przybyła, K.; Kulczyk-Dynowska, A.; Kachniarz, M. Quality of life in the regional capitals of Poland. J. Econ. Issues 2014, 48, 181–196. [Google Scholar] [CrossRef]
  53. European Commission. Building a Green Infrastructure for Europe; Publications Office of the European Union: Luxembourg, 2013. [Google Scholar] [CrossRef]
  54. Schneider, P.; Gottschalk, N.; Löser, R.; Scharbrodt, T. Integrated Climate Protection Program for the City of Chemnitz—Climate Diagnosis, Climate Change Prognosis and Conception of Adaptation Measures in the Urban Area. In Resilient Cities: Cities and Adaptation to Climate Change—Proceedings of the Global Forum 2010; Local Sustainability; Springer: Bonn, Germany, 2011; Volume 1, pp. 299–310. [Google Scholar] [CrossRef]
  55. Ambrey, C.; Byrne, J.; Matthews, T.; Davison, A.; Portanger, C.; Lo, A. Cultivating climate justice: Green infrastructure and suburban disadvantage in Australia. Appl. Geogr. 2017, 89, 52–60. [Google Scholar] [CrossRef]
  56. Meerow, S.; Newell, J.P. Spatial planning for multifunctional green infrastructure: Growing resilience in Detroit. Landsc. Urban Plan. 2017, 159, 62–75. [Google Scholar] [CrossRef]
  57. Saaroni, H.; Amorim, J.H.; Hiemstra, J.A.; Pearlmutter, D. Urban Green Infrastructure as a tool for urban heat mitigation: Survey of research methodologies and findings across different climatic regions. Urban Clim. 2018, 24, 94–110. [Google Scholar] [CrossRef]
  58. Nastran, M.; Kobal, M.; Eler, K. Urban heat islands in relation to green land use in European cities. Urban For. Urban Green. 2018. [Google Scholar] [CrossRef]
  59. Szewrański, S.; Kazak, J.; Żmuda, R.; Wawer, R. Indicator-Based Assessment for Soil Resource Management in the Wrocław Larger Urban Zone of Poland. Pol. J. Environ. Stud. 2017, 26, 2239–2248. [Google Scholar] [CrossRef]
  60. Van Delden, H.; Stuczynski, T.; Ciaian, P.; Paracchini, M.L.; Hurkens, J.; Lopatka, A.; Shi, Y.; Prieto, O.G.; Calvo, S.; van Vliet, J.; et al. Integrated assessment of agricultural policies with dynamic land use change modelling. Ecol. Model. 2010, 221, 2153–2166. [Google Scholar] [CrossRef]
  61. Wang, T.; Han, Q.; de Vries, B. A semi-automatic neighborhood rule discovery approach. Appl. Geogr. 2017, 88, 73–83. [Google Scholar] [CrossRef]
  62. Solecka, I.; Sylla, M.; Świąder, M. Urban Sprawl Impact on Farmland Conversion in Suburban Area of Wroclaw, Poland. IOP Conf. Ser. Mater. Sci. Eng. 2017, 245, 072002. [Google Scholar] [CrossRef]
  63. Mancosu, E.; Gago-Silva, A.; Barbosa, A.; De Bono, A.; Ivanov, E.; Lehmann, A.; Fons, J. Future land-use change scenarios for the Black Sea catchment. Environ. Sci. Policy 2015, 46, 26–36. [Google Scholar] [CrossRef]
  64. Hewitt, R.; van Delden, H.; Escobar, F. Participatory land use modelling, pathways to an integrated approach. Environ. Model. Softw. 2014, 52, 149–165. [Google Scholar] [CrossRef]
  65. CORINE Land Cover—CLC. Available online: http://clc.gios.gov.pl/index.php/26-clc-2012 (accessed on 22 March 2018).
  66. Kazak, J.; Wang, T.; Szewrański, S. Analysis of Land Use Transformation Potential in Spatial Management. Real Estate Manag. Valuat. 2015, 23, 5–14. [Google Scholar] [CrossRef]
  67. Bański, J. Polish Village in the Perspective of 2050; Studies in Rural Areas, XXXIII; Polish Geographical Society, Institute of Geography and Spatial Organization, Polish Academy of Sciences: Warsaw, Poland, 2013. [Google Scholar]
  68. Stewart, T.J.; French, S.; Rios, J. Integrating multicriteria decision analysis and scenario planning—Review and extension. Omega 2013, 41, 679–688. [Google Scholar] [CrossRef]
  69. Menck, N.; Weidig, C.; Aurich, J.C. Approach for predicting production scenarios focused on cross impact analysis. Procedia CIRP 2014, 17, 493–498. [Google Scholar] [CrossRef]
  70. Szymanowski, M.; Kryza, M. GIS-based techniques for urban heat island spatialization. Clim. Res. 2009, 38, 171–187. [Google Scholar] [CrossRef]
  71. Gunawardena, K.R.; Wells, M.J.; Kershaw, T. Utilising green and bluespace to mitigate urban heat island intensity. Sci. Total Environ. 2017, 584–585, 1040–1055. [Google Scholar] [CrossRef] [PubMed]
  72. Van Vliet, J.; Hagen-Zanker, A.; Hurkens, J.; van Delden, H. A fuzzy set approach to assess the predictive accuracy of land use simulations. Ecol. Model. 2013, 261–262, 32–42. [Google Scholar] [CrossRef]
  73. Kajdanek, K. Newcomers vs. old-timers? Community, cooperation and conflict in the post-socialist suburbs of Wroclaw, Poland. In Mobilities and Neighbourhood Belonging in Cities and Suburbs; Watt, P., Smets, P., Eds.; Palgrave Macmillan: London, UK, 2014. [Google Scholar]
  74. Yiannakou, A.; Salata, K.-D. Adaptation to Climate Change through Spatial Planning in Compact Urban Areas: A Case Study in the City of Thessaloniki. Sustainability 2017, 9, 271. [Google Scholar] [CrossRef]
  75. Van Hoof, J.; Kazak, J.K. Urban ageing. Indoor Built Environ. 2018, 27. [Google Scholar] [CrossRef]
  76. Frediani, J.; Giacobbe, N.; Ravella, O.; Pistola, J. Compact City—Sprawl City: Two interacting urban forms. In Proceedings of the Conference Materials of the 44th ISOCARP Congress, Dalian, China, 19–23 September 2008. [Google Scholar]
  77. Tokarczyk-Dorociak, K.; Kazak, J.; Szewrański, S. The Impact of a Big City on Land Use in Suburban Area—The Case of Wrocław (Poland). J. Ecol. Eng. 2018, 19, 89–98. [Google Scholar] [CrossRef]
  78. Giannakis, E.; Bruggeman, A.; Poulou, D.; Zoumides, C.; Eliades, M. Linear Parks along Urban Rivers: Perceptions of Thermal Comfort and Climate Change Adaptation in Cyprus. Sustainability 2016, 8, 1023. [Google Scholar] [CrossRef]
  79. Plötz, P.; Jakobsson, N.; Sprei, F. On the distribution of individual daily driving distances. Transp. Res. B-Meth. 2017, 101, 213–227. [Google Scholar] [CrossRef]
  80. Elldér, E. Residential location and daily travel distances: The influence of trip purpose. J. Transp. Geogr. 2014, 34, 121–130. [Google Scholar] [CrossRef]
  81. Wong, L.P.; Alias, H.; Aghamohammadi, N.; Aghazadeh, S.; Sulaiman, N.M.N. Urban heat island experience, control measures and health impact: A survey among working community in the city of Kuala Lumpur. Sustain. Cities Soc. 2017, 35, 660–668. [Google Scholar] [CrossRef]
  82. Lauwaet, D.; De Ridder, K.; Saeed, S.; Brisson, E.; Chatterjee, F.; van Lipzig, N.P.M.; Maiheu, B.; Hooyberghs, H. Assessing the current and future urban heat island of Brussels. Urban Clim. 2016, 15, 1–15. [Google Scholar] [CrossRef]
  83. Świąder, M.; Szewrański, S.; Kazak, J. Foodshed as an Example of Preliminary Research for Conducting Environmental Carrying Capacity Analysis. Sustainability 2018, 10, 882. [Google Scholar] [CrossRef]
Figure 1. The concept of planetary boundaries [10].
Sustainability 10 01083 g001
Figure 2. Land uses in Wrocław Larger Urban Zone.
Sustainability 10 01083 g002
Figure 3. Land uses in analyzed scenarios.
Sustainability 10 01083 g003
Figure 4. Visualization of the exposure of urban areas to the UHI impact in the three scenarios.
Sustainability 10 01083 g004
Table 1. The exposure of urban areas to the UHI (urban heat island) impact in the three analyzed scenarios.
Scenariom-UHI [ha]h-UHI [ha]
S143021083
S244791202
S347421243

