Is the Development of China’s Financial Inclusion Sustainable? Evidence from a Perspective of Balance


1
College of Finance and Statistics, Hunan University, Changsha 410079, China
2
Educational Science Research Institute, Hunan University, Changsha 410006, China
*
Author to whom correspondence should be addressed.
Sustainability 2018, 10(4), 1200; https://doi.org/10.3390/su10041200
Submission received: 23 March 2018
/
Revised: 10 April 2018
/
Accepted: 11 April 2018
/
Published: 16 April 2018
(This article belongs to the Special Issue Sustainable Finance)
Abstract
:Balance plays an important role in the sustainable development of China’s financial inclusion. First, this paper reports the entropy weight method used to construct a financial inclusion index (FII) and measure the level of development of financial inclusion in China’s regions. Second, the concept of the Gini coefficient of financial inclusion is proposed and the structural balance of China’s financial inclusion is shown, as calculated by using this Gini coefficient. Third, we report the use of a dynamic shift-share model to further discuss the development balance of the financial inclusion of China’s regions. The results show that there is an imbalance in the development of financial inclusion in China’s regions. For 2006–2016, the Gini coefficient and the structural balance of China’s financial inclusion show a significant downward trend. The gap of the financial inclusion development between regions is narrowing and the structure of China’s financial inclusion tends to be reasonable. The penetration dimension is at a structural disadvantage. Availability and usage dimension are at a structural advantage, which can effectively promote the development of China’s financial inclusion. In the future, the government should establish a more balanced financial inclusion development mechanism, making full use of structural advantages of the availability and usage of financial services to promote the sustainable development of China’s financial inclusion.
1. Introduction
Financial inclusion originates from microcredit and microfinance, which emerges in the context of global financial exclusion. In 2005, the United Nations first proposed establishing a unified financial inclusion system around the world, and this concept gradually became popular. At the G20 summit in September 2016, governments proposed to use digital technology to reduce the cost of financial services, expanding the coverage of financial services and ultimately enhancing financial inclusion. As an important part of China’s financial reform, financial inclusion plays a crucial role in promoting economic development. Financial inclusion can be understood as providing formal financial services to vulnerable groups, such as low-income people, farmers, disabled persons, and so on. At the same time, it solves the problem of financing difficulties of small and medium-sized enterprises. Most studies show that when countries have better formal financial services, poverty rates and inequality in those countries are lower [1,2,3]. According to the latest Global Findex database released by The World Bank, the penetration rate of China’s formal financial account in 2014 was 78.9%, which has a significant gap from the level of 94% in developed countries. In terms of credit availability, the proportion of people in China who can obtain loans from formal financial institutions is 9.5%, which is only about half the level of it in developed countries. The proportion of people in China’s remote regions that receive loans from formal financial institutions is 7.5%, and the 40% of the poorest population who get loans from formal financial institutions is 5.9%. The relevant index values of developed countries are 17.2% and 17.3%. In particular, some remote and backward regions lack formal financial services, resulting in imbalance of financial supply and demand. The sustainability of China’s financial inclusion is still a matter of concern. Since China’s economic reform and opening up, the unbalanced development strategy was adopted, which helped China to achieve relatively fast economic growth but also resulted in obvious regional economic and financial disparity. The eastern coastal region has experienced high economic growth; however, the central and western regions have become relatively underdeveloped areas. The spatial distribution of economic activity and financial development has been the subject of considerable interest both to policy-makers and to academic researchers. Concerns about the regional disparity have been regularly expressed and policies designed to reduce this disparity have been implemented for social stability and growth sustainability. In China, the key to the sustainable development of financial inclusion lies in balance, which includes both the development balance of different regions in China and the development balance of different dimensions in financial inclusion (that is, structural balance). Therefore, this paper describes the sustainable development of China’s financial inclusion from the perspective of balance and provides some policy suggestions for the government.
The contribution of this paper is shown below. First, there is little (or even a lack of) empirical evidence on the sustainability of financial inclusion development based on the perspective of balance. The study of China’s financial inclusion problems is of great significance to other emerging markets and developing countries. Second, to study the development of financial inclusion in regions more comprehensively and accurately, we have added insurance and securities indicators to the financial inclusion index (FII) based on References [2,4], improving the FII system. Third, this paper first proposes the concept on the Gini coefficient of financial inclusion and measures it. Further, the structural balance of financial inclusion in China is calculated by using the Gini coefficient of financial inclusion dimensions. In general, the gap between financial inclusion developments of regions is gradually narrowing and the structure of China’s financial inclusion tends to be reasonable. Finally, this paper applies a dynamic shift-share model of industrial economics to conduct an empirical analysis. We used this model first to research problems in financial fields and analyze the sustainable development of regions’ financial inclusion.
The rest of this paper is organized as follows. Section 2 includes literature review. Section 3 includes the development balance of financial inclusion in China’s regions. Section 4 presents the Gini coefficient of China’s financial inclusion. In Section 5, empirical analyses are provided. Section 6 presents the conclusions and policy implications.
2. Literature Review
The current research literature about financial inclusion focuses on the following topics. The first research topic focuses on the basic theory and the evaluation of financial inclusion. Financial inclusion is an evolving concept and is a combination of financial development and financial deepening. It has the attributes of being a public good, which can not only help more vulnerable groups to access financial services, but it can also emphasize the affordability of costs [5,6,7]. Digital-based financial inclusion as a form gradually develops, and the digital revolution adds new layers to the material cultures of financial inclusion [8]. At the same time, financial inclusion should be integrated with economic transformation and upgrading, providing everyone with opportunities for sharing benefits of economic development and improving labor productivity [9]. In fact, the development of financial inclusion can also enhance an individual’s financial capabilities [10]. Effective financial inclusion needs to encourage a diversity of institutions (public development banks, community banks, and cooperative banks) to serve the poor [11]. Certainly, there are still some shortcomings in the theoretical analysis of financial inclusion, especially as the weight of the indicator is more subjective [12]. Most studies on the evaluation of financial inclusion have mainly measured the development of financial inclusion in different countries or regions by constructing a financial inclusion index [2,4]. Chakravarty and Pal developed an axiomatic measure to research financial inclusion in India [13]. India’s financial inclusion policies allow poor people to open zero-deposit “no-frill” bank accounts and endeavors to take banking to the doorstep of customers [14]. Rosengard and Prasetyantoko studied constraints to financial inclusion in Indonesia based on two paradoxes of Indonesia’s financial sector [15]. Fifty percent of adults in 148 countries are “banked”—that is, have an account at a formal financial institution—and half of all adults remain unbanked. Systematic indicators of the use of different formal and informal financial services were found lacking for most countries [16]. However, it is more difficult to achieve progress in financial inclusion in rural than in urban areas because of higher transaction costs and higher risks [17].
Second, prior research has studied the influence factors of financial inclusion. Lower account costs, stronger legal guarantees, and stable political environment can enhance financial inclusion in a region [18]. In El Salvador, remittances have a positive impact on financial inclusion by promoting the use of deposit accounts [19]. Barriers to financial inclusion differ with individual characteristics. Higher income, better education, being a man, and being older are associated with greater use of formal accounts and formal credit [6,20,21]. Households with female heads are less inclined to access formal finance and more inclined to access informal finance [22]. On the other hand, in enterprise, female entrepreneurs are no less likely to be financially included in the informal financial markets than their male counterparts [23]. The GDP per capita, income inequality, adult literacy, and urbanization are also important factors to explain a country’s level of financial inclusion [24]. Through the example of Community Development Finance Institutions (CDFIs) in US and UK, Appleyard studied how their activities promote financial inclusion and the impact of geography on financial inclusion [25].
Finally, the third general research topic is the effect of financial inclusion. Fan and Zhang investigated the relationship between financial inclusion and the formation of entrepreneurs, both theoretically and empirically [26]. Sharma used the VAR model and Granger causality test to analyze the relationship between economic development and financial inclusion in India [27]. His results showed that both are positively correlated. Meanwhile, financial inclusion offers incremental and complementary solutions to tackle poverty, to promote inclusive development, and to address Millennium Development Goals [28]. In particular, economic development is associated with the financial inclusion services provided by banks. Financial inclusion contributes positively to financial stability and decreases income inequality in MENA [29]. Financial inclusion also increased the schooling level of daughters and the educational aspirations and expectations parents have for them [30]. Wang and Qiu showed that creating a financial inclusion system and developing inclusive rural financial institutions can further narrow the urban–rural income gap and promote the development of rural finance [31].
3. Development Balance of Financial Inclusion in China’s Regions
3.1. Constructing the Financial Inclusion Index (FII)
According to the region division of China’s national bureau of statistics and considering the geographical and economic factors, this paper divides China into three regions (excluding Hong Kong, Macao, and Taiwan). The eastern region includes provinces such as Hebei, Liaoning, Shanghai, Jiangsu, Zhejiang, Fujian, Shandong, Guangdong, Hainan, Beijing, and Tianjin. The central region includes provinces of Heilongjiang, Anhui, Jiangxi, Henan, Shanxi, Jilin, Hubei, and Hunan. The western region includes provinces like Chongqing, Sichuan, Guizhou, Yunnan, Shaanxi, Gansu, Qinghai, Inner Mongolia, Guangxi, Ningxia, Tibet, and Xinjiang (See Figure 1). Before measuring the development of financial inclusion in China’s three regions, we needed to construct an FII. The construction of the FII needs to reflect the complete connotation and characteristics of financial inclusion, while also facilitating a space–time comparison and dynamic analysis. Beck, Demirguc-Kunt, and Martinez Peria used eight population and geographical dimensions to measure FII [2]. Sarma constructed an FII based on the Human Development Index (HDI) to compare the financial inclusion development of 49 countries [4]. However, the financial service supplier in this FII is single and Sarma does not consider insurance, securities, and other financial services [4]. Moreover, the ratio of bank accounts to population, the size of average deposits, and the ratio of GDP to capital can also be used to measure financial inclusion [32].
Based on existing research, this paper constructs an FII mainly from three dimensions: penetration, availability, and usage. The penetration dimension refers to the coverage of financial institutions and employees and it can be one of the indicators of financial inclusion [33]. It includes both geographic penetration and population penetration. The availability dimension refers to the accessibility of an inclusive financial system to its users. Savings deposit per capita and loans per capita can be used to measure the availability dimension [13]. The usage dimension can be defined as how an inclusive financial system is utilized by its users. Individuals and enterprises engaged in daily financial activities need both banking services and other financial services, such as insurance and securities. As such, this paper adds the insurance and securities indicators to the FII. Table 1 shows the FII. All the data including 2006–2016 are from the regional financial operation report: China Statistical Yearbook, Report on the Development of China’s Securities Industry.
3.2. Method of Measurement
This paper divides the FII into three dimensions: represents the j dimension, .
In this expression, xj represents the actual value of the j dimension. The minimum value of the j dimension is mj and the maximum value of the j dimension is Mj. . When , it shows that the j dimension of financial inclusion develops better in this region.
where represents the weight of the j dimension.
When constructing the FII, the weights should be objective and accurate. Previous studies about weight-setting have used three main approaches: equal weight, the variation coefficient method, and the entropy weight method. In mathematical theory, entropy represents uncertainty. In general, the higher the order degree of the system, the smaller the entropy, and the more contained the information. The entropy weight method is a more scientific and an objective way to calculate weight, and is, therefore, used to measure the weights associated with the FII. The weights are calculated as follows:
where n is the number of regions.
Weight:
After calculating the weight of each dimension, Formula (2) is used to obtain the FII for each region.
3.3. FII: A Weight Analysis
The entropy weight method is used to measure the weight of all FII dimensions. Table 2 presents the results, revealing that the penetration and availability weights are relatively large; the usage weight is the smallest. The mean value of the penetration and availability weights are 0.644 and 0.213; the mean value of the usage weight is only 0.143. The penetration weight increased from 0.402 in 2006 to 0.645 in 2016, showing that the indicators of penetration dimension have an enhanced effect on the development of financial inclusion. The availability and usage weight decreased from 0.379 and 0.219 in 2006 to 0.225 and 0.129 in 2016. In particular, the drop in the weight of the availability dimension is more obvious. The impact of availability and usage on the development of financial inclusion is gradually declining.
When reviewing the specific indicators within three dimensions, the weights associated with the number of banking institutions and securities institutions per 10,000 km2 exceed 0.1 each year, which is higher than other specific indicators. These values show that these two indicators significantly influence financial inclusion. The mean value of the insurance depth weight is the smallest among all the indicators and the drop in it is obvious. Therefore, it has little impact on the development of financial inclusion.
3.4. Comparative Analysis of the FII Dimensions between the Three Regions
Table 3 shows the values of the three dimensions of the FII in China’s eastern, central, and western regions. The development of the penetration dimension in the eastern region is obviously better than that in the central and western regions. In the research period, the financial services penetration in three regions showed an upward trend. Although the development of the financial services availability in the eastern region is better than that in the central and western regions, its development in the central and western regions has been rapid. The development of the usage dimension in the central region is relatively weak, and its development in the western region is better than the central region.
3.5. Comparative Analysis of the Financial Inclusion of the Three Regions
The methods introduced above were used to calculate the FII of the three regions from 2006 to 2016. Table 4 shows the results.
The overall development of China’s financial inclusion significantly improved over time with an upward trend. The mean value of China’s FII was 0.223 in 2006; the FII value increased to 0.496 in 2016. The average growth rate of China’s FII was 8.32% in 2006–2016. From 2006 to 2011, the growth rate of China’s financial inclusion was relatively slow, with an average growth rate of 1.14%. From 2011 to 2016, its growth rate was gradually increasing, with an average growth rate of 16.05%, which is closely related to the strong support given by the Chinese government to financial inclusion. China’s financial inclusion has improved, but the current development level remains low. In 2016, the FII value of 0.496 indicates that there is room for improvement.
At a regional level, the development of financial inclusion was better in the eastern region than in the central and western regions. In 2006, the FII of the eastern region was 0.438; this level was 2.65 times and 6.74 times the FII levels in the central and western regions, respectively. The gap between the eastern and western region was very large. In 2016, the FII of the eastern region was 0.891; this level was 2.64 times and 3.44 times the FII values of the central and western regions, respectively. These results show that the gap gradually decreased from east to west. The provinces and cities with high financial inclusion development are mainly concentrated in the eastern region. The FII values of the eastern region have been high for a long time. The FII of the eastern region reached 0.438 in 2006 and 0.891 in 2016. The average growth rate of financial inclusion in the eastern region was 7.36%, which is lower than the average growth rate of China’s financial inclusion. In 2006, the FIIs of the central and western regions were 0.165 and 0.065, respectively. By 2016, the FII of the central and western regions reached 0.338 and 0.259, respectively. During the same period, the average growth rates of the FII of the central and western regions were 7.43% and 14.83%, respectively. The financial inclusion development of the western region was particularly fast and well above the average level.
4. Structural Balance of China’s Financial Inclusion
4.1. Method
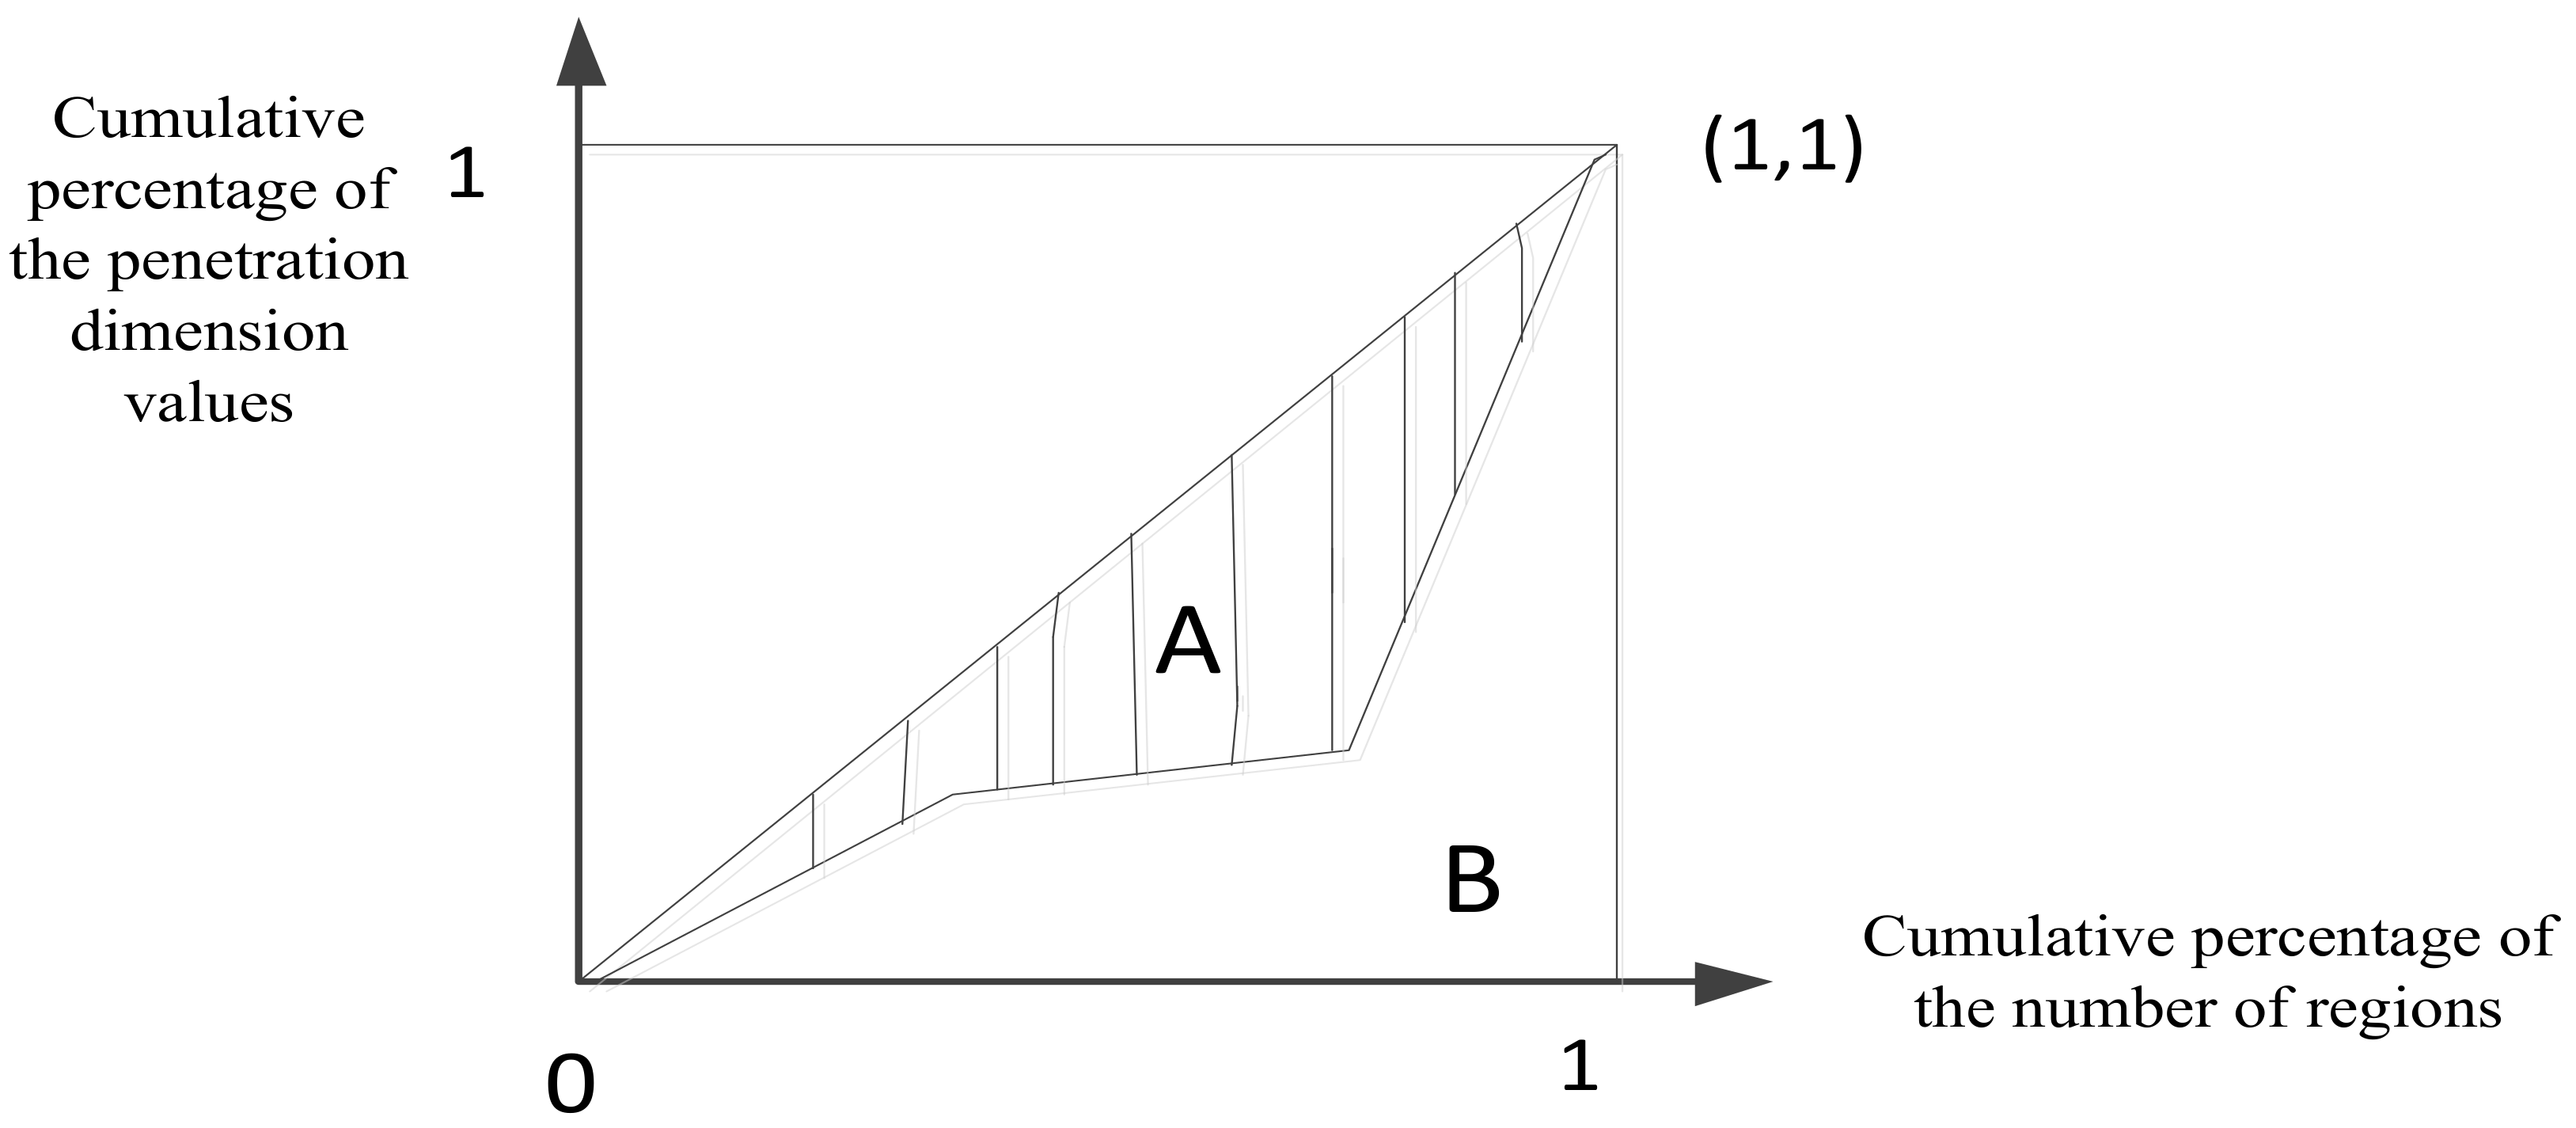
Before studying the structural balance of China’s financial inclusion, we first needed to calculate the Gini coefficient of financial inclusion, which objectively reflects the development gap of financial inclusion between regions. The formula for calculating the Gini coefficient of equal groups and nonequal groups has been reported [34,35]. In order to match the calculation results, the Gini coefficient was calculated based on the ratio of the unequal area and the total unequal area in the Lorentz curve. According to the method used by Reference [36], we needed to calculate the Gini coefficient of all the dimensions of financial inclusion before calculating the structural balance of financial inclusion. In the eastern, central, and western regions of China, the development of financial inclusion includes three aspects: financial service penetration, financial service availability, and the usage of financial service. They are represented by , , , respectively. Taking the penetration of financial services as an example, this paper reports the penetration dimension values of three regions from low to high. The cumulative percentage of the number of regions is the X-axis and the cumulative percentage of penetration dimension values is the Y-axis. We started at the origin and connected each point in order to draw the Lorentz curve, which represents the penetration dimension of financial inclusion (see Figure 2).
The ratio of the area between the Lorenz curve and the 45° line to the area under the 45° line is the Gini coefficient of the penetration dimension. The Gini coefficient is expressed as follows:
After using Formula (8) to calculate the Gini coefficient of the penetration dimension , the availability dimension , and the usage dimension , the structural balance of China’s financial inclusion is defined as:
where represents the weight of each dimension.
4.2. Calculation Results
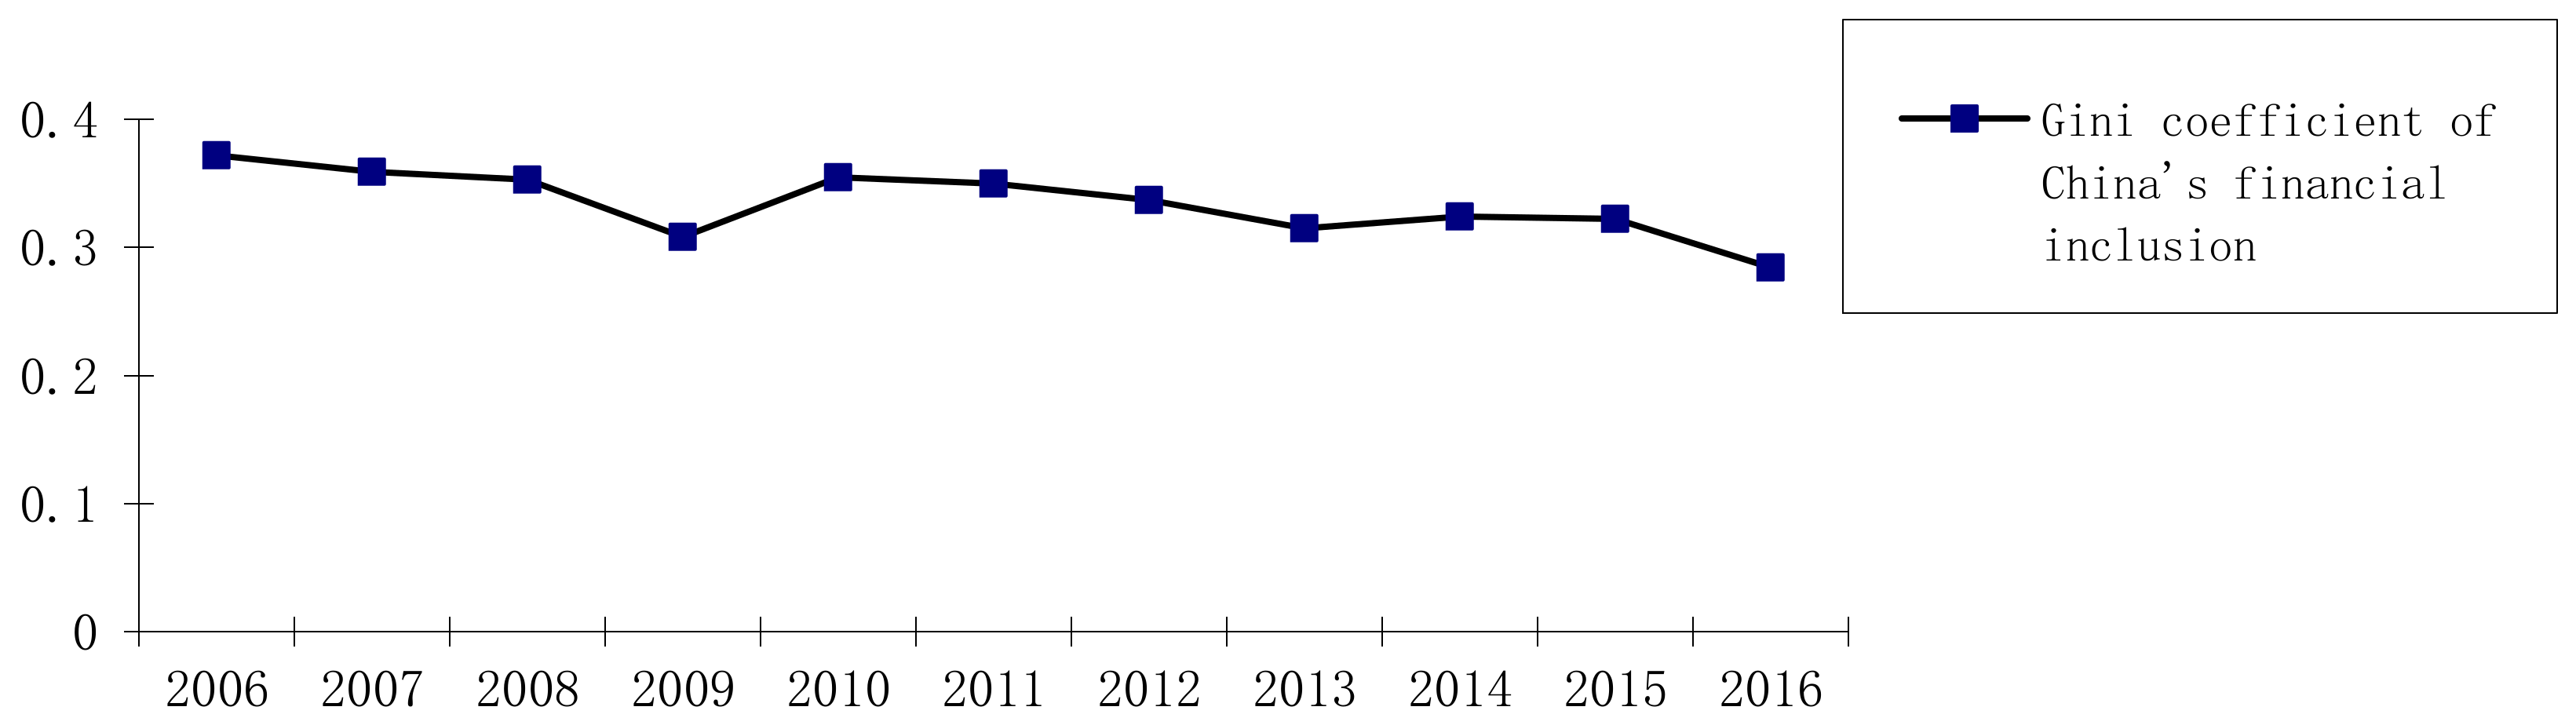
Using the above method, the Gini coefficient of China’s financial inclusion from 2006 to 2016 was measured and the results are shown in Figure 3. It can be seen that the Gini coefficient of China’s financial inclusion shows a significant downward trend in addition to the temporary increases in 2009–2010 and 2013–2014. The Gini coefficient of financial inclusion in China dropped from 0.372 in 2006 to 0.284 in 2016, with a decline of 23.66%. The mean value of it is 0.334, which is within a relatively reasonable and safe range. The shrinking of the Gini coefficient of China’s financial inclusion indicates that the development gap between China’s regions is narrowing gradually and the distribution of financial inclusion resources is reasonable.
We continued to measure the Gini coefficient of the penetration, availability, and usage dimensions in the eastern, central, and western regions. The results are shown in Table 5.
Table 5 shows that the mean value of the Gini coefficient of the usage dimension is the smallest, which indicates that the unbalanced development degree of the usage dimension in the three regions is relatively small and the development of the usage dimension is more balanced. In terms of specific indicators, the insurance depth of the three regions is similar. The mean value of the Gini coefficient of the penetration dimension is largest, which indicates that the development of the penetration dimension in the three regions is unbalanced. Especially the development of the penetration dimension in the eastern region is much higher than that in the central and western regions. In terms of specific indicators, the number of banking institutions and securities institutions in each region is very different, especially in the eastern and western regions. The development of the availability dimension in the central and western regions is similar and, in these regions, the savings deposit per capita and insurance density indicators are similar. The mean value of the Gini coefficient of the three dimensions is within the range of 0.2–0.4, which is relatively safe.
In the research period, the Gini coefficients of the penetration, availability, and usage dimensions have been decreasing. Among three dimensions, the Gini coefficient of the availability dimension decreased most obviously from 0.597 in 2006 to 0.279 in 2016, with a decline of 53.27%. This shows that the development of the availability dimension in China’s regions is gradually balanced. The development trend of the Gini coefficient of the penetration dimension and the usage dimension are similar. The Gini coefficients of the two dimensions from 2006 to 2008 were relatively stable, but they fell sharply from 2008 to 2009. The Gini coefficients of the two dimensions have increased since 2009, but by 2011 they began to decline gradually until 2016. In general, the development of the different dimensions in China’s regional financial inclusion is more balanced.
Table 6 shows the results of the structural balance of China’s financial inclusion. If the structural balance is higher, this means that the development of China’s financial inclusion is unbalanced. There may be a region that only pays attention to the penetration of the financial service and ignores the availability of the financial service. Meanwhile, another region may only be focused on the availability of the financial service, ignoring the penetration of the financial service, resulting in the development of China’s overall financial inclusion being unscientific and imperfect. Seen from Table 6, the structural balance of China’s financial inclusion has declined from 0.406 in 2006 to 0.300 in 2016, with a decrease of 26.11% and an average annual decline of 2.98%. In 2009–2010 and 2013–2015, the structural balance of China’s financial inclusion increased slightly, but the overall trend declined significantly. This situation indicates that the structure of China’s financial inclusion tends to be reasonable and that the development of the three dimensions of financial inclusion in each region is also gradually balanced.
5. Empirical Analysis
5.1. Dynamic Shift-Share Model
In this paper, the dynamic shift-share model is used to further discuss the development balance of China’s regional financial inclusion. This model was first proposed by Daniel and Creamer. Dunn summarizes and perfects this model in [37]. First, the research period is divided into phases; each phase is expressed as m, where . The variables and represent the financial inclusion development of China and China’s regions, respectively. The variables and represent the i dimension of FII of China and
China’s regions in the m + 1 period, respectively. represents the actual growth. . The dynamic shift-share model can be divided into three components: the reference regional component, the structural component, and the competitive component. The model can be expressed as follows:
In Formula (10), the variable Rm+1 represents the growth rate of the FII of China during the m + 1 period; represents the growth rate of the i dimension of China’s FII during the m + 1 period, and represents the growth rate of the i dimension of the regions’ FII during the m + 1 period.
Based on Formula (12), the left side of the equation is the total shift component, which is equal to the sum of the structure and competitiveness components. The expression refers to the reference regional component and also represents the value added. The expression represents the structural component and the expression represents the competitive component.
5.2. Empirical Results
We put three regions’ FIIs, which were already measured from 2006 to 2016, into the dynamic shift-share model. The model results are shown in Table 7, Table 8 and Table 9 (Due to space limitations, Table 7, Table 8 and Table 9 only gives results for 6 years. Readers can ask the corresponding author for results on the other years.).
5.3. Results
Overall, the average actual growth of the financial service penetration in China’s eastern, central, and western regions are positive, indicating that the financial service penetration of three regions shows a better development trend. In particular, the average actual growth of the financial service penetration in the eastern region is the largest, followed by the western region and the central region. Furthermore, the growth path of the penetration dimension in the eastern and western regions was similar from 2006 to 2013. From 2013 to 2016, the growth path in the eastern and central regions was similar. Looking at the structural components of the three regions, we find that the mean values of the structural components of the penetration dimensions in the three regions are negative. This means that the penetration dimension is at a structural disadvantage. The growth rate of the penetration dimension is lower than the overall growth rate of China’s FII, which has not played a positive role in promoting the development of financial inclusion. To observe the competitive component, the mean value of the penetration dimension in the western region is the largest, while the eastern region has the smallest competitive component. Financial service penetration in the western region has a certain competitive advantage over the central and eastern regions. Compared with the absolute value of the structural component and the competitive component, the competitive component is larger than the structural component, showing that the competitive factor is the main factor that determines the development of the financial service penetration.
In the availability dimension, the development of the financial service availability in the central and western regions is relatively close. At the same time, the average structural component of the availability dimension in the three regions is positive, suggesting that the availability dimension is at a structural advantage and that it can play a positive role in promoting the development of financial inclusion. Besides, the structural factors contribute more to the growth of the availability dimension than competitive factors. The development of the availability dimension in the three regions mainly benefits from the growth effect of the structural components. Compared with the eastern region, the availability dimension in the central and western regions has a certain competitive advantage.
Compared with the financial service penetration and the financial service availability, the development gap of the financial service usage in the three regions is small and they present a similar development path, which is similar to the shape of the letter “M”. The average actual growth of the usage dimension in the eastern region is the largest, and the average actual growth in the central and western regions is close. In the structural components, the mean values of the structural components in the three regions are all positive. The average structural component of the eastern region is the highest, followed by the western region and the central region. The usage and availability of financial services are at structural advantages, which can promote the development of financial inclusion. The usage dimension in the central region developed relatively smoothly and there was no great fluctuation, but the volatility of the usage dimension in the eastern and western regions is fluctuating.
5.4. Robustness Test
Table 10 shows the chi-squared test to compare differences in the development of financial inclusion’s dimensions between regions. Table 11 shows the chi-squared test to compare differences in each region’s components. Table 12 shows spatial correlation between the developments of region’s financial inclusion. It can be seen that the actual growth and competitive components of penetration dimension between regions are significantly different. The development of penetration dimension of financial inclusion differs in three regions. The structural components of eastern region’s three dimensions are significantly different. The developments of three dimensions of eastern region’s financial inclusion are quite different. The results are consistent with the previous analysis. Furthermore, there is no spatial correlation between the developments of financial inclusion in three regions at 0.01 significant levels. The interdependence of the development between regions’ financial inclusion is not obvious. The results are shown below.
6. Conclusions and Policy Implications
In recent years, research on financial inclusion has attracted more attention. This paper discusses the sustainable development of China’s financial inclusion from the perspective of balance. First, in order to comprehensively reflect the level of development of financial inclusion in different regions, financial services such as securities and insurance were added to the construction of the FII, and we used the entropy weight method to calculate the FII in these regions from 2006 to 2016. The results showed that China’s FII has increased greatly, presenting a rising trend. From east to west, FII is declining and the development level of financial inclusion in the eastern region is better than that of the central and western regions. However, the development speed of financial inclusion in the central and western regions was relatively fast, especially in the western region, with an average growth rate of 14.83%. In terms of the dimensions, there are some differences in the three regions. In the penetration dimension, the eastern region is developing well, and the western region develops relatively weak. In the availability dimension, the development paths of the central and western regions are similar and they are in a “catch-up” situation. In the usage dimension, the central region is relatively weak, which is inferior to the western region. The gap between the usage dimensions in the three regions is narrowing.
Second, this paper defines the concept of the Gini coefficient of financial inclusion and uses it to calculate the structural balance of China’s financial inclusion. From 2006 to 2016 there was a significant decline in the Gini coefficient of China’s financial inclusion, from 0.372 in 2006 to 0.284 in 2016, with a decline of 23.66% and the mean value of 0.334. The decline of the Gini coefficient indicates that the development of financial inclusion in China is gradually balanced and the gap between regions’ financial inclusion is narrowing. At the same time, the Gini coefficients of the three dimensions in financial inclusion are also slowly declining in the research period and the decline of the availability dimension’s Gini coefficient was the most obvious. The Gini coefficient of the usage dimension is the least and the Gini coefficient of the penetration dimension is the largest, suggesting that financial service penetration is the most unbalanced development among China’s regions. The structural balance of China’s financial inclusion decreased from 0.406 in 2006 to 0.300 in 2016. Although there was a slight increase in 2009–2010 and 2013–2015, overall, the structural balance of China’s financial inclusion is gradually decreasing, and the structure of China’s financial inclusion tends to be reasonable.
In the end, this paper uses the dynamic shift-share model to make an empirical analysis. The results show that in the eastern, central, and western regions, the penetration dimension is at a structural disadvantage and the availability and usage dimensions are at a structural advantage. The availability and usage of the financial services play an important role in promoting the development of financial inclusion. In the penetration dimension, the competitive factor contributes more to the development of financial service penetration than the structural factor. In the availability dimension, the structural factor contributes more to the growth of the financial service availability than the competitive factor. Compared with the eastern region, the financial service availability in the central and western regions has competitive advantages and, in the meantime, the development gap of the financial service usage is the smallest and the development path is similar to the shape of the letter “M”.
In terms of policy implications, this paper shows that, at present, there is an imbalance in the development of China’s financial inclusion, in both the regional and dimensional aspects. This imbalance will cause some harm to the sustainable development of China’s financial inclusion. However, this imbalance is gradually being eliminated and the unbalanced development gap is also gradually narrowing. The structure of China’s financial inclusion is becoming more reasonable. In the future, starting from the availability and usage of financial service, the government can make full use of their structural advantages and establish a more balanced and scientific development mechanism about financial inclusion. This will eventually improve the financial inclusion system and promote the sustainable development of China’s financial inclusion.
The study used regional data to measure the balance of China’s financial inclusion. In the future, to further understand sustainable development of China’s financial inclusion, more studies need to be carried out to expand the data scope and use data that includes provinces and cities. Furthermore, the influence factors of Gini coefficient of financial inclusion and the effect of financial inclusion policy on the development of financial inclusion can be analyzed.
Acknowledgments
We appreciate the referees and the editors for their valuable comments. The research is supported by the Fundamental Research Funds for the Central Universities of China from Hunan University.
Authors’ Contributions
Bao Zhu: study concept, design, data analysis, and article writing; Jing He: the literature review and article writing; Shiting Zhai: the literature review.
Conflicts of Interest
The authors declare no conflicts of interest.
References
- Jeanneney, S.G.; Kpodar, K. Financial development and poverty reduction: Can there be a benefit without a cost? J. Dev. Stud. 2011, 47, 143–163. [Google Scholar] [CrossRef]
- Beck, T.; Demirguc-Kunt, A.; Martinez Peria, M.S. Reaching out: Access to and use of banking services across countries. J. Financ. Econ. 2007, 85, 234–266. [Google Scholar] [CrossRef]
- Beck, T.; Demirguc-Kunt, A.; Levine, R. Finance, Inequality, and the Poor. J. Econ. Growth 2007, 12, 27–49. [Google Scholar] [CrossRef]
- Sarma, M. Index of Financial Inclusion; ICRIER Working Paper, No. 215; ICRIER: New Delhi, India, 2008. [Google Scholar]
- Beck, T.; Senbet, L.; Simbanegavi, W. Financial Inclusion and Innovation in Africa: An Overview. J. Afr. Econ. 2015, 24, i3–i11. [Google Scholar] [CrossRef]
- Cnaan, R.A.; Moodithaya, M.S.; Handy, F. Financial Inclusion: Lessons from Rural South India. J. Soc. Policy 2012, 41, 183–205. [Google Scholar] [CrossRef]
- Peachey, S.; Roe, A. Access to Finance: What Does it Mean and How Do Savings Banks Foster Access? No. 49; World Savings Banks Institute: Amsterdam, The Netherlands, 2006. [Google Scholar]
- Gabor, D.; Brooks, S. The digital revolution in financial inclusion: international development in the fintech era. New Political Econ. 2017, 22, 423–436. [Google Scholar] [CrossRef]
- Peng, J.G.; Zhu, B. Strategic Thinking of Exploitation-oriented Inclusive Finance under the vision of Developed Economics. Theory Pract. Financ. Econ. 2017, 38, 2–7. [Google Scholar]
- Figart, D.M. Institutionalist Policies for Financial Inclusion. J. Econ. Issues 2013, 47, 873–894. [Google Scholar] [CrossRef]
- Ghosh, J. Microfinance and the challenge of financial inclusion for development. Camb. J. Econ. 2013, 37, 1203–1219. [Google Scholar] [CrossRef]
- Wang, X.H.; Guan, J. Financial inclusion: Measurement, spatial effects and influencing factors. Appl. Econ. 2017, 49, 1–12. [Google Scholar] [CrossRef]
- Chakravarty, S.R.; Pal, R. Financial inclusion in India: An axiomatic approach. J. Policy Model. 2013, 35, 813–837. [Google Scholar] [CrossRef]
- Kapoor, A. Financial inclusion and the future of the Indian economy. Futures 2014, 56, 35–42. [Google Scholar] [CrossRef]
- Rosengard, J.K.; Prasetyantoko, A. If the Banks are Doing So Well, Why Can’t I Get a Loan? Regulatory Constraints to Financial Inclusion in Indonesia. Asian Econ. Policy Rev. 2011, 6, 273–296. [Google Scholar] [CrossRef] [Green Version]
- Demirgüç-Kunt, A.; Klapper, L. Measuring Financial Inclusion: Explaining Variation in Use of Financial Services across and within Countries. Brook. Pap. Econ. Act. 2013, 44, 279–321. [Google Scholar] [CrossRef]
- Lopez, T.; Winkler, A. The challenge of rural financial inclusion—Evidence from microfinance. Appl. Econ. 2018, 50, 1555–1577. [Google Scholar] [CrossRef]
- Allen, F.; Demirguc-Kunt, A.; Klapper, L.; Peria, M.S.M. The foundations of financial inclusion: Understanding ownership and use of formal accounts. J. Financ. Intermed. 2016, 27, 1–30. [Google Scholar] [CrossRef]
- Anzoategui, D.; Demirgüç-Kunt, A.; Pería, M.S.M. Remittances and Financial Inclusion: Evidence from El Salvador. World Dev. 2014, 54, 338–349. [Google Scholar] [CrossRef]
- Zins, A.; Weill, L. The determinants of financial inclusion in Africa. Rev. Dev. Finance 2016, 6, 46–57. [Google Scholar] [CrossRef]
- Fungáčová, Z.; Weill, L. Understanding financial inclusion in China. China Econ. Rev. 2015, 34, 196–206. [Google Scholar] [CrossRef]
- Ghosh, S.; Vinod, D. What Constrains Financial Inclusion for Women? Evidence from Indian Micro data. World Dev. 2017, 92, 60–81. [Google Scholar] [CrossRef]
- Kairiza, T.; Kiprono, P.; Magadzire, V. Gender differences in financial inclusion amongst entrepreneurs in Zimbabwe. Small Bus. Econ. 2017, 48, 259–272. [Google Scholar] [CrossRef]
- Sarma, M.; Pais, J. Financial Inclusion and Development. J. Int. Dev. 2011, 23, 613–628. [Google Scholar] [CrossRef]
- Appleyard, L. Community Development Finance Institutions (CDFIs): Geographies of financial inclusion in the US and UK. Geoforum 2011, 42, 250–258. [Google Scholar] [CrossRef]
- Fan, Z.; Zhang, R. Financial Inclusion, Entry Barriers, and Entrepreneurship: Evidence from China. Sustainability 2007, 9, 203. [Google Scholar] [CrossRef]
- Sharma, D. Nexus between financial inclusion and economic growth: Evidence from the emerging Indian economy. J. Financ. Econ. Policy 2016, 8, 13–36. [Google Scholar] [CrossRef]
- Chibba, M. Financial Inclusion, Poverty Reduction and the Millennium Development Goals. Eur. J. Dev. Res. 2009, 21, 213–230. [Google Scholar] [CrossRef]
- Neaime, S.; Gaysset, I. Financial Inclusion and Stability in MENA: Evidence from Poverty and Inequality. Financ. Res. Lett. 2018, 24, 230–237. [Google Scholar] [CrossRef]
- Chiapa, C.; Prina, S.; Parker, A. The Effects of Financial Inclusion on Children’s Schooling, and Parental Aspirations and Expectations. J. Int. Dev. 2015, 28, 683–696. [Google Scholar] [CrossRef]
- Wang, X.H.; Qiu, Z.X. The influence mechanism of rural finance development on urban-rural income gap. Econ. Perspect. 2011, 52, 71–75. [Google Scholar]
- Honohan, P. Cross-country variation in household access to financial services. J. Bank. Finance 2008, 32, 2493–2500. [Google Scholar] [CrossRef]
- Honohan, P. Measuring Microfinance Access: Building on Existing Cross-Country Data; World Bank Policy Research Working Paper, No. 3606; World Bank: Washington, DC, USA, 2005. [Google Scholar]
- Angus, D. The Analysis of Household Surveys: A Microeconomic Approach to Development Policy; Johns Hopkins University Press: Baltimore, MD, USA; London, UK, 1997. [Google Scholar]
- Vinod, T.; Wang, Y.; Fan, X.B. Measuring Education Inequality: Gini Coefficients of Education; World Bank Policy Research Working Paper, No. WPS2525; World Bank Group: Washington, DC, USA, 2000. [Google Scholar]
- Yang, X.K. The Basis of Mathematical Economics; National Defence Industry Press: Beijing, China, 1985. [Google Scholar]
- Dunn, E.S. A Statistical and Analytical Technique for Regional Analysis. Pap. Reg. Sci. Assoc. 1960, 6, 97–112. [Google Scholar] [CrossRef]
Figure 1.
The three regions in China.
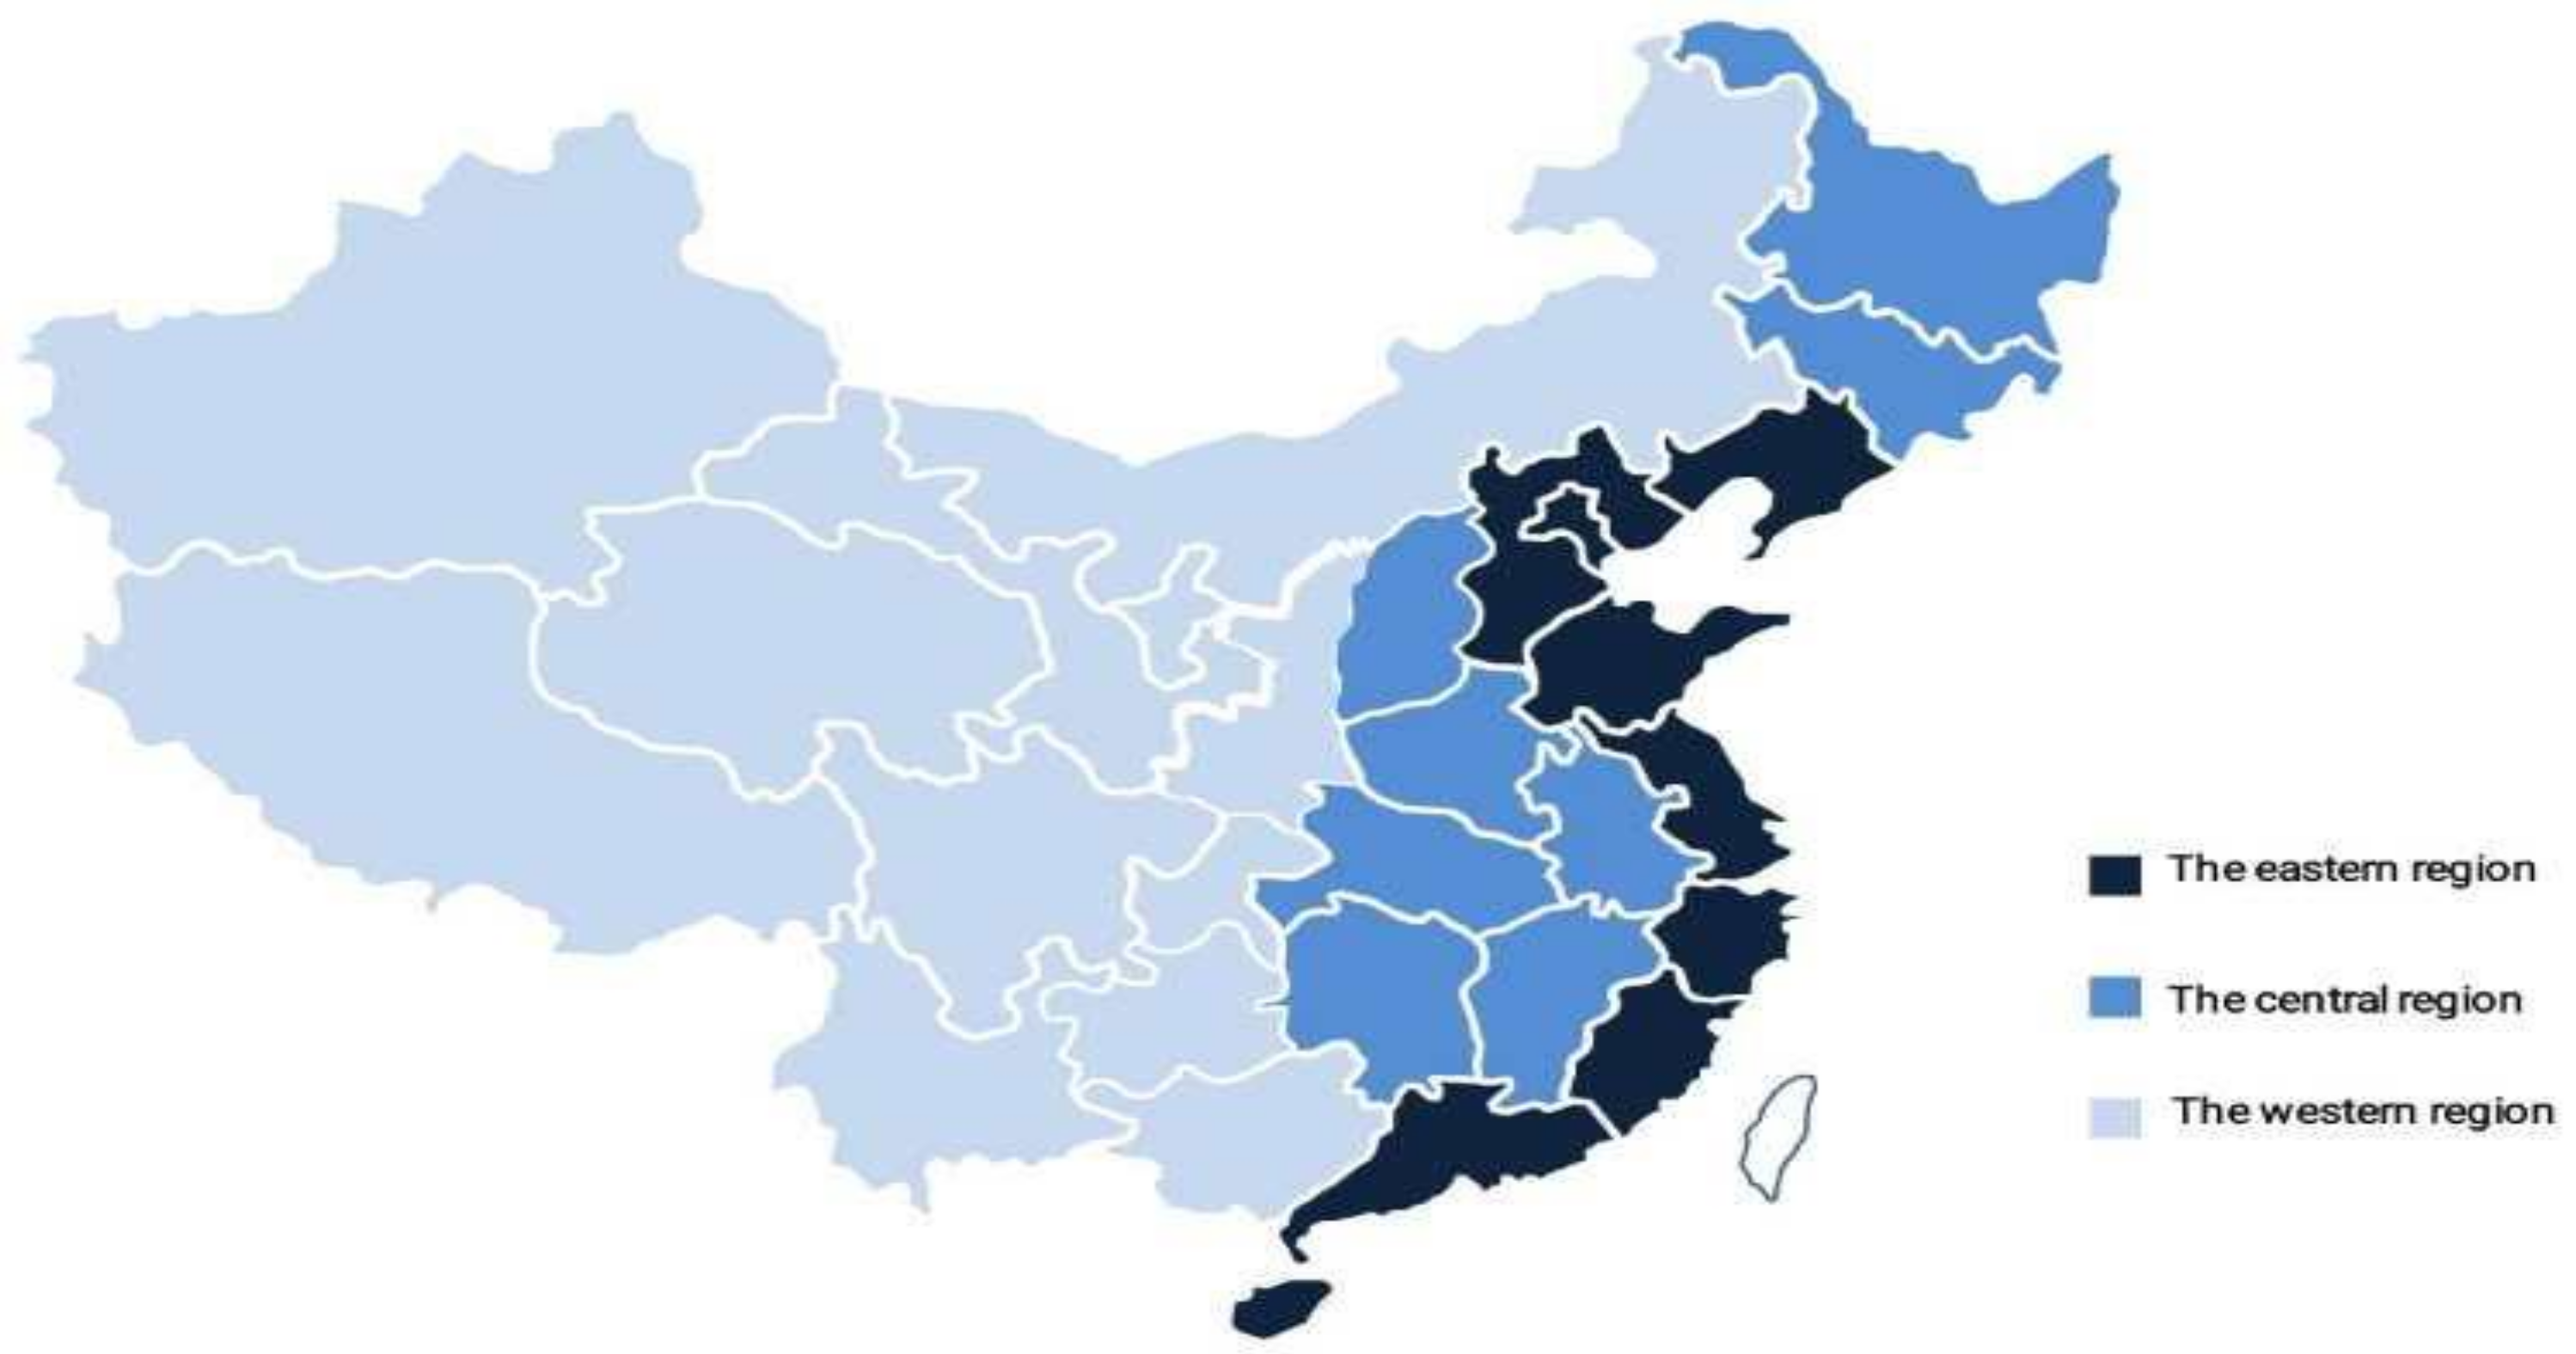
Figure 2.
The Gini coefficient of the penetration dimension in financial inclusion.

Figure 3.
The Gini coefficient of financial inclusion in China.


Table 1.
Financial inclusion index.
| Dimensions | Indicators | Calculation Method |
|---|---|---|
| Penetration | Number of banking institutions per 10,000 people | Total number of banking institutions/population |
| Number of bank employees per 10,000 people | Total number of bank employees/population | |
| Number of securities per 10,000 people | Total number of securities/population | |
| Number of insurance institutions per 10,000 people | Total number of insurance institutions/population | |
| Number of banking institutions per 10,000 square km | Total number of banking institutions/area | |
| Number of bank employees per 10,000 square km | Total number of bank employees/area | |
| Number of securities per 10,000 square km | Total number of securities/area | |
| Number of insurance institutions per 10,000 square km | Total number of insurance institutions/area | |
| Availability | Savings deposit per capita | Savings deposit/population |
| Loans per capitaSecurities trading per capita | Loan/populationSecurities trading/population | |
| Insurance density | Premium income/population | |
| Usage | Deposit ratio | Deposit/GDP |
| Loan ratio proportion of securities trading amount to GDP | Loan/GDPSecurities trading/GDP | |
| Insurance depth | Premium income/GDP |
Table 2.
The weight of the financial inclusion index (FII) dimensions.
| Dimensions | 2006 | 2007 | 2008 | 2009 | 2010 | 2011 |
|---|---|---|---|---|---|---|
| Penetration | 0.402 | 0.583 | 0.657 | 0.676 | 0.729 | 0.655 |
| Availability | 0.379 | 0.266 | 0.186 | 0.231 | 0.171 | 0.178 |
| Usage | 0.219 | 0.152 | 0.157 | 0.093 | 0.099 | 0.167 |
| Dimensions | 2012 | 2013 | 2014 | 2015 | 2016 | Mean |
| Penetration | 0.642 | 0.663 | 0.691 | 0.737 | 0.645 | 0.644 |
| Availability | 0.178 | 0.182 | 0.183 | 0.167 | 0.225 | 0.213 |
| Usage | 0.181 | 0.155 | 0.126 | 0.095 | 0.129 | 0.143 |
Table 3.
The values of the FII dimensions between the three regions.*.
| Penetration | 2006 | 2009 | 2012 | 2014 | 2016 | Mean |
|---|---|---|---|---|---|---|
| Eastern | 0.380 | 0.411 | 0.365 | 0.496 | 0.548 | 0.426 |
| Central | 0.158 | 0.180 | 0.108 | 0.181 | 0.219 | 0.153 |
| Western | 0.045 | 0.075 | 0.056 | 0.075 | 0.121 | 0.067 |
| Availability | 2006 | 2009 | 2012 | 2014 | 2016 | Mean |
| Eastern | 0.021 | 0.054 | 0.077 | 0.120 | 0.207 | 0.088 |
| Central | 0.001 | 0.013 | 0.025 | 0.040 | 0.066 | 0.027 |
| Western | 0.001 | 0.013 | 0.028 | 0.040 | 0.065 | 0.027 |
| Usage | 2006 | 2009 | 2012 | 2014 | 2016 | Mean |
| Eastern | 0.037 | 0.067 | 0.059 | 0.081 | 0.136 | 0.072 |
| Central | 0.006 | 0.022 | 0.013 | 0.026 | 0.052 | 0.022 |
| Western | 0.019 | 0.039 | 0.032 | 0.045 | 0.072 | 0.039 |
* Due to space limitations, Table 3 only gives results for 5 years. Readers can ask the corresponding author for results on the other years.
Table 4.
FII of three regions in 2006–2016.
| 2006 | 2007 | 2008 | 2009 | 2010 | 2011 | |
|---|---|---|---|---|---|---|
| Eastern | 0.438 | 0.504 | 0.479 | 0.532 | 0.483 | 0.471 |
| Central | 0.165 | 0.167 | 0.176 | 0.215 | 0.129 | 0.136 |
| Western | 0.065 | 0.092 | 0.086 | 0.128 | 0.102 | 0.100 |
| 2012 | 2013 | 2014 | 2015 | 2016 | Mean | |
| Eastern | 0.501 | 0.564 | 0.697 | 0.893 | 0.891 | 0.587 |
| Central | 0.146 | 0.175 | 0.247 | 0.313 | 0.338 | 0.201 |
| Western | 0.115 | 0.146 | 0.160 | 0.208 | 0.259 | 0.133 |
Table 5.
The Gini coefficients of the different dimensions of financial inclusion.
| Dimension | 2006 | 2007 | 2008 | 2009 | 2010 | 2011 | 2012 | 2013 |
|---|---|---|---|---|---|---|---|---|
| Penetration | 0.383 | 0.372 | 0.371 | 0.336 | 0.426 | 0.402 | 0.390 | 0.365 |
| Availability | 0.597 | 0.460 | 0.383 | 0.340 | 0.297 | 0.278 | 0.265 | 0.265 |
| Usage | 0.334 | 0.326 | 0.324 | 0.233 | 0.238 | 0.303 | 0.295 | 0.266 |
| Dimension | 2014 | 2015 | 2016 | Max | Min | Median | Mean | Standard Deviation |
| Penetration | 0.373 | 0.381 | 0.321 | 0.426 | 0.321 | 0.373 | 0.374 | 0.029 |
| Availability | 0.267 | 0.281 | 0.279 | 0.597 | 0.265 | 0.281 | 0.337 | 0.106 |
| Usage | 0.239 | 0.219 | 0.215 | 0.334 | 0.215 | 0.266 | 0.272 | 0.046 |
Table 6.
The structural balance of China’s financial inclusion.
| 2006 | 2007 | 2008 | 2009 | 2010 | 2011 | |
|---|---|---|---|---|---|---|
| Structural balance | 0.406 | 0.378 | 0.366 | 0.322 | 0.382 | 0.371 |
| 2012 | 2013 | 2014 | 2015 | 2016 | Mean | |
| Structural balance | 0.359 | 0.337 | 0.340 | 0.344 | 0.300 | 0.355 |
Table 7.
The results of the dynamic shift-share model in the eastern region. Unit (×102).
| Dimensions | Component | 2008 | 2010 | 2012 | 2014 | 2015 | 2016 |
|---|---|---|---|---|---|---|---|
| Penetration | Actual growth | −1.876 | −5.877 | 1.736 | 9.849 | 7.816 | −2.569 |
| Total shift | 3.912 | −1.202 | −5.138 | −4.491 | −10.904 | −8.707 | |
| Reference | −5.788 | −4.675 | 6.874 | 14.340 | 18.720 | 6.138 | |
| Structure | 0.273 | −4.647 | 0.189 | 1.439 | −8.394 | 0.916 | |
| Competitiveness | 3.639 | 3.445 | −5.327 | −5.930 | −2.510 | −9.623 | |
| Availability | Actual growth | 0.269 | 0.994 | 0.906 | 2.274 | 6.793 | 1.965 |
| Total shift | 0.776 | 1.607 | −0.438 | −1.224 | 2.275 | −0.041 | |
| Reference | −0.507 | −0.613 | 1.344 | 3.498 | 4.518 | 2.006 | |
| Structure | 1.361 | 2.501 | −0.012 | −0.794 | 3.562 | −0.133 | |
| Competitiveness | −0.585 | −0.894 | −0.426 | −0.430 | −1.287 | 0.092 | |
| Usage | Actual growth | −0.836 | 0.013 | 0.342 | 1.109 | 4.993 | 0.498 |
| Total shift | −0.119 | 0.772 | −0.76 | −1.411 | 1.937 | −0.901 | |
| Reference | −0.717 | −0.759 | 1.102 | 2.520 | 3.056 | 1.399 | |
| Structure | −1.568 | 0.657 | −0.168 | −0.508 | 4.662 | −0.693 | |
| Competitiveness | 1.449 | 0.115 | −0.592 | −0.903 | −2.725 | −0.208 |
Table 8.
The results of the dynamic shift-share model in the central region. Unit (×102).
| Dimensions | Component | 2008 | 2010 | 2012 | 2014 | 2015 | 2016 |
|---|---|---|---|---|---|---|---|
| Penetration | Actual growth | 0.823 | −9.066 | 0.424 | 5.607 | 2.363 | 1.530 |
| Total shift | 2.940 | −7.016 | −1.627 | 1.115 | −4.453 | −0.653 | |
| Reference | −2.117 | −2.050 | 2.052 | 4.492 | 6.816 | 2.183 | |
| Structure | 0.100 | −2.037 | 0.057 | 0.451 | −3.056 | 0.326 | |
| Competitiveness | 2.840 | −4.979 | −1.684 | 0.664 | −1.397 | −0.979 | |
| Availability | Actual growth | 0.298 | 0.528 | 0.409 | 0.844 | 1.946 | 0.667 |
| Total shift | 0.373 | 0.679 | −0.013 | −0.306 | 0.424 | 0.028 | |
| Reference | −0.075 | −0.151 | 0.422 | 1.150 | 1.522 | 0.639 | |
| Structure | 0.202 | 0.615 | −0.004 | −0.261 | 1.200 | −0.042 | |
| Competitiveness | 0.171 | 0.064 | −0.009 | −0.045 | −0.776 | 0.070 | |
| Usage | Actual growth | −0.229 | −0.083 | 0.151 | 0.747 | 2.317 | 0.259 |
| Total shift | −0.094 | 0.167 | −0.002 | 0.066 | 1.323 | −0.271 | |
| Reference | −0.135 | −0.250 | 0.227 | 0.681 | 0.994 | 0.530 | |
| Structure | −0.295 | 0.217 | −0.035 | −0.137 | 1.517 | −0.262 | |
| Competitiveness | 0.201 | −0.050 | −0.041 | 0.203 | −0.194 | −0.009 |
Table 9.
The results of the dynamic shift-share model in the western region. Unit (×102).
| Dimensions | Component | 2008 | 2010 | 2012 | 2014 | 2015 | 2016 |
|---|---|---|---|---|---|---|---|
| Penetration | Actual growth | −0.770 | −3.270 | 0.850 | 0.303 | 0.690 | 3.904 |
| Total shift | 0.115 | −2.412 | −0.081 | −2.297 | −2.145 | 3.027 | |
| Reference | −0.885 | −0.858 | 0.931 | 2.600 | 2.835 | 0.877 | |
| Structure | 0.042 | −0.853 | 0.026 | 0.261 | −1.271 | 0.131 | |
| Competitiveness | 0.073 | −1.559 | −0.107 | −2.558 | −0.874 | 2.896 | |
| Availability | Actual growth | 0.305 | 0.619 | 0.480 | 0.457 | 1.911 | 0.657 |
| Total shift | 0.367 | 0.767 | 0.030 | −0.808 | 0.415 | 0.029 | |
| Reference | −0.062 | −0.148 | 0.450 | 1.265 | 1.496 | 0.628 | |
| Structure | 0.167 | 0.604 | −0.004 | −0.287 | 1.180 | −0.042 | |
| Competitiveness | 0.200 | 0.163 | 0.034 | −0.521 | −0.765 | 0.071 | |
| Usage | Actual growth | −0.124 | 0.099 | 0.167 | 0.621 | 2.235 | 0.448 |
| Total shift | 0.214 | 0.545 | −0.431 | −0.791 | 0.524 | −0.276 | |
| Reference | −0.338 | −0.446 | 0.598 | 1.412 | 1.711 | 0.724 | |
| Structure | −0.739 | 0.386 | −0.091 | −0.284 | 2.610 | −0.358 | |
| Competitiveness | 0.953 | 0.159 | −0.340 | −0.507 | −2.086 | 0.082 |
Table 10.
Chi-square test results in three region’s dimensions.
| Actual Growth | Chi-Square | Asymp.sig |
|---|---|---|
| Penetration | 26.324 | 0.05 |
| Availability | 4.717 | 0.999 |
| Usage | 1.784 | 1.000 |
| Reference component | Chi-Square | Asymp.sig |
| Penetration | 1.828 | 1.000 |
| Availability | 3.529 | 1.000 |
| Usage | 5.091 | 0.985 |
| Structural component | Chi-Square | Asymp.sig |
| Penetration | 0.735 | 0.999 |
| Availability | 2.489 | 0.991 |
| Usage | 1.286 | 0.996 |
| Competitive component | Chi-Square | Asymp.sig |
| Penetration | 19.898 | 0.03 |
| Availability | 0.000 | 1.000 |
| Usage | 0.75 | 1.000 |
Table 11.
Chi-square test results in each region’s components.
| Eastern Region | Chi-Square | Asymp.sig |
|---|---|---|
| Actual growth | 15.533 | 0.625 |
| Reference component | 4.412 | 0.992 |
| Structural component | 49.848 | 0.000 |
| Competitive component | 4.371 | 0.627 |
| Central region | Chi-Square | Asymp.sig |
| Actual growth | 9.394 | 0.95 |
| Reference component | 10.128 | 0.753 |
| Structural component | 12.267 | 0.833 |
| Competitive component | 0.000 | 1.000 |
| Western region | Chi-Square | Asymp.sig |
| Actual growth | 12.272 | 0.833 |
| Reference component | 3.653 | 0.997 |
| Structural component | 21.795 | 0.241 |
| Competitive component | 5.000 | 0.958 |
Table 12.
Spatial correlation of the development of financial inclusion between regions.
| Penetration | |||||
| Moran’I | I | E(I) | Sd(I) | z | p-value |
| Actual growth | −0.007 | −0.034 | 0.045 | 0.620 | 0.535 |
| Reference component | −0.020 | −0.034 | 0.046 | 0.308 | 0.758 |
| Structural component | −0.002 | −0.034 | 0.045 | 0.717 | 0.474 |
| Competitive component | −0.018 | −0.034 | 0.046 | 0.359 | 0.720 |
| Availability | |||||
| Moran’I | I | E(I) | Sd(I) | z | p-value |
| Actual growth | −0.053 | −0.034 | 0.036 | −0.519 | 0.604 |
| Reference component | −0.060 | −0.034 | 0.045 | −0.565 | 0.572 |
| Structural component | −0.04 | −0.034 | 0.044 | −0.126 | 0.900 |
| Competitive component | −0.090 | −0.034 | 0.043 | −1.296 | 0.195 |
| Usage | |||||
| Moran’I | I | E(I) | Sd(I) | z | p-value |
| Actual growth | −0.013 | −0.034 | 0.044 | 0.479 | 0.632 |
| Reference component | −0.126 | −0.034 | 0.046 | −1.967 | 0.049 |
| Structural component | −0.025 | −0.034 | 0.044 | 0.217 | 0.829 |
| Competitive component | −0.069 | −0.034 | 0.042 | 0.835 | 0.404 |
© 2018 by the authors. Licensee MDPI, Basel, Switzerland. This article is an open access article distributed under the terms and conditions of the Creative Commons Attribution (CC BY) license (http://creativecommons.org/licenses/by/4.0/).
Share and Cite
MDPI and ACS Style
Zhu, B.; Zhai, S.; He, J. Is the Development of China’s Financial Inclusion Sustainable? Evidence from a Perspective of Balance. Sustainability 2018, 10, 1200. https://doi.org/10.3390/su10041200
AMA Style
Zhu B, Zhai S, He J. Is the Development of China’s Financial Inclusion Sustainable? Evidence from a Perspective of Balance. Sustainability. 2018; 10(4):1200. https://doi.org/10.3390/su10041200
Chicago/Turabian StyleZhu, Bao, Shiting Zhai, and Jing He. 2018. "Is the Development of China’s Financial Inclusion Sustainable? Evidence from a Perspective of Balance" Sustainability 10, no. 4: 1200. https://doi.org/10.3390/su10041200
Note that from the first issue of 2016, this journal uses article numbers instead of page numbers. See further details here.