Next Article in Journal
Research on Digital Forensic Readiness Design in a Cloud Computing-Based Smart Work Environment
Previous Article in Journal
A Self-Scrutinized Backoff Mechanism for IEEE 802.11ax in 5G Unlicensed Networks
 
 
Correction published on 31 October 2018, see Sustainability 2018, 10(11), 3987.
Article

Dynamic Analysis of Ecological Environment Quality Combined with Water Conservation Changes in National Key Ecological Function Areas in China

1
Institute of Geographic Sciences and Natural Resources Research, Chinese Academy of Sciences, Beijing 100101, China
2
College of Resources and Environment, University of the Chinese Academy of Sciences, Beijing 100049, China
3
China Aerospace Science & Industry Academy of Information Technology, Beijing 100070, China
4
Beijing Municipal Research Institute of Environmental Protection, Beijing 100037, China
5
Faculty of Geographical Science, Beijing Normal University, Beijing 100875, China
*
Author to whom correspondence should be addressed.
Sustainability 2018, 10(4), 1202; https://doi.org/10.3390/su10041202
Submission received: 15 March 2018 / Revised: 5 April 2018 / Accepted: 5 April 2018 / Published: 16 April 2018

Abstract

:
The shortage of water resources is a key factor limiting the sustainability of the economy and society. Most of the 25 National Key Ecological Function Areas (NKEFAs) in China serve as a source and supplementation for numerous rivers and playing an important role in water resource conservation. Based on the analysis of eco-environmental quality changes in NKEFAs, this study analyzed the spatial pattern of water conservation services in 2000 and 2010 by using a water balance equation. The results indicate that the land cover type of NKEFAs was dominated by grassland, and the proportion of ecological land conversion to non-ecological land (0.3%) was higher than that of non-ecological land conversion to ecological land (0.21%). The fractional vegetation coverage (FVC) and biomass density of NKEFAs gradually decreased from southeast to northwest. The FVC of the Changbai Mountain Forest Function Area (CBS) was the highest, while the biomass density and total biomass were highest in mountain areas in the Middle of Hai’nan Island (HND) and in the Great Khingan and Lesser Khingan Mountains (XAL) respectively. The FVC and biomass of NKEFAs mostly increased in 2000–2010. Water conservation amounts of NKEFAs decreased from southeast to northwest. The average water conservation and total water conservation amount of Nanling Mountain (NL), Guangxi-Guizhou-Yunnan (GQD), and the Wuling Mountain Function Area (WLS) were the highest, while the Yinshan Mountain (YS), Alkin Grassland (AEJ), and the Qilian Mountain Function Area (QLS) had the lowest values. In 2000–2010, the water conservation service of 60% of NKEFAs decreased. Spatial and temporal differences in water conservation services are the result of a combination of ecological environment quality and meteorological conditions. Protection of the ecological environment and vegetation coverage improvement should be strengthened to enhance the function of water conservation.

1. Introduction

National Key Ecological Function Areas (NKEFAs) refer to the areas where ecosystems play an important role in ensuring the ecological security of an entire country or a large region and where the intensity of development should be restricted because ecosystems are degrading and the capacity to supply ecological products should be maintained and improved. Since 2008, the central government has set up transfer payments for NKEFAs. From 2008 to 2014, the central government allocated 200.4 billion CNY for the transfer payments. The number of districts and counties of NKEFAs has increased to 819 and transfer payments reached 62.7 billion CNY in 2017. An ecological environment index (EI) was adopted to evaluate the annual change of the ecological environment in each city and county, but has low applicability to water conservation. Chinese researchers have conducted research on NKEFAs [1] and have tended to focus on ecological compensation mechanisms [2,3] and transfer payment issues [4,5,6,7].
With the increasing demand for global water resources and the rapid deterioration of water environments, water shortage has become a global issue as well as a key factor limiting economic and social development. China faces a large number of water problems, including river pollution, over-exploitation of groundwater and water shortages. Most of the 25 key ecological function areas in China are located in Level I and II stepped landforms at higher altitudes, serving as a source and supplementation for numerous rivers and playing an important role in water resource conservation. However, the studies primarily focused on the water conservation of forest typed key ecological function areas or single ecological function area [8,9,10] and were mostly qualitative [1]. Besides, ecosystem services (ESs) are benefits people derive from ecosystems [11] and the ecological environment of ecosystem is the basis for ESs, including the water conservation service. Ecological environment quality can be enhanced by increasing vegetation cover, which can enhance water conservation. But most studies just evaluate the spatial-temporal pattern of water conservation service and can’t establish a dynamic relationship between ecological environment quality and water conservation changes. On the whole, there is a lack of systematic, targeted, comprehensive analyses and evaluations of ecological environment quality and water conservation services across the NKEFAs in China. Therefore, the scientific evaluation of ecological environment quality and water conservation in NKEFAs will provide a reliable theoretical basis for ecological compensation and targeted protection measures, and will have great practical implications.
The ecological environment quality is a combined result of multiple factors, including natural and artificial, which can be reflected by climate, terrain, biomass, land cover and vegetation data based on remote sensing interpretation. The understanding of water conservation services varies with scholars. Currently, the most comprehensive research concerns the forest ecosystem water conservation function, which involves the function of effective water conservation and runoff adjustment for the forest ecosystem through the interception and redistribution of precipitation by forest canopies, litter layers and soil layers [12]. The water conservation quantity can be calculated by numerous methods, such as the soil water storage capacity method, water balance method, underground runoff increase method, precipitation storage method and forest canopy interception residual method [13]. A large number of studies have proven that the regional water balance method is the basis for studying water conservation mechanisms. The method can accurately calculate the water conservation capacity, is easy to perform and is applicable for all temporal and spatial scales [14]. It is currently the most effective and widely used method for calculating the water conservation function [15]. Therefore, this study uses the water balance equation to calculate the water conservation quantity, including water content in soil, litter layer water holding capacity and canopy interception.
To eliminate the influence of transfer payment policy and get more objective evaluation results of ecological environment quality and water conservation changes in NKEFAs in China, we need to clarify the ecological background of NKEFAs before the implementation of transfer payments first, namely, the average state of a regional ecosystem and its changes before the implementation of ecological protection and restoration. This average state is more referential to the formulation of ecological compensation policy. Therefore, we analyzed the change and relationship of ecological environment quality and water conservation in NKEFAs in 2000 and 2010 with the aim of providing a theoretical basis for ecological protection and ecological compensation based on climate, terrain, biomass, land cover and vegetation data.

2. Methodology

2.1. Study Areas

There are 25 key ecological function areas in China. The total area of NKEFAs in China is 3.81 × 10⁶ km2, which are located in most provinces except for the eastern coastal ones (Figure 1 and Table 1), and present all climate types in China, including tropical monsoon, subtropical monsoon, temperate monsoon, temperate continental and plateau mountain climates. The annual average temperature in these areas varies from −2.8 to 27 °C and declines gradually from south to north. Annual precipitation range from 15 mm to 1600 mm and declines gradually from southeast to northwest. Vegetation in these areas includes primarily cold and temperate coniferous forest, temperate broadleaf-conifer forest, broadleaved deciduous forest, evergreen broadleaved forest, evergreen broadleaved deciduous forest, monsoon evergreen broadleaved forest, monsoon forest, rainforest, temperate steppe, temperate desert, high-cold scrub and meadow, high-cold steppe and high-cold desert. Types of soil include podzolic coniferous forest soil, dark brown forest soil, brown forest soil, yellow brown soil, red soil, chernozem, chestnut soil, grey brunisolic soil, plateau meadow soil, plateau steppe soil and plateau desert soil.

2.2. Data Sources

(1)
Data on key ecological function areas were produced using 1:1,000,000 national county-level data and the directory of NKEFAs in National Main Functional Areas Planning, 2010.
(2)
Raster data of 1 km land cover of 2000 and 2010 are from the Institute of Remote Sensing Application, Chinese Academy of Sciences.
(3)
Meteorological data (including precipitation, temperature, wind speed, etc.) of 683 meteorological stations around NKEFAs in 1999–2001 and 2009–2011 were obtained from the China meteorological data sharing service system (website: http://cdc.nmic.cn/home.do).
(4)
DEM data were provided by the Data Center for Resources and Environmental Sciences of Chinese Academy of Sciences (website: http://www.resdc.cn/Default.aspx).
(5)
The MODIS/Terra 16-day 250 m NDVI products MOD13Q1 (d001–d353) and eight-day 1 km LAI product MOD15A2 (d001–d361) in 2000 and 2010 were obtained from the NASA (website: http:e4ft01.cr.usgs.gov/).
(6)
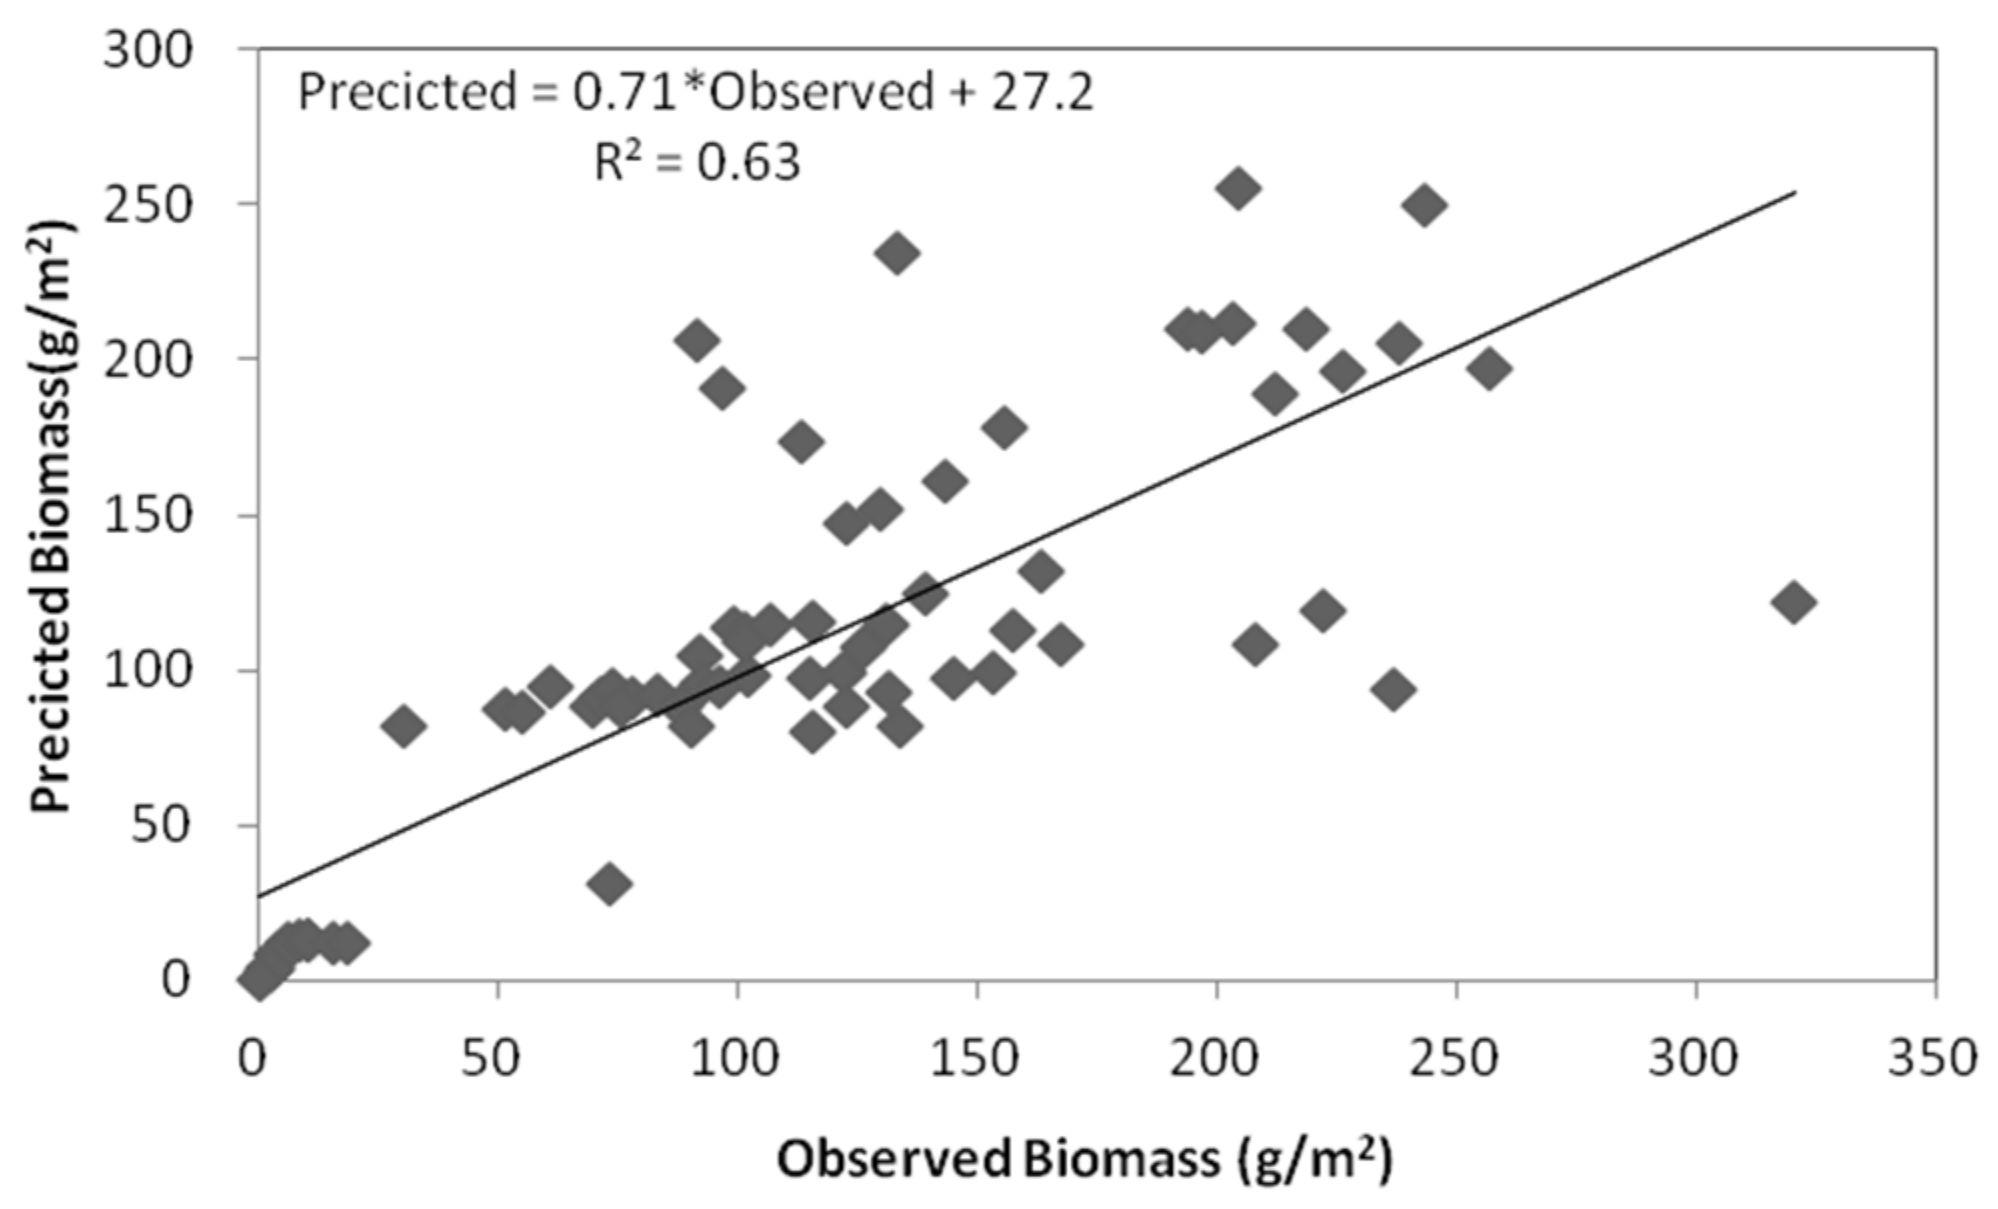
Biomass field site data were collected from vegetation from the China Ecosystem Research Network (CERN) from the study sites, and consisted of 1146 records, including forest, shrub, grass, and farmland samples. Moreover, all species of shrub and parts of herb layers were from forest communities. The survey data were collected in 2004, when the vegetation was at the accumulative process of the growth stage. The information including vegetation type, actual fresh and dry weight (including branches, limbs, leaves, and roots), selected site, date, latitude, longitude, elevation, annual average temperature, and annual precipitation were recorded.

2.3. Research Methods

2.3.1. Transition Matrix for Land Cover Change Detection

The raster land cover maps were used to detect the internal conversions of land cover in NKEFAs from 2000 to 2010 and an extended transition matrix was constructed. The maps from the initial and subsequent time periods were overlaid to produce a matrix that provided the LUCC areas by categorical transition between 2000 and 2010. The off-diagonal entries comprise the proportions of the landscape that experienced a transition from one category to another while the on-diagonal entries indicated no change in categories. The row totals at the right denote the proportion of landscape by land cover category in 2000 and the column totals at the bottom denote the proportion of landscape by category in 2010.

2.3.2. Estimation of Biomass

In this study, the above- and below-ground biomass (ABGB) across NKEFAs was estimated with MLR to establish the correlation between field measurements and MODIS observations, meteorological data, coordinates, terrain data, and statistical data [16]. MLR is a supervised method that aim to establish a mathematical relationship between a property of a given system and a set of molecular characteristics or descriptors that encode information and is expressed in Equation (1):
Y = A X   +   ε
where ε is an n × 1 residuals vector; X is a known n × k matrix of description; A is a K × 1 vector of adjusted parameters; and Y is a n × 1 vector of the response variable related to either the activity or other system property [17].
The model performance for MLR was assessed based on the agreements between the predicted value and the observed value. The agreements were quantified using relative estimation error (REE), which is calculated as Equation (2) [18]:
R E E = [ ( Y i Y i ) / Y i ] 2 N
where Yi is the observed data, Y i is the predicted value, and N is the number of validation points. Ninety percent of the biomass files were selected through a hierarchical sample method according to different classes for establishing regression models and the remainder 10% of samples were used to calculate REE.
MLR was calculated for the terrestrial ecosystem biomass of China in 2010. The simulation results were compared with the survey data, and the simulation precision was calculated using Equation (3) [19]:
P = 1 V m V s V s
where Vm is the value of simulated results by the regression model, and Vs is the value of survey data.
The selected variables were considered as influence factors, such as geographic elements (including longitude, latitude, and elevation) and environmental factors (including annual precipitation and annual average temperature) influencing the growth of vegetation, statistical data, and remote-sensing vegetation index (including NDVI and LAI) that directly showed the status of vegetation on a large scale. The construction of MLR for biomass assessment was executed through a step-wise regression analysis using the eight predictive variables and the biomass variable. Different types have variable correlations. Finally, before variables can be considered, the correlation coefficients between biomass data and other factors must be tested. We divided them into eight groups according to different vegetation types, including evergreen needle–leaved forest (EN), evergreen broadleaved forest (EB), deciduous coniferous forest (DC), deciduous broad-leaved forest (DB), mixed forest (MF), shrub, grass, and farmland. We used the data analysis add-in, available in the software of SPSS, and different types have different correlations with different factors (Table 2).
Correlation analysis was conducted between biomass and eight factors. The linear relationships for the four primary types are given in Table 3. The R2 value of DC forest was higher than other types, and grass had a lower R2 value. More than 95% of the variance in ABGB density was explained, with a relative estimation error of 67 g·m−2 for a range of biomass density in 2010 (Figure 2), when the residual data were used for training and cross-validation (Figure 2).

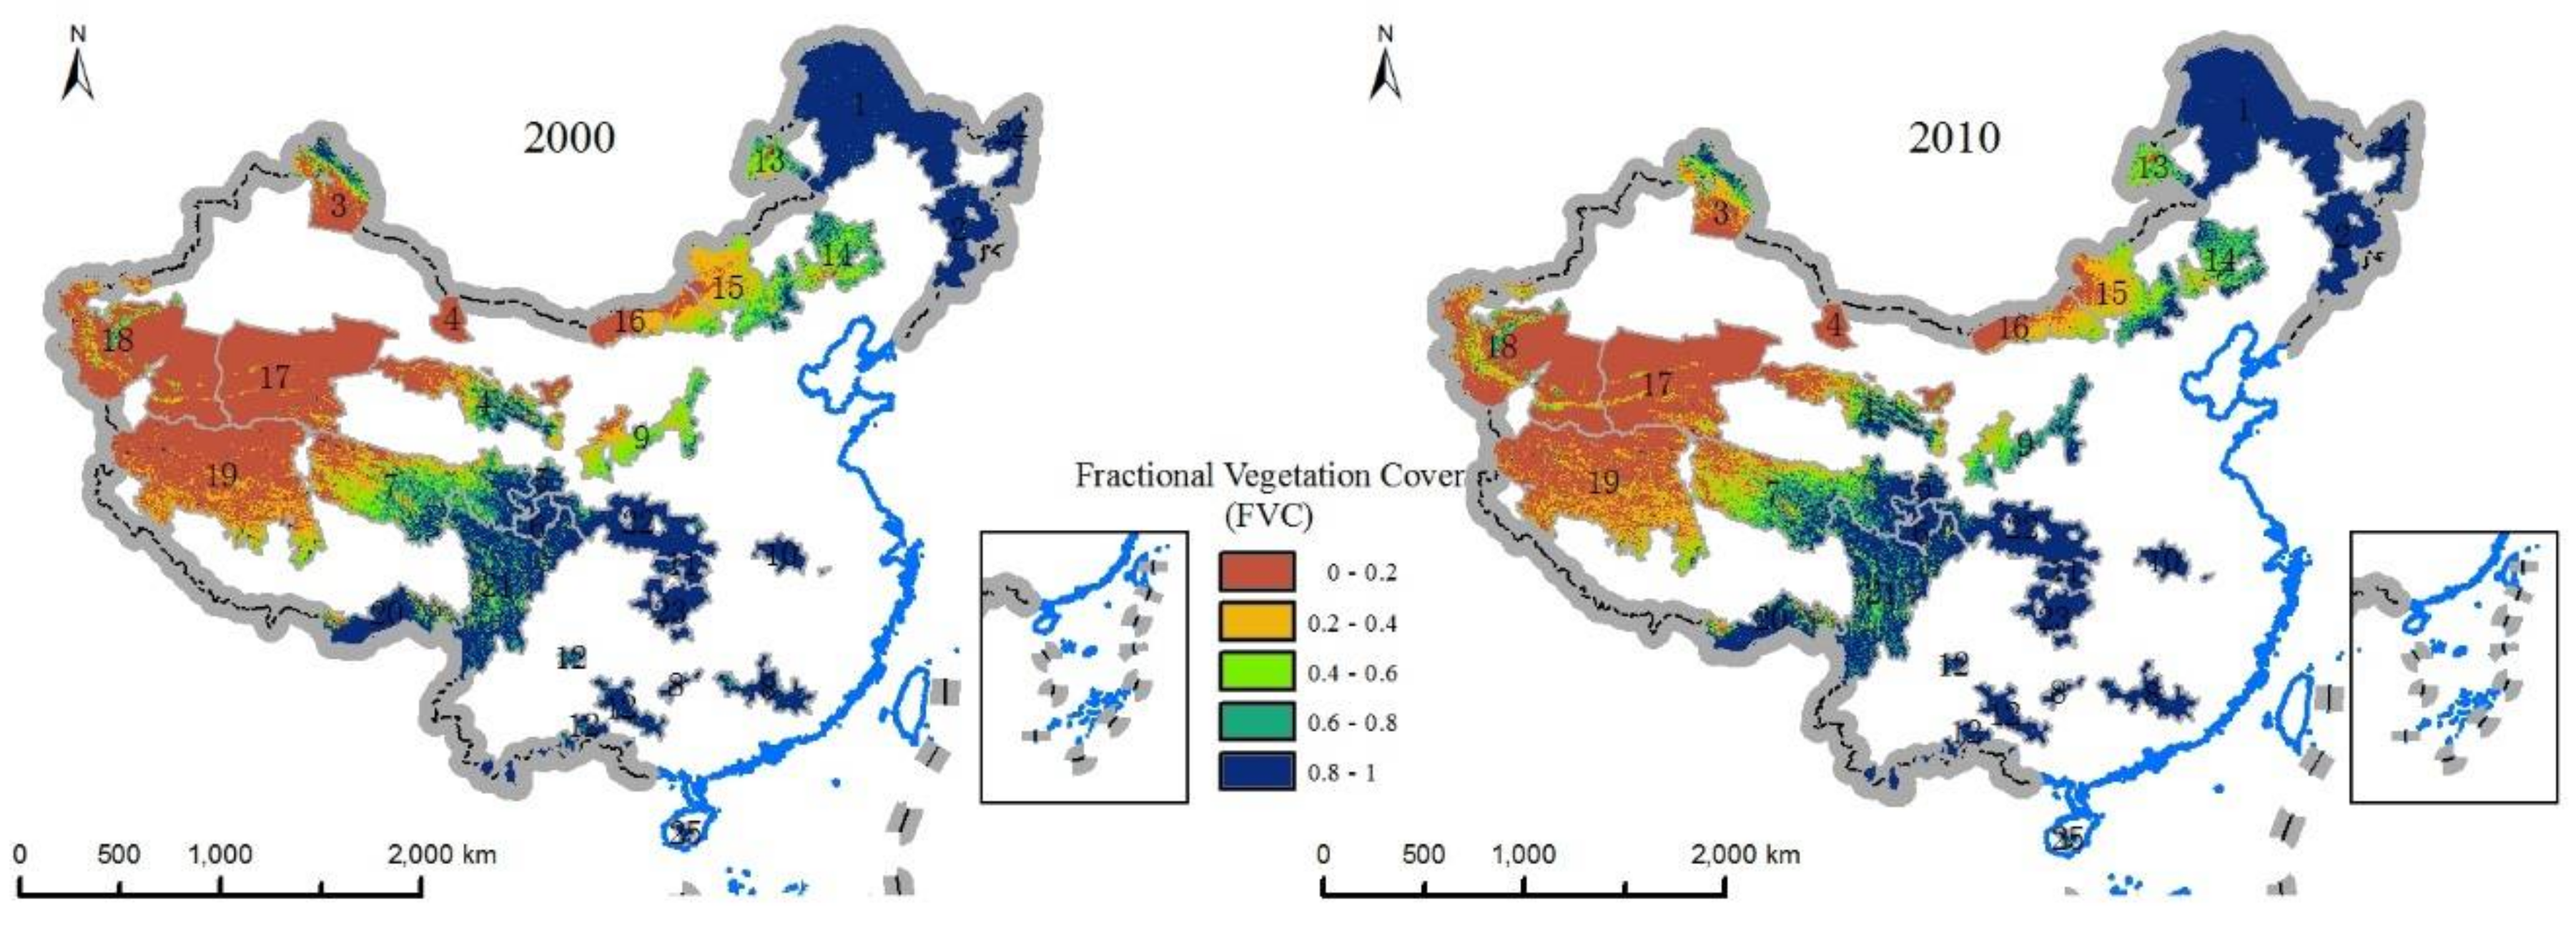
2.3.3. Fractional Vegetation Cover

The annual fractional vegetation coverage (FVC) data were obtained according to the dimidiate pixel model based on NDVI. Monthly NDVI values were calculated using the maximum value composite (MVC) method, which minimizes the following factors: atmospheric effects, scan angle effects, cloud contamination, and solar zenith angle effects [20]. Annual NDVI values comprised the maximum value of the monthly NDVI datasets. According to the dimidiate pixel model, the NDVI value of a pixel is a combination of information contributed by vegetation and non-vegetation. The calculation formula of FVC is as follows:
F V C = N D V I N D V I s o i l N D V I v e g N D V I s o i l
where NDVIveg is the NDVI value of a pure vegetation pixel, and NDVIsoil is the NDVI value of a non-vegetation pixel. In this study, the NDVI value of 95% and 5% cumulative frequency was NDVIveg and NDVIsoil, respectively. In this study, FVC was divided into five grades: 0–0.2, 0.2–0.4, 0.4–0.6, 0.6–0.8, and 0.8–1.0, representing extremely low coverage, low coverage, medium coverage, high coverage and extremely high coverage respectively.

2.3.4. Water Conservation Amount

This study uses the following water balance equation to calculate the water conservation capacity:
W C O N = i = 1 j ( P i R i E T i ) A i
where WCON denotes the total quantity of water conservation (m3), Pi denotes precipitation (mm), Ri denotes surface runoff (mm), ETi denotes evapotranspiration (mm), Ai denotes the area of the ecosystem, i denotes the ith ecosystem type and j denotes the ecosystem type number.
For areas where surface runoff (Ri) is the product of precipitation and the surface runoff coefficient, the formula is as follows:
R = P · α
where R is surface runoff (mm), P is precipitation (mm) and α is the average surface runoff coefficient. Based on the regional conditions of NKEFAs in combination with data from the literature, we obtain the average runoff coefficient for the various ecosystems in NKEFAs (Appendix A) [21,22,23,24,25,26,27,28,29,30,31,32,33,34,35,36,37,38,39].
Actual evapotranspiration is calculated using the Technical Guidelines for the Redline Delimitation of The Ecological Protection (Formula (7)):
E T = P ( 1 + ω × E T 0 / P ) ( 1 + ω × E T 0 / P + P / E T 0 )
where P is multi-annual mean precipitation (mm), ET is actual evapotranspiration (mm), ET0 is multi-annual mean latent evapotranspiration, and ω is the underlying surface (land cover) impact coefficient from the Technical Guidelines for the Redline Delimitation of The Ecological Protection (Table 4).
The latent evapotranspiration is calibrated with the FAO56Penman-Monteith formula [40] based on daily meteorological data:
E T 0 = 0.408 Δ ( R n G ) + 900 T + 273 U 2 ( e s e a ) Δ + γ ( 1 + 0.34 U 2 )
where R n is surface net radiation (MJ·m−2·d−1) from crops, G is the soil heat flux density (MJ·m−2·d−1), T is monthly mean temperature (°C), U 2 is 2 m wind velocity (m·s−1), e s is saturated water vapour pressure (kPa), e a is the actual water vapour pressure (kPa), Δ is the slope of the saturated water vapour-temperature curve (kPa·°C−1), and γ is the psychrometric constant (kPa·°C−1).

3. Results

3.1. Land Cover Change Analysis

The land cover type of NKEFAs is dominated by grassland, covering 40.83% and 40.7% of NKEFAs in 2000 and 2010, respectively, followed by sand and bare land (22.79%, 22.77%), forest land (18.53%, 18.58%), farmland (8.31%, 8.38%), bush land (4.74%, 4.75%), wetland and water areas (4.47%, 4.46%), rural settlements (0.26%, 0.27%), and urban settlements (0.06%, 0.09%). Among them, forest land, bush land, and grassland are categorized as ecological land, and their ecological levels decrease successively. Farmland, rural settlements, urban settlements, sand and bare land are categorized as non-ecological land, and the ecological level decreases successively [41]. 99.17% of land cover types did not change between 2000 and 2010 (Table 5). Although the land cover change is relatively small, the conversion of ecological land to non-ecological land accounts for 0.3% of the total area, which is higher than the proportion of non-ecological land conversion to ecological land (0.21%). For ecological land, urban settlements, rural settlements and farmland increased by 41.73%, 3.24% and 0.84% respectively. The proportion of urban settlements increased significantly, which is mainly from the conversion of farmland, forest land and grassland. In non-ecological land, wetland and water areas and grassland were both reduced by 0.32%. The wetland and water areas were mainly converted into grassland and farmland, and the grassland was mainly converted into farmland, sand areas and bare land. Forest land and bush land increased by 0.26% and 0.19% respectively, which mainly came from the conversion of grassland, farmland, and bush land and grassland, and forest respectively.
The land cover of 21 NKEFAs were dominated by ecological land (Table 6), among which the land cover types did not change between 2000 and 2010 in ZDN and ZXB. The proportion of non-ecological land conversion to ecological land was higher than that of ecological land conversion to non-ecological land in GN, GQD, HTGY, SX, YS, CD, QB, and WLS. However, the urban settlements in these function areas all increased, and the growth rate was highest for all land cover change rates, at over 40%. The growth rates of forest land in SX, GQD, WLS was 81.62%, 33.55%, and 22.46% respectively, which were higher than in other function areas. The proportion of ecological land conversion to non-ecological land was higher than that of non-ecological land conversion to ecological land in XAL, REG, CBS, SJY, DBS, HLBR, HSDK, KEQ, HND, NL, and SJPY and these area had the highest growth rate of urban settlements, at over 20%. Among them, the increase of urban settlements in SJPY and HLBR were lower. The sand areas and bare land in SJPY increased by 12.5%, and grassland decreased by 11.56%, while bush land decreased by 10.51% in HLBR. Land cover type was mainly non-ecological land in QLS, AEJ, AET, and TLM, among which the proportion of non-ecological land conversion to ecological land was higher than that of ecological land conversion to non-ecological land in QLS and AEJ. The increase of urban settlements was the highest, with the increase of the urban settlements of AEJ the most substantial, up 38.75 times. The proportion of ecological land conversion to non-ecological land was higher than that of non-ecological land conversion to ecological land in AET and TLM. Farmland increased up to 28.27% in AET, and the increase of urban settlements dominated land cover change in TLM.

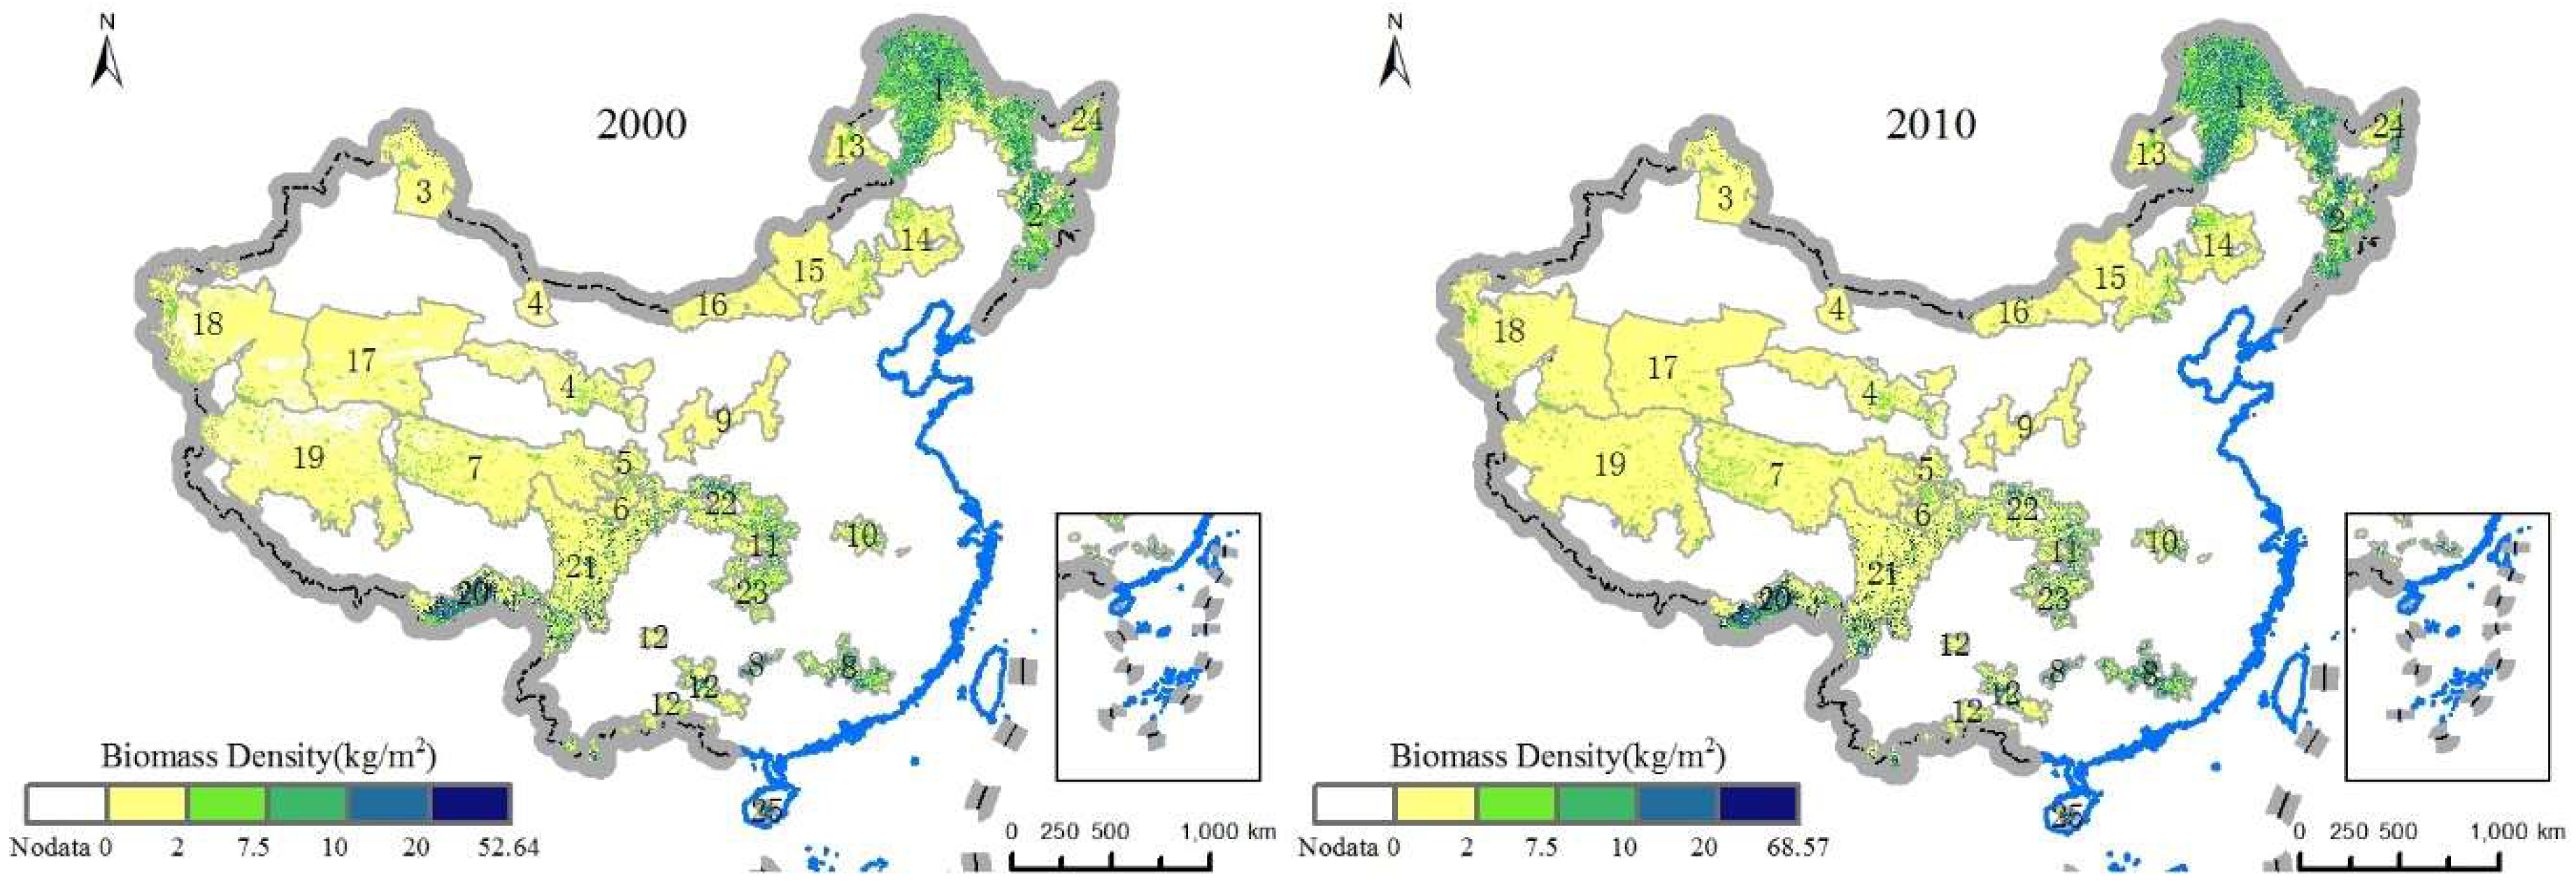
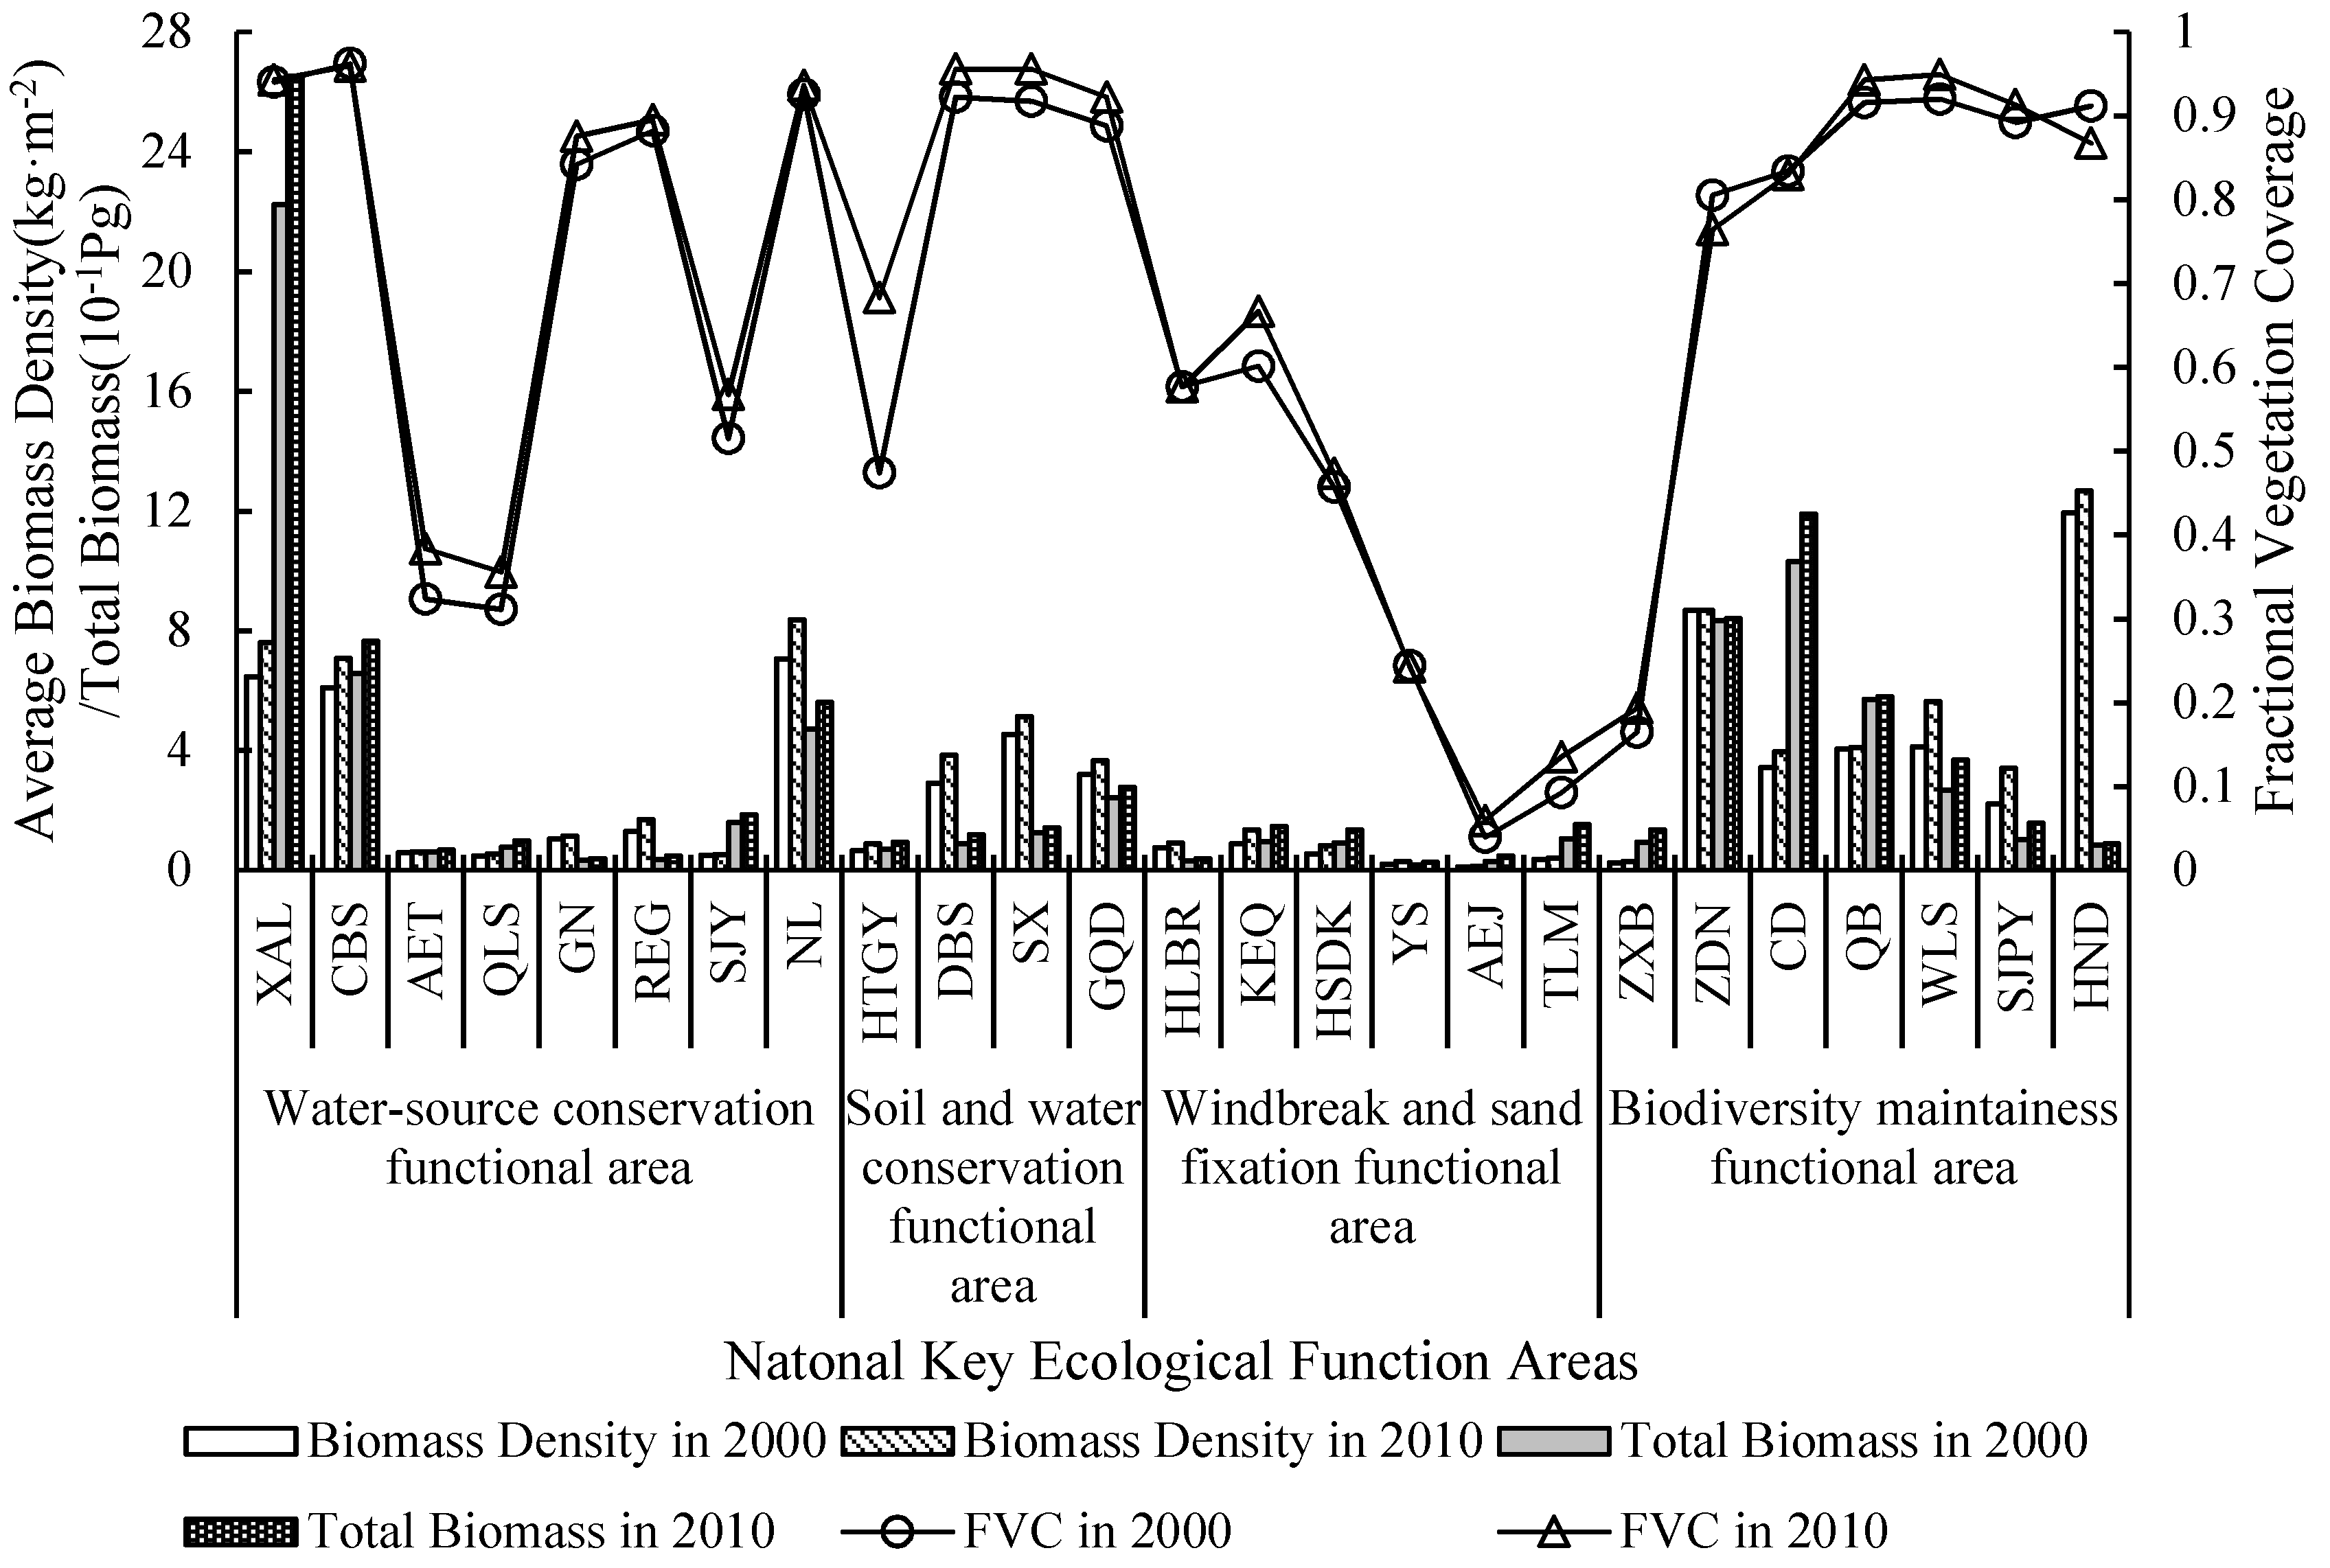
3.2. Ecological Environment Quality Change Trends

Vegetation is the main body of terrestrial ecosystem and has an important role in soil and water conservation, atmospheric regulation, mitigation of greenhouse gas emissions, and in maintaining the climate and ecosystem stability. Change of vegetation cover is a direct result of change in the ecological environment, and is significant in evaluating the area’s ecological environment quality. The FVC of NKEFAs gradually decreased from southeast to northwest due to the influence of climate and other factors (Figure 3) and was highest in CBS, reaching 0.962 in 2000 and 0.959 in 2010. The FVC of XAL, NL, DBS, WLS, SX, QB, and HND were higher than 0.9 (listed here in descending order), areas that were primarily water conservation and biodiversity maintenance ecological function areas in the northeast or southeast. The FVC was 0.039 in 2000 and 0.059 in 2010 in AEJ, which was the lowest, and the FVC was also lower than 0.2 in ZXB and TLM, a value that corresponds to the extremely low coverage area. In 2000–2010, the FVC of 80% of NKEFAs increased, and KEQ and HSDK had the highest growth rate in vegetation coverage with increases of 48.7% and 48.2%, respectively. The FVC of CBS, YS, ZDN, CD and HND were slightly reduced by less than 5.1%.
Biomass is a key variable that represents the vegetation in a biological community, and directly reflects the supply capacity of the ecosystem in the natural environment. The spatial distribution of biomass in NKEFAs is not uniform, and the biomass density was higher in the southeast than the northwest (Figure 4). The total biomass of terrestrial vegetation in NKEFAs was 7.61 Pg (1 Pg = 1015 g) in 2000, with an average biomass density of 2.22 kg/m2. The biomass of XALwas the largest in 2000, reaching 2.22 Pg and accounting for 29.2% of the total biomass of the whole NKEFAs, followed by CD (1.03 Pg). The biomass of YS was the lowest at 0.02 Pg. The function areas with large biomass density were mainly located in the south. The biomass density of HND was the highest in 2000, reaching 11.95 kg/m2, followed by ZDN (8.68 kg/m2). The biomass density of AEJ was 0.10 kg/m2, which was the lowest. In 2010, the total biomass of terrestrial vegetation in NKEFAs was 8.96 Pg, with an average biomass density of 2.42 kg/m2, which was higher than 2000 indicating that the total biomass quality of NKEFAs improved from 2000 to 2010. The total biomass levels of XAL and CD were the highest, reaching 2.65 Pg and 1.19 Pg respectively. The biomass of YS was the lowest at 0.03 Pg, which was higher than in 2000. Biomass density was high in HND and ZDN, which were 12.67 kg/m2 and 8.68 kg/m2, respectively in 2010, and the lowest biomass density in 2010 was 0.14 kg/m2 in AEJ in 2010.
According to the types of ecological function areas, the vegetation coverage of soil and water conservation function areas was the highest, the average biomass density of the biodiversity maintenance function areas was the highest, and the total biomass of water conservation function areas was the highest. Windbreak and sand-fixation function areas are mainly located in the northwest inlands, where desert is the main land cover type, leading to the lowest vegetation coverage, biomass density and total biomass (Figure 5). On the whole, the ecosystem quality of NKEFAs improved from 2000 to 2010.

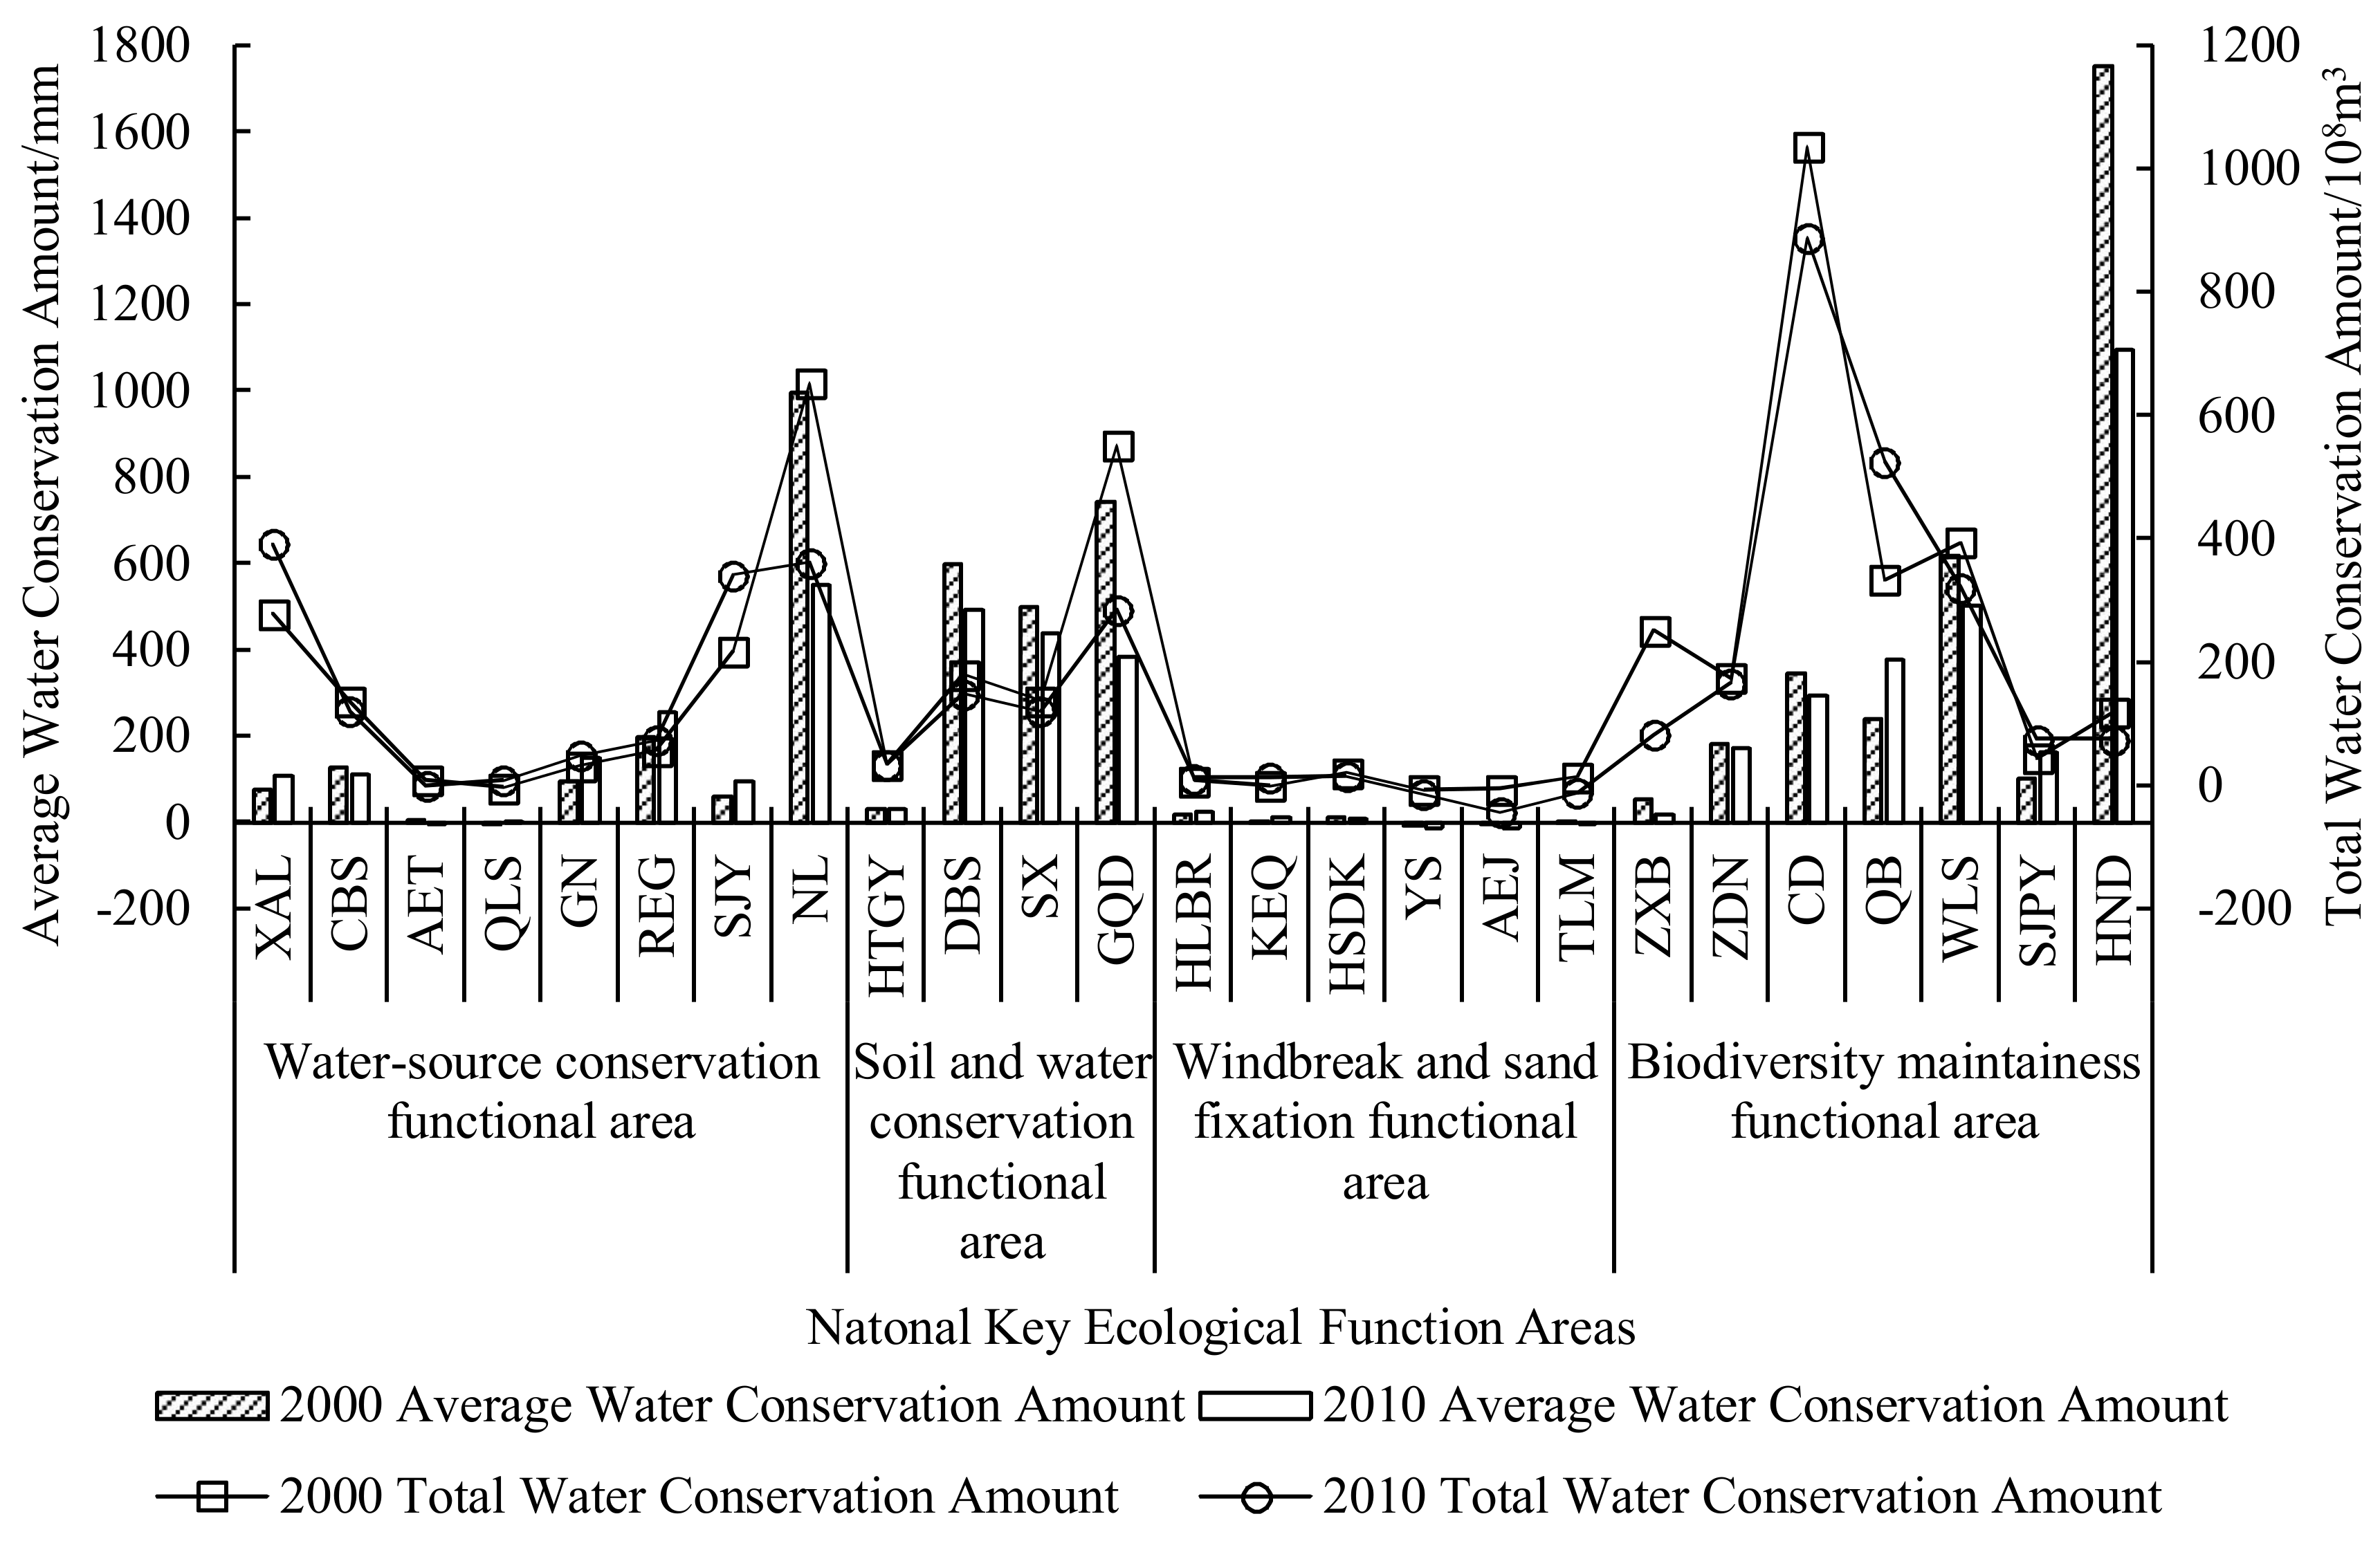
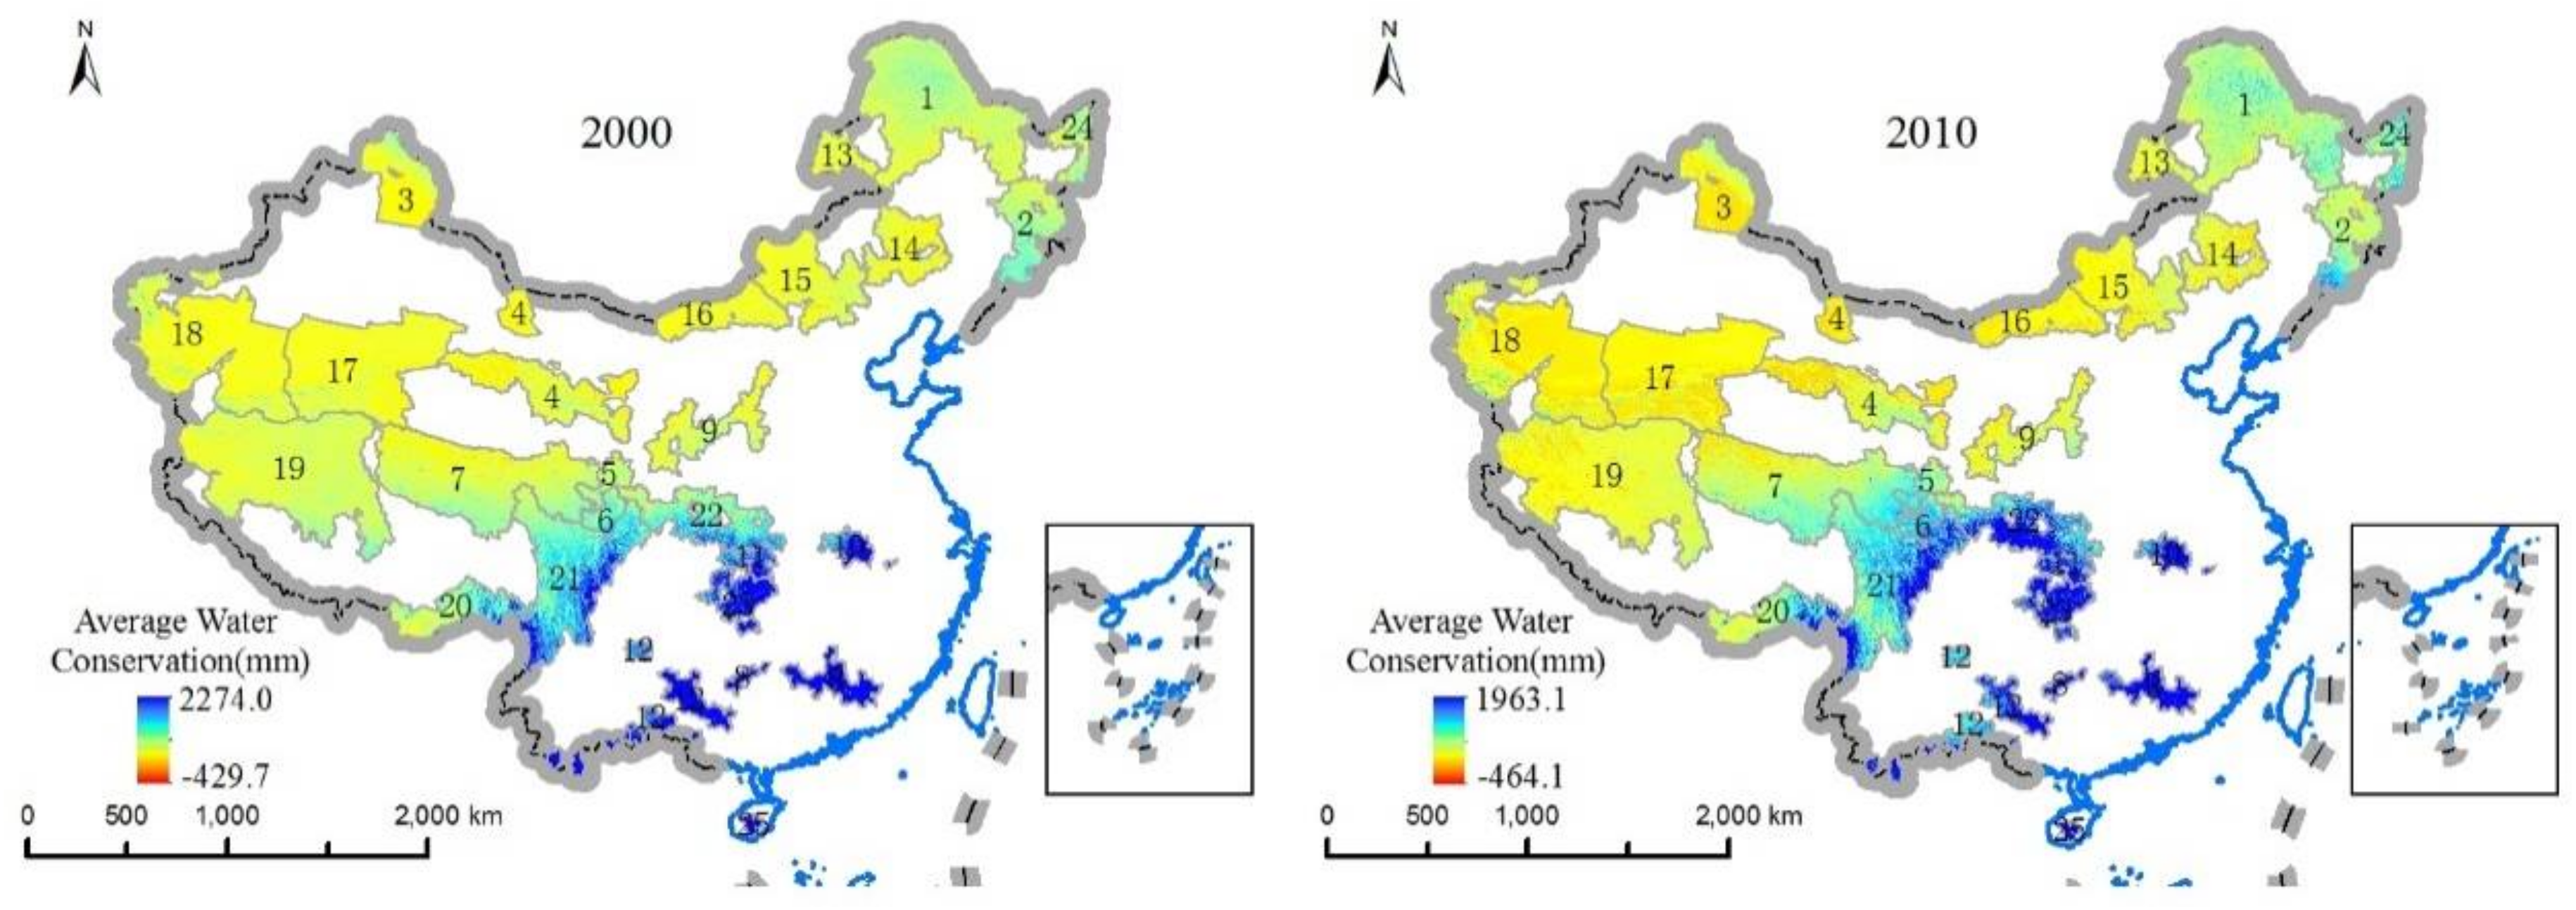
3.3. Water Conservation Services Change Trends

The water conservation quantity of NKEFAs showed a trend of significant reduction from southeast to northwest (Figure 6 and Figure 7). The average water conservation amount of each function area was different, which was mainly caused by various factors such as ecosystem type, precipitation, vegetation coverage, vegetation type and so on. Precipitation decreased significantly from the southeast to the northwest, and, correspondingly, vegetation coverage gradually decreased as the vegetation type changed from forest and bush to desert grassland. In 2000, the average water conservation amount of each NKEFAs was 124.28 mm, and the total amount of water conservation was 4674.98 × 108 m3. The average water conservation of HND was the highest, reaching 1753.07 mm, followed by NL, GQD, WLS, DBS and SX, which had average water conservation levels between 500 mm and 1000 mm. The average water conservation of other function areas was lower, especially for YS, AEJ and QLS, which had negative average water conservation levels. The total water conservation amount of CD, 1036.28 × 108 m3, was the highest, which was almost twice as much as NL at 652.47 × 10⁸ m3, followed by GQD, WLS, QB, XAL, ZXB, and SJY, whose total water conservation amounts were between 200 × 108 m3 and 600 × 108 m3. The total water conservation amount of other function areas was small, especially YS, AEJ, QLS. In 2010, the average water conservation in each function area was reduced to 107.39 mm, and the total water conservation amount was 4048.52 × 108 m3. Similar to 2000, the average water conservation of HND was the highest at 1095.99 mm, followed by NL and WLS and the negative average water conservation of YS, AEJ, TLM, and AET were the lowest of the function areas. The total water conservation amount of CD, 888.31 × 10⁸ m3, was the highest. The total water conservation amount in QB, XAL, NL, SJY, WLS, and GQD decreased successively, and the total water conservation amounts of AEJ, YS, TLM, AET were the lowest. The difference of water conservation in each function area is mainly due to the different water conservation capacity of various land cover types and the land cover type composition.
On the whole for 2010, the average water conservation and total water conservation of NL, GQD and WLS was higher than in 2000, while for YS, AEJ, and QLS both were lower and the rank of both in HND and CD differed significantly. The ranking order of average water conservation and total water conservation in other NKEFAs also shows a degree of inconsistency, mainly because of the different size of the total water conservation and the difference of average water conservation amount. In 2000 and 2010, the function of water conservation service in 60% of NKEFAs decreased.

4. Discussion

Water conservation services are determined by both ecological environment quality and meteorological conditions. The FVC of CBS and ZDN declined from 2000 to 2010, meanwhile, precipitation increased, and actual evapotranspiration decreased. However, the average and total water conservation amount both decreased, indicating that vegetation cover played a leading role in water conservation service in this time period. In contrast, the FVC, biomass, and the proportion of ecological land in GQD and SX all increased from 2000 to 2010, while precipitation decreased, and actual evapotranspiration increased for the same time period. However, the average and total water conservation amount both decreased, indicating that meteorological conditions played a dominant role in water conservation service in this time period.
In 2000 and 2010, the average water conservation amount of 25 key ecological function areas in China was 270.2 mm and 210.9 mm respectively. However, among the eight water-source conservation functional areas, only the average water conservation amount of NL and REG exceeded the average, which indicated that the water conservation function of water-source conservation functional areas was not the highest among NKEFAs and that the significance of these areas water conservation was reflected in the importance to the region and its surrounding areas. However, some water-source conservation functional areas faced serious threats. For example, the water conservation amounts of QLS and AET were negative in 2000 and 2010, respectively. It is necessary to strengthen the protection of the ecological environment and improve water conservation service especially in the eight water-source conservation functional areas.
In 2000 and 2010, the total water conservation amount of NKEFAs was 4674.98 × 108 m3 and 4048.51 × 108 m3, respectively and the water conservation amount of the eight water-source conservation functional areas was 1381.95 × 108 m3 and 1350.04 × 108 m3, respectively. Gong et al. [21] calculated that the total amount of water conserved by forest, shrub, grassland, garden, and wetland ecosystems in China in 2010 was 12224.33 × 108 m3. Huang et al. [42] calculated that the water conservation amount of eight water-source conservation functional areas was 1050.72 × 108 m3 and 1081.56 × 108 m3 in 2000 and 2010, respectively. The above results were comparable and had no distinct difference (Table 7). In addition, the spatial distribution of water conservation of NKEFAs was consistent with previous studies, showing a trend of significant reduction from southeast to northwest [21]. The water conservation amounts of XAL and SJY were much higher than those of GN, REG, QLS, and AET [42], which was consistent with this study. In this study, different land cover types were considered in the evaluation of the spatial distribution of water conservation, and the results were closer to the actual results. In addition, an analysis of land cover, FVC, biomass change combined with the water conservation calculation can provide a more scientific basis for ecological environment monitoring and natural resources management.

5. Conclusions

The ecological environment quality of NKEFAs improved between 2000 and 2010, and the average vegetation coverage and biomass increased, but the proportion of non-ecological land increased slightly. Ecological land serves as an important basis for the improvement of ecological environment quality and ecosystem function realization in NKEFAs, especially in AET and TLM whose non-ecological land are not only the dominating land cover types but also present an increasing trend. In terms of ecological environment quality of different function areas, the FVC of soil and water conservation ecological function areas were the highest, the biodiversity maintenance ecological function areas had the highest average biomass density, and the total biomass of water conservation ecological function areas were the highest. The wind prevention and sand fixation ecological function areas were mainly located in the northwest inland area, where the desert coverage was relatively larger than in other areas, leading to the lowest levels of vegetation coverage, biomass density and total biomass. In general, the spatial distribution of water conservation services showed a trend of significant reduction from southeast to northwest, which was similar to the spatial distribution pattern of ecological environment quality. NL, GQD and WLS had high water conservation amounts and good ecological environment quality, while in comparison, the levels of both for YS, AEJ and QLS were significantly inferior. Among the eight water-source conservation functional areas, SJY, QLS and AET had low water conservation amounts and effective environmental protection engineering measures should be taken in these areas. It was obvious that not all the water-source conservation functional areas had higher water conservation amount, and the water conservation services was the result of a combination of factors, including climate condition and ecological environment quality. However, water-source conservation functional areas are mainly located on the upstream of important river in China, the water conservation services of which are more important than other services for local and their downstream area. This can reflect the orientation and target for different types of NKEFAs. Besides, we should notice that the water conservation service in each type of functional areas are important that can’t be ignored and the NKEFAs is an organic whole which is crucial to China’s ecological environment quality improvement. These results provide specific information that may serve to strengthen necessary public awareness about protecting and restoring water conservation services and improving ecological environment quality of NKEFAs, issues that are also significant for natural resources management.

Acknowledgments

This study was sponsored by the National Key Research & Development Program of China (2016YFC0503403 and 2016YFC0503706) and Beijing Natural Science Foundation (5164031).

Author Contributions

Jie Xu and Gaodi Xie co-designed the research. Jie Xu analysed the data and wrote the paper. Yu Xiao and Yuan Jiang revised the manuscript. Na Li and Fuqin Yu collected the data. Sha Pei did English editing and revised the manuscript.

Conflicts of Interest

The authors declare no conflict of interest.

Appendix A

Table A1. Average Surface Runoff Coefficient of NKEFA (unit: %).
Land Cover TypeNational Key Ecological Function Areas
XAL, AET,
QLS, GN,
REG, SJY,
HLBR, YS,
AEJ, TLM,
ZXB [21,22,23]
CBS
[21,22,23]
NL
[21,22,23]
HTGY
[21,22,23,24]
DBS
[21,22,23]
SX
[25,26,27,28,29,30]
GQD
[21,22,23,31,32]
KEQ
[21,22,23,33]
HSDK
[21,22,23,34]
ZDN
[21,22,23]
CD
[21,22,23,35,36]
QB
[21,22,23]
WLS
[21,22,23,37,38]
SJPY
[15,16,17,33]
HND
[15,16,17]
Evergreen Needleleaf Forest4.524.524.522.444.524.525.330.944.524.524.364.523.383.174.52
Evergreen Broadleaf Forest4.654.654.654.654.653.155.354.654.654.654.944.651.074.654.65
Deciduous Needleleaf Forest0.880.880.880.880.880.880.880.880.880.880.880.880.880.710.88
Deciduous Broadleaf Forest2.702.702.703.202.702.252.700.762.702.704.892.704.212.702.70
Mixed Forests3.523.523.526.773.525.033.520.783.523.523.753.522.673.523.52
Shrub Forest4.174.184.224.174.194.676.160.314.174.239.064.201.834.184.26
Meadow9.139.139.139.139.139.139.139.139.139.139.139.139.139.139.13
Herbaceous steppe3.943.943.943.943.943.946.933.943.943.943.943.943.943.943.94
Barren Grassland9.379.379.379.379.379.379.379.379.379.379.379.379.379.379.37
Alpine meadow8.208.208.208.208.208.208.208.208.208.208.208.208.208.208.20
alpine Steppe6.546.546.546.546.546.546.546.546.546.546.546.546.54--6.54
Shrub Grassland--4.064.084.064.064.074.08--4.064.094.064.074.06--4.10
Paddy Field000000000000000
Dryland Cropland22.9522.9522.9522.9522.959.407.2022.9522.9522.9522.9522.956.4222.9522.95
Settlements656565656565656565656565656565
Wetland and Water Bodies000000000000000
Bare and Sandy Land32.8832.8832.8832.8832.8832.885.5832.8818.1632.8832.8832.8832.8832.8832.88

References

  1. Liu, X.; Wang, Y.Q. Analysis of current research on key ecological function zones in China. World For. Res. 2014, 27, 93–96. (In Chinese) [Google Scholar]
  2. Li, G.P.; Li, X.; Wang, H.Z. Analysis of the ecological compensation of the transfer payment in the national key ecological function area. Mod. Econ. Sci. 2013, 35, 58–64. (In Chinese) [Google Scholar]
  3. Zhang, W.B.; Li, G.P. Dynamic incentive effect analysis of transfer payment in national key ecological function zone. China Popul. Resour. Environ. 2015, 25, 125–131. (In Chinese) [Google Scholar]
  4. Zhong, D.N. Research on the dilemma of financial transfer payment system in the construction of national key ecological function areas in China. J. Southwest Univ. Natly. (Humanit. Soc. Sci.) 2014, 35, 122–126. (In Chinese) [Google Scholar]
  5. Li, G.P.; Li, X. Allocation mechanism of national key ecological function area’s transfer payment. China Popul. Resour. Environ. 2014, 24, 124–130. (In Chinese) [Google Scholar]
  6. Li, G.P.; Liu, Q.; Zhang, W.B. Transfer payment system in the national key ecological function area and the ecological environmental quality—Empirical study based on the countryside data of Shaanxi Province. J. Xi’an Jiaotong Univ. (Soc. Sci.) 2014b, 34, 27–31. (In Chinese) [Google Scholar]
  7. Li, G.P.; Wang, H.Z.; Liu, Q. The dual objectives and performance evaluation of transfer payment in national key ecological function areas. J. Northwest Univ. (Philos. Soc. Sci. Ed.) 2014c, 44, 151–155. (In Chinese) [Google Scholar]
  8. Meng, Q.H. Analysis of ecological carrying capacity of national key ecological function areas in Hunshandake based on ecological footprints. For. Resour. Manag. 2014, 1, 127–130. (In Chinese) [Google Scholar]
  9. Fan, C. Analysis of the landscape pattern changes and ecological security of national key ecological function areas. Jiangxi Norm. Univ. Nanchang China, 2014. (In Chinese) [Google Scholar]
  10. He, W.J.; Qin, S.; An, M. The transfer payment policy shortcomings and improvement measures in National key ecological function areas—A case study of some counties and cities in Wuling Mountain Area (Hunan). Hubei Soc. Sci. 2015, 4, 67–72. (In Chinese) [Google Scholar]
  11. Finlayson, M.; Cruz, R.D.; Davidson, N.; Alder, J.; Cork, S.; de Groot, R.S.; Lévêque, C.; Milton, G.R.; Peterson, G.; Pritchard, D.; et al. Millennium Ecosystem Assessment: Ecosystem and Human Well-Being: Synthesis; Island Press: Washington, DC, USA, 2005. [Google Scholar]
  12. Li, W.H.; He, Y.T.; Yang, L.Y. A summary and perspective of forest vegetation impacts on water yield. J. Nat. Resour. 2001, 16, 398–406. (In Chinese) [Google Scholar]
  13. Zhang, B.; Li, W.H.; Xie, G.D.; Xiao, Y. Water conservation function and its measurement methods of forest ecosystem. Chin. J. Ecol. 2009, 28, 529–534. (In Chinese) [Google Scholar]
  14. Lü, X.Z. Study on the Effects of Forest Vegetation on Hydrological Process on Slope in Beijing Mountain Area; Beijing Forestry University: Beijing, China, 2013. (In Chinese) [Google Scholar]
  15. Sun, L.D.; Zhu, J.Z. Comprehensive Benefit Study and Evaluation of Soil and Water Conservation Forest System; Science Press: Beijing, China, 1995; pp. 362–377. [Google Scholar]
  16. Li, N.; Xie, G.D.; Zhang, C.S.; Xiao, Y.; Zhang, B.; Chen, W.H.; Sun, Y.Z.; Wang, S. Biomass resources distribution in the terrestrial ecosystem of China. Sustainability 2015, 7, 8548–8564. [Google Scholar] [CrossRef]
  17. Ventura, C.; Latino, D.A.R.S.; Martins, F. Comparison of multiple linear regressions and neural networks based QSAR models for the design of new antitubercular compounds. Eur. J. Med. Chem. 2013, 70, 831–845. [Google Scholar] [CrossRef] [PubMed]
  18. Xu, B.; Yang, X.C.; Tao, W.G.; Qin, Z.H.; Liu, H.Q.; Miao, J.M. Remote sensing monitoring upon the grass production in China. Acta Ecol. Sin. 2007, 27, 405–413. [Google Scholar] [CrossRef]
  19. Gómezbolea, A.; Llop, E.; Ariño, X.; Saizjimenez, C.; Bonazza, A.; Messina, P.; Sabbioni, C. Mapping the impact of climate change on biomass accumulation on stone. J. Cult. Heritage 2012, 13, 254–258. [Google Scholar] [CrossRef]
  20. Holben, B.N. Characteristics of maximum-value composite images from temporal AVHRR data. Int. J. Remote Sens. 1986, 7, 1417–1434. [Google Scholar] [CrossRef]
  21. Gong, S.H.; Xiao, Y.; Zheng, H.; Xiao, Y.; Ouyang, Z.Y. Spatial patterns of ecosystem water conservation in China and its impact factors analysis. Acta Ecol. Sin. 2017, 37, 2455–2462. [Google Scholar]
  22. Wang, S.Y. Study on the Characteristics of Slope Runoff and Sediment Yield in Dongtaigou Watershed of Huairou, Beijing; Beijing Forestry University: Beijing, China, 2011. (In Chinese) [Google Scholar]
  23. Wang, Q.; Zhang, X.X.; Wei, M.J.; Zhou, Y.W.; Li, P.; Bai, G.Y. Research summary of planning and design standards for storm water system in Beijing City. Water Wastewater Eng. 2011, 37, 34–39. (In Chinese) [Google Scholar]
  24. Zhang, X.M.; Sun, Z.F.; Zhang, X.P. Analysis on the function of different stand affecting runoff and sediment from rainstorm in Gullied Loess Hill of Jinxi. Sci. Soil Water Conserv. 2003, 1, 37–42. (In Chinese) [Google Scholar]
  25. Wen, X.S.; He, B.H.; Zhang, H.J.; He, F.; Miu, C.Y. An Analysis of the surface runoff characteristic and runoff yield of different woodlands in the Three Gorges Reservoir area. J. Southwest Univ. (Nat. Sci. Ed.) 2007, 29, 74–80. (In Chinese) [Google Scholar]
  26. Wang, X.R.; Wan, F.H.; Cui, H.X.; Pang, H.D.; Pan, L.; Tang, H. Located monitoring of soil and water conservation benefits of different reforestation patterns in Three Gorges Reservoir Region. Hubei For. Sci. Technol. 2014, 43, 1–4. (In Chinese) [Google Scholar]
  27. Shen, Y.K.; Wang, Y.J.; Qi, N.; Yang, X.M.; Li, Y.M.; Cheng, C. Effect of different vegetation types on runoff generation of slope land in Jinyun Mountains of Chongqing city. Bull. Soil Water Conserv. 2009, 29, 80–84. (In Chinese) [Google Scholar]
  28. Qi, S.L.; Zhang, H.J.; He, F.; Cheng, J.H. Effect of the vegetation types on runoff generation on slope land in Simian Mountain of Chongqing. Sci. Soil Water Conserv. 2006, 4, 33–38. (In Chinese) [Google Scholar]
  29. Wang, X.D.; Zhang, H.J.; Cheng, J.H.; Sun, Y.H. Characteristics of runoff on forest vegetation slopes in Three Gorges Area. Res. Soil Water Conserv. 2008, 15, 146–148. (In Chinese) [Google Scholar]
  30. Li, Y.M.; Wang, Y.J.; Chu, X.Y.; Cheng, C.; Qi, N. Effects of the rainfall factors on surface runoff of typical forest vegetations in Three Gorges Region. Res. Soil Water Conserv. 2009, 16, 244–249. [Google Scholar]
  31. Li, S.; Ren, H.D.; Yao, X.H.; Zhang, S.G.; Yang, S.; Lan, Y.Q.; Nong, M.D. Study on characteristics of runoff and nutrition loss between different vegetation land in typical karst rock desertification zone. J. Soil Water Conserv. 2009, 23, 1–6. (In Chinese) [Google Scholar]
  32. Ji, Q.F.; Zhang, X.Q.; Zhang, K.L.; Yang, Y.; Yang, G.X.; Gu, Z.K. Runoff and sediment characteristics of slope land in karst areas of Guizhou Province. Res. Soil Water Conserv. 2012, 19, 1–5. (In Chinese) [Google Scholar]
  33. Jiang, P.; Guo, F.; Luo, Y.C.; Wei, J.; Sun, X.W.; Wu, G. Water and soil conservation function of typical plantation forest ecosystems in semi-arid region of Western Liaoning Province. Chin. J. Appl. Ecol. 2007, 18, 2905–2909. (In Chinese) [Google Scholar]
  34. Zhao, H.Y.; Zhu, J.W.; Wang, W.H. Study on the runoff in forestbelt and grassland. J. Soil Water Conserv. 1994, 8, 56–61. (In Chinese) [Google Scholar]
  35. Liu, Z.Q. Study on the Forest Hydrology Ecological Function in Yunnan Plateau Mountain Jinshajiang Watershed; Kunming University of Science and Technology: Kunming, China, 2014. (In Chinese) [Google Scholar]
  36. Chen, Q.B.; Cun, Y.K.; Liu, Z.Q.; Wang, K.Q.; Wang, L.M. Study on runoff and sediment production on slope land of Western Plateau of Yunnan Province. Res. Soil Water Conserv. 2005, 12, 71–73. (In Chinese) [Google Scholar]
  37. Qi, L.H.; Zhang, X.D.; Zhou, J.X.; Wang, Z.Y. Runoff and sedimant characteristics of typical vegetation restoration patterns in a watershed, Wuling Mountain Region. Resour. Sci. 2008, 30, 709–716. (In Chinese) [Google Scholar]
  38. Zhou, J.; Zhang, X.D.; He, D.; Zhou, J.X.; Zhou, X.L.; Wang, Z.J. Characteristic of runoff and sediment yield and its influencing factors analysis on slope scale of small watershed in northwest Hunan. J. Soil Water Conserv. 2010, 24, 18–22. (In Chinese) [Google Scholar]
  39. Duan, W.B.; Liu, S.C. Analysis on runoff and sediment yields of water conservation forests in Lianhua Lake Reservoir Area. J. Soil Water Conserv. 2006, 20, 12–15. (In Chinese) [Google Scholar]
  40. Allen, R.G.; Pereira, L.S.; Raes, D.; Smith, M. Crop Evapotranspiration-Guidelines for Computing Crop Water Requirements-FAO Irrigation and Drainage Paper 56; FAO: Rome, Italy, 1998; Volume 300, pp. 1–15. [Google Scholar]
  41. Li, Y; Cao, Z; Long, H; Liu, Y.; Li, W. Dynamic analysis of ecological environment combined with land cover and NDVI changes and implications for sustainable urban–rural development: The case of Mu Us Sandy Land, China. J. Clean. Prod. 2017, 142, 697–715. [Google Scholar] [CrossRef]
  42. Huang, L.; Cao, W.; Wu, D.; Gong, G.L.; Zhao, G.S. Assessment on the changing conditions of ecosystems in key ecological function zones in China. Chin. J. Appl. Ecol. 2015, 26, 2758–2766. [Google Scholar]
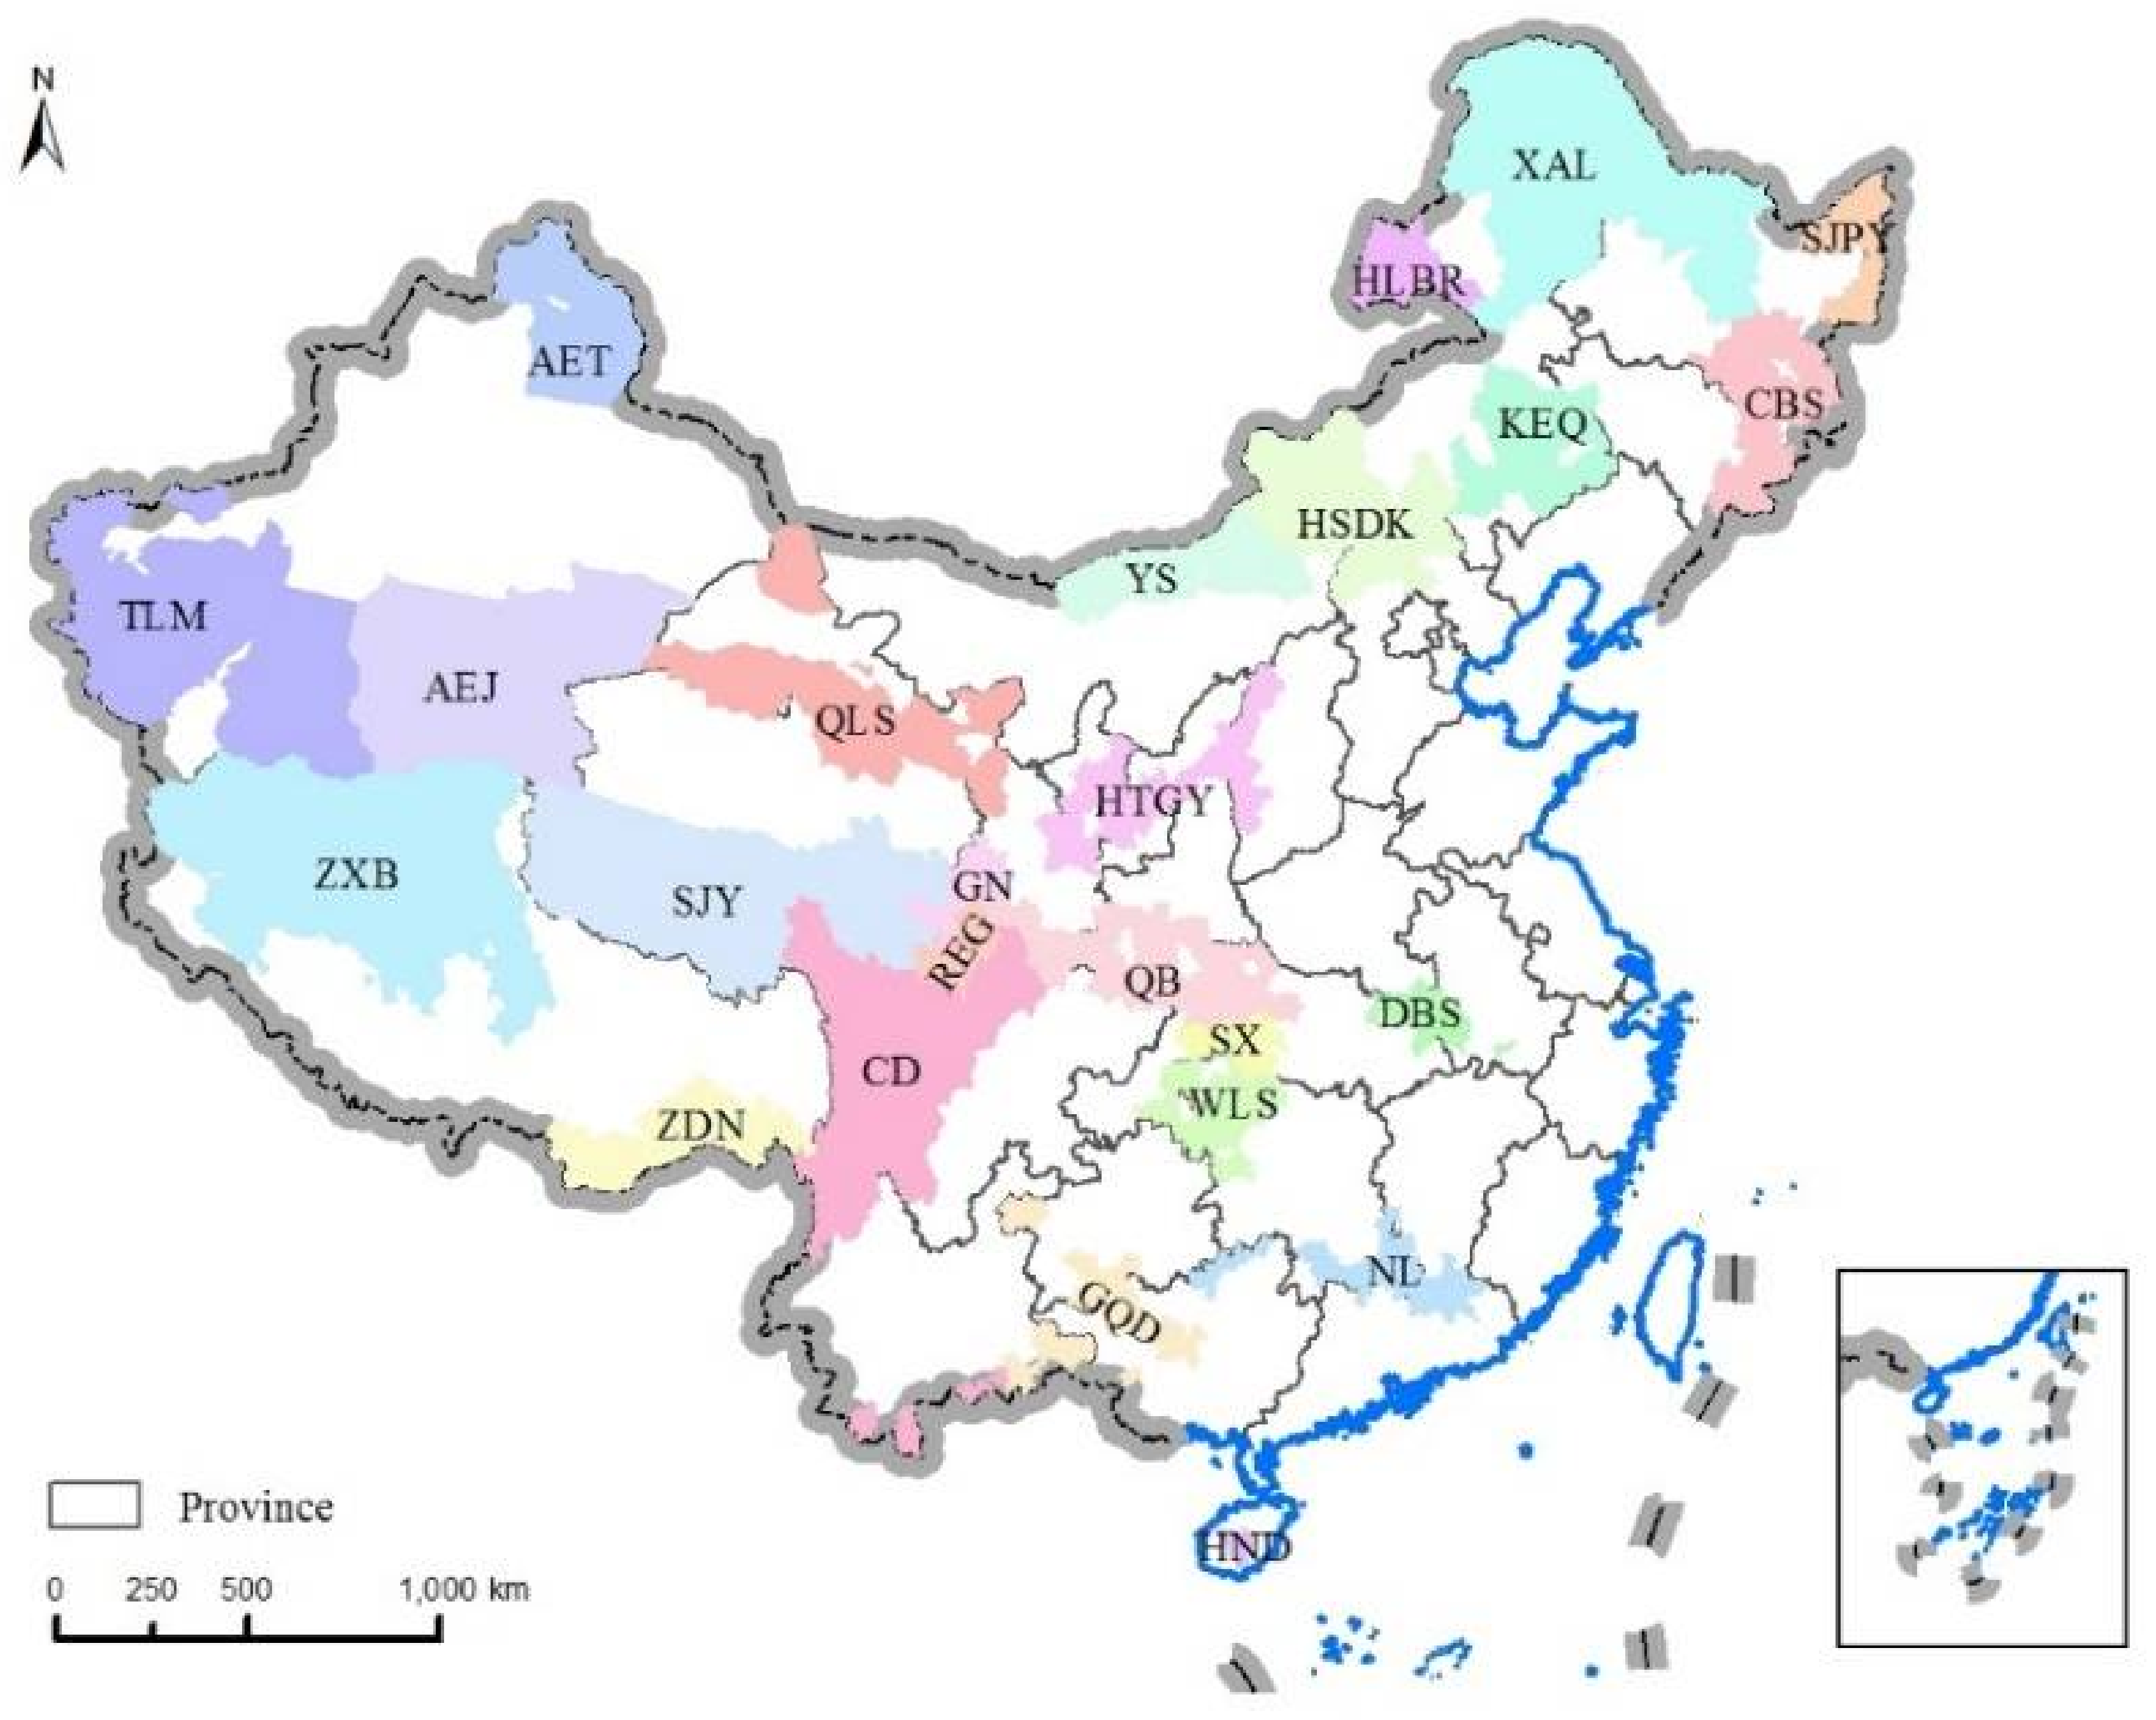
Figure 1. Distribution of NKEFAs in China.
Sustainability 10 01202 g001
Figure 2. Relationship between observed biomass (g/m2) and multiple regression model predictions (g/m2).
Sustainability 10 01202 g002
Figure 3. Spatial distribution of fractional vegetation coverage (FVC) of NKEFAs in 2000, 2010.
Sustainability 10 01202 g003
Figure 4. Spatial distribution of biomass of NKEFAs in 2000, 2010.
Sustainability 10 01202 g004
Figure 5. Biomass density, total biomass, FVC of NKEFAs in 2000, 2010.
Sustainability 10 01202 g005
Figure 6. Spatial distribution of water conservation of NKEFAs in 2000, 2010.
Sustainability 10 01202 g006
Figure 7. Average and total water conservation amount of NKEFAs in 2000, 2010.
Sustainability 10 01202 g007
Table 1. Names, abbreviations and codes for the 25 National Key Ecological Function Areas (NKEFAs).
Name of Ecological Function AreaAbbr.CodeName of Ecological Function AreaAbbr.Code
Forest Ecological Function Area of the Great Khingan and Lesser Khingan MountainsXAL1Ecological Function Area in the Horqin GrasslandKEQ14
Forest Ecological Function Area on Changbai MountainCBS2Desertification Control Ecological Function Area in the Hunshandake SandlandHSDK15
Steppe Ecological Function Area on Altai MountainAET3Grassland Ecological Function Area in the Northern Foot of Yinshan MountainYS16
Glacier and Water Conservation Ecological Function Area on Qilian MountainQLS4Desertification Control Ecological Function Area in the Alkin GrasslandAEJ17
Significant Water Source Recharging Ecological Function Area of Southern Gansu ProvinceGN5Desertification Control Ecological Function Area of Tarim River BasinTLM18
Wetland Ecological Function Area of the Zoige County GrasslandREG6Desert Ecological Function Area on the Northwest Qiangtang PlateauZXB19
Wetland Ecological Function Area of Sanjiangyuan National Nature ReserveSJY7Forest Ecological Function Area on the Edge of the Plateau in the Southeast of TibetZDN20
Forest and Biodiversity Ecological Function Area on Nanling MountainNL8Forest and Biodiversity Ecological Function Area of Yunnan and SichuanCD21
Hill and Ravine Soil Conservation Ecological Function Area on the Loess PlateauHTGY9Biodiversity Ecological Function Area of Qinba MountainQB22
Soil Conservation Ecological Function Area of Dabie MountainDBS10Biodiversity and Soil Conservation Ecological Function Area in Wuling MountainWLS23
Soil Conservation Ecological Function Area of the Three Gorges Reservoir RegionSX11Wetland Ecological Function Area of the Three River PlainSJPY24
Stony Desertification Control Ecological Function Area of Guangxi-Guizhou-YunnanGQD12Tropical Rainforest Ecological Function Area in Mountain Areas in the Middle of Hai’nan IslandHND25
Ecological Function Area on Hulun Buir Pasture LandHLBR13
Table 2. Correlation coefficients between dry weight and variation.
VariablesForestShrubGrassFarmland
ENDCEBDBMF
Elevation (E)0.40 ** 0.100.08
Latitude (LAT)−0.18 ** −0.13 * −0.46 **−0.44 **
Longitude (LON) −0.51 *
Annual Precipitation (P)0.12 ** 0.34 **
Annual Average Temperature (T)−0.07 −0.100.19 **
LAI (LAI)0.59 **−0.59 **−0.78 **0.55 **0.52 *0.22 *0.38 **
NDVI (NDVI) 0.94 ** 0.16 **
Grain dry weight (G) 0.87 **
Note: * represents p ≤ 0.05; ** represents p ≤ 0.01.
Table 3. Multiple linear regression model of 10 species.
TypeLinear RelationshipR2REE (%)
ENY1 = 0.097E + 12.88LAT + 0.07Pre + 18.14T + 14.35LAI + 779.380.5232
DCY2 = 19.78LAI − 49.14NDVI + 51.570.9022
EBY3 = 0.061E + 6.51T + 16.17LAI − 119.550.7424
DBY4 = 0.052E + 14.13LAT + 0.16Pre + 9.24T + 8.11LAI − 45.21NDVI − 686.680.499.4
MFY5 = −11.37LON + 12.03LAI + 1292.630.6821
ShrubY6 = −0.59LAT + 0.15LAI + 21.940.271.5
GrassY7 = −0.20LAT + 0.09LAI + 6.760.360.38
FarmlandY8 = 1.98G + 0.160.72-
WetlandY9 = 400 g/m2--
DesertY10 = 2 g/m2--
Table 4. Reference value of water conservation function importance coefficient ω.
Land Cover TypesCroplandForestShrubGrasslandArtificial SurfaceOthers
ω0.51.510.50.10.1
Table 5. Transitions in percentages of total land covers under observed during 2000–2010 (%).
20002010Total (2000)LossNet Gain in 2010Changes in 2010
Ecological LandNon-Ecological Land
WLFoLBLGLFaLRSUSSL
Ecological LandWL4.4040.0000.0010.0290.0230.0000.0020.0114.470.07−0.01−0.32
FoL0.00618.4410.0210.0360.0230.0010.0040.00018.530.090.050.26
BL0.0020.0384.6780.0130.0060.0000.0010.0004.740.060.010.19
GL0.0240.0560.03540.4910.1460.0020.0040.07440.830.34−0.13−0.32
Non-Ecological LandFaL0.0120.0420.0120.0748.1480.0070.0130.0048.310.160.070.84
RS0.0000.0000.0000.0000.0000.2630.0000.0000.260.000.013.24
US0.0000.0000.0000.0000.0000.0000.0630.0000.060.000.0341.73
SL0.0080.0010.0010.0600.0350.0000.00322.68022.790.11−0.02−0.08
Total (2010)4.4618.584.7540.708.380.270.0922.77100.000.83
Gain0.050.140.070.210.230.010.030.090.78
Note: WL—wetland and water areas; FoL—forest land; BL—bush land; GL—grassland; FaL—farmland; RS—rural settlements; US—urban settlements; SL—sand areas and bare land.
Table 6. The type of land conversion in NKEFA in 2000–2010.
TypeWater-Source Conservation Functional AreaSoil and Water Conservation Functional AreaWindbreak and Sand Fixation Functional AreaBiodiversity Maintenance Functional Area
1GNGQD, HTGY, SXYSCD, QB, WLS
2 ZDN, ZXB
3XAL, REG, CBS, SJYDBSHLBR, HSDK, KEQ HND, NL, SJPY
4QLS AEJ
5AET TLM
Note: 1—Land cover was dominated by ecological land and the proportion of non-ecological land conversion to ecological land was higher than that of ecological land conversion to non-ecological land between 2000 and 2010. 2—Land cover was dominated by ecological land and had no change between 2000 and 2010. 3—Land cover was dominated by ecological land, and the proportion of ecological land conversion to non-ecological land was higher than that of non-ecological land conversion to ecological land between 2000 and 2010. 4—Land cover was dominated by non-ecological land, and the proportion of non-ecological land conversion to ecological land was higher than that of ecological land conversion to non-ecological land between 2000 and 2010. 5—Land cover was dominated by non-ecological land, and the proportion of ecological land conversion to non-ecological land was higher than that of non-ecological land conversion to ecological land between 2000 and 2010.
Table 7. Comparison with similar studies.
Literature SourcesTotal Water Conservation Amount
(×108 m3)
Study AreaMethodData
Gong et al., 2017 [21]12,224.33forest, shrub, grassland, garden, and wetland ecosystem in ChinaWater balance equationEcosystem type: extracted by Landsat TM
Precipitation and temperature: China National Metrology Information Center(NMIC)/China Meteorological Administration(CMA)
Actual evapotranspiration: The Land Processes Distributed Active Archive Center (LP DAAC), Institute of Geographic Sciences and Natural Resources Research (IGSNRR)
Huang et al., 2015 [42]1050.72
(in 2000)
1081.56
(in 2010)
eight water-source conservation functional area: XAL, CBS, AET, QLS, GN, REG, SJY, NLPrecipitation storage method (without considering the spatial variation effect of vegetation coverage on runoff reduction efficiency)Land cover data: extracted by Landsat TM
Precipitation: China Meteorological Administration(CMA)
Other data: literature research
This study4674.98
(in 2000)
4048.51
(in 2010)
NKEFAsWater balance equationLand cover data: :Institute of Remote Sensing Application, Chinese Academy of Sciences
Meteorological data: China Meteorological Administration(CMA)
Other data: literature research
This study1050.72
(in 2000)
1081.56
(in 2010)
eight water-source conservation functional areas: XAL, CBS, AET, QLS, GN, REG, SJY, NLWater balance equationthe same as above

