Tourist Satisfaction, Image, and Loyalty from an Interregional Perspective: An Analysis of Neighboring Areas with Distinct Characteristics

Graduate School of Environmental Studies, Interdisciplinary Program in Landscape Architecture, and Environmental Planning Institute, Seoul National University, Seoul 08826, Korea
Sustainability 2018, 10(4), 1283; https://doi.org/10.3390/su10041283
Submission received: 5 April 2018
/
Revised: 18 April 2018
/
Accepted: 19 April 2018
/
Published: 21 April 2018
Abstract
:A comparison is made among the three areas of the Korean Capital Region to investigate the effects of their different tourism resources on attribute satisfaction and the relationships that attribute satisfaction has with overall satisfaction, country image, and tourist loyalty. Three partial least squares structural equation models find that costs, lodging, and communication are consistently unimportant, but the most important variable differs by area. In Seoul (an international shopping center), shopping is paramount; food is most important in Incheon (where its local cuisines have been well publicized); and satisfaction with tourism administration services is highly valued in Gyeonggi (which lacks facilities for foreign tourists). At the construct level, overall happiness exerts a stronger direct effect on image than on loyalty, but if its indirect effect is considered, the total effect on loyalty surpasses that on image. This is particularly true in Gyeonggi, where tourism resources are less exploited.
1. Introduction
Sustainable development through international tourism has been extensively explored [1] and it is particularly so in Asian countries such as Korea [2]. International visitors to Korea continue to grow in number, up from over 10 million in 2012 to 13 million in 2015 [3]. Since the 1990s, Korea has experienced two international tourism booms: the first from 1996 through 2000 when three million visited, and the second from 2008 to 2012, a period in which 10 million tourists visited Korea; this corresponds to a 9.6% annual growth rate during the first inbound boom and 12.8% during the second [3]. The first boom was caused by the Asian economic crisis in the late 2000s, which made the national economy of Korea unstable. This resulted in a weaker won, which virtually halved the price of a tour to Korea. The second inbound boom was primarily due to a rise in Chinese tourists. Chinese visitors to Korea starkly increased from 0.44 million in 2000 to 6.12 million in 2014. Other considerations are Japanese visitors, who also increased in the late 2000s [4] and the growing potential of Russian tourists [5]. In light of these numbers, the Korean government set a goal of having 20 million foreign tourists by 2020, and developed marketing strategies at different levels. Thus, the public and industrial importance of foreign tourism has grown even larger.
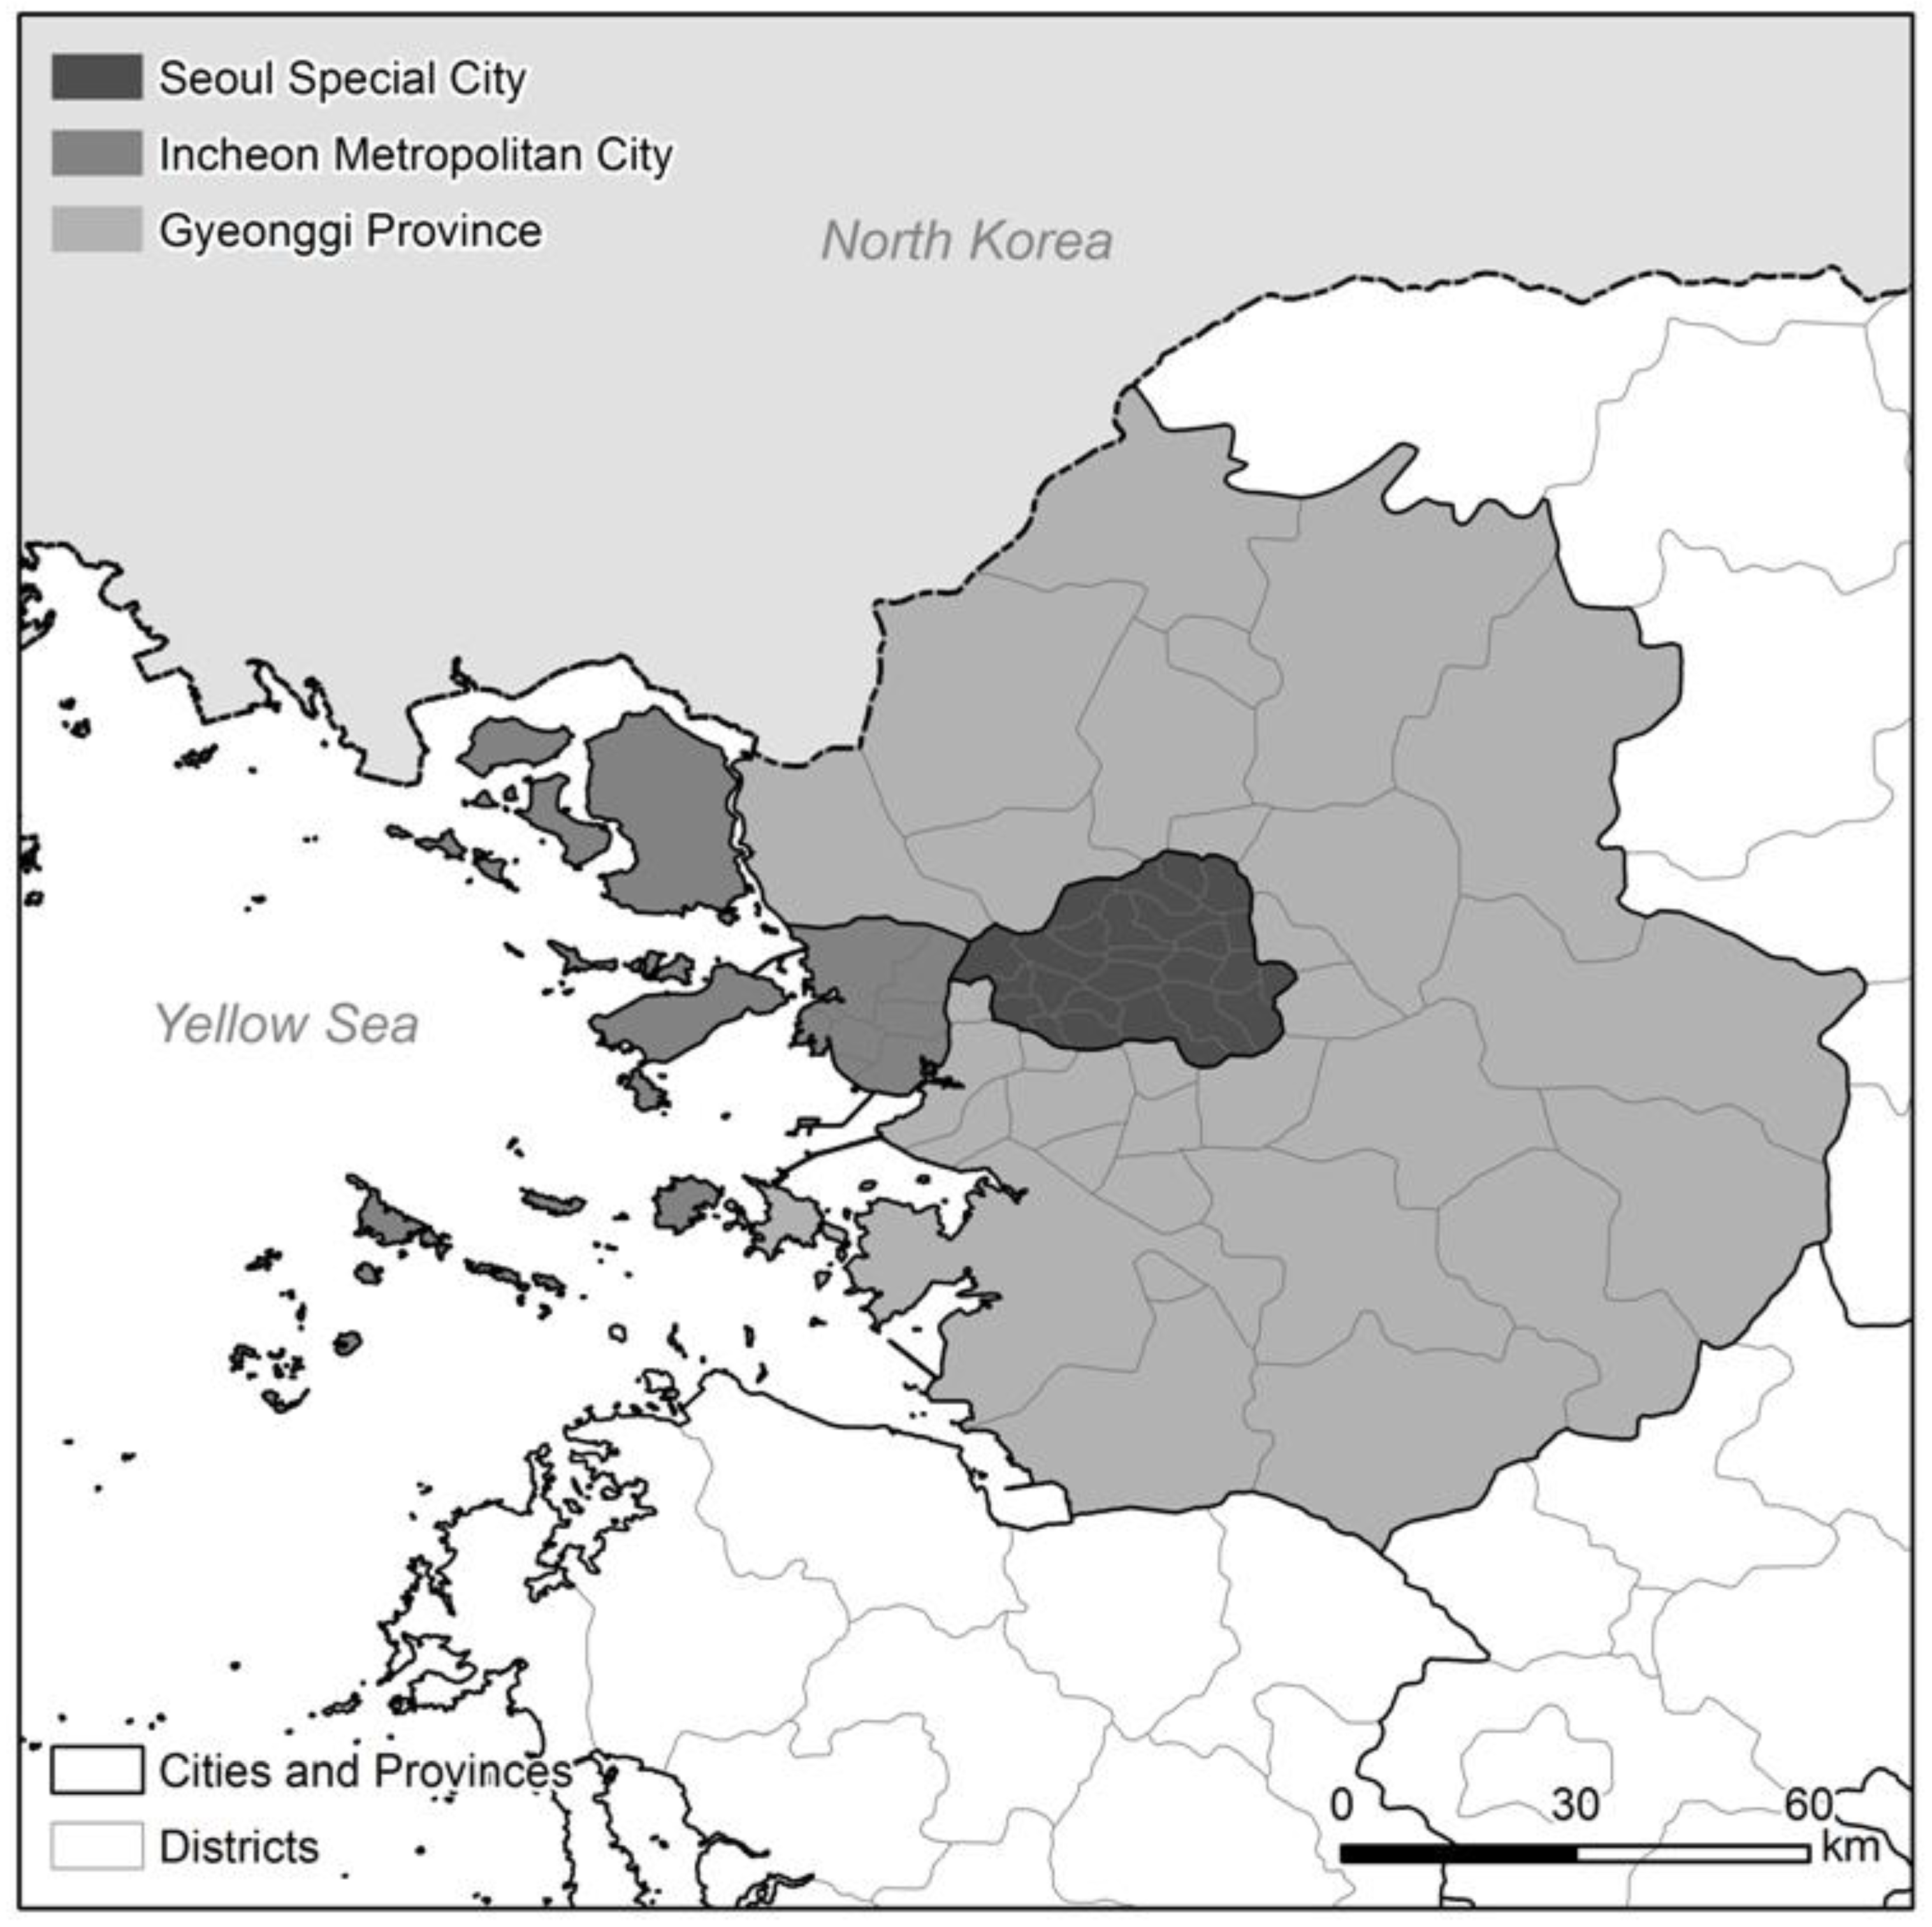
The most visited destination for foreign tourists is the Korean Capital Region (KCR), which occupies only 11.8% of the country’s territory (11,830 km2), but accounts for 49.4% of the population (25 million). The three areas of the region, Seoul Special City, Incheon Metropolitan, and Gyeonggi Province, have different characteristics. As the national capital, Seoul dwarfs other Korean areas in terms of its political, economic, social, cultural, and educational functions [6,7]. Though next to Seoul, Incheon has developed its own urban environment. This harbor city experiences a continuous inflow of international workers, has old-style Japanese settlements, and houses the most famous Chinatown in Korea. Gyeonggi is equipped with the satellite cities of Seoul, functioning as a suburb and it also features recreation centers and leisure facilities [8].
Notably, in 2015, the largest proportion of foreign tourists (80.4%) visited Seoul, whereas Gyeonggi experienced a continuous decline in the number of foreign tourists despite being the most visited area among Korean tourists for the last five years in a row (40.3% in 2015). Such differences in the foreign tourism trends can be explained by comparing regional differences in tourists’ satisfaction with different attributes of tourist resources/services, differences in the image, and their intention to revisit and to recommend the site to others. (These two intention variables can be collectively used to measure tourist loyalty, also called behavioral intention. The revisit intention is referred to as behavioral loyalty and the recommendation intention as attitudinal loyalty, also called word of mouth intention. The image is widely defined as a set of beliefs, ideas, and impressions on a particular place or destination [9].)
The relationships among tourism satisfaction by attribute, overall satisfaction, image, and loyalty have been analyzed in a number of different studies [10]. The relationships were empirically confirmed in terms of their significance (to be discussed below), but few studied the magnitudes of the relationships, which may differ among areas. In particular, research on the relationships has been conducted based mostly on a certain case area; studies comparing different areas are rare [11,12,13]. Although some recent studies did make comparisons, their purpose was to analyze the characteristics of those visitors to the same area. For example, Han et al. [5] investigated how Chinese and Russian tourists have different needs, Goo et al. [14] and Bui and Le [15] analyzed differences between domestic and foreign visitors in their satisfaction levels, and Jin et al. [16] studied how the satisfaction–loyalty relationship differs between first-time and repeat visitors. There are very few studies that have compared multiple areas. This is partially because satisfaction differences are examined from the perspective of the individual tourist, which may be useful for providing strategic implications (e.g., market segmentation) for a local government. However, differences need to be studied in relation to the characteristics of the study area, which would be desirable in developing tourism-related strategies at the national level.
The purpose of this study is to analyze the relationship among attribute satisfaction, overall satisfaction, image, and tourist loyalty (intention to revisit and to recommend) in the three areas of the KCR: Seoul, Incheon, and Gyeonggi (see Figure 1). The relationship is examined using three area-specific SEM (structural equation modeling) of the KCR sample of the 2015 Foreign Tourist Survey data.
2. Literature Review
The relationship among tourist satisfaction, image, and loyalty has been studied since the 1970s [17,18,19,20]. Among a plethora of empirical/theoretical studies and reviews of the studies [21,22,23] that discussed those presented below, readers are advised to refer to Bhat’s comprehensive analysis [24] and Hjalager and Nordin’s review [25] on which this study is particularly grounded. First and foremost, a review of more than 140 studies in or before 2000 [26] found that a majority used countries as the unit of analysis, particularly those in North America. As such, their findings are not highly transferrable to regional-level non-North American cases. More recently, studies that examine non-North American areas increased considerably, the results of which will be presented below.
Almost all studies on the satisfaction–loyalty relationship found strong correlations. Abdalla et al. [27] conducted a survey of 203 foreign tourists who visited Angra dos Reis, a Brazilian city known for its tourism. They used SEM to test relationships that affect service quality and satisfaction with intention to recommend. They found that satisfaction influences the recommendation intention. Assaker et al. [28] used intention to revisit as the main concept and modeled its relationship with novelty seeking, image, and satisfaction. Tested through SEM, the analytical model presented a significant link between low satisfaction and reduced intention to revisit. Likewise, Dayour and Adongo [29] modeled data based on a survey of 650 foreign tourists to northern Ghana. Looking at travel motive, satisfaction, and intention to revisit, their simple binary logistic regression model identified that satisfaction strongly influenced intention.
Along with satisfaction and loyalty, the tourism literature has frequently analyzed the concept of image. The relationship between image and satisfaction is specified through either the image–satisfaction path or the satisfaction–image path. The path difference is determined by (1) the time of the image measurement and (2) the subject of the image evaluation. First, as a dynamic concept, image can be measured before, during, and after the visit (i.e., pre-visit, on-site, and post-visit images) [30]. The pre-visit image involves the formation of the visit intention and choice of the destination [31]. This image can be further developed during the visit and affects tourists’ satisfaction [31,32]. The post-visit image affects tourists’ loyalty [33].
Most studies recruited survey respondents at a particular site and measured the on-site image, which was used to clarify the image–satisfaction relationship. These days, however, a growing number of studies (see, for example, Da Graça Batista et al. [34]) analyze the satisfaction–image relationship by measuring the post-visit country image of those who finished their tours.
Second, the image can be either the country image or the more specific destination image, which has been analyzed in tourism studies [35,36]. The marketing field has long studied how satisfaction affects the country image [37]. This differs from the tourism perspective, in which the destination image is considered an antecedent to tourists’ satisfaction with the destination [38,39]. This study evaluates the satisfaction–image relationship by using the country image concept in relation to tourism [40].
The pre-visit or on-site image was consistently found to affect tourist satisfaction. Al-Majali [41] studied the relationship of the perceived risk, pre-visit image, service quality, and others with satisfaction. Based on SEM of survey data of 500 tourists to Jordan, they reported the image–satisfaction relationship to be significant. Bui and Le [15] grouped a sample of 650 visitors to Ha Long Bay, Vietnam into domestic and international tourists in order to examine their differences. In both groups, the on-site image turned out to be a determinant of tourist satisfaction. Puh [31] highlighted the role of the image in tourists’ choice of the destination and their expectation/satisfaction and confirmed the image–satisfaction relationship using SEM of survey data from 705 tourists who were intercepted at hotels and private accommodations in Dubrovnik, a popular tourist site on the Adriatic coast.
As a step forward from the image–satisfaction relationship, analytical results of an integrative model of the image–satisfaction–loyalty relationship are also well documented. For a comprehensive understanding of destination loyalty, Chi and Qu [10] conducted a survey of 345 visitors to Eureka Springs in Arkansas and analyzed the relationship of loyalty with image, tourists’ individual characteristics, and overall satisfaction. Their SEM model found the image–satisfaction–loyalty relationship to be statistically significant. Banki et al. [42] collected data from a survey of 217 first-time visitors to Obudu Mountain Resort in Nigeria and based on SEM of the data, they reported that the cognitive and affective images function as confounders in the satisfaction–loyalty relationship, that is, the images affect both of the factors. (As an external stimulus, the cognitive image is a functional attribute that is formed by the characteristics of the destination and the affective image is the expression of an individual tourist’s subjective ideas and feelings [43,44].) Çoban [45] also confirmed the relationship of the cognitive and affective images–satisfaction–loyalty through factor and regression analyses of survey data from 170 visitors on a guided tour to Cappadocia, a historic Turkish city. Chiu et al. [46] conceptualized the image–satisfaction–loyalty relationship and confirmed it using data from an on-site survey of 503 Chinese tourists who were recruited through convenience sampling at popular tourist spots in Seoul, Korea. Goo et al. [14] conducted a survey with 254 convenience-sampled visitors to Batu Ferringhi Beach in Penang, Malaysia to investigate differences between domestic and foreign tourists in their image of the beach and satisfaction. While satisfaction differences existed between the groups, regression models confirmed in both groups the relationships between image–satisfaction, image–loyalty, and satisfaction–loyalty. Jamaludin et al. [47] intercepted a total of 241 tourists at several rest areas in the State of Perak, Malaysia who visited during the “Visit Perak Year” campaign. Their SEM of survey data from the tourists identified the relationship of the image–tourist satisfaction–destination loyalty. Jin et al. [16] also used SEM to analyze whether the effects that image and satisfaction have on loyalty differ between first-timers and repeat visitors at a water park. Their model confirmed the paths of image–satisfaction, image–loyalty, and satisfaction–loyalty and the difference in the image–satisfaction relationship.
While many earlier studies argued that the pre-visit and on-site images work as an antecedent of the satisfaction–loyalty relationship, there are a growing number of studies looking at how satisfaction with the tour affects the post-visit country image. For example, De Nisco et al. [35] confirmed through SEM the conceptual path of satisfaction–image–loyalty using data from a survey that was conducted at two international airports in Italy with 542 foreigners who had finished their trips. In general, the satisfaction–image–loyalty relationship tends to be studied by specifying the mediating effect of the image; studies considered not only the direct effect of satisfaction on loyalty, but also its indirect effect through the satisfaction–image–loyalty path. (Likewise, studies that measured the pre-visit or on-site image specified satisfaction as a mediator in the image–loyalty relationship (e.g., [33,42,45,48,49]); according to this relationship, image becomes a confounder.) Da Graça Batista et al. [34] conducted a survey of 107 visitors to São Miguel Island in Azores, Portugal, and by analyzing the survey data through SEM, they found that variations in satisfaction alter the post-visit image and loyalty, measured by the intention to revisit. They found that the satisfaction–loyalty relationship is also present through the satisfaction–image–loyalty path. Kim et al. [50] conducted a survey with spectators of Formula 1 Chinese Grand Prix to test whether image has a mediating effect in the relationship between spectator satisfaction and loyalty (intention to revisit and to recommend). They found that the visual feature satisfaction and accessibility satisfaction have effects on loyalty that are mediated by image, but those of the ticket satisfaction and staff service satisfaction are not mediated (that is, only their direct effects are significant). Meanwhile, De Nisco et al. [35] identified a model in which satisfaction did not have a direct effect on loyalty, but only an indirect effect through its effect on image (i.e., only through the satisfaction–image–loyalty path), and as such, they suggested image was not a mediating but an intervening variable.
In short, studies in the 2010s mostly chose a case area in which a questionnaire survey was conducted with tourists who were selected mainly by convenience sampling. (Meanwhile, more recent studies [51,52] highlighted the importance and availability of traveler-generated contents such as travel blogs and online travel reviews disseminated through eWoM communication [53,54].) The primary data of the survey has been analyzed the most frequently through SEM insomuch as it can examine a multiple number of relationships altogether. In a conceptual model for SEM, studies that used the post-visit and country image, as with this study, tended to specify the image as a mediator of the satisfaction–loyalty relationship.
3. Data
First conducted in 1974 by the Korea Culture and Tourism Institute (KCTI), a national research institution, the Foreign Tourist Survey keeps track of such variables as international visitors’ travel types, spending, and experiences [55]. This annual survey is conducted at international airports and ports for seven days per month and respondents are chosen through quota sampling, by the respondent’s nationality, among those who are preparing to leave Korea. This study chose only those whose visit purpose was tourism from the database of the 2015 survey. Specifically, this study selected respondents if for the questionnaire item of visit purpose, they selected (1) culture, leisure, or holiday, (2) beauty, health, or therapy, (3) religion or pilgrimage, or (4) shopping and thus, excluded those who chose (5) visiting friends or family, (6) business or professional activities, (7) study/education, or (8) others. Secondly, among these tourists, it selected those who visited only one of the three areas: Seoul, Incheon, and Gyeonggi. This selection encompassed a total of 3,756 people for the sample used for empirical analyses. (The total number of people who visited the Korean Capital Region (i.e., one or more of the three areas) was 4485, indicating that a majority of them (83.75%) visited only one area.) The data of the sample can be downloaded online at https://drive.google.com/open?id=0B8PPoWtariY1MkNjNXpfRG5yYVU. Table 1 shows the descriptive statistics of the final sample. In the sample, most people are from China or Japan, followed by those from other Northeast Asian countries. This result is congruent with the overall foreign tourist population.
Table 2 presents the descriptive statistics of those indicator variables that were included in partial least squares structural equation modeling (PLS-SEM) models: satisfaction (attribute and overall), image, and loyalty. For most attribute satisfaction variables, the means are higher than four (out of five), indicating that respondents were generally satisfied. However, levels of satisfaction with communication (3.786) and travel costs (3.950) were relatively low. Difficulties communicating in English is an issue that has been frequently mentioned by international visitors to Korea [56,57,58,59] and low satisfaction with travel costs may reflect the high prices in the Capital Region rather than across the entire country. Meanwhile, it is worth noting that tourists’ image of Korea improved by 0.310 on average. Most importantly, the variations of all variables are wide enough to allow for inferential statistics.
4. Partial Least Squares Structural Equation Modeling
The SEM methodology used in this study is not the conventional CB-SEM (covariance-based SEM), but variance-based PLS-SEM. This technique is used because attribute satisfaction variables are not phenomena that reflect satisfaction. With different weights, the variables contribute to the formation of satisfaction and in computing the weights, PLS-SEM acknowledges the fact that the variables are orthogonal, in contrast to CB-SEM. Additionally, it is free from several CB-SEM limitations in relation to (1) the formative measurement, (2) number of indicators, (3) normality assumption, and (4) sample size [60].
Attribute satisfaction variables are not some phenotypes of an abstract construct (factor) called satisfaction, as assumed in common factor analysis (in this case, specifying the indicator-factor relationship is treated as a process through which reflective indicators make a scale) but instead, the variables as a whole are considered to form a satisfaction index. The formative measurement is because indicators are independent of each other (for example, food satisfaction and communication satisfaction are two distinct indicators). As such, attribute satisfaction variables become formative, not reflective, indicators, and in Figure 2, arrows go not from factor to indicator, but indicator to factor.
With regard to the formative measurement, the most notable strength of PLS-SEM is that unlike conventional CB-SEM, this technique does not have to go through a complex respecification process to include formative indicators [61]. Indeed, many studies choose PLS-SEM as a way for including formative constructs in their research models (e.g., for testing Consumer Satisfaction Index models [62]). Tourism studies recently began to use PLS-SEM [63,64]. For example, using data from 398 visitors to Málaga, Spain, Guzman-Parra et al. [65] confirmed a model in which humanware and hardware form tourist satisfaction, which subsequently affects loyalty. Similarly, Folgado-Fernández et al. [66] used PLS-SEM to test the formative relationship between cultural heritage, events, infrastructure, tourist attractions and tourists’ image.
The second strength of PLS-SEM is related to the minimum number of indicators. Ideally, CB-SEM requires three to five indicators per construct. If they are out of this range, the model tends to be unidentifiable. By contrast, PLS-SEM has no limitation concerning the number of indicators per construct. In this study, the construct of attribute satisfaction consists of 10 indicators and the overall satisfaction construct has only one indicator.
The third and fourth strengths of PLS-SEM are based on its nonparametric characteristics (e.g., bootstrapping for significance testing). PLS-SEM is free from limitations on the normality assumption and minimum sample size and thus, it is favored for very non-normal and/or very small-size data. First, PLS-SEM has been deemed alternative path modeling to CB-SEM when this conventional SEM cannot be applied to non-normal data. Table 3 shows that all indicators for this study have very non-normal distributions (because most respondents were “satisfied” or “very satisfied” for all of the survey items).
The fourth strength of PLS-SEM is that this technique is extremely stable with small sample sizes [67]. Empirical studies [68,69] reported that in terms of convergence, PLS-SEM performs better than CB-SEM with small-size samples. As a rule-of-thumb, the number of cases is required to be larger than 10 times the maximum paths that any latent variable has in the structural model that specifies construct-level relationships [60,70]. According to this 10-times criterion, the minimum sample size for this study is 10 because in all models, no latent variables have more than one structural path. As another criterion, Tenenhaus, one of the PLS-SEM pioneers, showed that PLS-SEM works well with a minimum of six cases even when the model specifies complex relationships [71]. Through simulation, Henseler et al. [68] concluded that PLS-SEM can be used in cases in which the number of cases is less than that of variables (whether exogenous or endogenous) or parameters, and it is a useful method when other statistical methods, including CB-SEM, are not recommended due to small sample sizes.
5. Results
This study compares three area-specific PLS-SEM models, each of which used survey data for Seoul, Incheon, and Gyeonggi. In the models, the combination of the attribute satisfaction indicators was specified to affect the overall satisfaction, which was subsequently modeled to influence the country image (post-visit and before–after change) and tourist loyalty (intention to revisit and to recommend). Since the image may mediate the relationship between the overall satisfaction and loyalty, the model also included the satisfaction–image–loyalty path.
5.1. Outer Weights: Statistical Significance
Figure 2 shows the results of SmartPLS analyses, a statistical software program developed exclusively for PLS-SEM. The left column presents standardized coefficients (outer weights for formative indicators, outer loadings for reflective indicators, and structural path coefficients between factors) and the right t-values for significance testing of the coefficients. Figure 2 is detailed in Table 4 where t-values are transformed into p-values. (Along with the attribute satisfaction construct (SATIS_D), the image construct (IMAGE) was formatively measured, in the sense that its two indicators, post-visit country image and image change, are conceptually independent of each other. Because of the collinearity issue, however, they were turned to be reflective; it is a convention of PLS-SEM.)
While the Foreign Tourist Survey has long used 10 attribute satisfaction variables as a reference for tourism policymaking, in each of the Seoul, Incheon, and Gyeonggi models, four, five, and four of the 10 variables were found to be insignificant, respectively, at the 10% significance level (see Table 4). (All significance testing was conducted at the 90% confidence level.) First of all, costs (i.e., s_costs --> SATIS_D) were not significant in any of the three models. This implies that visitors to the Korean Capital Region do not care much about travel costs; it is worth noting that relative to other attribute satisfaction variables, most respondents were not satisfied with the price level according to the mean (see Table 2) and distribution. (In the survey, the item of satisfaction with travel costs was defined as the “level of satisfaction with the prices of tourism products and at tour sites”.)
Satisfaction with food and that with tour site were insignificant variables only among Gyeonggi tourists. This may be because relative to Seoul and Incheon tourists, visitors to Gyeonggi tend to give more weight to exotic experiences and suburban/rural leisure activities. For example, Gyeonggi is equipped with unique tourism resources for the DMZ (Demilitarized Zone) and other security tourism locations (Panmunjom or the Joint Security Area is one such place, in which the Korean Armistice Agreement was signed in 1953 to cease the Korean War, and where discussions between North and South Korea still take place. Gyeonggi also houses underground tunnels where North Korea infiltrated South Korea. Imjingak is a park with statues and monuments about the Korean War, as well as the Unification Observatory). Gyeonggi also offers experiences in leisure and sports (e.g., rental cabins/cottages, sky resorts, and resort hotels in Yangpyeong, Gapyeong, and Ansan); and history tourism (e.g., Hwaseong Fortress in Suwon and Korean Folk Village in Yongin).
5.2. Outer Weights: Relative Importance of the Attribute Satisfaction Variables
Outer weights of the attribute satisfaction variables can help local policy-makers and planners understand what to highlight to effectively increase tourist satisfaction. This is because the weights are not universal, but differentiated by tourism resources of the area, or more generally, its urban, transportation, social, historical, and cultural environments [72]. In the Seoul model, a notable result is that shopping (0.3408) was the most important variable. This supports the frequent declaration by the press that Chinese and Japanese tourists visit Seoul primarily for shopping [73,74]. Also of note is that the shopping variable was not statistically significant in the other two study areas, indicating that visitors to Incheon and Gyeonggi do not have high expectations for shopping. Because complaints about shopping in Seoul have been growing particularly among package tourists [73,74], the above result indicates the importance of addressing these complaints [75]. In addition to shopping, tour sites (0.2744) and food (0.2556) had high magnitudes in the Seoul model, followed by entry service (0.1845). Lodging (0.1041) and communication (0.0637) were less important.
For visitors to Incheon, those variables with moderate or above weights in the Seoul model were also important to satisfaction, but with different values: food (0.7482), entry service (0.4427), and tour sites (0.2269). The high importance of food can be explained by the efforts of the metropolitan government. For example, since the year of 2003, it has held the annual Incheon Food Culture Festival, emphasizing the originality, variety, quality, and uniqueness of Incheon cuisine. As a harbor city and an entry point to Seoul, Incheon has been highly responsive and adaptive to outer impacts and changes. China Town in Incheon, the biggest in Korea, is famous for Korean-style Chinese noodles (e.g., Jajangmyeon and Jjamppong) as well as Chinese stuffed pancakes and mooncakes. Also, South Korean-style cold noodles (Naengmyeon), Korean-style spaghetti noodles (Jjolmyeon), and spicy Korean fried chicken (Dalgangjeong) were all developed in Incheon. In addition, this city contains various food cultures that were introduced by international workers and are now served in fine restaurants in the Songdo International Business District. This coastal city is also well known for raw fish and pickled seafood. As with Seoul, communication (–0.2053) and lodging (0.0388) were not important variables for tourists to Incheon.
In the Gyeonggi model, attribute satisfaction variables with high weights differed from those found in the Seoul and Incheon models. First, the most important variable was entry service (1.0476). This may indicate the inconvenience and difficulty in traveling in Gyeonggi. By analyzing the data of the 2015 National Tourism Survey—a domestic version of the Foreign Tourist Survey—the KCTI found that of the total 16 metropolitan cities and provinces, Gyeonggi has been the most visited area by domestic tourists for five consecutive years, but the number of foreign tourists has decreased. This may be because domestic tourists have easy access to private tour information, while foreign tourists may not be able to make an in-person visit. Developing package tour programs customized for foreign travelers could increase the number of tourists to this region.
The second most important variables for tourists to Gyeonggi were tour information service (−0.6160) and public transportation (−0.6093). Notably, the coefficients are negative, which implies that if excessive, information services and public transportation may have a negative effect on satisfaction. It may be best to keep tour information and public transportation services as they are.
Moderate importance was given to security (0.5208), which was not significant in the Seoul and Incheon models. This result implies that visitors to suburban/rural areas tend to worry about safety more than those visiting big cities in Korea. Lastly, similar to Seoul and Incheon, tourists to Gyeonggi considered lodging (−0.4155) and communication (−0.4155) less important. Since communication and lodging were of low importance across all three diverse areas, it may suggest that despite tourists’ relatively low satisfaction levels in these areas (see Table 2), in the short term, planners and policymakers should focus on other issues.
5.3. Outer Loadings: Configuration of the Factors
Outer loadings in PLS-SEM (magnitudes of the factor–indicator relationships) are identical with factor loadings in common factor analysis of CB-SEM. Thus, outer loadings define the characteristics of the latent factor [76]. First, as to the loyalty factor (INTENT), while both indicators were significant, intention to revisit was found to better reflect the factor than intention to recommend in all of the three area-specific models. In the case of the image factor (IMAGE), the post-visit country image and image change were both significant among tourists to Seoul, but the post-visit image had more of an effect. In the Incheon and Gyeonggi models, however, the change variable was not significant and the post-visit image almost entirely explained the factor.
5.4. Structural Path Coefficients: Construct Validity of the Formative Measurement
The coefficient of the SATIS_D --> SATIS_O path shows how strongly the 10 variables as a whole determine a tourist’s overall satisfaction. In fact, when attribute satisfaction variables form a construct, the formative construct can be specified to affect a construct with reflective indicators (often a single global indicator such as overall satisfaction) in order for redundancy analysis. This analysis uses the path coefficient between the formative construct (combination of attribution satisfaction variables) and the reflective construct (overall satisfaction) to test formative construct validity, particularly the convergent validity of the formative measure [77]. If the two measures (formative and reflective measures of the same construct) have high positive correlation, the validity is confirmed. The name, ‘redundancy analysis’, originates from the fact that the measurement is done formatively and then reflectively [77].
The correlation threshold for securing the validity is 0.7 because in this case, the explained variation is above 0.5: R2 = 0.5 (≈0.7 × 0.7) [60]. In Figure 2 and Table 4, the standardized coefficient of SATIS_D --> SATIS_O is 0.565, 0.739, and 0.752 in each of the Seoul, Incheon, and Gyeonggi models (all are significant). However, the correlation is below the threshold in the Seoul model. This may be because the ten attribute satisfaction variables are used for the whole country, but some may be inappropriate for Seoul, or more variables might be required.
If the Seoul government tries to refine the indicator variables to develop its own satisfaction index, they should consider that particularly for a formative construct (unlike a reflective construct), the addition or change of the variables alter the meaning of the construct itself and thus, all additions/removals/changes should be theoretically and conceptually supported. The ten variables in the Foreign Tourist Survey have been used for decades and their validity has been acknowledged historically and academically. The development and refinement of a measure necessitates the consent and face validity through expert reviews to establish translational validity, prior to construct validity through factor analysis [78]. Expert surveys could help facilitate the process for the development of a Seoul-specific satisfaction index.
Notably, unlike the fields of consumer studies and survey methods in which the relationship between the combination of attribute satisfaction variables and the overall satisfaction has been examined in relation to convergent validity, tourism studies have not tested this relationship. Indeed, previous studies [10,31,79,80,81] reached the consensus that overall destination satisfaction should be treated differently from attribute satisfaction on the destination level, which is because the overall satisfaction is a much wider concept than the attribute satisfaction combination [79]. Thus, the relationship that satisfaction has with other tourism variables (image and loyalty, for example) should be examined based on overall satisfaction [82]. The relationship between the attribute and overall satisfaction constructs should be analyzed beforehand. That is, the path coefficient of SATIS_D --> SATIS_O should be understood in relation not to measurement validity, but to how well attribute satisfaction variables as a whole explain overall satisfaction.
5.5. Structural Path Coefficients: Effects of the Overall Satisfaction on Tourists’ Image and Loyalty
Among the constructs of overall satisfaction, image, and loyalty, the image construct was specified as a mediator of the satisfaction–loyalty relationship. Accordingly, satisfaction not only has a direct effect on loyalty, but also an indirect effect through its effect on image. As in Table 5, the total effect is the sum of the direct and indirect effects.
Along with previous studies examined in the literature review section, satisfaction turned out to have positive effects in improving both loyalty and image across the three areas. In terms of the relative magnitudes of the effects that satisfaction has on image and loyalty, first, satisfaction consistently had the stronger direct effect on image than on loyalty. The magnitude difference was the largest in Incheon (3.27 times = 0.4084/0.1248) and the smallest in Gyeonggi (1.08 times = 0.5103/0.4724).
Notably, if the mediating effect of image was considered, that is, when the indirect effect of satisfaction (through the satisfaction–image–loyalty path) was combined with its direct effect, the total effect on loyalty became larger than that on image particularly in the Gyeonggi model (0.6098 > 0.5103). Also, in the case of Incheon where the direct effect on image was strong, the indirect effect through the satisfaction–image–loyalty path (0.2158) was even larger than the direct effect of the satisfaction–loyalty path (0.1248).
The above findings suggest that in Gyeonggi, various activities to promote satisfaction would have a better short-term direct effect in improving loyalty compared to other areas and in the long term, the activities will bring about even higher loyalty by improving image. This is partially because, as described before, foreign tourists feel that Gyeonggi is less accessible (high weight of the entry service variable), implying that satisfaction promotion is more effective in less developed areas.
In the case of Incheon, the strength of the indirect satisfaction–image–loyalty relationship over that of the direct satisfaction–loyalty relationship highlights the importance of image as a mediator. Thus, in addition to usual satisfaction promotion programs, a national-level strategy for promoting the country image would help the tourism industry in Incheon, given the close image–loyalty relationship (IMAGE --> INTENT = 0.5285).
In conclusion, if satisfaction promotion has two purposes, improving the overall image of a country and increasing tourists to a destination (especially through higher loyalty), in the short term, it will act better on improving the image than on the loyalty without regard to areal characteristics. In the long term, however, Gyeonggi will be given a notable effect in loyalty improvement as facilitated by the better image. In Incheon, efforts to build a favorable country image, separate from satisfaction promotion, will benefit the area most strongly. Previous studies reported that image ultimately affects intention to revisit and recommend and this study also found the image–loyalty relationship to be consistently significant. Image encourages people who plan a tour to positively consider a particular area in searching and determining their destination and at the same time, it increases intention to purchase a product made in the area [35]. Meanwhile, the effect of the country image on loyalty was the strongest in Incheon (0.5285), followed by Seoul (0.3931) and Gyeonggi (0.2693) (not only among the three areas, but also among the three paths (SATIS_O --> IMAGE, SATIS_O --> INTENT, and IMAGE --> INTENT), the IMAGE --> INTENT path was the strongest in Incheon, the second strongest in Seoul, and the weakest in Gyeonggi) and this may imply that programs for country image promotion more strongly benefits the second and third cities of a country than the first city, which is already popular among foreign tourists, and suburban/rural areas whose tourism resources (e.g., green space and natural landscape) have few differences from those of the competition in neighboring countries.
6. Concluding Remarks
Asia has experienced an international tourism boom since the late 2000s, but even among neighboring areas in the same region, some grow rapidly while others lose visitors. In Korea, this applies to Seoul Special City, Incheon Metropolitan City, and Gyeonggi Province, all of which are located in the Korean Capital Region. In an attempt to investigate what leads to the difference, this study developed a model that specifies the relationships among attribute satisfaction variables (satisfaction with various physical tourism resources and tourism services), overall satisfaction, and country image and loyalty (intention to revisit and to recommend). The conceptual model was tested using the Capital Region sample of the 2015 Foreign Tourist Survey data and PLS-SEM. This SEM approach was employed because attribute satisfaction variables were formatively combined and because compared to CB-SEM, it has less limitations on the number of indicators, normality assumption, and minimum sample size. This study was distinct from previous studies in that it compared the magnitudes of relationships across areas.
In all three SEM models, travel costs were found to be an insignificant factor in determining satisfaction. Also, although significant, the lowest weights were given consistently to lodging and communication. Thus, despite the low satisfaction levels of travel costs and communication, policymakers are advised to consider more urgent issues first.
Several variables had very different weights in the three areas. Shopping satisfaction was the most important variable among foreign tourists to Seoul, known for being an international shopping center, but the variable was not significant for visitors to Incheon and Gyeonggi. In Incheon, food satisfaction had the highest weight, which is partially due to the efforts of the government to promote culinary tourism, as well as from the originality, variety, quality and uniqueness of the local cuisines. In Gyeonggi, the most important variable was entry service, which represents tourists’ complaints about the difficulty in traveling around this province.
This study found that overall satisfaction positively affected image and loyalty in all models, lending support to the findings of previous studies. The direct effect of satisfaction on loyalty was consistently weaker than that on image. This difference was the largest in Incheon and the smallest in Gyeonggi. This study then examined the total effect, which adds the indirect effect (through the satisfaction–image–loyalty path) to the direct effect, and found that the total effect on loyalty was larger particularly in Gyeonggi. In Incheon, where the effect of satisfaction on image was strong, the indirect satisfaction–image–loyalty path produced a stronger effect than that through the direct satisfaction–loyalty path. Overall, satisfaction promotion programs would work better in areas with less developed tourism resources, such as Gyeonggi. National-level image improvement projects would facilitate tourism the most in second major cities like Incheon.
A major implication of this study is that the tourism industry in the neighboring areas of a region needs to be administered by closely looking at their distinct resources (i.e., there would be no one-size-fits-all policies), which, on a larger regional scale, may be better exploited through nation-wide programs. Meanwhile, this study relied on nonparametric PLS-SEM to check the statistical significance of research variables, but inasmuch as all nonparametric techniques have limitations on the transferability of their results or the statistical inference, future studies are recommended to employ parametric statistics to secure higher external validity. Also, as discussed in the literature review section, traveler-generated contents such as blog posts and online reviews are likely to allow a fuller understanding of the satisfaction–image–loyalty interactions.
Acknowledgments
The author is grateful for the technical support of the Seoul National University Integrated Planning Lab, especially by his Ph.D. advisee, Bayarsaikhan Tsolmon.
Conflicts of Interest
The author declares no conflict of interest.
References
- Aall, C. Sustainable tourism in practice: Promoting or perverting the quest for a sustainable development? Sustainability 2014, 6, 2562–2583. [Google Scholar] [CrossRef]
- Gim, T.-H.T. An analysis of the relative and strategic importance of the tourist satisfaction indicators and their effects on the overall satisfaction, loyalty, and image: Focusing on foreign tourists to Seoul. Seoul Stud. 2017, 18, 125–144. [Google Scholar]
- Jeon, J.; Kim, B. Ten Million Youker Ear, What You Have Seen; Mirae Ui Chang: Seoul, Korea, 2015. [Google Scholar]
- Kim, D.K.; Choi, Y.J.; Yoon, J.E. A study on the influence of destination image through tourism motivation on tourist satisfaction: With focus on Japanese tourists to Busan. J. Tour. Sci. 2004, 28, 95–111. [Google Scholar]
- Han, S.-Y.; Park, S.-J.; Lee, H.-J. The study on the structural relations among the visitor satisfaction, its antecedents and the modification of images of Korea perceived by Chinese and Russian tourists after their visits to Korea. J. Digit. Converg. 2014, 12, 115–125. [Google Scholar] [CrossRef]
- Therborn, G. Cities and power. Int. J. Urban Sci. 2015, 19, 1–6. [Google Scholar] [CrossRef]
- Fujita, K. The landscape of Tokyo power. Int. J. Urban Sci. 2015, 19, 82–92. [Google Scholar] [CrossRef]
- Gim, T.-H.T. Influences on trip frequency according to travel purposes: A structural equation modeling approach in Seoul, South Korea. Environ. Plan. B 2011, 38, 429–446. [Google Scholar] [CrossRef]
- Crompton, J.L. An assessment of the image of Mexico as a vacation destination and the influence of geographical location upon that image. J. Travel Res. 1979, 17, 18–23. [Google Scholar] [CrossRef]
- Chi, C.G.-Q.; Qu, H. Examining the structural relationships of destination image, tourist satisfaction and destination loyalty: An integrated approach. Tour. Manag. 2008, 29, 624–636. [Google Scholar] [CrossRef]
- Khavarian-Garmsir, A.R.; Pourahmad, A.; Hataminejad, H.; Farhoudi, R. A comparative assessment of economic and physical inequality between shrinking and growing cities: A case study of Khuzestan Province, Iran. Int. J. Urban Sci. 2018, 22, 104–122. [Google Scholar] [CrossRef]
- Ross, C.; Woo, M.; Wang, F. Megaregions and regional sustainability. Int. J. Urban Sci. 2016, 20, 299–317. [Google Scholar] [CrossRef]
- Soltani, A.; Hoseini, S.H. An analysis of the connection between built environment, physical activity and health: Comparing three urban neighbourhoods from Shiraz, Iran. Int. J. Urban Sci. 2014, 18, 19–30. [Google Scholar] [CrossRef]
- Goo, Y.M.; Yew, X.T.; See, S.F. An investigation of tourists’ destination image, satisfaction and destination loyalty: Batu Ferringghi Beach, Penang. In Proceedings of the 2nd Tourism and Hospitality International Conference (THIC 2014), Langkawi, Malaysia, 5–6 November 2014. [Google Scholar]
- Bui, H.T.; Le, T.-A. Tourist satisfaction and destination image of Vietnam’s Ha Long Bay. Asia Pac. J. Tour. Res. 2016, 21, 795–810. [Google Scholar] [CrossRef]
- Jin, N.; Lee, S.; Lee, H. The effect of experience quality on perceived value, satisfaction, image and behavioral intention of water park patrons: New versus repeat visitors. Int. J. Tour. Res. 2015, 17, 82–95. [Google Scholar] [CrossRef]
- Kozak, M.; Rimmington, M. Tourist satisfaction with Mallorca, Spain, as an off-season holiday destination. J. Travel Res. 2000, 38, 260–269. [Google Scholar] [CrossRef]
- Pizam, A.; Neumann, Y.; Reichel, A. Dimentions of tourist satisfaction with a destination area. Ann. Tour. Res. 1978, 5, 314–322. [Google Scholar] [CrossRef]
- Kim, H.K.; Lee, T.J. Brand equity of a tourist destination. Sustainability 2018, 10, 431. [Google Scholar] [CrossRef]
- Zhang, H.; Fu, X.; Cai, L.A.; Lu, L. Destination image and tourist loyalty: A meta-analysis. Tour. Manag. 2014, 40, 213–223. [Google Scholar] [CrossRef]
- Fick, G.R.; Ritchie, J.R.B. Measuring service quality in the travel and tourism industry. J. Travel Res. 1991, 30, 2–9. [Google Scholar] [CrossRef]
- Jones, E.; Haven, C. Tourism SMEs, Service Quality, and Destination Competitiveness; CABI Publishing: Cambridge, UK, 2005. [Google Scholar]
- Pike, S. Destination image analysis—A review of 142 papers from 1973 to 2000. Tour. Manag. 2002, 23, 541–549. [Google Scholar] [CrossRef]
- Bhat, M.A. Tourism service quality: A dimension-specific assessment of SERVQUAL. Glob. Bus. Rev. 2012, 13, 327–337. [Google Scholar] [CrossRef]
- Hjalager, A.-M.; Nordin, S. User-driven innovation in tourism—A review of methodologies. J. Qual. Assur. Hosp. Tour. 2011, 12, 289–315. [Google Scholar] [CrossRef]
- Oppermann, M. Tourism destination loyalty. J. Travel Res. 2000, 39, 78–84. [Google Scholar] [CrossRef]
- Abdalla, M.M.; Ribas, J.R.; da Costa Vieira, P.R. The antecedents of word of mouth intentions about a Brazilian tourist destination. Tour. Manag. Stud. 2014, 10, 104–111. [Google Scholar]
- Assaker, G.; Vinzi, V.E.; O’Connor, P. Examining the effect of novelty seeking, satisfaction, and destination image on tourists’ return pattern: A two factor, non-linear latent growth model. Tour. Manag. 2011, 32, 890–901. [Google Scholar] [CrossRef]
- Dayour, F.; Adongo, C.A. Why they go there: International tourists’ motivations and revisit intention to Northern Ghana. Am. J. Tour. Manag. 2015, 4, 7–17. [Google Scholar]
- Lee, B.; Lee, C.-K.; Lee, J. Dynamic nature of destination image and influence of tourist overall satisfaction on image modification. J. Travel Res. 2014, 53, 239–251. [Google Scholar] [CrossRef]
- Puh, B. Destination image and tourism satisfaction: The case of a Mediterranean destination. Mediterr. J. Soc. Sci. 2015, 5, 538–544. [Google Scholar]
- Bigné, J.E.; Mattila, A.S.; Andreu, L. The impact of experiential consumption cognitions and emotions on behavioral intentions. J. Serv. Mark. 2008, 22, 303–315. [Google Scholar] [CrossRef]
- Prayag, G.; Hosany, S.; Muskat, B.; Chiappa, G.D. Understanding the relationships between tourists’ emotional experiences, perceived overall image, satisfaction, and intention to recommend. J. Travel Res. 2017, 56, 41–54. [Google Scholar] [CrossRef]
- Da Graça Batista, M.; Couto, J.P.; Botelho, D.; Faias, C. Tourist satisfaction and loyalty in the hotel business: An application to the Island of São Miguel, Azores. Tour. Manag. Stud. 2014, 10, 16–23. [Google Scholar]
- De Nisco, A.; Mainolfi, G.; Marino, V.; Napolitano, M.R. Tourism satisfaction effect on general country image, destination image, and post-visit intentions. J. Vacat. Mark. 2015, 21, 305–317. [Google Scholar] [CrossRef]
- Zhang, H.; Xu, F.; Leung, H.H.; Cai, L.A. The influence of destination-country image on prospective tourists’ visit intention: Testing three competing models. Asia Pac. J. Tour. Res. 2016, 21, 811–835. [Google Scholar] [CrossRef]
- Johnson, M.D.; Gustafsson, A.; Andreassen, T.W.; Lervik, L.; Cha, J. The evolution and future of national customer satisfaction index models. J. Econ. Psychol. 2001, 22, 217–245. [Google Scholar] [CrossRef]
- Beerli, A.; Martín, J.D. Factors influencing destination image. Ann. Tour. Res. 2004, 31, 657–681. [Google Scholar] [CrossRef]
- Chen, C.-C.; Lin, Y.-H.; Gao, J.; Kyle, G. Developing a market-specific destination image scale: A nomological validation approach. Tour. Anal. 2015, 20, 3–12. [Google Scholar] [CrossRef]
- Chen, C.-C.; Chung, J.Y.; Gao, J.; Lin, Y.-H. Destination familiarity and favorability in a country-image context: Examining Taiwanese travelers’ perceptions of China. J. Travel Tour. Mark. 2017, 34, 1211–1223. [Google Scholar] [CrossRef]
- Al-Majali, M.M. International tourists satisfaction: Case of Jordan. Int. Bus. Res. 2012, 5, 210–216. [Google Scholar] [CrossRef]
- Banki, M.B.; Ismail, H.N.; Dalil, M.; Kawu, A. Moderating role of affective destination image on the relationship between tourists satisfaction and behavioural intention: Evidence from Obudu Mountain Resort. J. Environ. Earth Sci. 2014, 4, 47–60. [Google Scholar]
- Gartner, W.C. Tourism image: Attribute measurement of state tourism products using multidimensional scaling techniques. J. Travel Res. 1989, 28, 16–20. [Google Scholar] [CrossRef]
- Baloglu, S.; Brinberg, D. Affective images of tourism destination. J. Travel Res. 1997, 35, 11–15. [Google Scholar] [CrossRef]
- Çoban, S. The effects of the image of destination on tourist satisfaction and loyalty: The case of Cappadocia. Eur. J. Soc. Sci. 2012, 29, 222–232. [Google Scholar]
- Chiu, W.; Zeng, S.; Cheng, P.S.-T. The influence of destination image and tourist satisfaction on tourist loyalty: A case study of Chinese tourists in Korea. Int. J. Cult. Tour. Hosp. Res. 2016, 10, 223–234. [Google Scholar] [CrossRef]
- Jamaludin, M.; Johari, S.; Aziz, A.; Kayat, K.; Yusof, A.R.M. Examining structural relationship between destination image, tourist satisfaction and destination loyalty. Int. J. Indep. Res. Stud. 2012, 1, 89–96. [Google Scholar]
- Mohamad, M.; Ghani, N.I.A.; Mamat, M.; Mamat, I. Satisfaction as a mediator to the relationship between destination image and loyalty. World Appl. Sci. J. 2014, 30, 1113–1123. [Google Scholar]
- Mohammed, A.R.J.; Zahari, M.S.M.; Talib, S.A.; Suhaimi, M.Z. The causal relationships between destination image, tourist satisfaction and revisit intention: A case of the United Arab Emirates. Int. J. Soc. Behav. Educ. Econ. Bus. Ind. Eng. 2014, 8, 3346–3352. [Google Scholar]
- Kim, S.-K.; Park, J.-A.; Kim, W. The mediating effect of destination image on the relationship between spectator satisfaction and behavioral intentions at an international sporting event. Asia Pac. J. Tour. Res. 2016, 21, 273–292. [Google Scholar] [CrossRef]
- Marine-Roig, E. Measuring destination image through travel reviews in search engines. Sustainability 2017, 9, 1425. [Google Scholar] [CrossRef]
- Marine-Roig, E.; Ferrer-Rosell, B. Measuring the gap between projected and perceived destination images of Catalonia using compositional analysis. Tour. Manag. 2018, 68, 236–249. [Google Scholar] [CrossRef]
- Li, X.; Duan, B. Organizational microblogging for event marketing: A new approach to creative placemaking. Int. J. Urban Sci. 2018, 22, 59–79. [Google Scholar] [CrossRef]
- Anda, C.; Erath, A.; Fourie, P.J. Transport modelling in the age of Big Data. Int. J. Urban Sci. 2017, 21, 19–42. [Google Scholar] [CrossRef]
- Media Research. 2015 Foreign Tourist Survey: User’s Guide; Media Research: Seoul, Korea, 2016. [Google Scholar]
- Dong-A Ilbo. Let’s open the era of 20 million foreign tourists (1): Examining travel conditions in Korea. Dong-A Ilbo. Available online: http://news.donga.com/Economy/more28/3/all/20140921/66606413/122 (accessed on 1 November 2014).
- Korea Travel News. The era of 20 million foreign tourists, claiming about communication difficulties. Korea Travel News. Available online: http://www.ktnbm.co.kr/news/articleView.html?idxno=4056 (accessed on 21 July 2012).
- Korea Times. Language barrier top among foreign tourists’ complaints. Korea Times. Available online: http://www.koreatimes.co.kr/www/news/nation/2015/04/116_176948.html (accessed on 12 April 2015).
- Yonhap News. Korea as a tourist paradise? Internationals feel “communication the most inconvenient”. Yonhap News. Available online: http://www.yonhapnews.co.kr/bulletin/2015/04/10/0200000000AKR20150410124200030.HTML (accessed on 12 April 2015).
- Hair, J.F.; Hult, G.T.M.; Ringle, C.M.; Sarstedt, M. A Primer on Partial Least Squares Structural Equation Modeling (PLS-SEM); Sage: Thousand Oaks, CA, USA, 2016. [Google Scholar]
- McIntosh, C.N.; Edwards, J.R.; Antonakis, J. Reflections on partial least squares path modeling. Organ. Res. Methods 2014, 17, 210–251. [Google Scholar] [CrossRef] [Green Version]
- Fornell, C. A national customer satisfaction barometer: The Swedish experience. J. Mark. 1992, 56, 6–21. [Google Scholar] [CrossRef]
- Hallak, R.; Assaker, G. Using partial least squares structural equation modeling (PLS-SEM) to examine complex models in tourism research. In Management Science in Hospitality and Tourism: Theory, Practice and Applications; Uysal, M., Schwartz, Z., Sirakaya-Turk, E., Eds.; Apple Academic Press: Oakville, ON, Canada, 2017; pp. 99–124. [Google Scholar]
- Faizan, A.; Mostafa, R.S.; Marko, S.; Ringle, C.M.; Kisang, R. An assessment of the use of partial least squares structural equation modeling (PLS-SEM) in hospitality research. Int. J. Contemp. Hosp. Manag. 2018, 30, 514–538. [Google Scholar]
- Guzman-Parra, V.F.; Vila-Oblitas, J.R.; Maqueda-Lafuente, F.J. Exploring the effects of cognitive destination image attributes on tourist satisfaction and destination loyalty: A case study of Málaga, Spain. Tour. Manag. Stud. 2016, 12, 67–73. [Google Scholar] [CrossRef]
- Folgado-Fernández, J.A.; Duarte, P.A.O.; Hernández-Mogollón, J.M. Assessing the differentiated contribution of city resources to city brand image. Tour. Manag. Stud. 2015, 11, 77–83. [Google Scholar]
- Gefen, D.; Rigdon, E.E.; Straub, D. Editor’s comments: An update and extension to SEM guidelines for administrative and social science research. MIS Q. 2011, 35, A1–A7. [Google Scholar] [CrossRef]
- Henseler, J.; Dijkstra, T.K.; Sarstedt, M.; Ringle, C.M.; Diamantopoulos, A.; Straub, D.W.; Ketchen, D.J.; Hair, J.F.; Hult, G.T.M.; Calantone, R.J. Common beliefs and reality about PLS: Comments on Rönkkö and Evermann (2013). Organ. Res. Methods 2014, 17, 182–209. [Google Scholar] [CrossRef]
- Reinartz, W.J.; Haenlein, M.; Henseler, J. An empirical comparison of the efficacy of covariance-based and variance-based SEM. Int. J. Res. Mark. 2009, 26, 332–344. [Google Scholar] [CrossRef]
- Barclay, D.; Higgins, C.; Thompson, R. The partial least squares (PLS) approach to causal modeling: Personal computer adoption and use as an illustration. Technol. Stud. 1995, 2, 285–309. [Google Scholar]
- Tenenhaus, M.; Pagès, J.; Ambroisine, L.; Guinot, C. PLS methodology to study relationships between hedonic judgements and product characteristics. Food Qual. Prefer. 2005, 16, 315–325. [Google Scholar] [CrossRef]
- Davis, D.E. Reflections on the relations between development and urbanization: Past trajectories and future challenges. Int. J. Urban Sci. 2016, 20, 1–14. [Google Scholar] [CrossRef]
- Hankook Ilbo. Only forced shopping for Youker, stuck on “cheap tours”. Hankook Ilbo. Available online: http://www.hankookilbo.com/v/80d702b9b43242e1b692687ab76c2bf3 (accessed on 5 October 2015).
- Yonhap News. Participating in a Chinese package tour to Korea… “self-control training” added to “cheap tours”. Yonhap News, 12 June 2016. [Google Scholar]
- Jayantha, W.M.; Chun Ming, C. The effect of urban redevelopment on retail shopping property values: A case study in Hong Kong. Int. J. Urban Sci. 2015, 19, 379–399. [Google Scholar] [CrossRef]
- Byrne, B.M. Structural Equation Modeling with Amos: Basic Concepts, Applications, and Programming; Routledge: New York, NY, USA, 2010. [Google Scholar]
- Chin, W.W. The partial least squares approach to structural equation modeling. In Modern Methods for Business Research; Marcoulides, G.A., Ed.; Erlbaum: Mahwah, NJ, USA, 1998; pp. 295–358. [Google Scholar]
- Parsian, N.; Dunning, T. Developing and validating a questionnaire to measure spirituality: A psychometric process. Glob. J. Health Sci. 2009, 1, 2–11. [Google Scholar] [CrossRef]
- Bigné, J.E.; Sánchez, M.I.; Sánchez, J. Tourism image, evaluation variables and after purchase behaviour: Inter-relationship. Tour. Manag. 2001, 22, 607–616. [Google Scholar] [CrossRef]
- Castro, C.B.; Armario, E.M.; Ruiz, D.M. The influence of market heterogeneity on the relationship between a destination’s image and tourists’ future behaviour. Tour. Manag. 2007, 28, 175–187. [Google Scholar] [CrossRef]
- Faullant, R.; Matzler, K.; Füller, J. The impact of satisfaction and image on loyalty: The case of Alpine ski resorts. Manag. Serv. Qual. 2008, 18, 163–178. [Google Scholar] [CrossRef]
- Truong, T.-H.; King, B. An evaluation of satisfaction levels among Chinese tourists in Vietnam. Int. J. Tour. Res. 2009, 11, 521–535. [Google Scholar] [CrossRef] [Green Version]
Figure 1.
Study area: Seoul, Incheon, and Gyeonggi.

Figure 2.
Partial least squares structural equation modeling. Note: A software program called SmartPLS automatically composed these charts. The outer weights/loadings and structural path coefficients are shown with arrows and R² in round factors (detailed results are shown in Table 4).
Figure 2.
Partial least squares structural equation modeling. Note: A software program called SmartPLS automatically composed these charts. The outer weights/loadings and structural path coefficients are shown with arrows and R² in round factors (detailed results are shown in Table 4).


Table 1.
Descriptive statistics: final sample.
| Discrete Var. | f | % | Discrete Var. | f | % |
|---|---|---|---|---|---|
| Gender | Age | ||||
| Male | 1228 | 32.69 | 15–20 | 246 | 6.55 |
| Female | 2528 | 67.31 | 21–30 | 1551 | 41.29 |
| Region | 31–40 | 996 | 26.52 | ||
| Japan | 666 | 17.73 | 41–50 | 506 | 13.47 |
| China | 989 | 26.33 | 51–60 | 303 | 8.07 |
| Hong Kong | 380 | 10.12 | ≥61 | 135 | 3.59 |
| Singapore | 120 | 3.19 | Missing | 19 | 0.51 |
| Taiwan | 345 | 9.19 | Job | ||
| Thailand | 236 | 6.28 | Public/military | 217 | 5.78 |
| Malaysia | 134 | 3.57 | Entrepreneur/ administrative | 325 | 8.65 |
| Australia | 75 | 2.00 | |||
| U.S.A. | 115 | 3.06 | Office worker/ engineer | 766 | 20.39 |
| Canada | 88 | 2.34 | |||
| U.K. | 43 | 1.14 | Sales/service | 494 | 13.15 |
| Germany | 23 | 0.61 | Professional | 316 | 8.41 |
| France | 28 | 0.75 | Manufacturing/ technician/ physical worker | 83 | 2.21 |
| Russia | 195 | 5.19 | |||
| Middle East | 56 | 1.49 | |||
| India | 12 | 0.32 | Self-employed | 413 | 11.00 |
| Others | 251 | 6.68 | Student | 512 | 13.63 |
| Education | Homemaking | 234 | 6.23 | ||
| <Bachelor’s | 577 | 15.36 | Retiree | 70 | 1.86 |
| Bachelor’s | 2544 | 67.73 | No job | 82 | 2.18 |
| >Bachelor’s | 462 | 12.30 | Others | 232 | 6.18 |
| Others | 137 | 3.65 | Missing | 12 | 0.32 |
| Missing | 36 | 0.96 | Tour type | ||
| Personal | 2,707 | 72.07 | |||
| Package | 602 | 16.03 | |||
| Airtel * | 447 | 11.90 | |||
| Continuous var. | n | Means | S.D. | Min. | Max. |
| Companions (including the self) | 3756 | 3.500 | 15.670 | 1 | 147 |
| Total spending/ person ($) | 3756 | 3122.800 | 55,765.610 | 0 | 3,079,507 |
| Daily average spending/person ($) | 3678 | 330.034 | 347.488 | 0 | 4657 |
* A compound of air and hotel, it refers to a flight and hotel package.
Table 2.
Descriptive statistics: indicator variables for structural equation modeling.
| Types * | Variables | Descriptions | n ** | Means | S.D. | Min. | Max. |
|---|---|---|---|---|---|---|---|
| Attribute satisfaction | s_entry | Entry service | 3756 | 4.233 | 0.756 | 1 | 5 |
| s_transit | Public transportation | 3750 | 4.299 | 0.735 | 1 | 5 | |
| s_lodg | Lodging | 3756 | 4.332 | 0.674 | 1 | 5 | |
| s_food | Food | 3756 | 4.292 | 0.716 | 1 | 5 | |
| s_shop | Shopping | 3714 | 4.387 | 0.647 | 1 | 5 | |
| s_siteatt | Tour site | 3747 | 4.245 | 0.699 | 1 | 5 | |
| s_siteinfo | Tour information service | 3689 | 4.189 | 0.737 | 1 | 5 | |
| s_comm | Communication | 3754 | 3.786 | 0.874 | 1 | 5 | |
| s_costs | Travel costs | 3752 | 3.950 | 0.798 | 1 | 5 | |
| s_secur | Security | 3756 | 4.368 | 0.686 | 1 | 5 | |
| Overall satisfaction | s_overall | Overall satisfaction | 3756 | 4.384 | 0.616 | 1 | 5 |
| Country image | image_af | Post-visit image | 3756 | 4.346 | 0.645 | 1 | 5 |
| image_ch | Image change *** | 3756 | 0.310 | 0.702 | –4 | 4 | |
| Loyalty | int_revisit | Intention to revisit within three years | 3756 | 4.251 | 0.735 | 1 | 5 |
| int_recomm | Intention to recommend the travel | 3756 | 4.304 | 0.643 | 1 | 5 |
* Response options were “(1) Very dissatisfied” to “(5) Very satisfied” for satisfaction items, “(1) Very bad” to “(5) Very good” for image items, and “(1) Highly disagree” to “(5) Highly agree” for loyalty items; ** Missing values for s_transit, s_shop, s_siteatt, s_siteinfo, s_comm, s_costs, and s_secur are not because of nonresponses (of which there are none), but because some respondents selected the response option “Not applicable”; *** To measure the “improvement of the image of Korea after travel”, the survey actually asked about image (1) before and (2) after travel, and this study calculated the difference (=(2) − (1)).
Table 3.
Variable distributions: skewness and normality.
| Seoul | Incheon | Gyeonggi | |||||||||||||
|---|---|---|---|---|---|---|---|---|---|---|---|---|---|---|---|
| Variables | Skewness | K-S | p | S-W | p | Skewness | K-S | p | S-W | p | Skewness | K-S | p | S-W | p |
| s_overall | −0.8891 | 0.2910 | 0.0000 | 0.7239 | 0.0000 | −0.5157 | 0.3476 | 0.0000 | 0.6965 | 0.0000 | −0.3483 | 0.2971 | 0.0000 | 0.7607 | 0.0000 |
| s_entry | −0.9728 | 0.2453 | 0.0000 | 0.7880 | 0.0000 | −0.8036 | 0.3344 | 0.0000 | 0.7372 | 0.0000 | −0.8654 | 0.2161 | 0.0023 | 0.8267 | 0.0004 |
| s_transit | −0.9212 | 0.2723 | 0.0000 | 0.7784 | 0.0000 | −0.9617 | 0.3634 | 0.0000 | 0.7083 | 0.0000 | −0.9904 | 0.2511 | 0.0001 | 0.8345 | 0.0006 |
| s_lodg | −0.7731 | 0.2746 | 0.0000 | 0.7675 | 0.0000 | −1.1663 | 0.3897 | 0.0000 | 0.6785 | 0.0000 | −0.2900 | 0.2585 | 0.0001 | 0.7895 | 0.0001 |
| s_food | −0.7853 | 0.2664 | 0.0000 | 0.7816 | 0.0000 | −1.2940 | 0.3646 | 0.0000 | 0.7087 | 0.0000 | −0.0357 | 0.3257 | 0.0000 | 0.7723 | 0.0000 |
| s_shop | −0.8476 | 0.2991 | 0.0000 | 0.7450 | 0.0000 | −0.8036 | 0.3344 | 0.0000 | 0.7372 | 0.0000 | −0.1163 | 0.2441 | 0.0002 | 0.8110 | 0.0002 |
| s_siteatt | −0.5157 | 0.2500 | 0.0000 | 0.7942 | 0.0000 | −0.7076 | 0.3186 | 0.0000 | 0.7533 | 0.0000 | −0.2225 | 0.3024 | 0.0000 | 0.7796 | 0.0001 |
| s_siteinfo | −0.6007 | 0.2376 | 0.0000 | 0.8083 | 0.0000 | −1.1733 | 0.3080 | 0.0000 | 0.7493 | 0.0000 | −0.4327 | 0.2407 | 0.0003 | 0.8528 | 0.0013 |
| s_comm | −0.3701 | 0.2413 | 0.0000 | 0.8700 | 0.0000 | −0.5041 | 0.2395 | 0.0000 | 0.8337 | 0.0000 | 0.6308 | 0.2997 | 0.0000 | 0.7690 | 0.0000 |
| s_costs | −0.4084 | 0.2546 | 0.0000 | 0.8471 | 0.0000 | −0.4555 | 0.2768 | 0.0000 | 0.7825 | 0.0000 | 0.5285 | 0.3004 | 0.0000 | 0.7650 | 0.0000 |
| s_secur | −0.7728 | 0.2993 | 0.0000 | 0.7650 | 0.0000 | −1.3613 | 0.4357 | 0.0000 | 0.6110 | 0.0000 | −0.1338 | 0.2155 | 0.0024 | 0.8084 | 0.0002 |
| int_revisit | −0.8968 | 0.2459 | 0.0000 | 0.7840 | 0.0000 | −0.8818 | 0.2481 | 0.0000 | 0.8083 | 0.0000 | −0.5299 | 0.2812 | 0.0000 | 0.7737 | 0.0000 |
| int_recomm | −0.6710 | 0.2897 | 0.0000 | 0.7588 | 0.0000 | −0.5031 | 0.2775 | 0.0000 | 0.7797 | 0.0000 | 0.1348 | 0.3745 | 0.0000 | 0.7079 | 0.0000 |
| image_af | −0.8331 | 0.2757 | 0.0000 | 0.7490 | 0.0000 | −0.5191 | 0.2978 | 0.0000 | 0.7510 | 0.0000 | −0.2225 | 0.3024 | 0.0000 | 0.7796 | 0.0001 |
| image_ch | 0.0870 | 0.3512 | 0.0000 | 0.7598 | 0.0000 | 0.5486 | 0.3409 | 0.0000 | 0.7731 | 0.0000 | 1.7026 | 0.4485 | 0.0000 | 0.5879 | 0.0000 |
Note: K-S = Kolmogorov–Smirnov statistics; S-W = Shapiro–Wilk statistics.
Table 4.
Partial least squares structural equation modeling (PLS-SEM) results: outer weights/loadings and structural path coefficients.
Table 4.
Partial least squares structural equation modeling (PLS-SEM) results: outer weights/loadings and structural path coefficients.
| Seoul | Incheon | Gyeonggi | |||||
|---|---|---|---|---|---|---|---|
| Types | Paths* | Coef. | p | Coef. | p | Coef. | p |
| Outer weights | s_comm --> SATIS_D | 0.0637 | 0.0748 | −0.2053 | 0.0001 | 0.1227 | 0.0298 |
| s_costs --> SATIS_D | 0.0334 | 0.4019 | 0.2670 | 0.1576 | 0.0388 | 0.6770 | |
| s_entry --> SATIS_D | 0.1845 | 0.0000 | 0.4427 | 0.0000 | 1.0476 | 0.0000 | |
| s_food --> SATIS_D | 0.2556 | 0.0000 | 0.7482 | 0.0000 | 0.2936 | 0.2138 | |
| s_lodg --> SATIS_D | 0.1041 | 0.0059 | 0.0388 | 0.0723 | −0.4155 | 0.0248 | |
| s_secur --> SATIS_D | −0.0103 | 0.6875 | 0.0567 | 0.5450 | 0.5208 | 0.0003 | |
| s_shop --> SATIS_D | 0.3408 | 0.0000 | −0.2194 | 0.9918 | 0.2398 | 0.6398 | |
| s_siteatt --> SATIS_D | 0.2744 | 0.0000 | 0.2269 | 0.0001 | 0.0658 | 0.9978 | |
| s_siteinfo --> SATIS_D | 0.0367 | 0.3038 | −0.0144 | 0.1141 | −0.6160 | 0.0007 | |
| s_transit --> SATIS_D | 0.0774 | 0.1241 | −0.0888 | 0.5138 | −0.6093 | 0.0000 | |
| Outer loadings | image_af <-- IMAGE | 0.9542 | 0.0000 | 0.9949 | 0.0000 | 0.9999 | 0.0000 |
| image_ch <-- IMAGE | 0.7185 | 0.0000 | 0.4712 | 0.1397 | −0.0864 | 0.8857 | |
| int_recomm <-- INTENT | 0.9315 | 0.0000 | 0.9097 | 0.0000 | 0.9097 | 0.0000 | |
| int_revisit <-- INTENT | 0.8762 | 0.0000 | 0.7726 | 0.0000 | 0.8585 | 0.0000 | |
| Structural path coef. | SATIS_D --> SATIS_O | 0.5647 | 0.0000 | 0.7385 | 0.0000 | 0.7515 | 0.0000 |
| SATIS_O --> IMAGE | 0.5242 | 0.0000 | 0.4084 | 0.0000 | 0.5103 | 0.0000 | |
| SATIS_O --> INTENT | 0.2832 | 0.0000 | 0.1248 | 0.0025 | 0.4724 | 0.0000 | |
| IMAGE --> INTENT | 0.3931 | 0.0000 | 0.5285 | 0.0000 | 0.2693 | 0.0002 | |
Table 5.
Standardized effects: direct, indirect, and total.
| Seoul | Incheon | Gyeonggi | |||||||
|---|---|---|---|---|---|---|---|---|---|
| Direct | Indirect | Total | Direct | Indirect | Total | Direct | Indirect | Total | |
| SATIS_D --> SATIS_O | 0.5647 | - | 0.5647 | 0.7385 | - | 0.7385 | 0.7515 | - | 0.7515 |
| SATIS_O --> IMAGE | 0.5242 | - | 0.5242 | 0.4084 | - | 0.4084 | 0.5103 | - | 0.5103 |
| SATIS_O --> INTENT | 0.2832 | 0.2061 | 0.4893 | 0.1248 | 0.2158 | 0.3406 | 0.4724 | 0.1374 | 0.6098 |
| IMAGE --> INTENT | 0.3931 | - | 0.3931 | 0.5285 | - | 0.5285 | 0.2693 | - | 0.2693 |
-: not specified in the SEM models.
© 2018 by the author. Licensee MDPI, Basel, Switzerland. This article is an open access article distributed under the terms and conditions of the Creative Commons Attribution (CC BY) license (http://creativecommons.org/licenses/by/4.0/).
Share and Cite
MDPI and ACS Style
Gim, T.-H.T. Tourist Satisfaction, Image, and Loyalty from an Interregional Perspective: An Analysis of Neighboring Areas with Distinct Characteristics. Sustainability 2018, 10, 1283. https://doi.org/10.3390/su10041283
AMA Style
Gim T-HT. Tourist Satisfaction, Image, and Loyalty from an Interregional Perspective: An Analysis of Neighboring Areas with Distinct Characteristics. Sustainability. 2018; 10(4):1283. https://doi.org/10.3390/su10041283
Chicago/Turabian StyleGim, Tae-Hyoung Tommy. 2018. "Tourist Satisfaction, Image, and Loyalty from an Interregional Perspective: An Analysis of Neighboring Areas with Distinct Characteristics" Sustainability 10, no. 4: 1283. https://doi.org/10.3390/su10041283
Note that from the first issue of 2016, this journal uses article numbers instead of page numbers. See further details here.