Measurements and Factors That Influence the Carbon Capability of Urban Residents in China


School of Management, China University of Mining and Technology, Da Xue Road 1, Xuzhou 221116, China
*
Authors to whom correspondence should be addressed.
Sustainability 2018, 10(4), 1292; https://doi.org/10.3390/su10041292
Submission received: 23 March 2018
/
Revised: 16 April 2018
/
Accepted: 19 April 2018
/
Published: 23 April 2018
Abstract
:Due to the rapid growth in residential energy consumption, there is an urgent need to reduce carbon emissions from the consumer side, which requires improvements in the carbon capability of urban residents. In this study, previous investigations of carbon capability were analyzed and classified into four dimensions: carbon knowledge capability, carbon motivation capability, carbon behavior capability, and carbon management capability. According to grounded theory, a quantitative research model was constructed of the carbon capability of urban residents in Jiangsu, which was used to conduct a questionnaire survey. SPSS 19.0 and LatentGOLD were employed to process the questionnaire data and the carbon capability of the residents was evaluated. The results showed that the residents of Jiangsu Province could be divided into six groups based on their different carbon capabilities, where these six major groups accounted for 28.19%, 21.21%, 18.33%, 15.84%, 9.88%, and 6.55% of the total sample. Gender, age, occupation, and educational level had significant effects on the carbon capabilities of residents, whereas the annual household income and household population had no significant effects. According to the characteristics of each cluster based on the four carbon capability dimensions, the six clusters were designated as “balanced steady cluster”, “self-restraint cluster”, “fully backward cluster”, “comprehensive leading cluster”, “slightly cognitive cluster”, and “restrain others cluster”. Quantitative analysis showed that 61.93% of the residents of Jiangsu reached the qualified rate for the carbon capability but the excellent rate was only 15.84%. Relevant policy implications are suggested based on these conclusions.
1. Introduction
Environmental issues are very important in the 21st century and they need to be addressed globally. The growing greenhouse effect has negatively affected natural and socio-economic systems significantly [1]. The total global emissions from fossil fuels and industrial CO2 were estimated as 36.2 billion tonnes in 2016 and 41 billion tonnes in 2017. The total global CO2 emissions are exhibiting a high increasing trend [2]. Thus, the global peak in carbon emissions should be reached in the next few years, before rapidly reducing emissions to tackle climate change and limit its impacts.
Due to economic and social development, the energy consumed by residents (directly or indirectly) has started to increase at a faster rate than industrial energy consumption, where it accounts for 72% of the total global CO2 emissions [3]. Increases in the rate of urbanization mean that the growth of CO2 emissions caused by urban energy consumption have started to offset the reductions in emissions caused by technological progress and industrial upgrading. Industrial production has been unable to reduce emissions effectively [4]. In recent years, energy management in developed countries such as Europe and the USA has shifted from traditional production-side management to consumer-side management. Exploring the potential for reducing carbon emissions among consumers has become an important issue in the low-carbon economy [5].
China is the world’s largest emitter of CO2 and its carbon emissions account for 28% of the global total [6]. Thus, there is an urgent need to explore the possibility of reducing carbon emissions in China, especially on the consumer side. Low-carbon development is inseparable from public participation. Many studies have focused on the relationship between individual behavior and CO2 emissions in various countries, such as in Germany, France, the UK, Switzerland, Norway, and the USA [7,8]. Relevant government departments in China are also advocating reductions in carbon emissions by residents and they have publicized this aim widely. However, the propaganda and guidance in terms of low-carbon behavior is mostly in terms of “sloganization”, and they have not transformed the low-carbon concept into conscious actions and active choices by residents, and they have even failed to achieve the normalization of low-carbon behavior.
The carbon capability of urban residents is essentially their low-carbon consumption capability. Seyfang et al. first proposed the concept of “carbon capability” as “the capability to make informed judgments on low-carbon and adopt effective low-carbon behaviors through individual behavior and collective behavior” [9,10]. Government and society no longer have the sole responsibility for reducing carbon emissions, and the low-carbon responsibilities of residents have become increasingly prominent. Residents are beneficiaries of low-carbon rights, low-carbon responsibilities, and low-carbon management.
The concept of “carbon capability” was proposed previously and studies have explored the measurement of its dimension as well as examining its relationships with individual knowledge, decision making, behavior, and collective behavior [11]. However, the low-carbon capability is not exactly the same as the carbon capability. In the classic theory of capability research, the iceberg theory states that capabilities are not limited to the parts of the iceberg above sea level, such as knowledge and skills, because values and motives are hidden beneath the sea level and they are crucial for distinguishing differences in individual capabilities [12]. Analogous to the carbon capability of urban residents, knowledge, skills, behavior, and other readily observed elements are explicit features of the carbon capability. Values, motivations, and other elements related to low-carbon emissions in individuals can help to truly understand, evaluate, and enhance their capability of low carbon usage.
This paper aims to conduct in-depth research on the status, dimensions, and influencing factors of urban residents’ carbon capabilities, and to clarify the level and structural characteristics of urban residents’ carbon capabilities and the interaction mechanisms among influencing factors. Based on the theoretical model of carbon capability, a questionnaire survey was conducted to obtain basic data on the carbon capability of urban residents and influencing factors. Based on the results of data analysis, the theoretical model was revised and the carbon capability level of urban residents is classified and evaluated, and the factors that hinder residents from improving their carbon capabilities were explored. Finally, related policy recommendations were put forward to promote the construction of carbon capacity in urban residents in China and the development of residents’ low-carbon lifestyle.
Therefore, the innovative aspects of the present study are as follows. (1) We divided the carbon capability into four dimensions based on the Seyfang et al. classification: carbon knowledge capability, carbon motivation capability, carbon behavior capability, and carbon management capability. The dimension division of carbon capability is expanded, which avoids the disadvantages of previous studies that the carbon capability dimension is too macroscopic and difficult to measure; (2) In research methods, a theoretical model was constructed of the carbon capability of urban residents based on grounded theory and previous studies. We introduce the multinomial logit model (MNL) and latent class model (LCM), which we used to construct an innovative quantitative research model of carbon capability. This quantitative model considers the heterogeneity of carbon capability when studying the factors that influence it, which is more realistic.
In terms of theoretical contribution, the existing research focuses on low-carbon consumption behaviors of urban residents, such as green travel behaviors and green consumption behaviors. There are few studies on internal carbon emission reduction capabilities of residents, and often overlook the low-carbon values and motivations that are rooted in the residents’ hearts. We combined carbon emission reduction motivation, knowledge, and other factors of residents to study from the perspective of carbon capability, and divided the carbon capability into four dimensions based on the Seyfang et al. [9] classification. The quantitative model of carbon capability was constructed, which provided a new method of measuring carbon capability levels of urban residents. Studying the mechanisms related to the carbon capability of urban residents is of great theoretical significance because it can enrich the carbon capability theory associated with urban residents and guide residents to actively reduce their carbon emissions. This is an important research area in the field of low-carbon consumption behavior by residents.
In terms of practical contribution, this study will help to further understand the status of carbon capability levels of residents and the constraints on their capability, thereby accelerating the development of the carbon capability of urban residents in China and their low-carbon lifestyle. It has important reference value and wide application prospects for the optimization of consumer-side carbon emission reduction policies.
The remainder of this paper is organized as follows. In Section 2, we review previous studies by summarizing research into ‘capability’ and ‘carbon capability’. In Section 3, we introduce the model, quantitative methods, and data acquisition process. We present the empirical analysis of the low-carbon capability measurements of urban residents and the factors that influence them in Section 4. The results are discussed in Section 5. In Section 6, we give our conclusions and their implications for policy.
2. Literature Review
2.1. Capability
In the field of psychology, capability has two main meanings [13]. (1) Capability as a personality trait of individuals, where it mainly refers to the psychological characteristics that directly affect the efficiency of activities and allow them to be successfully completed; (2) capability as the direct and effective psychological characteristics related to the successful completion of an activity, rather than all psychological conditions. In the field of philosophy, Marx stated that capability is the essential force of a human being [14], where its manifestation and development must depend on specific objective objects, which can be in both the spiritual world and the natural world. In the field of organizational behavior, capability refers to the possibility that an individual can successfully accomplish various tasks [15], where it focuses more on the individual’s physiological capability when completing a task, which is measured mainly by intelligence tests. However, in the late 1960s, a large number of studies demonstrated that intelligence and job performance were not significantly correlated [16]. Some underlying deep-seated features—such as attitudes, values, and motivations—have been addressed in research into capability in industrial psychology and management [17,18].
At present, the standards measures of capability are not uniform, where they mainly focus on knowledge and skills, behavioral results, and comprehensive measurement. Capability is regarded as a cognitive ability, including various specific cognitive skills [19]. Behavioral outcome measures consider individual explicit behavior results, such as whether a behavior can effectively obtain the expected results, as a criterion for assessing if an individual has the corresponding capability [20]. Comprehensive measurements show that capability integrates individual traits that achieve specific performance in a certain practical environment, where this integration is indivisible [21].
2.2. Carbon Capability
In order explore the motivation and capability of individuals in terms of reducing their carbon emissions, Seyfang et al. [9] first proposed the concept of “carbon capability” in 2007. The carbon capability is a special capability and the capability of urban residents to reduce their carbon emission should essentially be the same, i.e., the personal psychological characteristics and behavior of urban residents that affect carbon emissions in their daily lives. Therefore, to define the concept and structure of carbon capability, we need to consider the nature and characteristics of capability as well as the overall behavioral process related to energy consumption activities.
Carbon capability is defined as: “the capability to make informed judgments on low-carbon management and adopt effective low-carbon behaviors through individual behavior and collective behavior” [9,10], which is based on an understanding that carbon is transformed from the inevitable waste generated by modern lifestyles into an effective environmental contributor [11].
The value-belief-norm theory shows that low-carbon behavior needs to be driven by the intrinsic values of residents, i.e., those with a full carbon capability must have a consistent and stable ‘carbon value’ in order to exhibit low-carbon motivation [22]. The ‘carbon motivation’ drives individuals to learn low-carbon knowledge, skills, and assessment capabilities, i.e., ‘carbon knowledge’. Urban residents use ‘carbon knowledge’ as decision-making information to make a one-time or short-term purchasing behavior choice, thereby exhibiting a ‘carbon choice capability’ that mainly favors short-term decision-making. Long-term low-carbon choice behavior will evolve into ‘carbon behavior’. Public participation is also an important indicator for measuring the carbon capability of urban residents, in addition to routine use and waste disposal practices.
According to the theory of planned behavior, behavioral intentions are influenced by subjective norms [23], and if an individual with greater influence believes that someone should implement a behavior, then a person is more likely to be willing to comply with the individual’s will to implement the behavior [24]. The carbon influence capability is different from subjective norms where the process of social interaction continues to influence others to take low-carbon action. This type of ‘carbon influence capability’ is an intangible influence that constantly affects others and society in a subtle manner, and constantly promotes the development of a low-carbon life style.
Previous studies of capability, sustainable consumption and behavior, and low-carbon management indicate that the carbon capability can be understood based on the following: antecedents and consequences of carbon emissions, impacts of individual activities on carbon emissions, benefits of the low-carbon lifestyle, possible outcomes of individual actions, types of low-carbon activities that require collective action and changes in infrastructure, low-carbon budget management, information needed to achieve a low-carbon lifestyle, broader social constraints, and opportunities for sustainable consumption [25,26,27].
Several studies have investigated the carbon capability but there is still a lack of in-depth research into the measurement standards, dimensions, and factors that influence the carbon capability of urban residents, and thus there is a need for relevant qualitative and quantitative research. In addition, most of the theoretical studies of the carbon capability focused on western countries. The connotations, components, and measurement standards for the carbon capability will be different in various cultures. For example, individual autonomy and independence are highly valued in western society, whereas interpersonal harmony and obedience to elders are more important in Chinese culture. Therefore, there is a need to construct a suitable standard for measuring the carbon capability of Chinese residents when constructing a carbon capability model.
3. Materials and Methods
3.1. Model of the Carbon Capability Level and Key Factors
3.1.1. Carbon Capability Dimensions
Whitmarsh et al. (2011) [11] stated that the carbon capability has three core dimensions: decision making (knowledge, skills, motivation, and judgment), individual behavior or practice (such as energy conservation), and broader participation in governance and regulation systems (e.g., lobbying, voting, and protesting), which are also the dimensions of the carbon capability considered in most studies. However, these dimensions are broad and unsuitable for measurement.
To study the carbon capability in greater detail, it is necessary to determine the structure of the carbon capability and its possible dimensions. From a behavioral viewpoint, the carbon capability can be understood as an organic combination of three types of behavior: decision making based on existing knowledge, skills, and psychological motivation; low carbon emission practices; and low carbon management practices. Therefore, we identified the dimensions of the carbon capability given by Seyfang et al. based on previous interpretations of abilities and Fletcher’s definition of dimensions [28].
Initially, in the decision-making process, Seyfang et al. classified an individual’s low-carbon knowledge, skills, and motivation into one dimension. However, in the competency model, knowledge, skills, and motivation should be assigned to different levels in the competency structure. Based on the iceberg theory, McClelland (1973) [16] classified competencies into different categories, with knowledge and skills at the sea level as threshold competencies. The motivation is different at deeper levels, thereby differentiating competencies [12]. Therefore, if the low-carbon knowledge, skills, and motivation are assigned to one dimension, they are too broad to be measured easily. Therefore, we divide the decision-making dimension into two dimensions comprising the carbon knowledge capability and carbon motivation capability.
Furthermore, we consider that low-carbon practices mainly comprise carbon emission reduction behaviors performed by individuals in their daily lives because clothing, food, travel, and various activities all produce carbon emissions. Compared with general behavior, habitual behaviors are spontaneous and not affected by psychological motivation. In contrast to Seyfang et al.’s [9] “individual behavior or practice”, this dimension is more specific, where it reflects the individual’s capability to reduce emissions in their daily life and it is easy to measure. We expand the meaning of the carbon management capability by referring to residents implementing carbon management by making suggestions to the government and participating in voting decisions, as well as by discouraging others from high-carbon behavior or persuading others to practice green living. This approach considers the interactions between individuals and the influence of the process of adopting a low-carbon lifestyle.
Therefore, we classified the carbon capability into four dimensions designated as the carbon knowledge capability, carbon motivation capability, carbon behavior capability, and carbon management capability (Table 1). This division is specific and clear, and it has levels that are easy to measure.
3.1.2. Theoretical Model
The carbon capability of urban residents is a novel category and it is not completely clear. Therefore, we performed exploratory qualitative research to obtain a large empirical sample for quantitative research.
The first part of the qualitative research process comprised data collection. We conducted open and in-depth interviews with representative urban residents in the sample area to obtain relevant information. The representative urban residents were selected by theoretical sampling. The in-depth interviews employed a problem-focused interview method and each interview lasted about 1 h. The sample size was based on the principle of theoretical saturation.
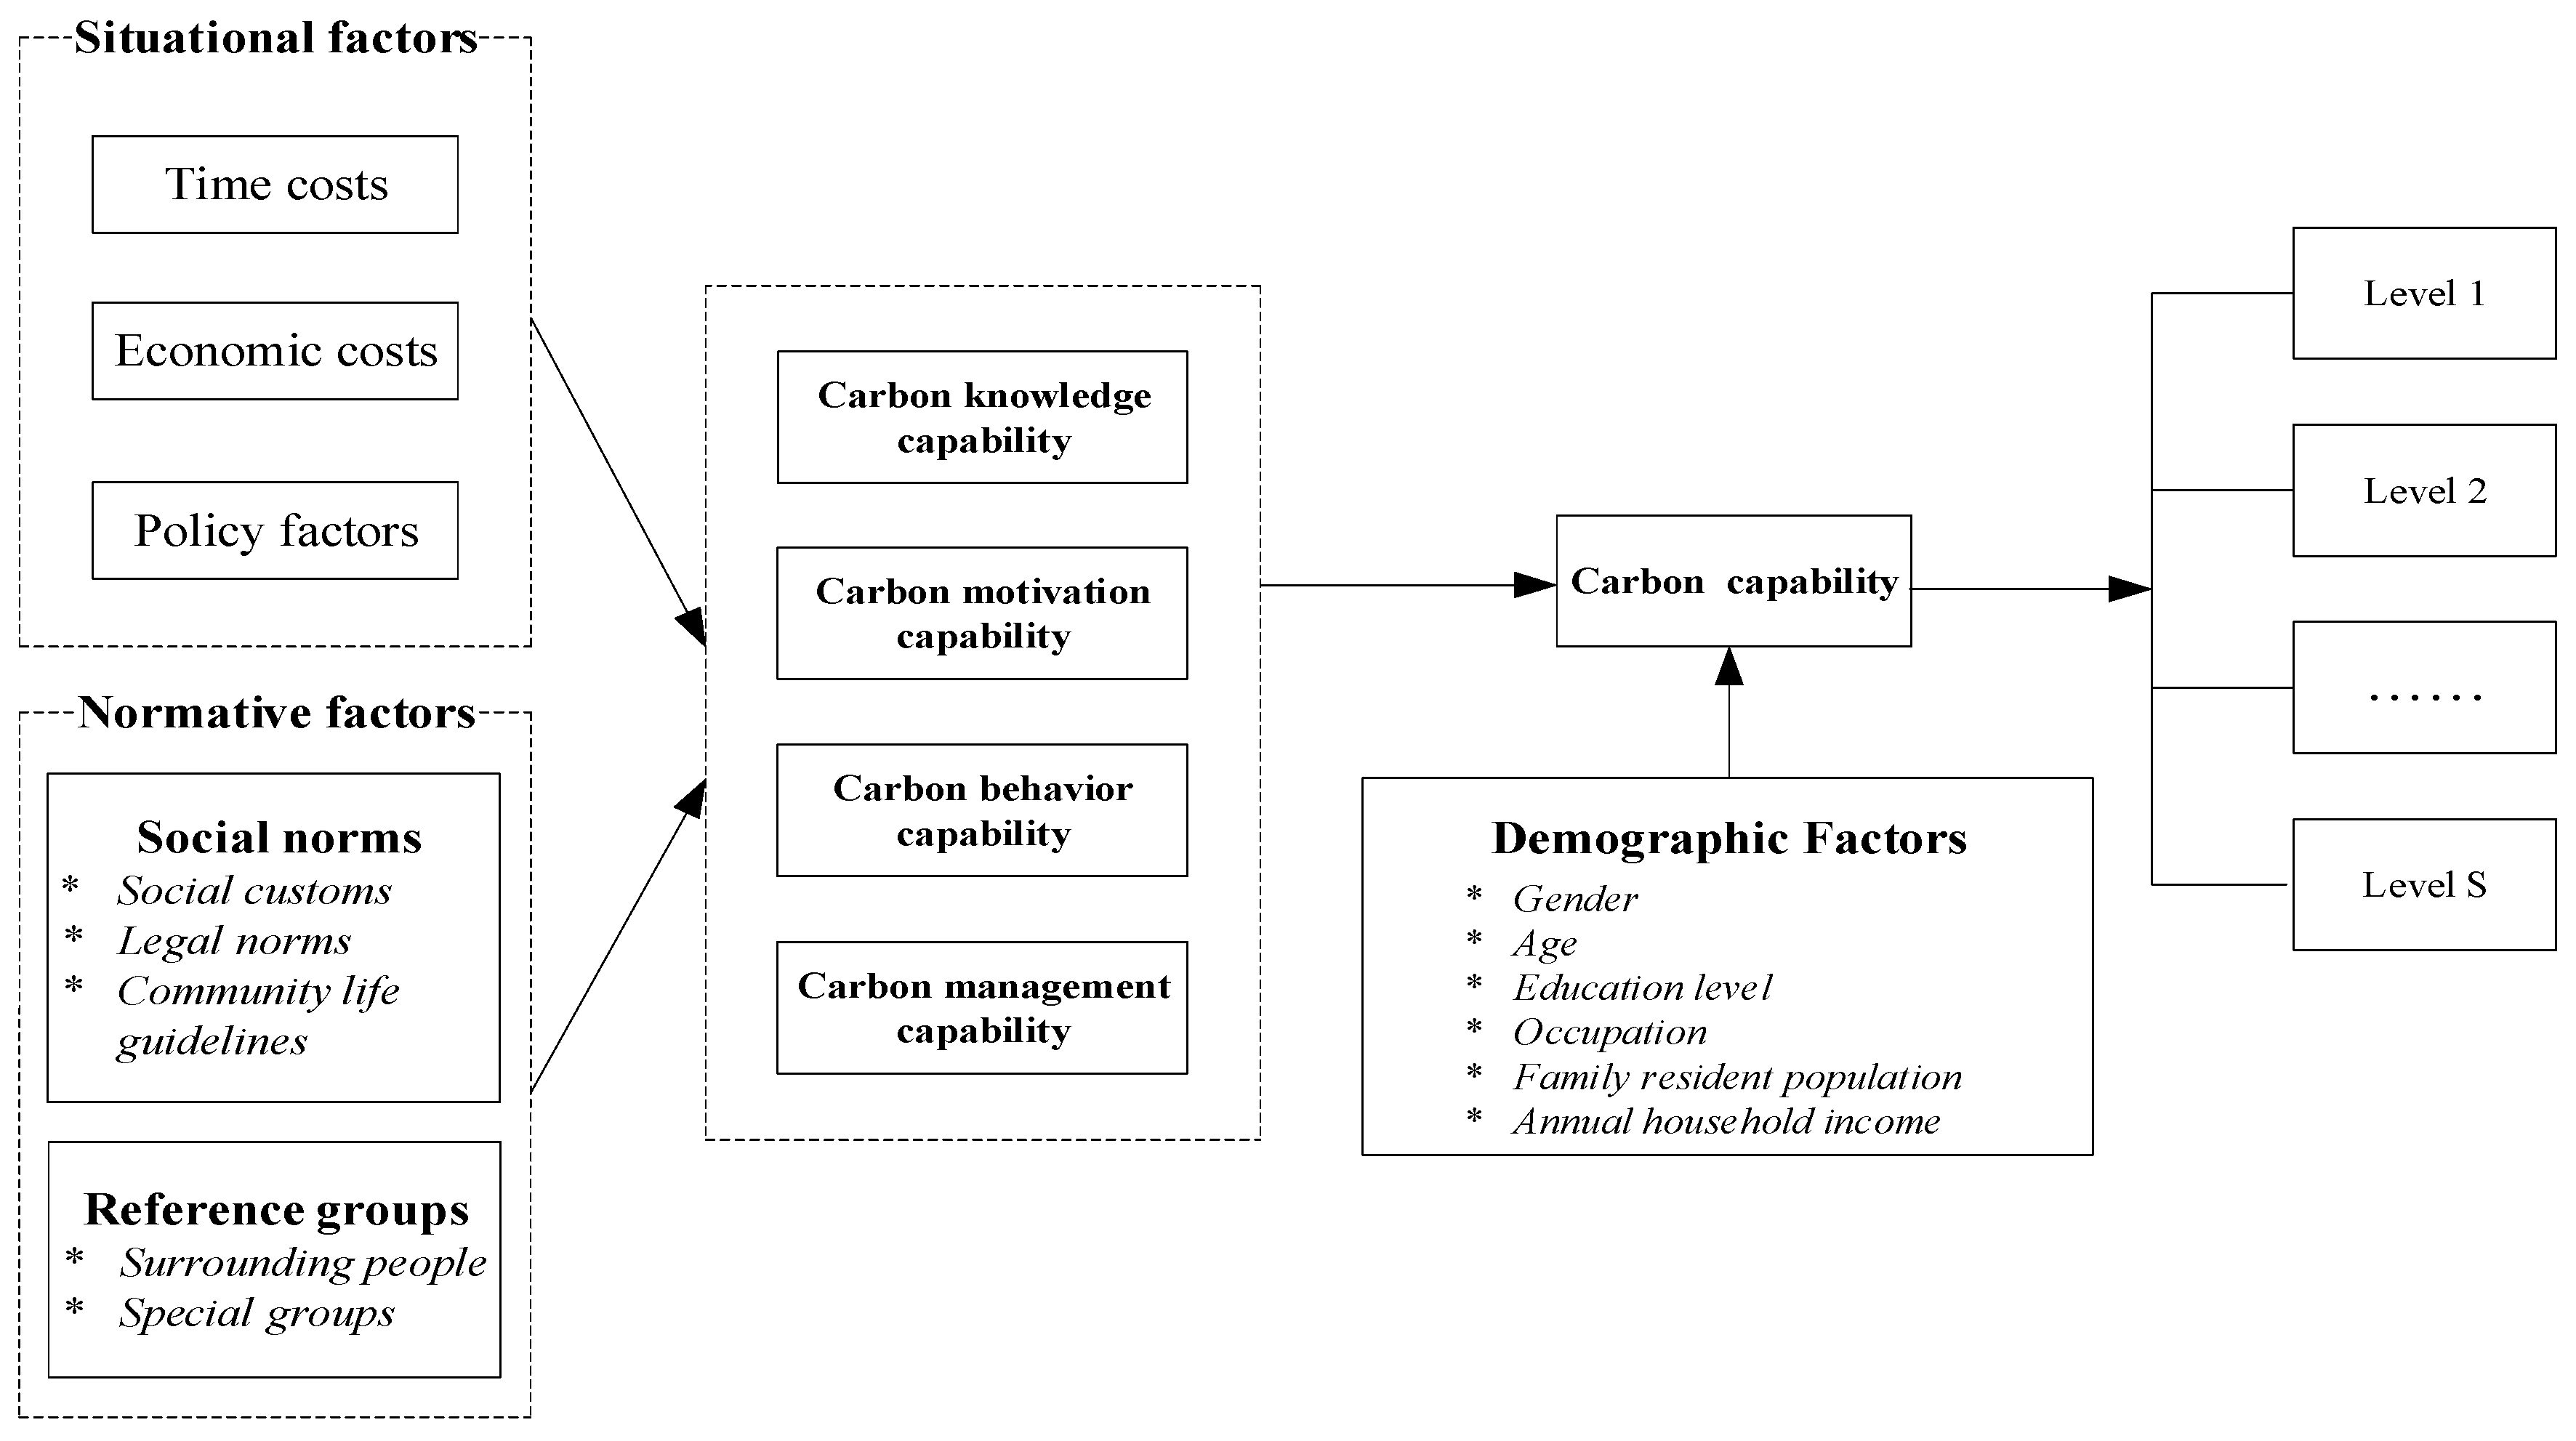
Finally, 52 interviewees were interviewed and the effective interview sample size was 48. Next, two-thirds of the interview records (32 copies) were randomly selected for grounded coding analysis and the other third of the interview records (16 copies) were used to test for theoretical saturation. To ensure the reliability and validity of this study, we strictly followed the grounded coding technique of Strauss and Corbin (1990) [29]. The final theoretical model is shown in Figure 1.
According to the theoretical model and the key factors involved, we assumed that the situational factors, normative factors, and demographic factors all had significant effects on the carbon capability of urban residents.
3.1.3. Mathematical Model
There is no ideal index for measuring the carbon capability and there is a lack of relevant quantitative research. The questionnaire data collected in this study were heterogeneous. According to previous studies, the MNL model can overcome the shortcomings of traditional linear models when studying individual heterogeneity and social psychology. The MNL model has advantages in terms of its clear conceptual basis and its simple calculation, and it has been used widely in economic, transportation, and other studies [30,31]. Therefore, we employed the MNL model to study the factors that influence the carbon capability.
Based on probability theory, the MNL model with the J option can be expressed as
where is the probability that individual chooses option , and is the parameter. The carbon capability is a potential variable and its explicit variables such as individual demographic characteristics are non-continuous variables. Therefore, the basic hypotheses considered in this study are as follows:
- (1)
- Residents with the same carbon capability level exhibit fairly consistent rational behavior when the options are determined and their choice is always to maximize their utility under established constraints.
- (2)
- The selected set and the attribute vector that the individual can measure are set. For a particular individual , there is always a corresponding attribute vector and a column selection set .
- (3)
- For each individual , the utility of choosing is mainly divided into two partswhere is a function of the indidual attribute and is a random error term, which reflects a person’s preference and observation error; andwhere represents the characteristics of set selected by the subject. In this study, the individual’s age, gender, educational background, family population, and the choice were not related to the interference due to situational factors and normative factors. The relevant data can be obtained through questionnaire surveys.
- (4)
- The individual chooses a combination that maximizes its utilityTo maximize its utility, the probability that individual chooses is
We assume that obeys the extreme value type I distribution and according to the MNL model, can be expressed as
The mathematical model solves the problem of measuring the factors that influence the carbon capability. However, the carbon capability is an unobservable variable so the MNL model cannot consider the heterogeneity of the carbon capability of residents and it cannot measure the level and structure of the carbon capability of residents. Therefore, we employed the LCM model to study these factors. The LCM model can assess the carbon capability level of urban residents and estimate its probability in order to intuitively observe the differences in performance by residents with different carbon capability levels in four dimensions, but it cannot be used to explore the factors that influence the carbon capability. Therefore, the LCM model and the MNL model were combined to study the carbon capability of urban residents.
We assume that the carbon capabilities of urban residents in Jiangsu Province have levels. The performance of a resident in terms of the four carbon capability dimensions can reflect a certain level among these levels. Combined with the MNL model, the probability of a resident’s () carbon capability being at level is
where is a parameter vector of , that indicates the reaction characteristics of clusters to each item, and represents a set of characteristics describing the external manifestation of residents in terms of the four carbon capability dimensions.
3.2. Questionnaire Design and Investigation
The eastern region of China is densely populated with a high level of economic development. Industrial carbon emissions and daily energy consumption by residents generate large amounts of CO2. The energy consumption of cities in eastern China is 187,948 tons of standard coal, which accounts for about 42% of China’s total energy consumption [32]. The Yangtze River Delta Urban Agglomeration is an area of eastern China with severe air pollution. Jiangsu Province is the core area for urbanization in the Yangtze River Delta Urban Agglomerations and air pollution is increasing.
In this study, we investigated residents of Jiangsu Province. This province has a large population and strong economic development. In 2016, the population reached 79.99 million, which was the fifth highest in China. The GDP reached 7.61 trillion yuan and the per capita GDP was 95,259 yuan (~14,890 US dollars), which ranked fourth in China. In 2016, the residential energy consumption in Jiangsu Province was 2.87 trillion yuan, with a high potential for reducing carbon emissions [32]. Therefore, it is important to guide the urban residents of eastern China, which were represented by the residents of Jiangsu Province in this study, to gradually increase their carbon capability.
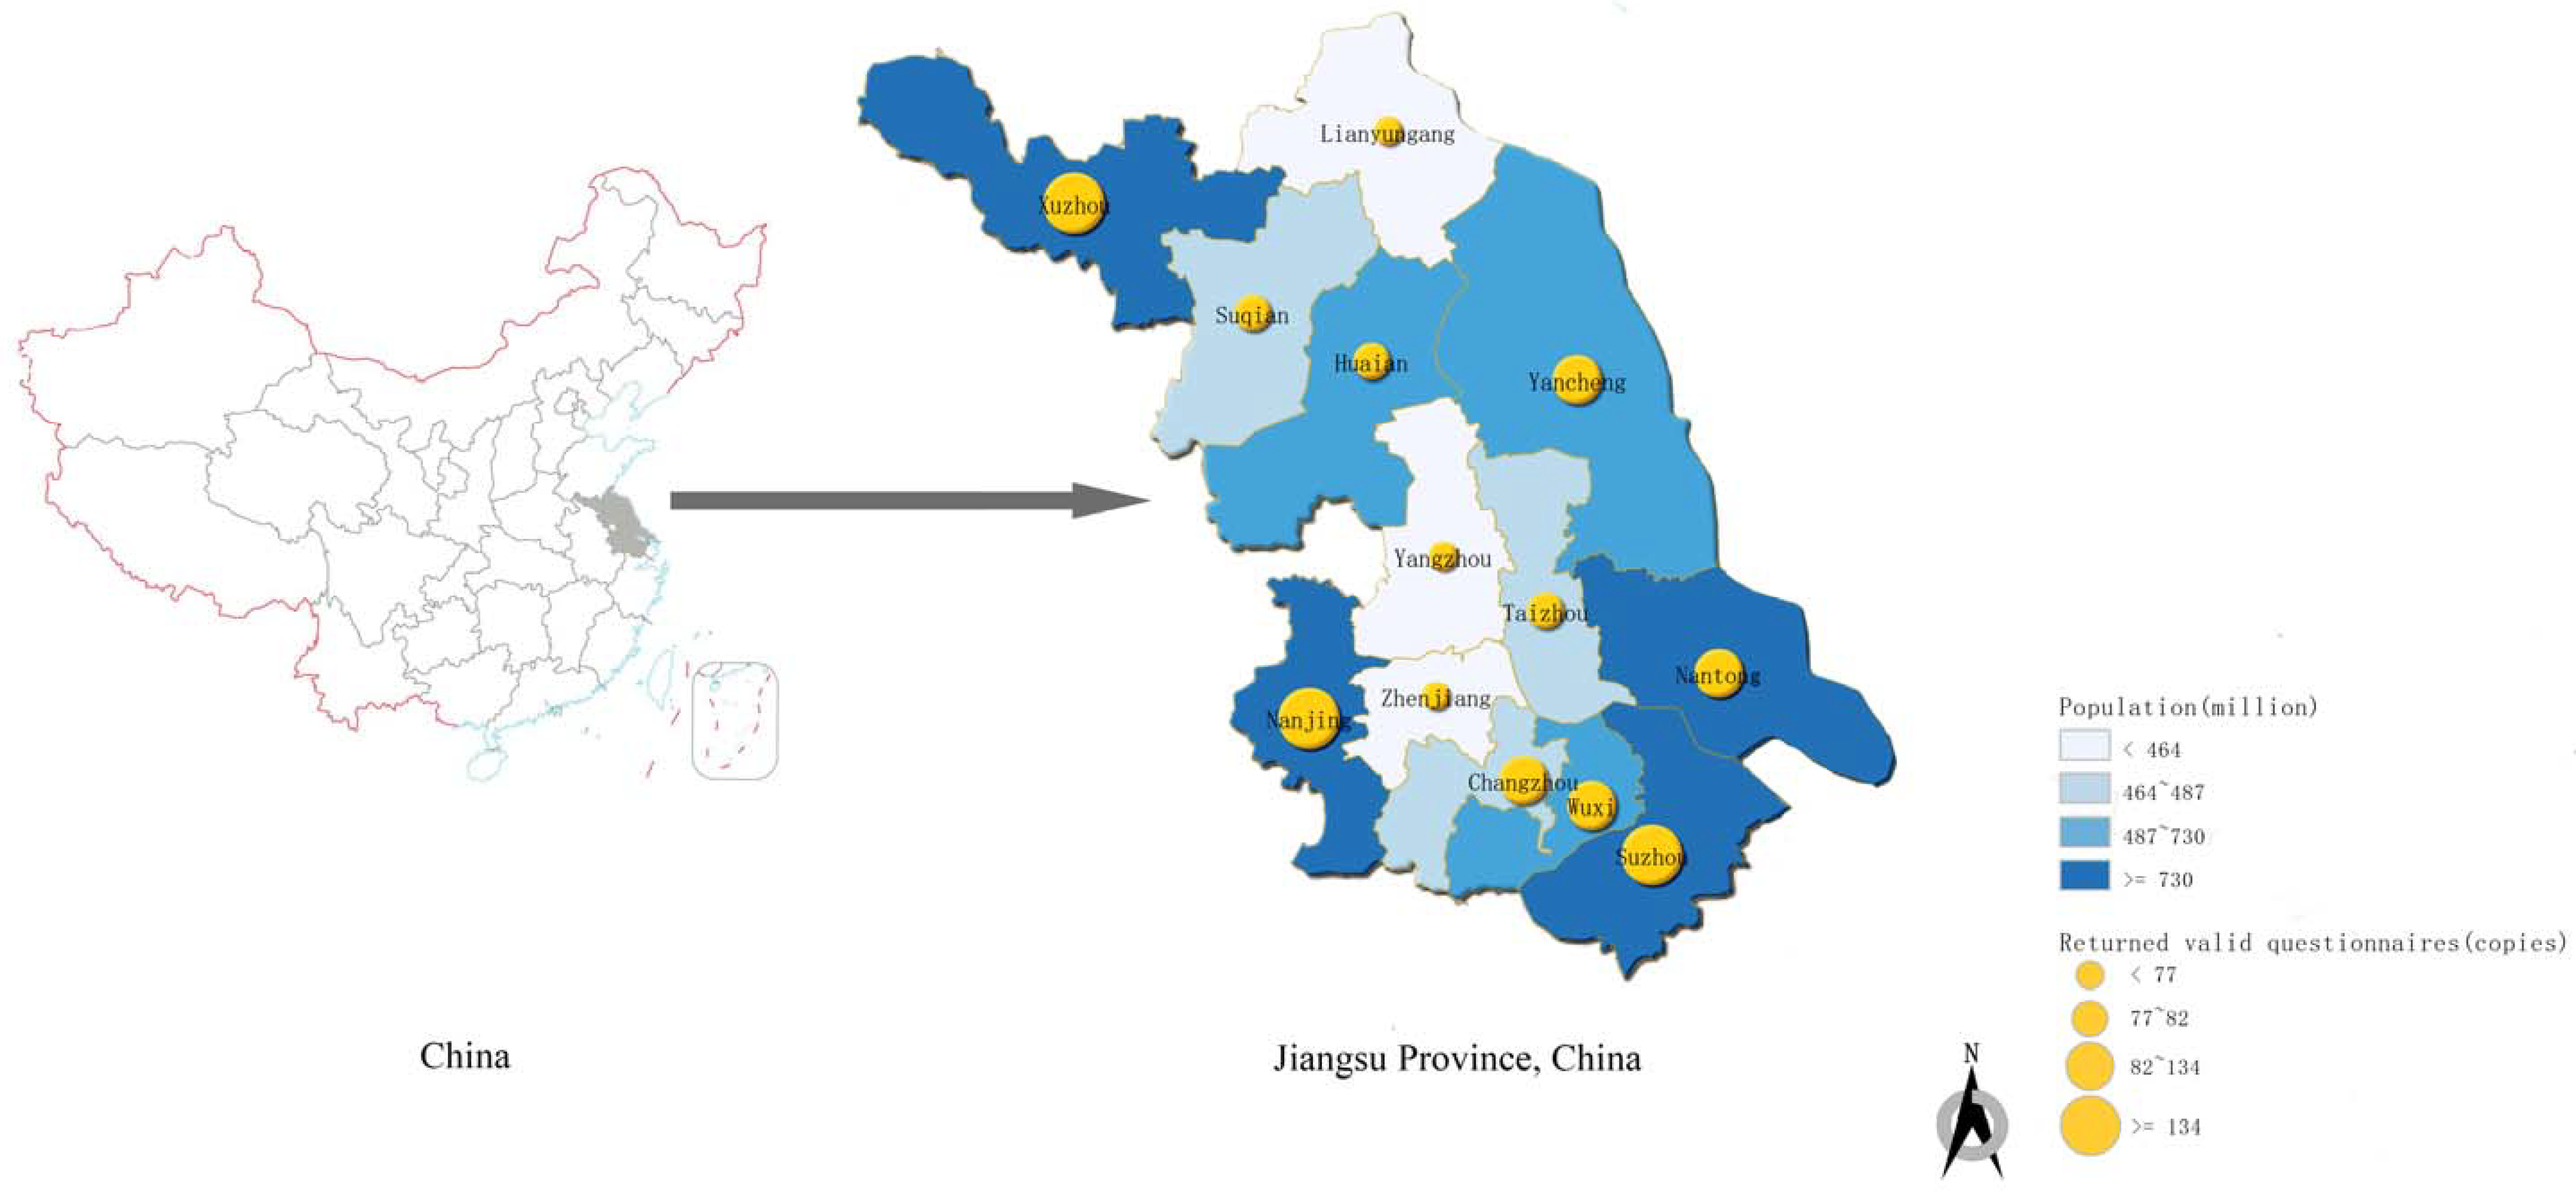
A preliminary survey to collect data was conducted in Xuzhou, where the reliability and validity of the questionnaire were analyzed. A formal questionnaire was obtained after the questionnaire was revised. The formal survey was conducted among residents of 13 cities in Jiangsu Province. The questionnaires were divided into paper questionnaires and online questionnaires. To ensure that the residents actively participated in completing the online questionnaires, we provided cash rewards online after completing the questionnaire. A simple random sampling method was employed to distribute the paper questionnaires. We randomly selected two partitions in each urban area and then randomly selected a number of communities, parks, and libraries, before finally randomly selecting residents from the partitions to complete the questionnaire. Considering that the concept of “carbon capability” is relatively new, some knowledge of the respondents was required. Therefore, we matched the educational level variables in the survey process. The questionnaire survey lasted for two months and we distributed 1437 questionnaires. The number of questionnaires distributed in each city was in proportion to the population size (Figure 2). According to the screening principle (excluding the missed selections and completion of at least eight questions from the options), 1308 valid questionnaires were screened and the effective rate was 91.02%.
To ensure the representativeness of the sample, we compared the demographic data obtained for the survey sample with the population statistics for Jiangsu Province [33]. The results showed that the basic characteristics of the survey sample matched with the overall population characteristics in Jiangsu Province, i.e., the survey sample was highly representative.
4. Results
4.1. Measurements of the Carbon Capability of Urban Residents in Jiangsu Province
4.1.1. Carbon Capability Levels
After basic processing of the questionnaire data, the data were substituted into Formula (7) using LatendGOLD software and the results are shown in Table 2.
In the calculation process, we use the trial calculation method to divide carbon capability levels of urban residents into 1, 2, …, 8 categories, respectively. logLik is the log-likelihood, and the larger the value is, the better the model is. AIC is the Akaike coefficient, and BIC is the Bayesian coefficient, which is opposite to logLik, i.e., the smaller the value is, the better the model is [34]. The logLik value became larger as the carbon capability level was divided (Table 2). According to the AIC results, the carbon capability level should be divided into seven or more levels to optimize the model. However, the BIC value decreased first and then increased. When the carbon capability level was divided into six levels, the BIC value was smallest and the model was optimal. In previous studies, the AIC index was suitable for analyzing small samples and the BIC index was applicable to large samples. In this study, we collected 1308 samples so the sample size was large, and thus BIC was selected as the evaluation index for the goodness of fit of the model. Therefore, based on the performance of Jiangsu residents in the four carbon capability dimensions, we divided them into six clusters.
In addition, the annual household income (p = 0.48) and household population (p = 0.17) had no significant effects on the carbon capability of residents at p < 0.05. In each cluster, the distributions of the household income and household population were basically the same. However, the effects of gender, educational level, age, and occupation on the carbon capability of residents were significant, and there were differences in their distribution among different clusters.
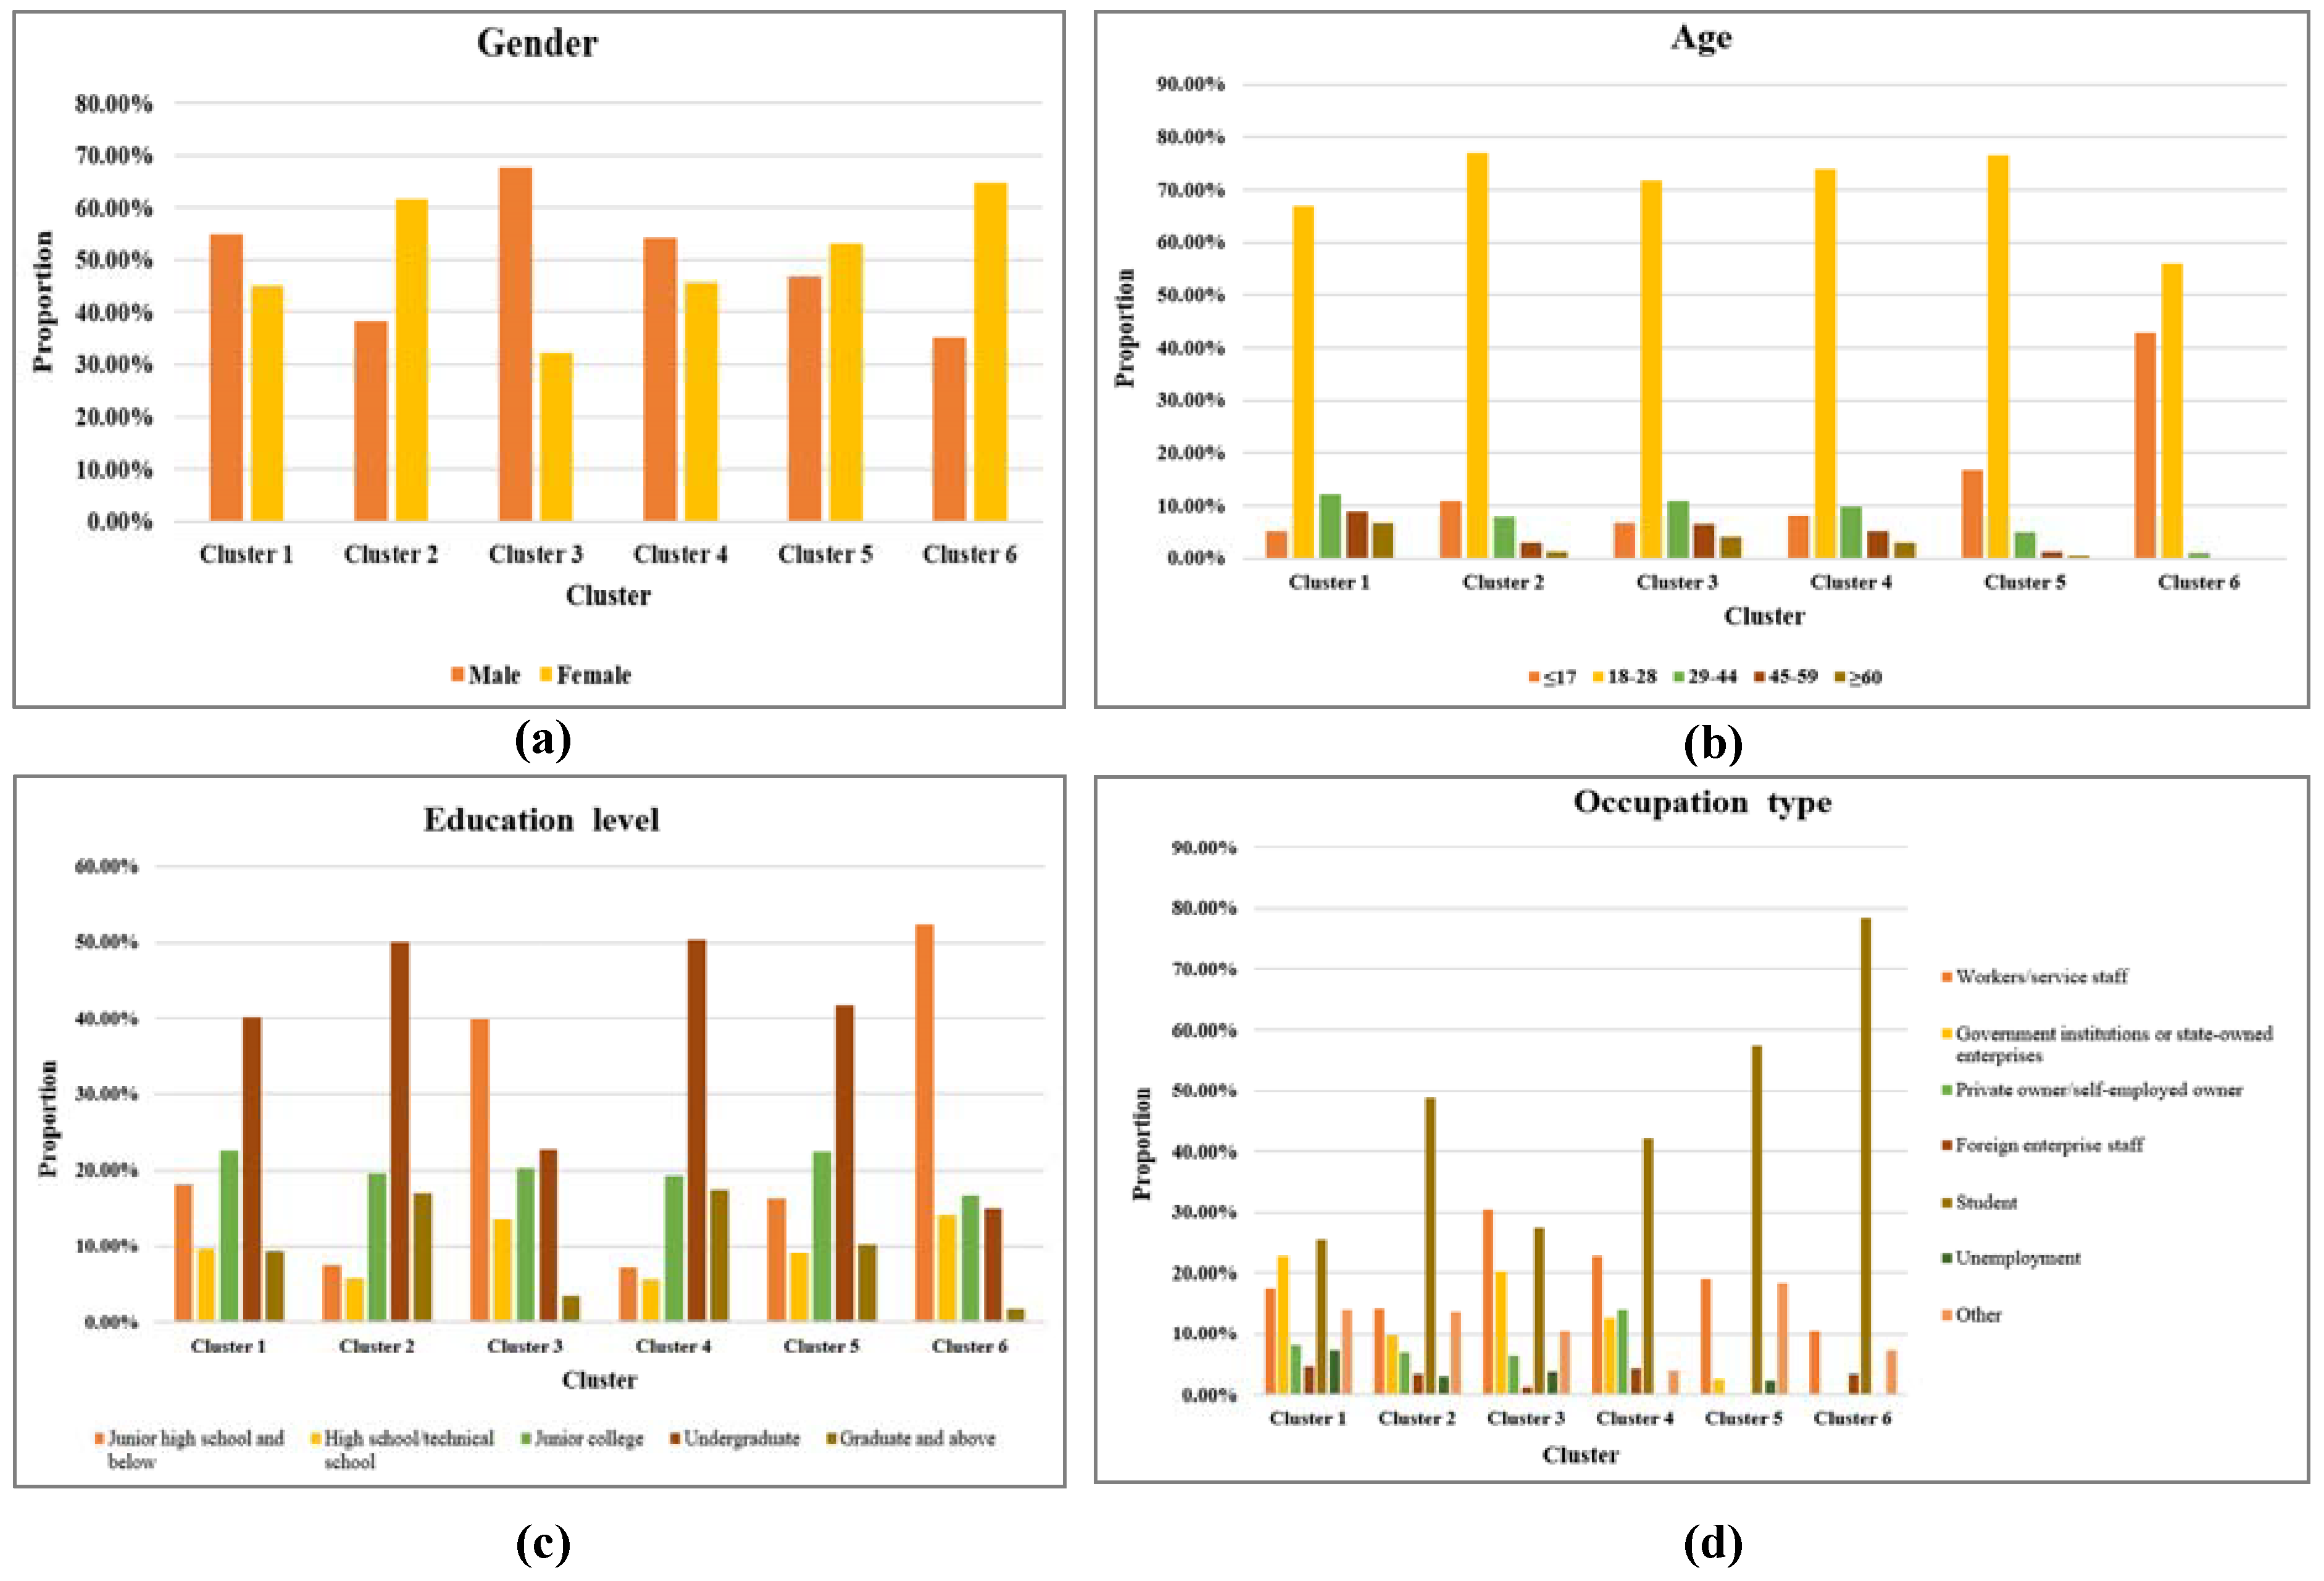
We produced a probabilistic graph to more clearly show the proportion of residents in different genders, ages, education levels, and occupations among the six clusters (Figure 3). (i) Gender: The proportions of male and female in cluster 1, cluster 4, and cluster 5 are relatively close. In cluster 2 and cluster 6, females account for nearly twice the proportion of males. Males in cluster 3 are significantly more than female. (ii) Age: Among the six clusters, the proportion of residents aged 18–28 is the highest. The proportion of residents aged 29–44 in the cluster 1, cluster 3, and cluster 4 is the second highest; the proportion of residents aged ≤17 in the cluster 2, cluster 5, and cluster 6 is the second highest. (iii) Education level: The overall educational level of cluster 1, cluster 2, cluster 4, and cluster 5 is relatively high. The number of undergraduates in cluster 2 and cluster 4 reached half of the population, and the population of cluster 4 had the highest level of education, followed by cluster 2. Residents with junior high school and below in cluster 3 and cluster 6 accounted for the highest proportion, and their overall educational level is low. (iv) Occupation type: The proportion of cluster 1, cluster 2, and cluster 3 in each occupation is more balanced than that of the other three clusters. The proportion of students in cluster 6 is the highest, the proportion of unemployed residents in cluster 4 is the lowest, and a few residents in cluster 5 work in foreign companies.
4.1.2. Analysis of Six Clusters in the Four Carbon Capability Dimensions
- (1)
- Carbon knowledge capability: In order to explore the carbon knowledge of residents, we focused on their understanding of the causes of climate change, the consequences of rising temperatures, the meaning of a low-carbon lifestyle, and methods used to reduce carbon emissions in daily life.
There are 10 items in the questionnaire to measure residents’ understanding of carbon knowledge. The data in Table 3 is the average score of six clusters on the carbon knowledge dimension in 1308 valid questionnaires, ranging from 1–5 points. The higher the score is, the more carbon knowledge the residents have. The p-value indicates the significance level of the questionnaire item. When p < 0.05, it indicates that the carbon knowledge dimensions have significant influence on carbon capability.
According to the p-value (Table 3), each item had a significant correlation with the carbon capability of residents at p < 0.05. From the average score of residents on the carbon knowledge dimension, we can see that cluster 4 > cluster 2 > cluster 5 > cluster 1 > cluster 6 > cluster 3. Cluster 3 had the lowest scores for each item compared with the other clusters, i.e., the residents in cluster 3 have the least carbon knowledge. Clusters 1 and 6 had basically the same performance characteristics in terms of the carbon knowledge dimension. The average scores of cluster 2 and cluster 5 are higher, which indicates that the knowledge and skills related to carbon emissions reduction were higher than those in the middle level. Cluster 4 members were highly aware of most of the carbon mitigation knowledge and they performed best in terms of the carbon knowledge dimension.
- (2)
- Carbon behavior capability: To explore the carbon behavior of residents, we investigated the behavior of residents in terms of implementing low-carbon behaviors and developing carbon emissions reduction habits (such as travel, shopping, and diet) in their daily lives.
There are 10 items in the questionnaire to measure residents’ understanding of carbon behavior. The data in Table 4 is the average score of six clusters on the carbon behavior dimension in 1308 valid questionnaires, ranging from 1–5 points. The higher the score, the more frequently residents implement low-carbon consumption behavior. The p-value indicates the significance level of the questionnaire item. When p < 0.05, it indicates that the carbon behavior dimensions have significant influence on carbon capability.
According to the p-value (Table 4), each item had a significant correlation with the carbon capability of residents at p < 0.05. From the average score of residents on this dimension, we can see that cluster 4 > cluster 6 > cluster 2 > cluster 1 > cluster 5 > cluster 3. The score for cluster 1 in terms of the carbon behavior was similar to that for the carbon knowledge dimension, and the score for each item was relatively balanced, although they all failed to reach 4 points. Clusters 2 and 6 scored 3–4 points for each item. Many items in clusters 3 and 5 scored below the median value, especially for cluster 3. These two clusters had the lowest scores for all items. Cluster 4 generally scored higher for each item.
- (3)
- Carbon management capability: In order to explore participation in carbon management by residents, we studied their awareness of energy security and emission reduction policies, the impact of their actions on the behavior of others, and the degree of participation in making suggestions.
There are 10 items in the questionnaire to measure residents’ understanding of carbon management. The data in Table 5 is the average score of six clusters on the carbon management dimension in 1308 valid questionnaires, ranging from 1–5 points. The higher the score, the stronger the residents’ willingness to participate in carbon management. The p-value indicates the significance level of the questionnaire item. When p < 0.05, it indicates that the carbon management dimensions have significant influence on carbon capability.
According to the p-value (Table 5), each item had a significant correlation with the carbon capability of residents at p < 0.05. The overall performance of Jiangsu residents was poor in terms of the carbon management dimension. From the average score of residents on this dimension, we can see that cluster 4 > cluster 6 > cluster 1 > cluster 2 > cluster 3 > cluster 5. Cluster 4 had the highest scores among all the clusters, but in contrast to the two previous dimensions, only three items had a score of ≥4 points. The scores for cluster 5 were below the median score of 3, and more than half of the scores were less than 2. Clusters 1 and 6 had relatively balanced score, which were generally 3–4 points. The scores for cluster 3 were also relatively similar at 2–3 points and they were at a moderate level.
- (4)
- Carbon motivation capability: To explore the carbon motivation of residents, we studied the intensity and performance of residents in terms of their intrinsic and extrinsic low-carbon motivation.
There are 10 items in the questionnaire to measure residents’ understanding of carbon motivation. The data in Table 6 is the average score of six clusters on the carbon motivation dimension in 1308 valid questionnaires, ranging from 1–5 points. The higher the score, the stronger the motivation of residents to implement carbon emission reduction. The p-value indicates the significance level of the questionnaire item. When p < 0.05, it indicates that the carbon management dimensions have significant influence on carbon capability.
According to the p-value (Table 6), each item had a significant correlation with the carbon capability of residents at p < 0.05. From the average score of residents on this dimension, we can see that cluster 4 > cluster 1 > cluster 2 > cluster 5 > cluster 6 > cluster 3. Cluster 4 had the highest average scores for each item. Clusters 1 and 3 had similar scores for each item, but cluster 1 had significantly better scores than cluster 2, and the scores for cluster 1 were similar to those for the previous three dimensions. Clusters 3 and 5 had similar scores, where both had the lowest scores for all items except item 8, and they performed poorly.
4.1.3. Definition of Different Clusters and Evaluation of Carbon Capability
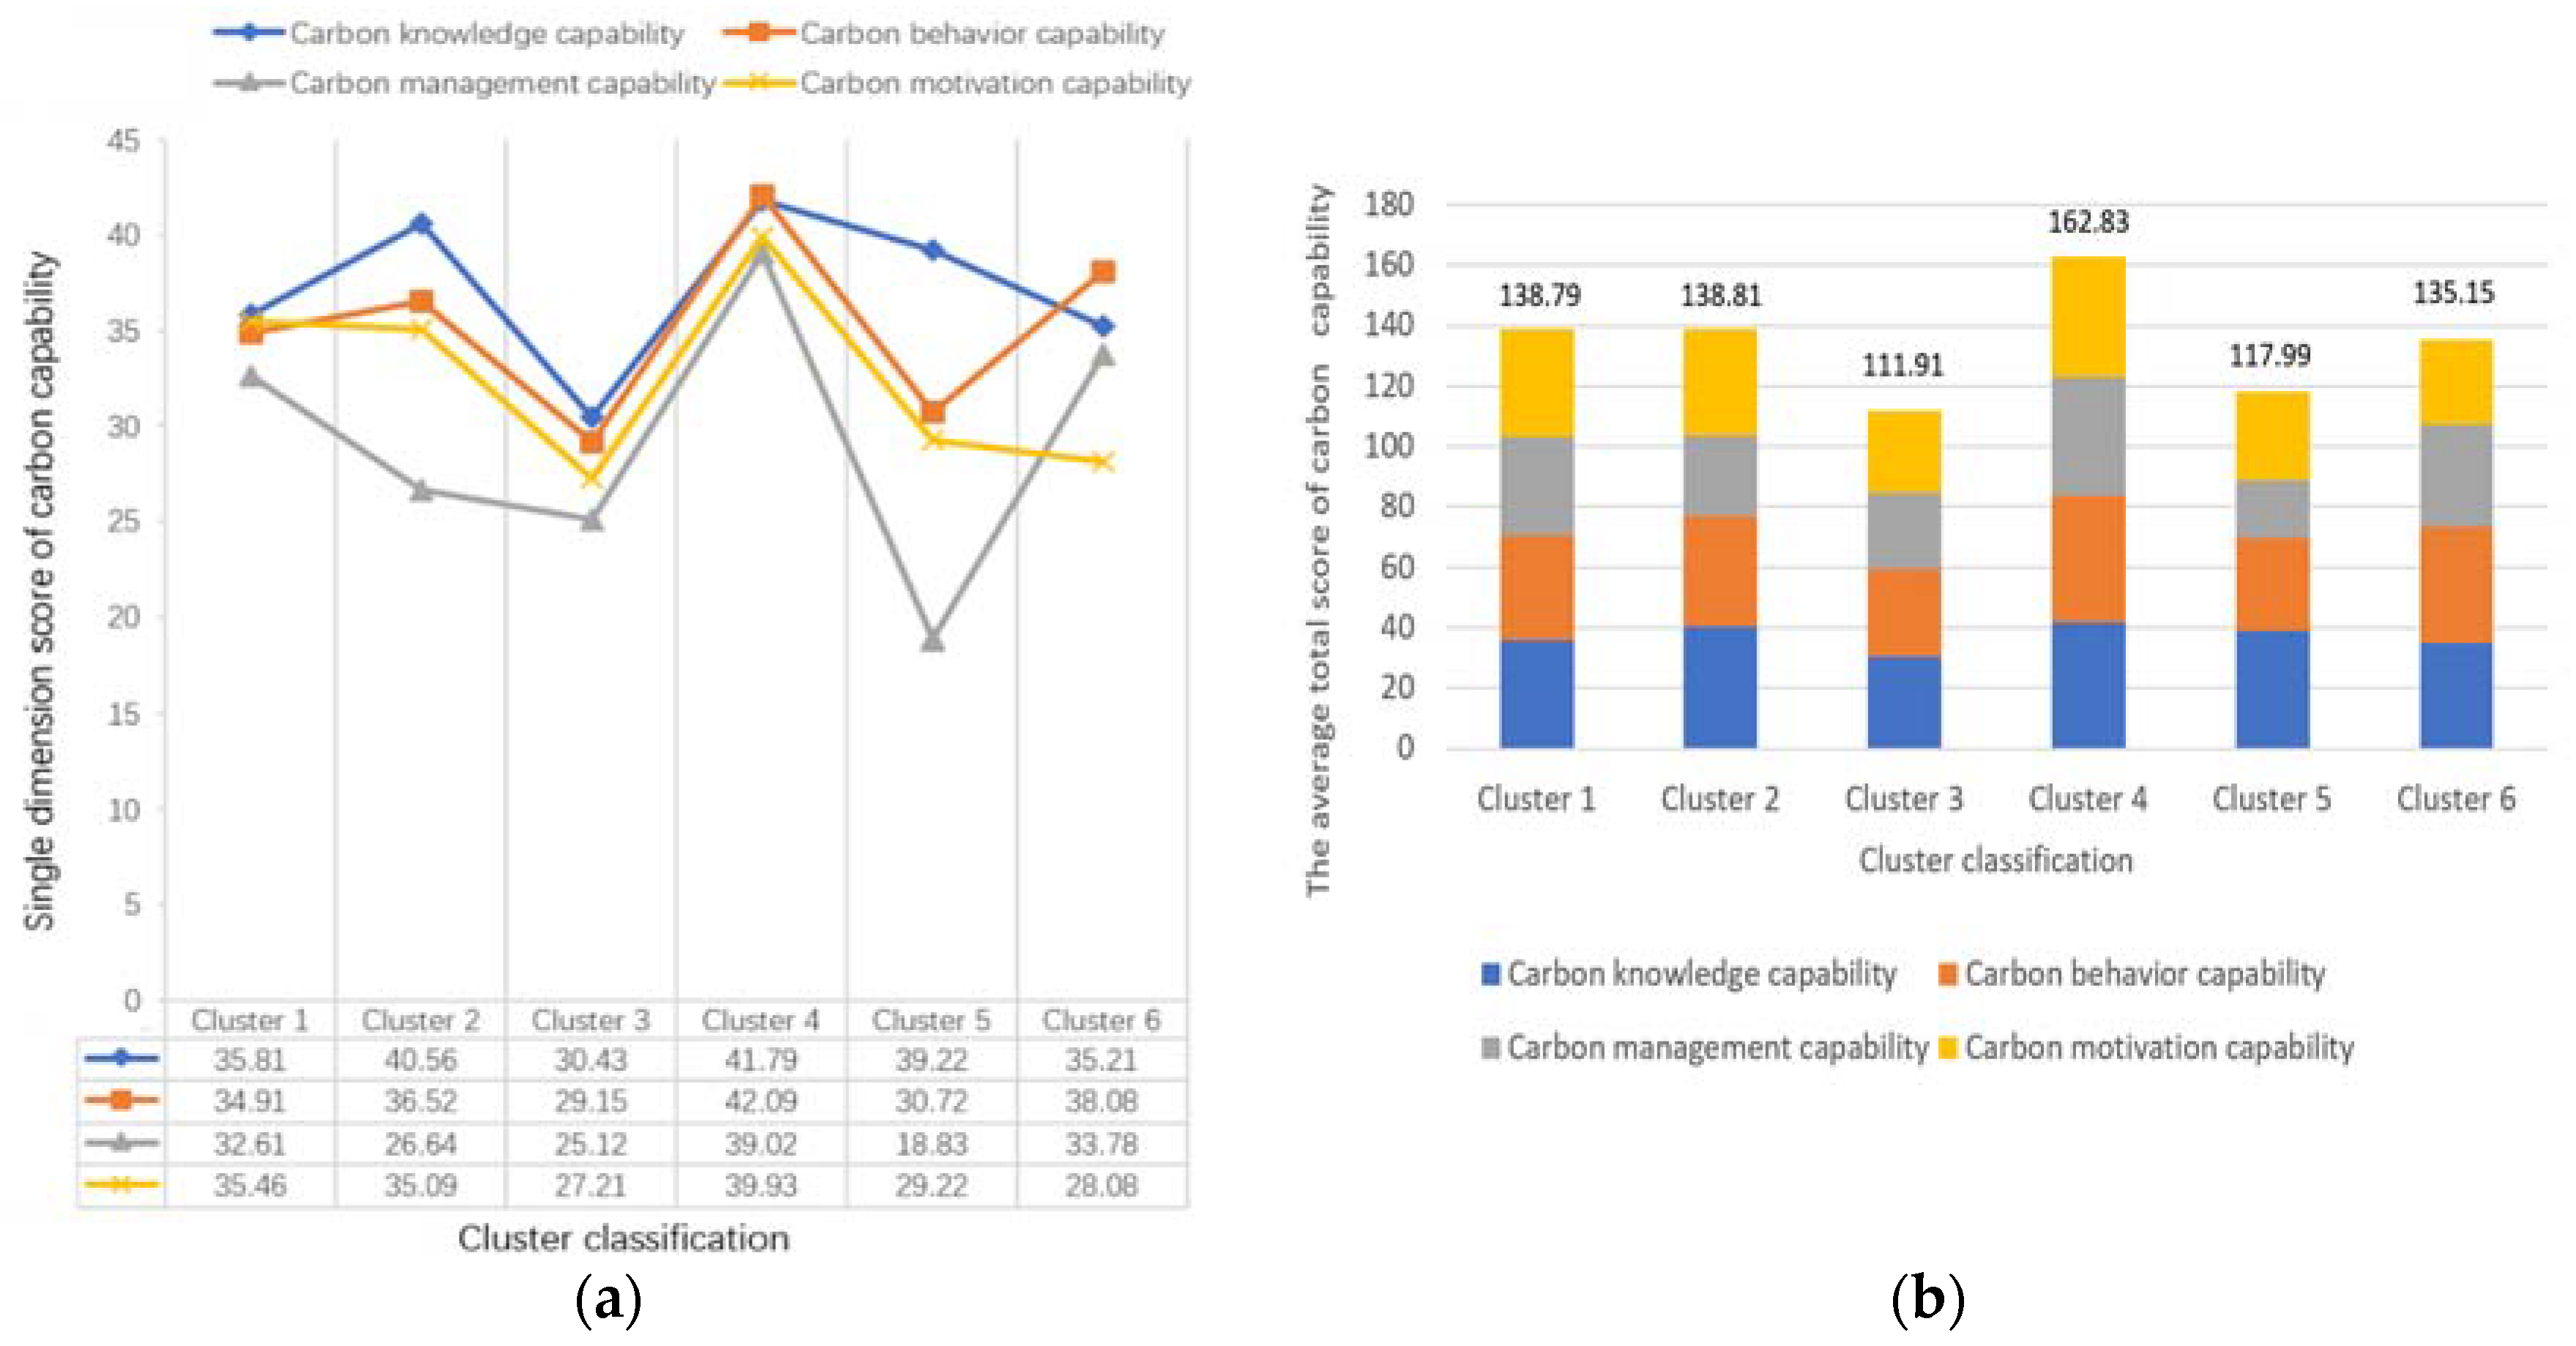
To understand and compare the performance of each cluster in terms of their carbon knowledge, carbon behavior, carbon management, and carbon motivation, we added the average score in the cluster for each item to calculate the score in terms of a single dimension and the average total score of the carbon capability for each cluster (with two decimal places), as shown in Figure 4. We can name and evaluate these six clusters according to the difference of scores and performance characteristics of different clusters on different dimensions.
As shown in Figure 4a, for the carbon knowledge dimension: cluster 4 > cluster 2 > cluster 5 > cluster 1 > cluster 6 > cluster 3; for the carbon behavior dimension: cluster 4 > cluster 6 > cluster 2 > cluster 1 > cluster 5 > cluster 3; for the carbon management dimension: cluster 4 > cluster 6 > cluster 1 > cluster 2 > cluster 3 > cluster 5; and for the carbon motivation dimension: cluster 4 > cluster 1 > cluster 2 > cluster 5 > cluster 6 > cluster 3.
According to Figure 4b, cluster 4 had the highest single score and total score for each dimension, so it was designated as the ‘comprehensive leading cluster’. The scores for cluster 1 were very similar for each dimension, and the scores for different items based on the single dimension were relatively similar. The overall scores were relatively balanced, so it was designated as the ‘balanced steady cluster’. Cluster 3 had the worst performance in terms of carbon knowledge, carbon motivation, and carbon behavior, so it was designated as the ‘fully backward cluster’. Cluster 5 had the worst performance in terms of the carbon management dimension, while it ranked fifth in terms of the carbon behavior and carbon motivation dimensions, but third for the carbon knowledge dimension. Thus, this cluster had some knowledge of carbon but it performed poorly in terms of other dimensions, so considering its comprehensive performance characteristics and it was designated as the ‘slightly cognitive cluster’. Cluster 6 ranked second only to cluster 4 in terms of the carbon motivation and carbon management dimensions, but its performance was poor for the other two dimensions, thereby indicating a strong willingness to reduce carbon emissions by this cluster and a willingness to participate in carbon management to constrain the bad behavior of others. However, they did not constrain themselves, so we designated this as the ‘restrain others cluster’. Cluster 2 had moderate scores in terms of carbon knowledge, carbon motivation, and carbon behavior. However, cluster 2 only considered their own behavior, where they scored relatively poorly for learning and carbon management participation, and thus it was designated as the ‘self-restraint cluster’.
After determining the six clusters, the overall carbon capability of residents was quantified in order to evaluate the carbon capability of urban residents in Jiangsu Province. The formula can be expressed as
where represents the average score for cluster based on item () and represents the strength of the correlation between each item and the carbon capability of residents.
Using the LCM model, we determined the degree of correlation between each dimension item and the carbon capability of residents, and the carbon capability score of each cluster was obtained by substituting into Formula (8) (Table 7).
To further evaluate the carbon capability of urban residents in Jiangsu Province, their carbon capability was evaluated according to the test evaluation standard in Chinese education based on the carbon capability score of each cluster. According to the test scores, the student grades are generally divided into five grades comprising fail, pass, average, good, and excellent. For test papers, a score less than 60% of the total score is a failure, 60–69% is a pass, 70–79% is medium, 80–89% is good, and 90% is excellent. This standard was also used for evaluating the carbon capability of Jiangsu residents.
According to the data in Table 7, the qualified threshold for the carbon capability was 59.32 and that for excellent was 88.97. In addition to the fully backward cluster and slightly cognitive cluster, the other four cluster carbon capacities were qualified. Thus, in general, the carbon capability of Jiangsu residents needs to be improved. The ‘qualified’ rate and ‘excellent’ rate for the carbon capability among residents of Jiangsu Province were only 61.93% and 15.84%, respectively.
4.2. Influencing Factors of Carbon Capability of Urban Residents
4.2.1. Situational factors
According to the p-value, the dimensions of the situational factors had significant impacts on the carbon capability of residents at p < 0.05.
- (1)
- Economic costs: (i) Low economic costs had positive effects on 65.24% of residents in terms of their carbon knowledge capability, but weak or negative effects on 34.78% of residents. (ii) Reducing economic costs had positive effects on 46.93% of residents in terms of promoting their carbon behavior and carbon motivation, thereby increasing their carbon capability level, but negative effects on the carbon behavior of 53.07% of the residents. (iii) Economic costs had negative effects on the carbon management capability of 93.45% of the residents. Therefore, reducing the economic costs can greatly enhance the overall participation in carbon management.
- (2)
- Time costs: Time costs had positive effects on all of the dimensions of the carbon capability. Most residents had a good understanding of carbon knowledge, a stronger willingness to reduce emissions because of lower time costs, and they were likely to form good habits to reduce carbon emissions and promote their participation in carbon management.
- (3)
- Policy factors: Policy factors promoted the performance of 46.93% of Jiangsu residents in terms of their carbon knowledge, carbon behavior, and carbon motivation dimensions, but a positive effect only on carbon management by 37.05% of residents.
4.2.2. Normative Factors
According to the p-value, the dimensions of the normative factors had significant effects on the carbon capability of residents at p < 0.05.
- (1)
- Social norms: (a) Social customs had positive effects on the carbon behavior of the self-restraint, comprehensive leading, and restrain others clusters. Social customs had the strongest positive effect on the comprehensive leading cluster. However, the emissions reduction behavior and habits of the balanced steady cluster, fully backward cluster, and restrain others cluster were affected less by social customs; (b) legal norms had positive effects on the self-restraint cluster, comprehensive leading cluster, and restrain others cluster, but their contributions to the carbon behavior of the other three clusters were not significant; (c) community guidelines had positive effects on the carbon capability of the self-restraint cluster, comprehensive leading cluster, and restrain others cluster.
- (2)
- Reference groups: (i) In terms of their carbon motivation, 65.24% of Jiangsu residents actively responded to propaganda, which increased their willingness to adopt a low-carbon lifestyle. (ii) In terms of carbon behavior, 46.93% of Jiangsu residents actively followed the surrounding population by implementing carbon emissions reduction behaviors, but more than half of the residents retained their high carbon emission habits.
Based on the foregoing analysis, we revised the model as shown in Figure 5.
5. Discussion
Instead of focusing on the knowledge, skills, or motivation of residents, carbon capability recognizes that the behavior of residents is limited by social structures, thereby requiring more collective action or other governance programs. Bauer and Gaskell (2008) [26] stated that a major challenge when trying to increase the carbon capability is enhancing the visibility of carbon and energy reuse in the daily practices and choices of people. Residents with a high level of carbon awareness make the correct decisions due to their own intellectual motivation to reduce carbon emissions, but they also realize that social barriers can prevent the implementation of a low-carbon lifestyle. Therefore, they may choose to participate in relevant institutions or organizations to improve the knowledge and skills of others, thereby influencing the carbon emission behaviors of others to reduce collective emissions and achieve a low-carbon lifestyle.
5.1. Economic Costs
Incentive fiscal policies have significant effects on promoting the carbon capability of residents. The empirical results obtained in this study show that economic costs had significant effects on more than half of the residents in terms of all the carbon capability dimensions. Yusuf and Rososudarmo (2007) [35] found that a carbon tax had beneficial effects on low-income residents and it could promote their low-carbon behavior. Chameides and Oppenheimei (2007) [36] showed that when a carbon tax is high, consumers will change their consumption behavior, thereby reducing CO2 emissions. In addition, financial subsidies can accelerate the development of low-carbon technologies. Thus, by taxing high-carbon products and subsidizing low-carbon products, residents can greatly enhance their motivation to choose a low-carbon lifestyle and develop good emissions reduction behavior.
Interestingly, the results obtained in this study show that low economic costs had a positive effect on the carbon behavior of the slightly cognitive cluster, but the performance of this cluster in terms of their carbon behavior was worse than that of the other clusters. Thus, the carbon behavior of this cluster was actually not affected by low economic costs because they lacked perception of this behavior due to their low carbon cognition. Lemke and Luzio (2013) [37] stated that green consumers consider that their behavior has a significant impact on environmental protection, so they are more likely to adopt internal controls. Vol (2005) [38] showed that there was a significant positive relationship between perceived effectiveness and green consumption behavior among consumers. Therefore, it is important to consider the psychological motivation of residents to reduce their emissions in terms of the carbon behavior dimension.
In terms of carbon motivation, reducing economic costs had positive effects on the willingness to implement low-carbon behaviors and adopt a low-carbon lifestyle in the self-restraint cluster, comprehensive leading cluster, and slightly cognitive cluster. Reducing economic costs was not important for the other three clusters. Most empirical studies have reported a significant direct positive correlation between behavioral intention and behavior. Kaiser et al. (1996) [39] conducted a questionnaire survey based on more than 3000 residents in Switzerland and found that environmental behavioral intentions explained 70% of their environmental behavior. Chen (2007) [40] found that behavioral intentions directly influenced the purchasing behavior of consumers by studying the intention of consumers to buy organic food in Taiwan. Geng et al. (2017) [41] found that the travel behavior of residents was associated with multiple motives and preferences. The main motivation was the daily travel behavior of residents and the other background motivations were only auxiliary functions. Therefore, in terms of the carbon motivation dimension, the residents who considered environmental needs as an assisted motivation (such as the fully backward cluster and the restrain others cluster) demonstrate that environmental motivation is only one variable that predicts their environmental behavior, but not a decisive variable.
The performance of residents in terms of carbon management was relatively poor, and thus they were unable to influence their low-carbon lifestyle. We found that over 90% of the residents were significantly negatively affected by the economic cost of carbon management. Therefore, it is necessary to reduce the economic cost of the carbon management process for residents. However, compared with the other clusters, the carbon management dimension was positively affected by economic costs in the restrain others cluster.
5.2. Time Costs
In terms of the carbon knowledge dimension, time costs had positive effects on five clusters. Previous studies have shown that environmental knowledge can directly or indirectly affect the environmental behavior of residents. In a study of the factors that might reduce household energy use, Steg (2008) [42] showed that a lack of energy saving knowledge and skills has prevented families from implementing energy saving behaviors. Cooke and Vermaire (2015) [43] also demonstrated that knowledge of environmental issues and environmental action is highly correlated with various environmental behaviors. By contrast, we found that the restrain others cluster considered that learning about low-carbon practices is excessively time consuming, thereby leading to their poor performance in the carbon knowledge dimension and negatively affecting their carbon capability.
Interestingly, time costs had the greatest effect on the balanced steady cluster in terms of the carbon behavior, carbon management, and carbon motivation dimensions. The members of this cluster were willing to take time to participate in low-carbon management, influence the carbon emissions reduction activities of others, and promote their carbon capability, possibly because they were keen to adopt a low-carbon lifestyle, and thus they were more highly motivated.
5.3. Policy Factors
In social psychology research, policy factors are regarded as important variables for situational factors, where they can significantly affect the occurrence of environmental behaviors as well as playing a regulatory role between environmental behavioral intentions and environmental behavior. Cameron (1985) [44] analyzed a sample of 1761 families from the USA and showed that if government subsidies reach 15% of the cost of improvement, then 3% of households would adopt some energy-saving measures. Sardianou (2005) [45] studied the influence of tax and subsidy policies on household energy use in western countries, and found that economic policies can significantly influence the energy use behavior of residents.
However, some studies have suggested that policy factors do not lead to improvements in environmental behavior. Based on in-depth interviews with 202 urban residents of European countries, Fischer et al. (2011) [46] found that most of the residents were self-centered, money-oriented, and consumption-oriented, and only strict regulations, significant price changes, and technological innovation might change their energy consumption behavior. The present study confirmed this viewpoint. In terms of the carbon knowledge and carbon behavior dimensions, incentive policies had positive effects on the carbon knowledge of 46.93% of the residents of Jiangsu, thereby contributing to improvements in their carbon capability. However, they also failed to increase the carbon knowledge of more than half of the residents of Jiangsu.
5.4. Social Norms and Reference Groups
In terms of the carbon motivation dimension, 65.24% of the residents of Jiangsu responded positively to propaganda, thereby enhancing their carbon motivation. In terms of the carbon behavior dimension, the self-restraint cluster, comprehensive leading cluster, and slightly cognitive cluster followed other people by reducing their carbon emissions. Castronova (2004) [47] suggested that in the field of green consumption, reference groups may provide examples of environmental protection and others might follow.
Scott et al. (2000) [48] and Nolan et al. (2008) [49] confirmed that the pressure due to social norms had important effects on the implementation of energy efficiency measures. Attitude is highly important in the formative stage of behavior and technology is most important in the implementation stage. However, social norms are most important in the continuous stage of behavior. We found that social customs had positive effects on the carbon behavior of the self-restraint cluster, comprehensive leading cluster, and slightly cognitive cluster, whereas the effects were weak on the other three groups. Therefore, the groups that are not sensitive to social norms should be considered more deeply.
6. Conclusions and Policy Implications
6.1. Conclusions
In this study, we constructed theoretical and mathematical models to measure the carbon capability level and main related factors, before using them to empirically test the carbon capability of urban residents in Jiangsu Province according to four dimensions. The main conclusions of this study are as follows:
- (1)
- The residents of Jiangsu Province were divided into six groups based on their different carbon capabilities. The six major groups accounted for 28.19%, 21.21%, 18.33%, 15.84%, 9.88%, and 6.55% of the total sample. Gender, age, occupation, and educational level had significant effects on the carbon capabilities of these groups. However, annual household income and household population had no significant effects on the carbon capability. In addition, situational factors and normative factors had significant effects on the carbon capability.
- (2)
- The carbon capability was classified based on four dimensions in terms of carbon knowledge, carbon behavior, carbon management, and carbon motivation, which were considered to be combinations of the learning capability, practical capability, capability of influencing others, and potential capability.
- (3)
- According to the characteristics of each cluster based on the four carbon capability dimensions, we designated six clusters as the ‘balanced steady cluster’, ‘self-restraint cluster’, ‘fully backward cluster’, ‘comprehensive leading cluster’, ‘slightly cognitive cluster’, and ‘restrain others cluster’. Quantitative analysis showed that the qualified rate in terms of the carbon capability of residents of Jiangsu was 61.93% and the excellent rate was only 15.84%.
6.2. Policy Implications
(1) Innovative methods should be employed to enhance the low-carbon knowledge of residents.
The government should implement educational programs to facilitate low-carbon education by focusing on specific and targeted low-carbon knowledge. In particular, it is more important to provide specific and targeted low-carbon knowledge to those with a low educational background or older people.
Communities may be encouraged to conduct evaluation activities with ‘low-carbon model families’ in order to promote the importance of low-carbon practices among residents. At the resident level, relevant departments should seek environmentalists with greater public influence and regularly hold low-carbon activities to create a ‘fan effect’ and increase awareness of low-carbon practices. The government should use new media to promote examples of low-carbon practices, which must be updated on a regular basis to provide ongoing information and inspire low-carbon behavior among residents, thereby enhancing their carbon capability.
(2) The legal system should be improved and the construction of appropriate infrastructure should be accelerated.
To ensure stable low-carbon consumption among residents, the government should ensure and improve the sustainability of the low-carbon system. Active public guidance should be provided regarding green diets, green clothing, green living, green travel, and green consumption. The related infrastructure should be modernized and the coordinated development of infrastructure areas needs to be promoted, thereby accelerating infrastructure recycling.
(3) The low-carbon management channel will be facilitated by an appropriate subsidy policy.
In terms of consumption, the government should improve the subsidy policy for low-carbon products, implement suitable subsidies for current low-carbon products, and reduce the economic concerns of urban residents regarding the selection of low-carbon products. For example, subsidies are given to consumer goods such as energy-saving lamps and new energy vehicles, and the low carbon selection habits of urban residents are being developed. On the supply side, the government should improve the accessibility to channels for low-carbon products so urban residents can access low-carbon products, such as by opening green supermarkets (online and offline) and building fully-functional low-carbon buildings.
Compared with other dimensions, we found that the residents performed poorly in terms of the carbon management dimension. Thus, the government should collect the opinions of residents during the construction of low-carbon systems in order to motivate residents to participate in their construction. In order to reduce time costs, the government needs to improve carbon management platforms, give environmental protection organizations with some powers, and enhance management channels.
Acknowledgments
This study was supported by the Fundamental Research Funds for the Central Universities (2017XKZD12). Special thanks for Qi Tan who collected the data and polished the revised manuscript.
Author Contributions
Ruyin Long and Hong Chen came up with the original idea for this article; Qianwen Li summarized the literature, designed the model, calculated the data, and wrote the paper. All authors read and approved this version.
Conflicts of Interest
The authors declare that they have no conflict of interest.
References
- Long, R.; Li, J.; Chen, H.; Zhang, L.; Li, Q. Embodied carbon dioxide flow in international trade: A comparative analysis based on China and Japan. J. Environ. Manag. 2018, 209, 371–381. [Google Scholar] [CrossRef] [PubMed]
- Global Carbon Project. Available online: http://www.globalcarbonproject.org/index.htm (accessed on 13 November 2017).
- Li, Q.; Long, R.; Chen, H.; Geng, J. Low Purchase Willingness for Battery Electric Vehicles: Analysis and Simulation Based on the Fault Tree Model. Sustainability 2017, 9, 809. [Google Scholar]
- Langevin, J.; Gurian, P.L.; Wen, J. Reducing energy consumption in low income public housing: Interviewing residents about energy behaviors. Appl. Energy 2013, 102, 1358–1370. [Google Scholar] [CrossRef]
- Liu, Z.; Guan, D.; Crawford-Brown, D.; Crawford-Brown, D.; Zhang, Q.; He, K.; Liu, J. A low-carbon road map for China. Nature 2015, 500, 143–145. [Google Scholar] [CrossRef] [PubMed]
- Li, Q.; Long, R.; Chen, H. Empirical study of the willingness of consumers to purchase low-carbon products by considering carbon labels: A. case study. J. Clean. Prod. 2017, 161, 1237–1250. [Google Scholar] [CrossRef]
- Papagiannakis, G.; Lioukas, S. Values, attitudes and perceptions of managers as predictors of corporate environmental responsiveness. J. Environ. Manag. 2012, 100, 41–51. [Google Scholar] [CrossRef] [PubMed]
- Aamaas, B.; Borken-Kleefeld, J.; Peters, G.P. The climate impact of travel behavior: A German case study with illustrative mitigation options. Environ. Sci. Policy 2013, 33, 273–282. [Google Scholar] [CrossRef]
- Seyfang, G.; Lorenzoni, I.; Nye, M. Personal Carbon Trading: Notional Concept or Workable Proposition? Working Paper; Centre for Social and Economic Research on the Global Environment: Norwich, UK, 2007; pp. 1–31. [Google Scholar]
- Whitmarsh, L.; O’Neill, S.J.; Seyfang, G.; Lorenzoni, I. Carbon Capability: What Does it Mean, How Prevalent Is it, and How Can We Promote It? Tyndall Working Paper 132; Tyndall Centre University of East Anglia: Norwich, UK, 2008. [Google Scholar]
- Whitmarsh, L.; Seyfang, G.; O’Neill, S. Public engagement with carbon and climate change: To what extent is the public ‘carbon capable’? Glob. Environ. Chang. 2011, 21, 56–65. [Google Scholar] [CrossRef] [Green Version]
- Yan, Y.J.; Yuan, L. Problems of quality of migrant workers and countermeasures from the perspective of Iceberg Model. Asian Agric. Res. 2012, 4, 48–50. [Google Scholar]
- Stephens, C.; Breheny, M.; Mansvelt, J. Healthy ageing from the perspective of older people: A capability approach to resilience. Psychol. Health 2015, 30, 715–731. [Google Scholar] [CrossRef] [PubMed]
- Avineri, S. The Social and Political Thought of Karl Marx; Political Science Quarterly; Cambridge University Press: Cambridge, UK, 1968. [Google Scholar] [CrossRef]
- Nelson, D.L.; Quick, J.C. Organizational Behavior: Science, the Real World, and You; South-Western College: Chula Vista, CA, USA; Cengage Learning: Boston, MA, USA, 2013. [Google Scholar]
- Mcclelland, D.C. Testing for competence rather than for “intelligence”. Am. Psychol. 1973, 28, 1–14. [Google Scholar] [CrossRef] [PubMed]
- Wilhelm, O.; Nickolaus, R. What distinguishes the concept of competence from established categories such as ability, skill or intelligence? Z. Erziehungswiss. 2013, 16, 23–26. [Google Scholar] [CrossRef]
- Hauw, S.D. An integrative model for competency development in organizations: The Flemish case. Int. J. Hum. Resour. Manag. 2015, 26, 1–26. [Google Scholar]
- Yeates, K.O.; Selman, R.L. Social competence in the schools: Toward an integrative developmental model for intervention. Dev. Rev. 1989, 9, 64–100. [Google Scholar] [CrossRef]
- Chen, X.; French, D.C. Children’s social competence in cultural context. Annu. Rev. Psychol. 2007, 59, 591–616. [Google Scholar] [CrossRef] [PubMed]
- Preston, B.; Kennedy, K.J. The national competency framework for beginning teaching: A radical approach to initial teacher education? Aust. Educ. Res. 1995, 22, 27–62. [Google Scholar] [CrossRef]
- Stern, P.C.; Dietz, T.; Abel, T.; Guagnano, G.A.; Kalof, L. A value-belief-norm theory of support for social movements: The case of environmentalism. Hum. Ecol. Rev. 1999, 6, 81–98. [Google Scholar]
- Ajzen, I. The theory of planned behavior. Organ. Behav. Hum. Decis. Process. 1991, 50, 179–211. [Google Scholar] [CrossRef]
- Vliet, B.V.; Chappells, H.; Shove, E. Infrastructures of consumption: Environmental innovation in the utility industries. Earthscan 2005, 16, 548–549. [Google Scholar]
- Cohen, M.J. Consumer credit, household financial management, and sustainable consumption. Int. J. Consum. Stud. 2007, 31, 57–65. [Google Scholar] [CrossRef]
- Bauer, M.W.; Gaskell, G. Social representations theory: A progressive research programme for social psychology. J. Theory Soc. Behav. 2008, 38, 335–353. [Google Scholar] [CrossRef]
- Wei, J.; Chen, H.; Cui, X.; Long, R. Carbon capability of urban residents and its structure: Evidence from a survey of Jiangsu Province in China. Appl. Energy 2016, 173, 635–649. [Google Scholar] [CrossRef]
- Fletcher, S. Competence-Based Assessment Techniques; Kogan Page: London, UK, 1992. [Google Scholar]
- Strauss, A.; Corbin, J.M. Basics of qualitative research: Grounded theory procedures and techniques. Mod. Lang. J. 1990, 77, 129. [Google Scholar]
- Alem, Y.; Beyene, A.D.; Köhlin, G.; Mekonnen, A. Modeling Household Cooking Fuel Choice: A PanelMultinomial Logit Approach. Energy Econ. 2016, 59, 129–137. [Google Scholar] [CrossRef]
- Wang, X.; You, S.; Wang, L. Classifying road network patterns using multinomial logit model. J. Transp. Geogr. 2017, 58, 104–112. [Google Scholar] [CrossRef]
- National Bureau of Statistics of China (NBSC). China Energy Statistical Yearbook; China Statistics Press: Beijing, China, 2017.
- Bureau of Statistics of Jiangsu Province (BSJS). Jiangsu Statistical Yearbook; China Statistics Press: Beijing, China, 2017.
- Posada, D.; Buckley, T.R. Model Selection and Model Averaging in Phylogenetics: Advantages of Akaike Information Criterion and Bayesian Approaches over Likelihood Ratio Tests. Syst. Biol. 2004, 53, 793–808. [Google Scholar] [CrossRef] [PubMed]
- Yusuf, A.A.; Resosudarmo, B.P. On the Distributional Effect of Carbon Tax in Developing Countries: The Case of Indonesia. Environ Econ. Policy Stud. 2007, 17, 131–156. [Google Scholar] [CrossRef]
- Chameides, W.; Oppenheimer, M. Carbon Trading over Taxes. Science 2007, 315, 1670. [Google Scholar] [CrossRef] [PubMed]
- Lemke, F.; Luzio, J.P.P. Exploring green consumers’ product demands and consumption processes. Eur. Bus. Rev. 2013, 25, 281–300. [Google Scholar]
- Vol, N. Antecedents of Green Purchase Behavior: An Examination of Collectivism, Environmental Concern and PCE. Adv. Consum. Res. 2005, 32, 592–599. [Google Scholar]
- Kaiser, F.G.; Wölfing, S.; Fuhrer, U. Environmental Attitude and Ecological Behavior. J. Environ. Psychol. 1996, 19, 1–19. [Google Scholar] [CrossRef]
- Chen, M.F. Consumer Attitudes and Purchase Intentions in Relation to Organic Foods in Taiwan: Moderating Effects of Food-Related Personality Traits. Food Qual. Preference 2007, 18, 1008–1021. [Google Scholar] [CrossRef]
- Geng, J.; Long, R.; Chen, H.; Yue, T.; Li, W.; Li, Q. Exploring Multiple Motivations on Urban Residents’ Travel Mode Choices: An Empirical Study from Jiangsu Province in China. Sustainability 2017, 9, 136. [Google Scholar] [CrossRef]
- Steg, L. Promoting Household Energy Conservation. Energy Policy 2008, 6, 4449–4453. [Google Scholar] [CrossRef]
- Cooke, S.J.; Vermaire, J.C. Environmental Studies and Environmental Science Today: Inevitable Mission Creep and Integration in Action-Oriented Transdisciplinary Areas of Inquiry, Training and Practice. J. Environ. Stud. Sci. 2015, 5, 70–78. [Google Scholar] [CrossRef]
- Cameron, T. A nested logit model of energy conservation activities by owners of existing single family dwellings. Rev. Econ. Stat. 1985, 6, 205–211. [Google Scholar] [CrossRef]
- Sardianou, E. Estimating energy conservation patterns of Greek households. Energy Policy 2005, 35, 3778–3791. [Google Scholar] [CrossRef]
- Fischer, A.; Peters, V.; Vávra, J.; Neebe, M.; Megyesi, B. Energy use, climate change and folk psychology: Does sustainability have a chance? Results from a qualitative study in five European countries. Glob. Environ. Chang. 2011, 21, 1025–1034. [Google Scholar] [CrossRef]
- Castronova, E. Achievement Bias in the Evolution of Preferences. J. Bioecon. 2004, 6, 195–226. [Google Scholar] [CrossRef]
- Scott, D.; Parker, P.; Rowlands, H.I. Determinants of energy efficiency behaviors in the home. Environments 2000, 28, 73–96. [Google Scholar]
- Nolan, J.M.; Schultz, P.W.; Cialdini, R.B.; Goldstein, N.J.; Griskevicius, V. Normative social influence is underdetected. Pers. Soc. Psychol. Bull. 2008, 34, 913–923. [Google Scholar] [CrossRef] [PubMed]
Figure 1.
Theoretical model of the carbon capability of urban residents and the key factors involved.
Figure 1.
Theoretical model of the carbon capability of urban residents and the key factors involved.

Figure 2.
Areas where the questionnaire was distributed.

Figure 3.
Probabilistic graphical based on (a) gender, (b) age, (c) educational level, and (d) occupation.
Figure 3.
Probabilistic graphical based on (a) gender, (b) age, (c) educational level, and (d) occupation.

Figure 4.
Scores for the four carbon capability dimensions: (a) the average score of each dimension for each cluster; (b) the average total score of the carbon capability for each cluster.
Figure 4.
Scores for the four carbon capability dimensions: (a) the average score of each dimension for each cluster; (b) the average total score of the carbon capability for each cluster.

Figure 5.
Modified model.


Table 1.
Dimensions of the carbon capability.
| Dimension | Definition | Description |
|---|---|---|
| Carbon knowledge capability | Understanding and mastery of low-carbon related knowledge and emissions reduction skills. | Capability of residents to learn low carbon knowledge and skills. |
| Carbon motivation capability | Intensity of psychological intention to reduce carbon emissions driven by values. | Capability of residents to change to a low-carbon lifestyle. |
| Carbon behavior capability | Reducing carbon emissions in daily life. | Capability of reducing emissions in daily life. |
| Carbon management capability | Implementing carbon management by making suggestions to the government and participating in voting decisions, as well as by discouraging others from high-carbon behavior or persuading others to practice green living. | Interaction between individuals and influence on the change to a low-carbon lifestyle. |
Table 2.
Correlation indexes for the carbon capability levels.
| The number of Divided Levels | logLik | Bayesian information Criterion (BIC) | Akaike Information Criterion (AIC) |
|---|---|---|---|
| 1 | −37,076.03 | 75,701.89 | 74,662.09 |
| 2 | −35,621.39 | 73,211.93 | 71,890.77 |
| 3 | −34,969.07 | 72,326.65 | 70,724.14 |
| 4 | −34,527.48 | 71,862.83 | 69,978.96 |
| 5 | −34,236.05 | 71,699.34 | 69,534.11 |
| 6 | −34,006.04 | 71,658.68 | 69,212.09 |
| 7 | −33,821.27 | 71,708.49 | 68,980.55 |
| 8 | −33,668.79 | 71,847.22 | 68,770.27 |
Table 3.
The average score of six clusters on the carbon knowledge capability dimension.
| Items | The Six Clusters of Carbon Capability | p-Value | |||||
|---|---|---|---|---|---|---|---|
| Cluster 1 | Cluster 2 | Cluster 3 | Cluster 4 | Cluster 5 | Cluster 6 | ||
| Item 1 | 3.5068 | 3.7253 | 2.8479 | 3.5673 | 3.8539 | 3.3438 | 1.1 × 10⁻⁶ |
| Item 2 | 3.9178 | 4.2181 | 3.3897 | 4.2867 | 4.2729 | 3.5845 | 1.3 × 10⁻⁹ |
| Item 3 | 3.7432 | 3.9518 | 3.1913 | 3.9520 | 3.8579 | 3.5124 | 2.9 × 10⁻⁶ |
| Item 4 | 3.8379 | 4.1498 | 3.3020 | 4.2098 | 3.9704 | 3.7419 | 3.5 × 10⁻⁷ |
| Item 5 | 3.9538 | 4.2704 | 3.2960 | 4.2753 | 4.4352 | 3.7953 | 2.1 × 10⁻¹⁰ |
| Item 6 | 3.3649 | 3.9637 | 3.0040 | 3.9792 | 3.7600 | 3.5718 | 6.4 × 10⁻⁸ |
| Item 7 | 3.3323 | 3.7533 | 2.7798 | 4.0971 | 3.8262 | 3.2699 | 6.6 × 10⁻¹⁰ |
| Item 8 | 3.6381 | 4.5735 | 3.2460 | 4.6510 | 4.3668 | 3.6120 | 6.1 × 10⁻¹⁶ |
| Item 9 | 3.2466 | 3.9833 | 2.7681 | 4.4518 | 3.4608 | 3.3206 | 8.7 × 10⁻¹⁴ |
| Item 10 | 3.2712 | 3.9706 | 2.6037 | 4.3238 | 3.4180 | 3.4594 | 1.7 × 10⁻¹³ |
| Mean | 3.5813 | 4.0560 | 3.0429 | 4.1794 | 3.9222 | 3.5212 | - |
Table 4.
The average score of six clusters on the carbon behavior capability dimension.
| Items | The Six Clusters of Carbon Capability | p-Value | |||||
|---|---|---|---|---|---|---|---|
| Cluster 1 | Cluster 2 | Cluster 3 | Cluster 4 | Cluster 5 | Cluster 6 | ||
| Item 1 | 3.4296 | 3.0794 | 2.6753 | 4.0128 | 2.5773 | 4.0871 | 4.0E-15 |
| Item 2 | 3.2468 | 2.6570 | 2.7834 | 3.8339 | 2.0514 | 3.5589 | 1.2E-14 |
| Item 3 | 3.8848 | 4.6476 | 3.4001 | 4.4892 | 4.3750 | 4.1841 | 2.4E-15 |
| Item 4 | 3.4559 | 3.8321 | 2.9219 | 4.3267 | 3.0379 | 4.1901 | 2.7E-13 |
| Item 5 | 3.3813 | 3.8259 | 2.9719 | 4.2342 | 2.8553 | 3.6648 | 1.0E-11 |
| Item 6 | 3.5300 | 4.0230 | 3.0535 | 4.3322 | 3.5422 | 4.1767 | 4.8E-12 |
| Item 7 | 3.5158 | 3.8102 | 2.9654 | 4.2533 | 3.5742 | 3.7049 | 1.3E-10 |
| Item 8 | 3.2690 | 3.1467 | 2.7802 | 4.0536 | 2.4596 | 3.4355 | 1.5E-14 |
| Item 9 | 3.4495 | 3.7001 | 2.7703 | 4.1279 | 2.9146 | 3.6003 | 1.5E-13 |
| Item 10 | 3.7439 | 3.7940 | 2.8319 | 4.4296 | 3.3301 | 3.4768 | 5.3E-16 |
| Mean | 3.4907 | 3.6516 | 2.9154 | 4.2093 | 3.0718 | 3.8079 | - |
Table 5.
The average score of six clusters on the carbon management capability dimension.
| Items | The Six Clusters of Carbon Capability | p-Value | |||||
|---|---|---|---|---|---|---|---|
| Cluster 1 | Cluster 2 | Cluster 3 | Cluster 4 | Cluster 5 | Cluster 6 | ||
| Item 1 | 3.5605 | 3.3242 | 2.5471 | 4.3019 | 2.4731 | 3.5987 | 4.7E-21 |
| Item 2 | 3.4808 | 3.0264 | 2.6002 | 4.2587 | 2.0339 | 3.5284 | 9.6E-24 |
| Item 3 | 3.2594 | 2.8118 | 2.3622 | 3.9843 | 1.7325 | 3.3187 | 4.9E-24 |
| Item 4 | 3.2887 | 3.1175 | 2.6035 | 4.1136 | 1.8937 | 3.3527 | 1.1E-20 |
| Item 5 | 3.2324 | 2.6106 | 2.3637 | 3.9001 | 1.6844 | 3.0981 | 3.1E-24 |
| Item 6 | 3.0815 | 1.8768 | 2.4336 | 3.6601 | 1.5623 | 2.7705 | 1.3E-22 |
| Item 7 | 3.0024 | 2.2203 | 2.3703 | 3.5902 | 1.7700 | 3.6774 | 2.9E-19 |
| Item 8 | 3.0832 | 1.9165 | 2.5397 | 3.3263 | 1.6495 | 3.1887 | 1.0E-19 |
| Item 9 | 3.2961 | 2.8948 | 2.6815 | 3.9950 | 2.0130 | 3.8958 | 1.2E-18 |
| Item10 | 3.3290 | 2.8361 | 2.6175 | 3.8928 | 2.0145 | 3.3528 | 4.2E-20 |
| Mean | 3.2614 | 2.6635 | 2.5119 | 3.9023 | 1.8827 | 3.3782 | - |
Table 6.
The average score of six clusters on the carbon motivation capability dimension.
| Items | The Six Clusters of Carbon Capability | p-Value | |||||
|---|---|---|---|---|---|---|---|
| Cluster 1 | Cluster 2 | Cluster 3 | Cluster 4 | Cluster 5 | Cluster 6 | ||
| Item 1 | 3.5203 | 3.2584 | 2.6731 | 4.0417 | 2.7668 | 3.6081 | 9.1 × 10⁻¹⁶ |
| Item 2 | 3.5420 | 3.3605 | 2.6591 | 4.0924 | 2.6224 | 3.3535 | 4.1 × 10⁻¹⁹ |
| Item 3 | 3.6587 | 3.9616 | 2.6685 | 4.4852 | 3.1355 | 3.5316 | 3.0 × 10⁻²² |
| Item 4 | 3.7595 | 4.4140 | 2.8711 | 4.5002 | 3.4367 | 3.6567 | 2.1 × 10⁻²⁰ |
| Item 5 | 3.2751 | 2.5832 | 2.6606 | 3.2982 | 2.1814 | 2.2830 | 6.3 × 10⁻¹² |
| Item 6 | 3.6076 | 4.2339 | 2.7755 | 4.1626 | 3.5463 | 2.9411 | 7.7 × 10⁻¹⁷ |
| Item 7 | 3.4225 | 3.1908 | 2.7309 | 3.9252 | 2.5668 | 2.1133 | 1.7 × 10⁻¹⁴ |
| Item 8 | 3.5269 | 2.8943 | 2.5933 | 3.6176 | 2.7727 | 1.9372 | 3.9 × 10⁻¹⁵ |
| Item 9 | 3.6208 | 3.8547 | 2.8347 | 4.0414 | 3.5124 | 2.2946 | 4.7 × 10⁻¹⁷ |
| Item 10 | 3.5225 | 3.3351 | 2.7462 | 3.7701 | 2.6770 | 2.3626 | 9.2 × 10⁻¹³ |
| Mean | 3.5456 | 3.5087 | 2.7213 | 3.9935 | 2.9218 | 2.8082 | - |
Table 7.
Carbon capability score for each cluster.
| Category of Cluster | Score | Category of Cluster | Score |
|---|---|---|---|
| Balanced steady cluster | 68.29 | Comprehensive leading cluster | 89.52 |
| Self-restraint cluster | 67.34 | Slightly cognitive cluster | 56.13 |
| Fully backward cluster | 54.63 | Restrain others cluster | 66.66 |
| Full marks | 98.86 |
© 2018 by the authors. Licensee MDPI, Basel, Switzerland. This article is an open access article distributed under the terms and conditions of the Creative Commons Attribution (CC BY) license (http://creativecommons.org/licenses/by/4.0/).
Share and Cite
MDPI and ACS Style
Li, Q.; Long, R.; Chen, H. Measurements and Factors That Influence the Carbon Capability of Urban Residents in China. Sustainability 2018, 10, 1292. https://doi.org/10.3390/su10041292
AMA Style
Li Q, Long R, Chen H. Measurements and Factors That Influence the Carbon Capability of Urban Residents in China. Sustainability. 2018; 10(4):1292. https://doi.org/10.3390/su10041292
Chicago/Turabian StyleLi, Qianwen, Ruyin Long, and Hong Chen. 2018. "Measurements and Factors That Influence the Carbon Capability of Urban Residents in China" Sustainability 10, no. 4: 1292. https://doi.org/10.3390/su10041292
Note that from the first issue of 2016, this journal uses article numbers instead of page numbers. See further details here.