1. Introduction
Presently, properly developed public infrastructure of electric vehicles can rarely be found even in major cities of the world. Potential buyers of such vehicles usually primarily focus their concern on technical and operating parameters [
1], infrastructure of charging facilities and ease of access to such facilities in the city of residence [
2,
3,
4], costs and benefits for drivers of electric vehicles [
5,
6], and on other economic and social factors [
7].
Countries of the European Union, which are committed to implementing European transport space development plans in time, should achieve the level of about 10% sales of new cars to be electric ones in the year 2025 [
8]. As the global market of electric vehicles is not fully developed, car manufacturers could make their own promotion of electric vehicles. Nevertheless, promotion by governments of various countries of ecological vehicles in major cities and resorts, emphasizing that the electric vehicle is such a technological alternative that carries a high potential for reducing pollution and energy dependence in the city [
9,
10], creates a more realistic potential for increasing the number of such vehicles in the roads of each country. Analysis of the latest literature suggests that development of electric vehicles in a city heavily depends on both infrastructure of electric vehicles together with considerable environmental and energy benefits of such vehicles comparing to traditional vehicles [
11,
12,
13].
Compared to neighbors, Lithuania is lagging in the level of development of public infrastructure for electric vehicles. For example, presently there are four times as many electric vehicles in Estonia than can be found in Lithuania. The strongest inducement was caused by the decision of the Estonian Government to use funds received for emission allowances sold for the purchase of electric vehicles. A considerable amount of electric vehicles was provided to public servants along with compensation to the first 500 buyers of private electric vehicles. In addition, a substantial network of charging stations was installed using the funds, which is currently considered to be the second largest network, related to the density of population, after Norway. There are currently 384 charging stations installed in Estonia; 193 of which are fast-loading; 72 charging stations in Latvia; 12 of which are fast-charging; and 329 charging stations in Poland; 39 of which are fast-charging [
14,
15,
16].
Lithuanian cities have excellent conditions for testing perspectives of development of the electric vehicle penetration due to rather high temperature fluctuations (from −30 °C to +35 °C) and reasonable distances between cities and resort areas (the very maximum distance in Lithuania is 356 km). From this observation naturally stems the purpose of the present article to evaluate possibilities of development of public infrastructure for drivers of electric vehicles and to offer effective solutions for infrastructure improvement based on the results obtained. We have to mention, though, related risks, which are beyond the scope of our research: capacity of electric supply, and efficiency of its present network. A situation with planned construction of the Ignalina Nuclear Power Plant is not yet clear, while all its reactors were closed on 31 December 2009. Nevertheless, the recently stretched two links “NordBalt” with Sweden over the bottom of the Baltic Sea, and connection with Poland “LitPol Link” should most probably ensure uninterrupted transmission of electricity after some adjusting steps will have been successfully accomplished.
As perception of the infrastructure by owners of electric cars is a complex one, we used multiple criteria evaluation methods (MCDM) of the current state of development of the infrastructure by several such MCDM methods as EDAS, SAW, TOPSIS, and PROMETHEE II.
2. Promotion of Electric Vehicles Policy Tools in Lithuania
Increase of use of electric vehicles is explained by the desire to save environment, non-renewable energy sources, and reduce fuel costs [
17,
18,
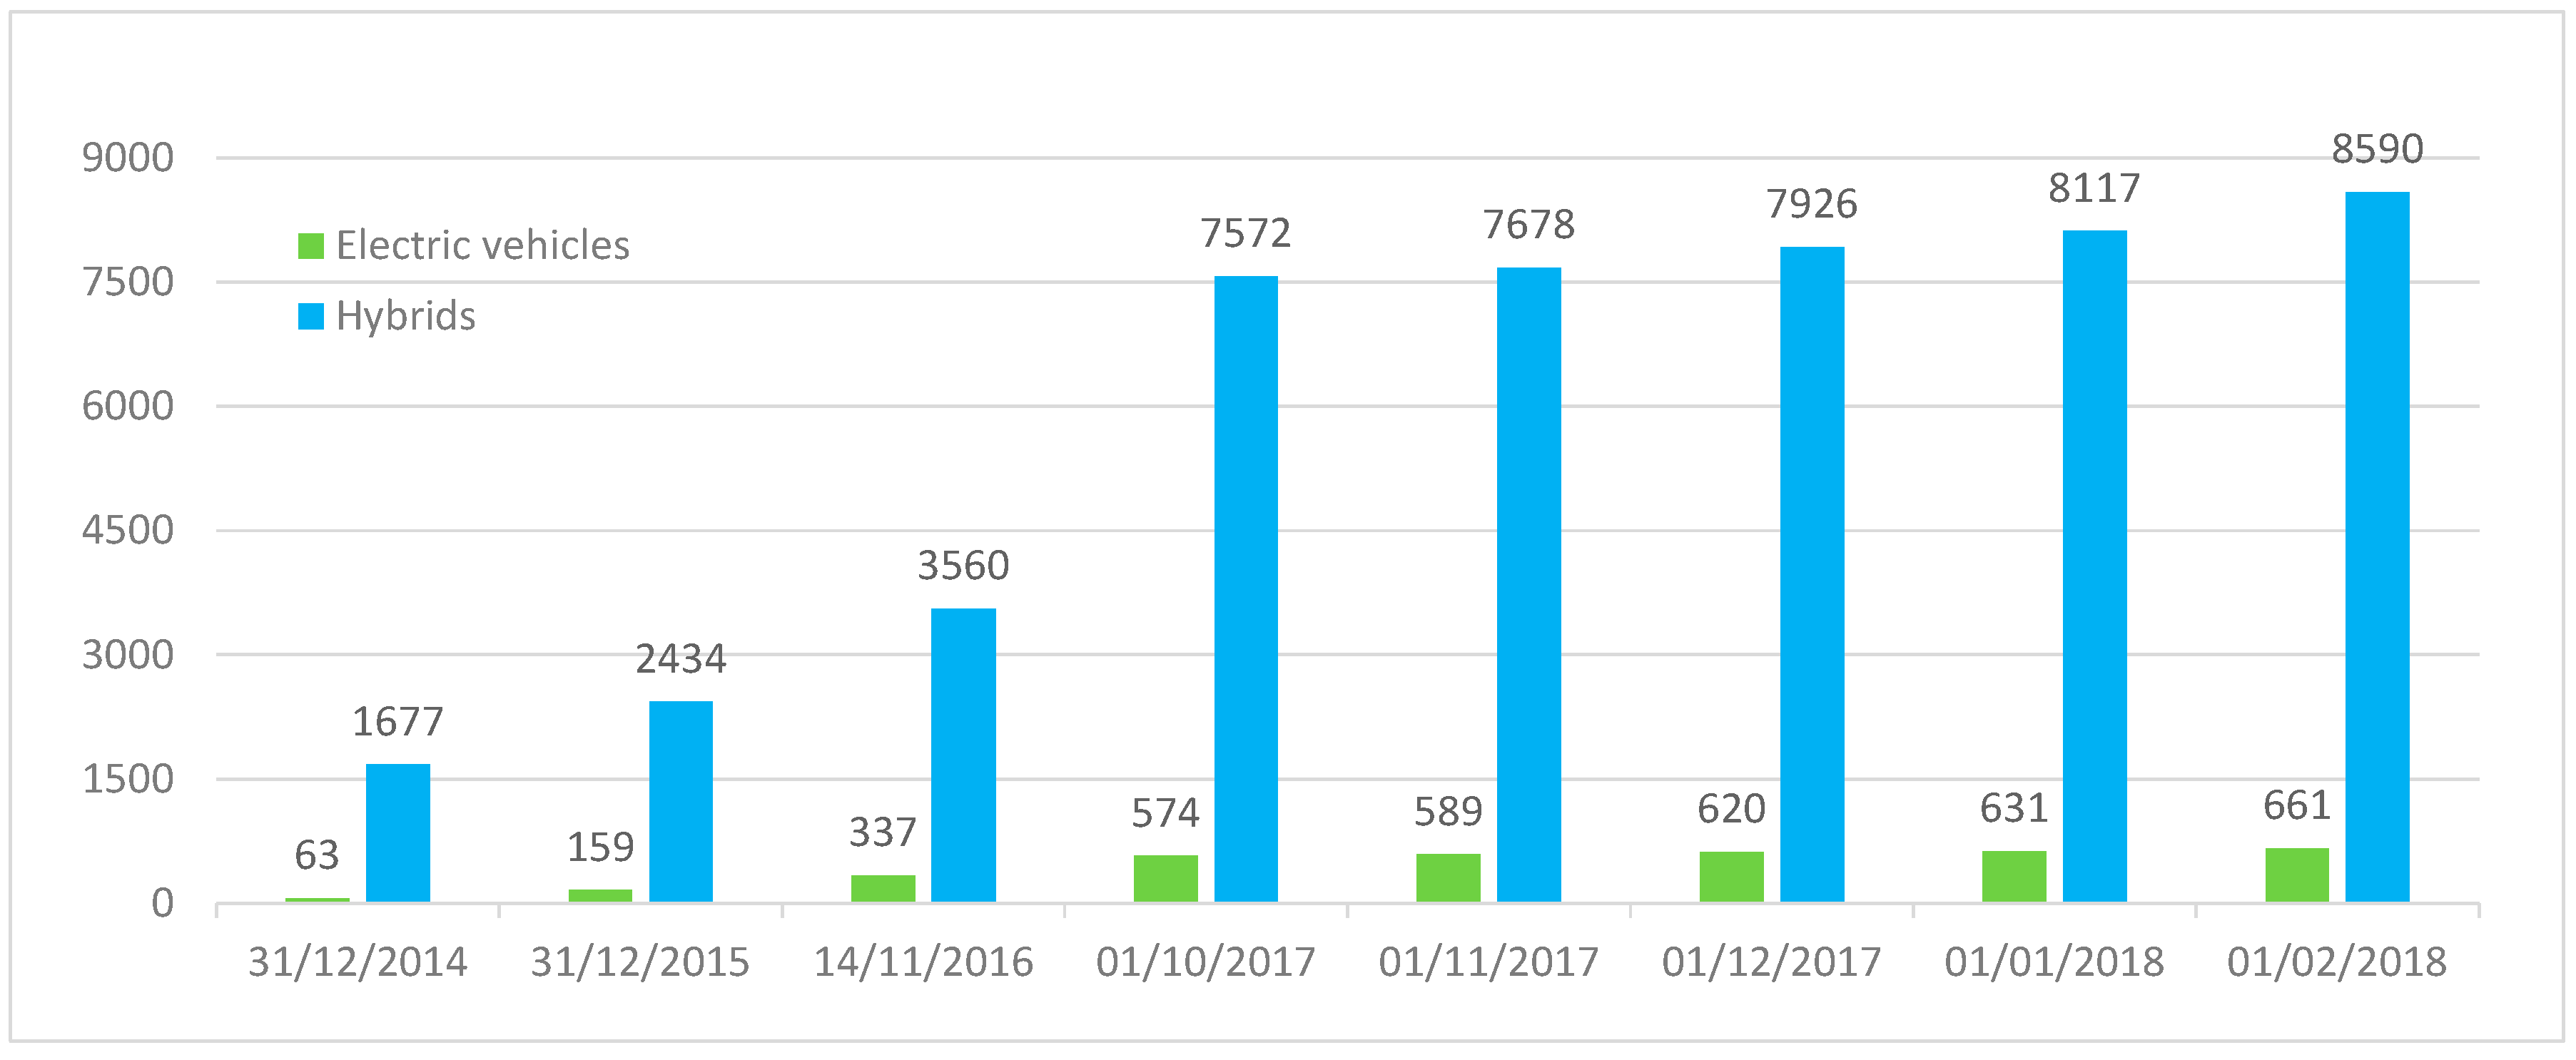
19]. As of 1 February 2018 according to the local registrar of vehicles, the State Enterprise “Regitra” (Vilnius, Lithuania) 661 electric vehicles were registered in Lithuania (
Figure 1). The most popular among them were Nissan Leaf (329 cars), Tesla’s model S (78 cars), and BMW i3 (57 cars), while 8590 cars of the M1 class hybrid vehicles (petrol/electric and diesel/electric) were registered. The most popular among them in the class diesel/electric were Toyota (5186 units), Lexus (2446 units), and Honda (403 units), and in the class petrol/electric were Chevrolet Volt (102 units), and Toyota Prius (24 units).
At present, in Lithuania, no electric vans and trucks have been registered. Only passenger electric vehicles have been registered. It is planned that the first Tesla electric truck will appear in Lithuania this year as it was ordered from the Tesla company by one of the largest European transport companies—Girteka Logistics (Vilnius, Lithuania).
We distinguish two types of promotional activities of electric vehicles: soft and hard. In Lithuania, only soft measures were undertaken so far, such as allowing the use of the dedicated for the public transport A-lane for electric vehicles starting from 19 January 2013; free parking of electric vehicles in city centers; some special road signs allocated indicating that road signs are not valid for electric vehicles, e.g., parking. However, based on current tendencies of using electric vehicles in this country, it can be forecasted that additional measures are required to sufficiently motivate the population to increase using electric vehicles. Consequently, the Ministry of Transport and Communications together with the Lithuanian Road Administration has prepared an incentive project for development hard promotional activities, estimated by 3 million euros investment. In addition, the EU provides financing possibilities for development of normal and high-power charging posts on major roads and within cities of the country, with over 25,000 in population or have the resort status.
The current development is apparently insufficient: in 2018, 12 electric high-power charging posts were installed on the major highway of the country. It is planned that 14 additional electric vehicle-charging posts will be installed on Lithuanian highways in the beginning of 2019, and it is planned that on Lithuanian highways at least 28 high-power access points will be created. In addition, according to the project, by the year 2022, at least 150 normal- and high-power stations for electric vehicles will be installed in cities and resorts, and around 30 high power stations on highways.
3. Choosing Criteria of Evaluation
A list of eight factors influencing the development of public infrastructure of electric vehicles in the city was created by authors of this paper using the expert examination method and by consulting a group of experts consisting of transport, road and civil engineers working at relevant ministries, researchers in the field of energy and environment. They were chosen by the duration of their work experience of no less than 10 years, occupied positions of no less than the head of a department, and by their academic degree of no less than a master’s.
In 2011, the White Paper on European Transport Policy for the development of a Single European Transport System was published by the European Commission. It aims to create an agenda for European Commission initiatives in the field of transport policy by the year 2050. The White Paper presents 40 specific initiatives to be taken by each European Union member state over the next decade to achieve the goals outlined in the document. The following eight criteria were created in accordance with the named Policy that are influencing the development of public infrastructure of electric vehicle (
Table 1).
We have selected 18 major cities and resorts of Lithuania for the evaluation. The data reflecting each city and resort by every criterion is formed into a decision-matrix R = , of the size (m, n), where m is the number of chosen criteria (8), and n is a number of cities participating in the evaluation (18).
4. Eliciting of Weights of Criteria and Gauging the Level of Concordance of Opinions of Experts
MCDM methods require using weights ωi, which express importance of each criterion (where i is an index for denoting criteria).
For the chosen task, it was decided to elicit opinions of importance of criteria from experts, and, in addition, to employ the entropy method, which finds weights based on data only. Two absolutely different methods were gathered in the way that possible flaws of one method were outweighed with another method. Unlike previous attempts, where geometric mean for comprising results of weights elicited from experts and the ones, which were elicited from data, the arithmetic mean was used because of the following logic. In case there is small entropy observed in the data, the geometric mean would make the final weight negligible in spite of opinions of experts. Consequently, as our purpose was to smoothen possible flaws of used methods, we chose the arithmetic mean, as it will reflect both the structure of data and opinions of experts.
Experts {E1, E8} were asked to fill in forms, stating weights of importance of criteria in percent, so that aggregate weights in a group of either criteria or categories make up 100%. The summary of opinions of eight experts used for the study on significance of weights is presented in
Table 2. Final weights, which are averages of weights of experts, are presented in the right-hand column of the table.
In order to gauge the level of concordance of opinions of experts, magnitudes of provided weights were ranked in order to apply the theory of concordance by Kendall [
20,
21,
22]. Such ranks we denoted as
eik, where
i = 1, 2, …,
m is the index for criteria (
m is 8 in our case), while
k = 1, 2, …,
r is the index to denote responded experts (
r—is also 8 in our case). The Kendall variable
W, which is used in the chi-squared test statistics for gauging the level of concordance, depends on the squared deviations of sums of all ranks
eik by all experts (1):
from the mean of such sums (2):
In the case when there are no equal ranks of criteria, Kendall variable
W equals the ratio between the sum S mentioned above, which is calculated by Formula (3):
and its largest deviation, denoted by
Smax, observed in the case of absolute concordance of opinions of experts, in terms of ranks of importance of criteria (4):
As we found eight sets of equal ranks within expert estimates, we use the adjusted formula for calculating Kendall’s variable [
23] (5):
where
φ denotes sets of equal ranks, and
tφ denotes the number of equal ranks within a set within
φ.
Chi-squared test statistics for this variable is the following (6):
for the number of degrees of freedom
. For the test statistics, we chose the level of significance α = 0.05. The critical level of
distribution for the chosen threshold and the number of degrees of freedom
is
. Calculations of the adjusted Kendall’s variable produced the result
W = 0.326, while test statistics for this result appeared to be beyond the critical threshold
, and we may reject the hypothesis that opinions of experts are non-concordant.
5. Weights Obtained Using Entropy
The method uses structure of data instead of eliciting perception of importance of each chosen criterion from experts. Nevertheless, we note that entropy may yield too high or too low differences between weights and a method of softening such influences is plausible to use, which will be described in the next section. For example, it was proposed in [
24,
25] to outweigh these effects by applying the CILOS weight estimation method instead of entropy based on criterion impact losses proposing the IDOCRIW method [
26,
27], a combination of two methods [
28,
29].
The degree of entropy,
Ei, for
i = 1, 2, …,
m for each criterion is calculated as follows (7):
where
are normalized values of the
i-th criterion for the
j-th alternative (8):
The degrees of variation,
di, i.e., non-normalized values of the weights determined by the entropy method, are calculated for each criterion (9):
Entropy weights
Wi are normalized values of
di calculated as follows (10):
Obtained entropy weights are presented in
Table 3:
Whenever there is a small dispersion between normalised values obtained using Formula (10), entropy weights appear to be small (e.g., the weight for the criterion 1), and vice versa; whenever there is a large dispersion between normalised values, entropy weights are large (e.g., the weight for the criterion 6).
6. A Combined COIN (COmpensating INfluences) Method of Obtaining Weights
The idea of the COIN method is suggested by the second author and is presented in this paper for the first time. It suggests comprising both ways of eliciting weights: from data by using the entropy method, and from experts that differ considerably. We will opt to choose average values between entropy weights
and weights elicited from experts
instead of the geometric mean as proposed in [
24,
30] (11):
where
are the ultimate weights obtained by the COIN method, which will be used in this paper for making evaluations.
The choice in favour of the average values is made because the geometric mean does not reflect the idea of compensating differences between considerably different methods and overestimates the influence of very small values. Consequently, the geometric mean would under-value such criteria as 1 and 3 where values obtained by the entropy method appear to be small, and where weights elicited from experts appeared to be considerable. Weights obtained using different methods are presented in
Table 4. Such weights equally reflect the structure of data and opinions of experts.
7. Evaluation Using MCDM Methods
In order to evaluate conditions of availability and growth of public infrastructure for electric vehicles in eighteen cities of Lithuania and to make conclusions on their progress and proposals on future opportunities, a multiple criteria evaluation was performed. The choice in favour of multiple criteria decision aid methods was determined both because of the structure of data [
31,
32] and clear necessity to comprise opinions of experts on how the city should develop [
33].
Statistical methods are useful only in such cases when data is appropriate and there is a sufficient number of entries, in our case sufficient number of alternatives. Moreover, data should be normally distributed. However, this is not the case: our data represents only 18 cities and is not suitable for statistical analysis due to a small scope of the data. Moreover, in our case, MCDM methods are perfectly suitable as the methods provide the result of quantitative evaluation of all alternatives, which are real (evaluation of the state in 18 cities in our case). Consequently, the methods reveal attractiveness in broad terms providing ranking of alternatives. Moreover, the methods also provide a powerful tool for analysis of causes of prominence and lagging of the alternatives.
The major idea of any MCDM method is to create a cumulative criterion for each alternative, reflecting the attractiveness of the alternative in quantitative terms, expressed in a single value related to each alternative. Such a cumulative criterion comprises both weights of importance of criteria chosen for evaluation (
Section 4,
Section 5 and
Section 6) and values criteria in a way that the more attractive alternative outranks a weaker alternative in case the cumulative criterion of this alternative appears to be larger. Several methods must be used, as there is no single best MCDM method that guarantees precision of evaluation. In the paper, we will use four different MCDM methods, as it appears to be a popular option used by researchers that use MCDM methods. Such an approach mitigates distortions, which inevitably are introduced by applying different types of normalisation [
34]. Each chosen MCDM method of the four has not only different, specific only to this method, principles and logic but also uses different types of normalisation, based on different principles. It is known that values of criteria could be normalized in many different ways; it should also be borne in mind that some MCDM methods use transformation proprietary for that method. Such an approach of integrating results obtained by different methods reduces discrepancies within the results.
We use the following MCDM methods: the EDAS (Evaluation Based on Distance from Average Solution) method was proposed in 2015; a very popular raw MCDM method SAW (Simple Additive Weighing); the TOPSIS (Technique for Order Preference by Similarity to an Ideal Solution) method as a popular contemporary method, and the PROMETHEE II (Preference Ranking Organisation Method for Enrichment Evaluation) method as the most thorough method, which performs pairwise comparison of all alternatives.
As mentioned above, choice of the methods was determined by the fact that they employ both different logic and normalisation. Even if the EDAS method uses a similar idea, as it was proposed in the TOPSIS method: to measure a distance of an alternative to be evaluated to a benchmark solution (or benchmark solutions as in the TOPSIS method), there is a considerable difference between the benchmarks used. In the TOPSIS method, artificial worst and best alternatives with normalised weighted coordinates are used, while the EDAS method uses the average artificially created benchmark solution “AV” and measures weighted sums of “positive” and “negative” distances. We note that proprietary normalisations for the two methods are different. The TOPSIS method uses the Euclidean distance, while the EDAS method uses summation of coordinates, and the sums are finally normalised. The SAW method also differs from the previous two methods by its logic even if some similarity with the EDAS method, in terms of the SAW using weighted sum of normalised values, could be observed. However, first, the EDAS normalises weighted sums at the final stage, while the SAW normalises each value. Second, normalisation for the SAW method is different: each value of the data was divided by the sum of values by each alternative. The PROMETHEE II method is found in the different class of MCDM methods as it uses pairwise comparison in all pairs of alternatives. In addition, instead of normalization, a preference function is used. Unlike the previous three methods, distances between coordinates are normalised instead of values of criteria or weighted sums. The authors believe that such a mixture of different normalisation formulae, as well as different MCDM approaches, will reduce discrepancies. Considering an MCDM method as a random variable, the average of solutions produced by random MCDM methods with different logic and normalisation should considerably reduce variance of the average estimation in accordance with the logic of statistical inference from a random sample similarly as it happens to the estimation of the mean of the population by taking a random sample.
In all MCDM methods, the same decision matrix is used. The matrices contain statistical data R = , which describe the objects being evaluated. Weights of criteria are denoted as (), , where is the number of criteria, and is the number of the evaluated objects or alternatives. All criteria in our case are maximizing. The larger is the value of a maximizing criterion, the better it is in terms of attractiveness; the smaller is the value of a minimizing criterion for an alternative, the more attractive it becomes.
8. Evaluation by the EDAS Method
The idea and prominence of the EDAS method are reflected in the name of the method. In contrast to the TOPSIS method, the EDAS method uses the solution with average values of criteria as benchmark solution “
AV” [
35,
36] (12):
At the next step, positive and negative distances from
AV are calculated for each alternative and each criterion as follows, separately for maximizing Labels (13) and (14) and minimizing criteria Labels (15) and (16):
At the next step, weights are incorporated to find
NSPj and
NSNj (17) and (18):
Finally, the cumulative criterion of the method is found by the Formula (19):
The results of the evaluation by the EDAS method using COIN weights from
Table 4 are presented in
Table 5.
9. Evaluation by the SAW Method
The method reflects the core idea of MCDM methods: it comprises both normalized values of criteria and weights by using a simple additive sum of both, by all criteria chosen [
37,
38] (20). This operation is performed for each considered alternative:
where
are normalized values of the
i-th criterion for the
j-th alternative, and
are weights of the
i-th criterion.
The cumulative criterion
Sj, similarly to all other MCDM methods considered in the paper, reflects attractiveness of each alternative by its magnitude: the larger is the criterion, the more attractive appears to be the alternative. Final values of the cumulative criterion
Sj are presented in
Table 6.
10. Evaluation by the TOPSIS Method
The TOPSIS method [
39,
40] is one of the most popular and interesting contemporary MCDM methods among researchers [
41]. The method uses the Euclidean proximity to the best and the worst hypothetical solutions [
42,
43]. The smaller is the distance to the best hypothetical solution, and the greater it is to the worst hypothetical solution, the greater appears the cumulative criterion of the method. The method requires a proprietary normalization of values of criteria [
44], in accordance with Formula (21):
Denote the best hypothetical alternative as
V*. It is found in accordance with the following Formula (22):
where
I1 is the set of indices of the maximizing criteria,
I2 is the set of indices of the minimizing criteria.
Denote the worst hypothetical alternative as
. It is found in accordance with the following Formula (23):
The Euclidean distance to the best and the worst alternatives is calculated in accordance to the following Formulas (24) and (25):
Such distances are used for finding the cumulative criterion of the method
(26). It becomes as close to 1 as the alternative is closer to the best hypothetical alternative while its distance to the worst hypothetical solution is as great as possible. Furthermore, in the case of the opposite, the cumulative solution approaches zero. The ranking of attractiveness of alternatives is based on values of the cumulative criterion of the method
(26) and is carried in decreasing order:
The results of the evaluation by the TOPSIS method using COIN weights (
Table 4) are presented in
Table 7:
11. Evaluation by the PROMETHEE II Method
The PROMETHEE II method [
45] uses some general ideas of MCDM framework; nevertheless, it discerns to a high extent from other MCDM methods. The preference functions of chosen shapes
(the shape is represented by the index
t) normalize values of criteria, or, more precisely, of differences
di between values of criteria in pairs (
Aj,
Ak) compared. The method compares all such pairs and creates a cumulative criterion based on such comparisons. Choice of parameters
q and
s enhances the evaluation by providing more options and has influence on the result [
34]. The cumulative criterion is calculated in two steps. First, for every alternative
and all remaining alternatives
, two inward and backward aggregated preference indices
and
are calculated in accordance with the following Formula (27):
by multiplication of values of preference function with weights, quite similar as in the SAW method.
shows the level of preference of the alternative
over
; conversely,
shows the level of preference of the alternative
over
. At the next step, positive and negative outranking flows are calculated by summing inward and backward aggregated preference indices over all alternatives (28) and (29):
The positive flow comprises only magnitudes of preference of a chosen alternative relative to all other alternatives otherwise including nil values, while the negative flow comprises only magnitudes of outranking of other alternatives over the chosen alternative
. The larger is
and the smaller is
the better alternative is evaluated. The cumulative criterion incorporates both flows (30):
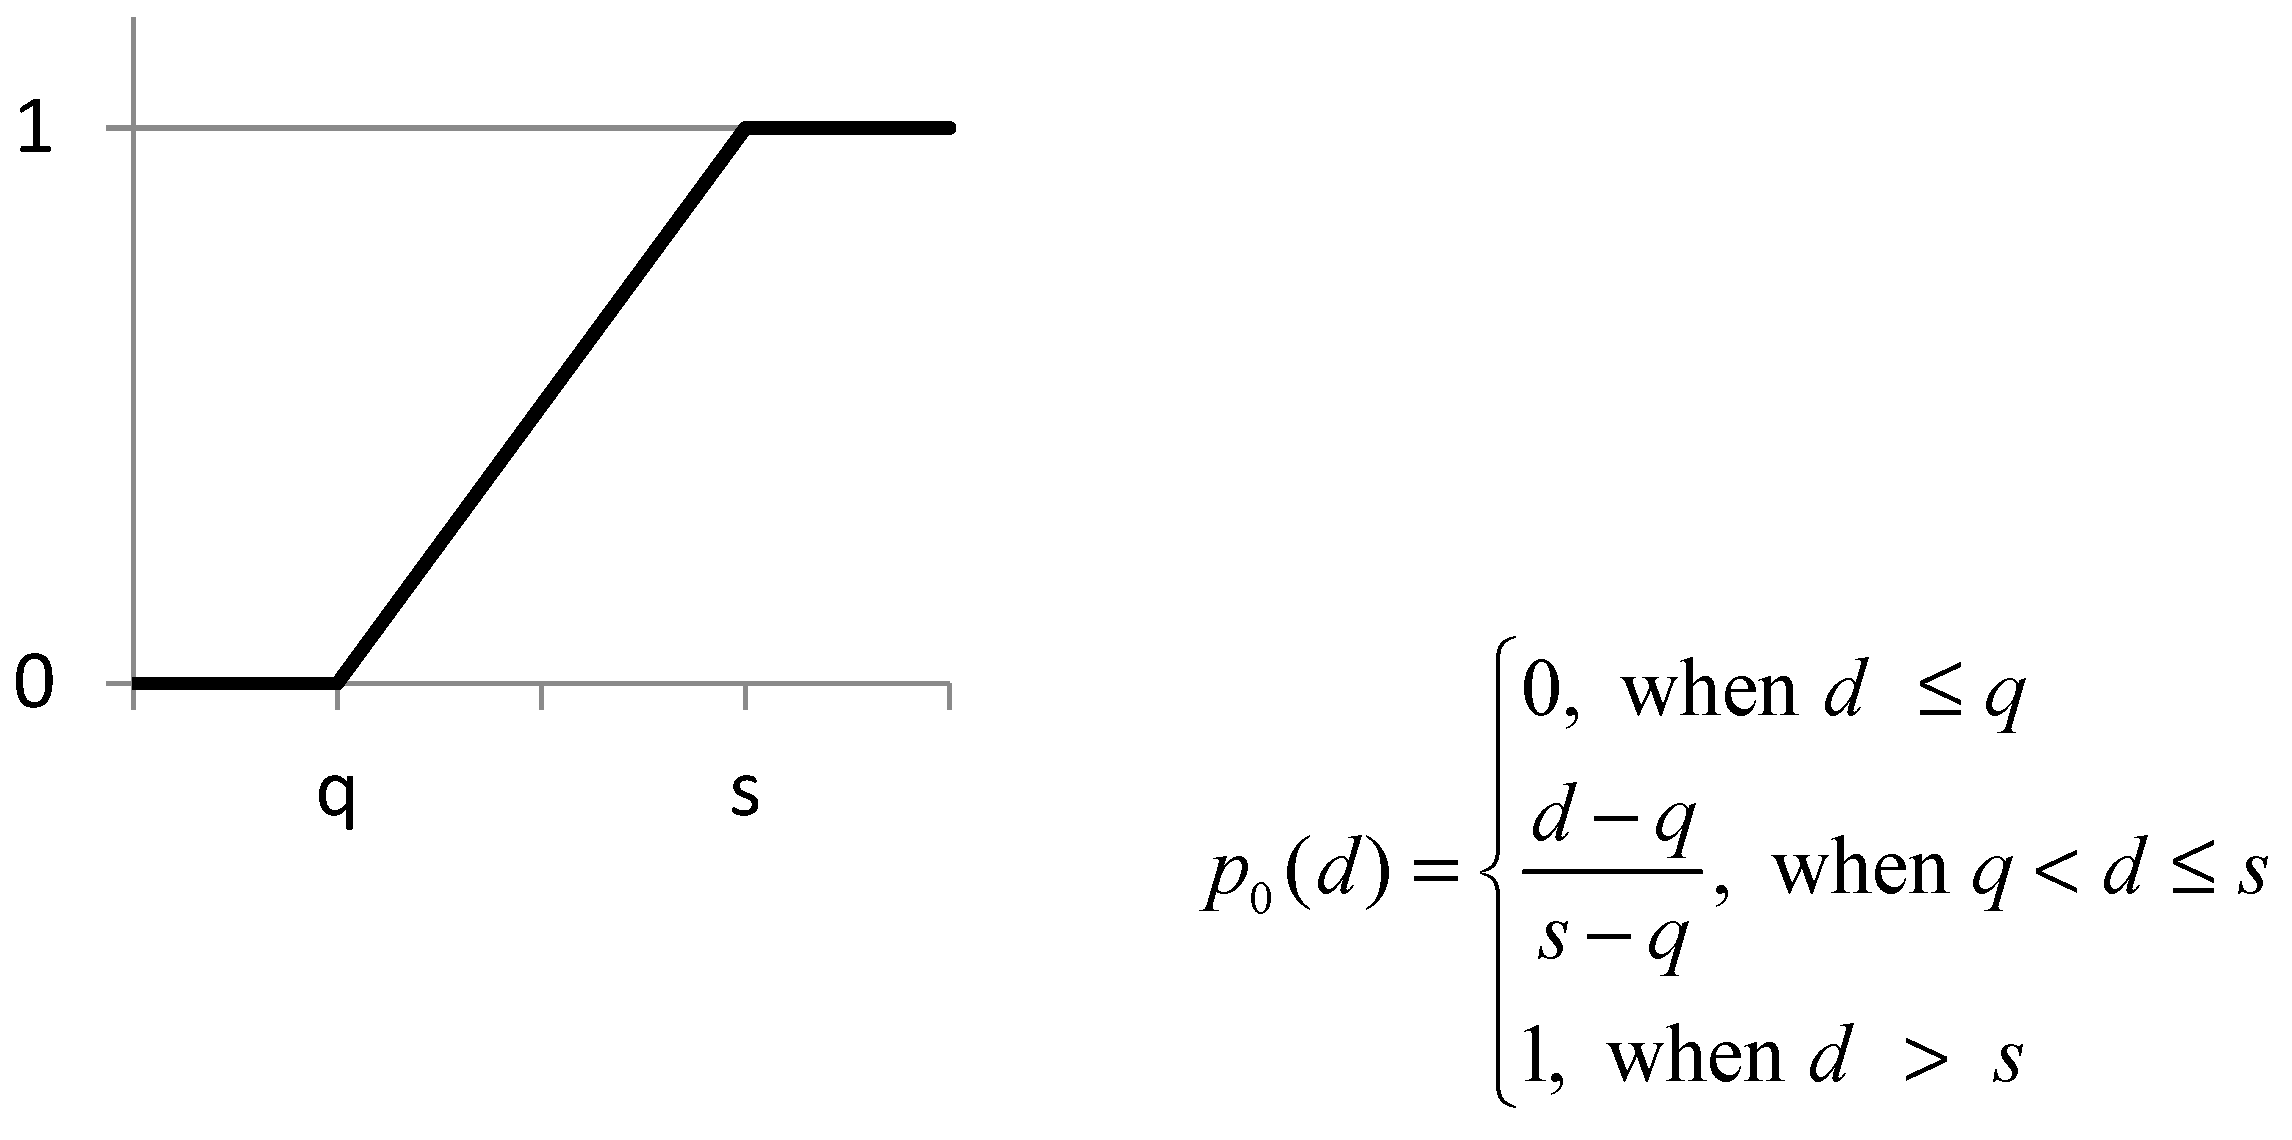
We chose the following preference function
(
Figure 2), which linearly maps differences between values of criteria:
The result of the evaluation by the PROMETHEE II method using COIN weights (
Table 4) is presented in
Table 8:
12. Results
For the purpose of increasing reliability of the evaluation, we combine results obtained by four MCDM methods similarly as in [
22,
42]. First, averages of obtained rankings by all the four MCDM methods presented in
Table 5,
Table 6,
Table 7 and
Table 8 are calculated. Second, final rankings are found based on the averages calculated at the previous step. Such rankings are presented in
Table 9. For the purpose of increasing descriptiveness, some other augmented reporting tools to decision-makers are recommended to be used.
Correlation between aggregate criteria of the multiple criteria methods used in the paper appeared to be high. Test statistics for correlation coefficients between all groups of methods appeared to be well above the critical value tcr = 2.120 for the t-distribution for 16 degrees of freedom at the chosen 5% level of significance. Namely, the correlation coefficient between TOPSIS and SAW: 0.990 (test statistics 28.57 > 2.120); between TOPSIS and EDAS: 0.972 (test statistics 16.60 > 2.120); between SAW and EDAS: 0.973 (test statistics 16.98 > 2.120); between TOPSIS and PROMETHEE: 0.998 (test statistics 67.06 > 2.120); between EDAS and PROMETHEE: 0.973 (test statistics 16.72 > 2.120); and between SAW and PROMETHEE: 0.992 (test statistics 30.96 > 2.120) appeared to reveal a high degree of correlation.
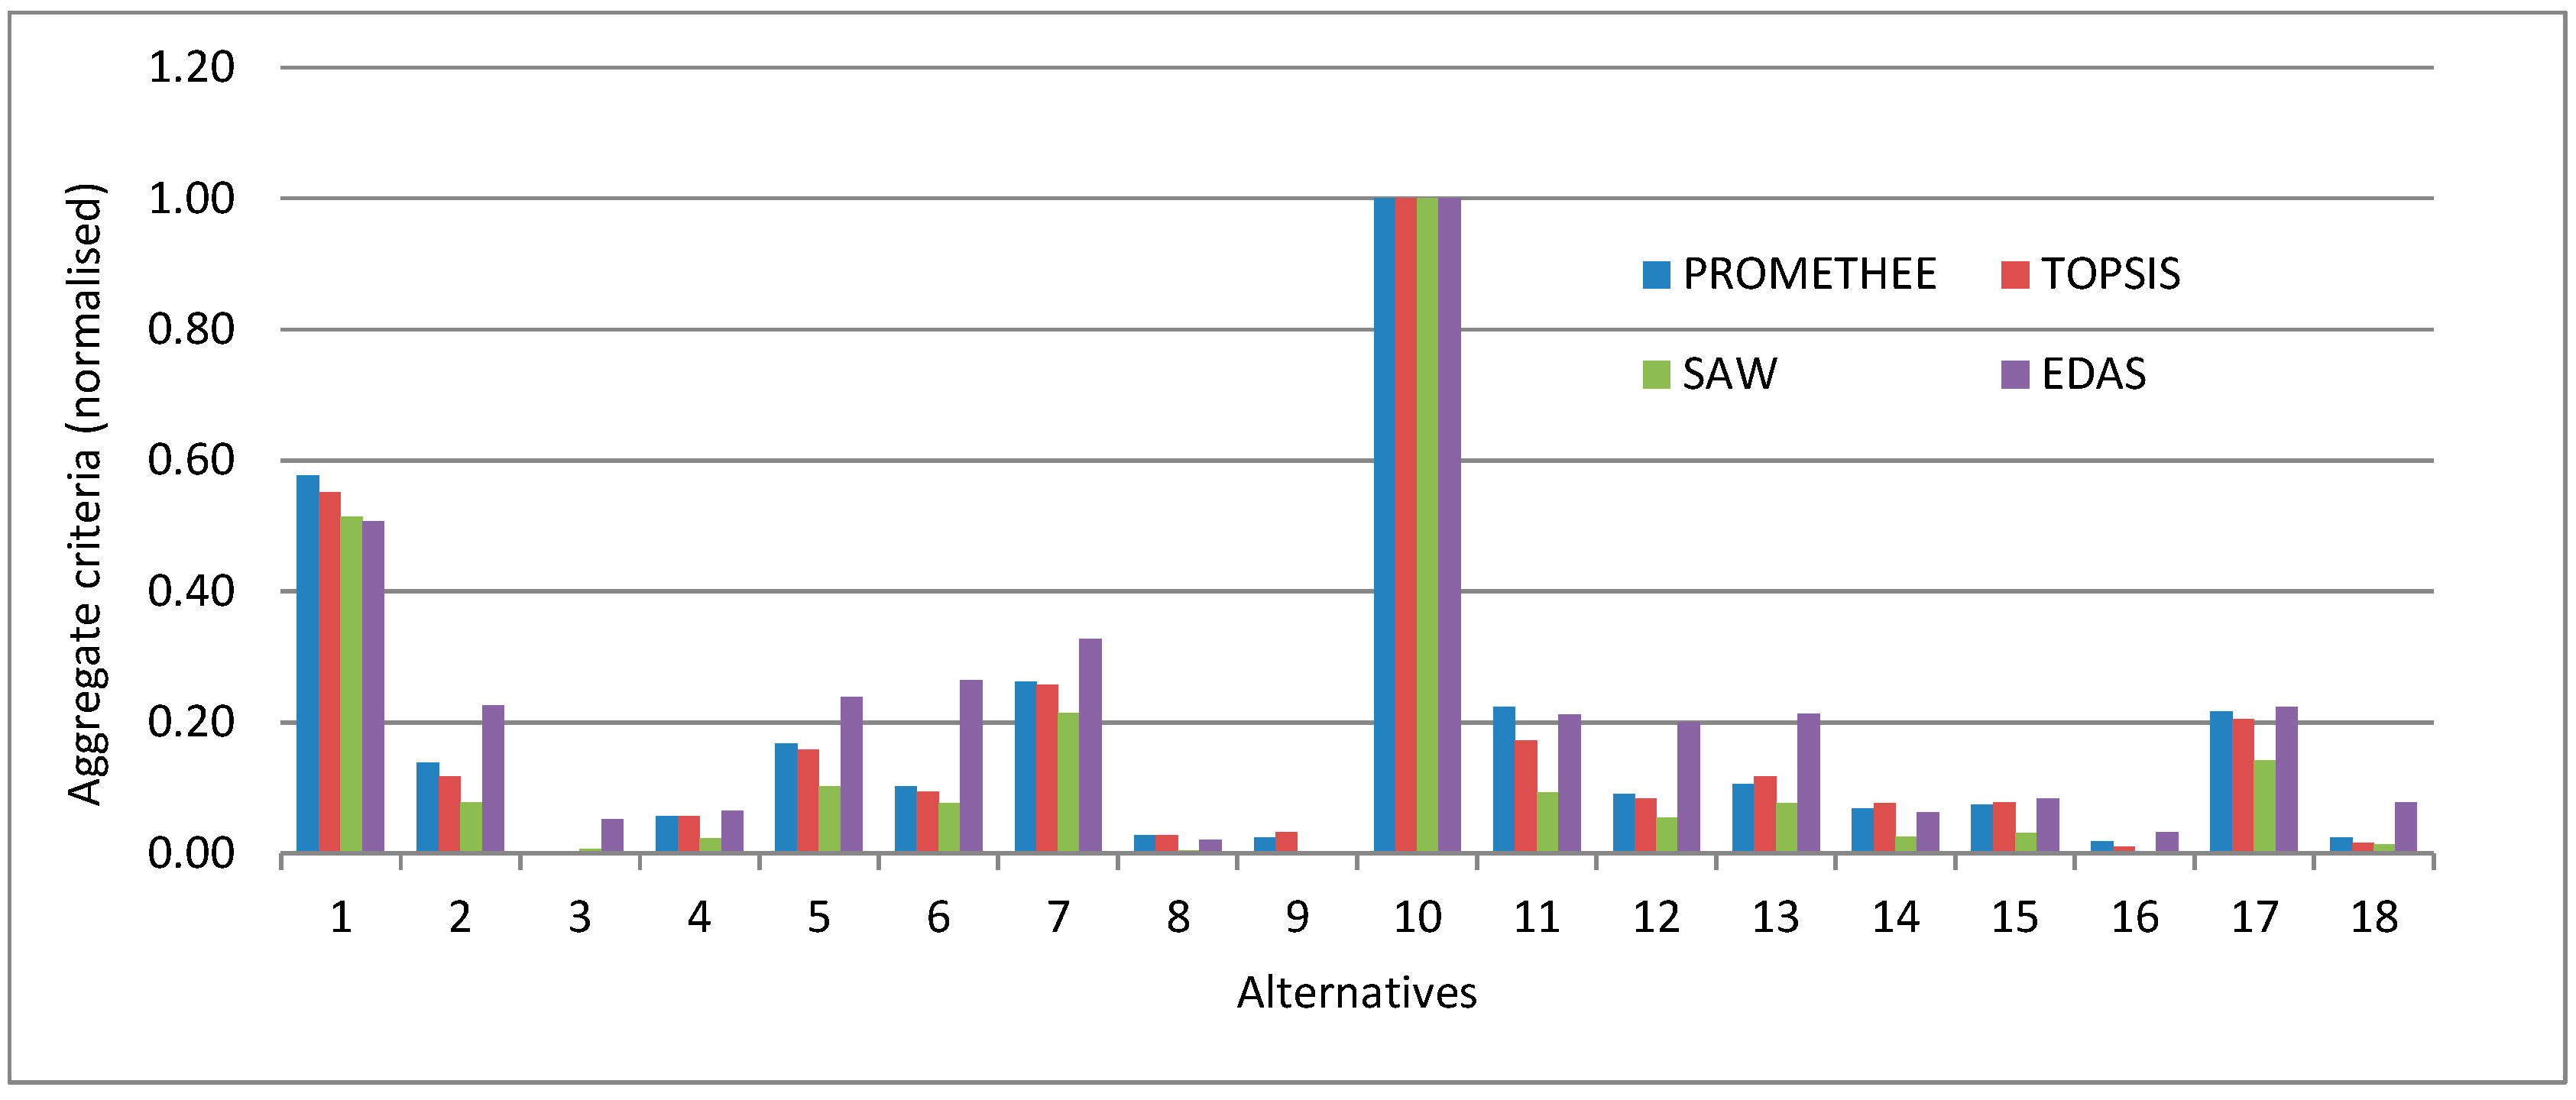
Normalised values of aggregate criteria of all four methods for 18 alternatives are presented in
Figure 3.
The formula of normalisation is as follows (31):
where
f is the index representing a method of evaluation (ranging from 1 to 4);
Kf are values of the aggregate criteria of a method
f;
are normalized values of the aggregate criteria of a method
f.
It can be observed that results among the methods are related.
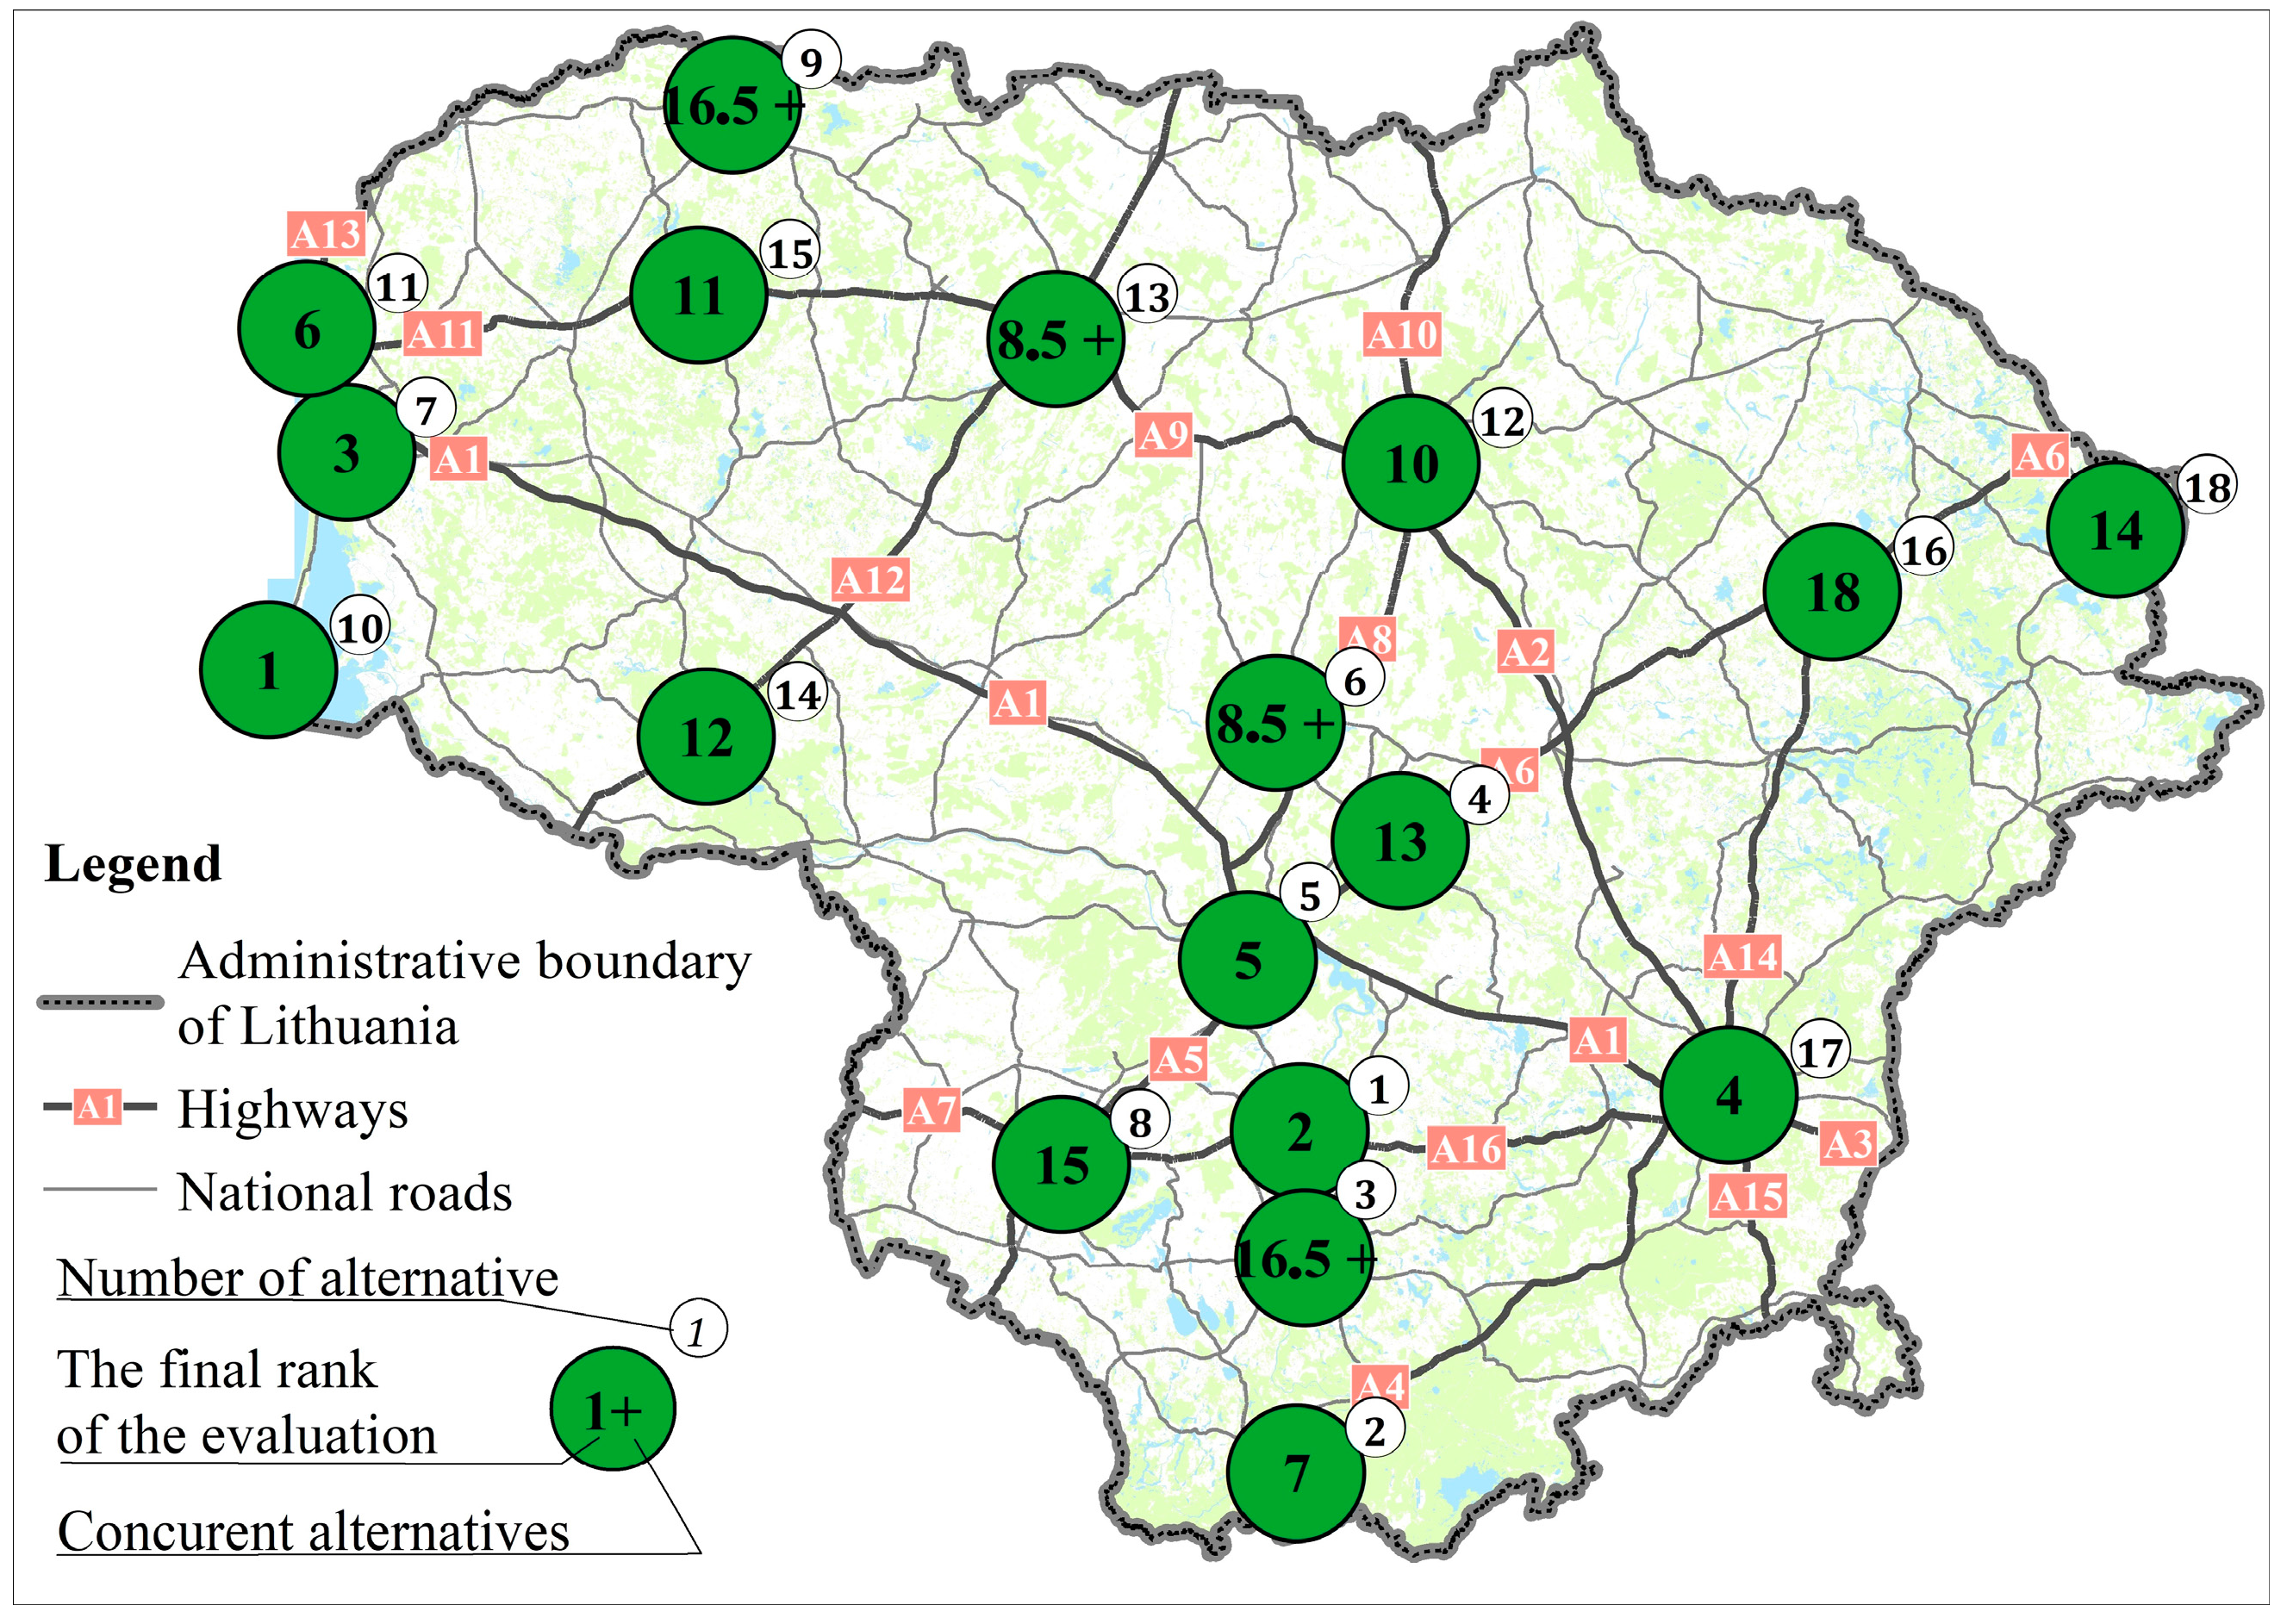
In
Figure 4, relative positions of attractiveness of cities and resorts of Lithuania in terms of the public infrastructure for electric vehicles can be observed, where final ranks obtained by the evaluation are depicted. The ranks resulted after comprising both data reflecting the state at every place as well as opinions of experts on importance of criteria of evaluation.
13. Conclusions
Evaluation of public infrastructure for electric vehicles in cities and resorts of Lithuania revealed that the highest positions are currently attained by resorts. Namely, Neringa attained the 1st place; Birštonas—the 2nd place; Palanga the 6th place, and Druskininkai the 7th place. It could be concluded that, in general, that cities are lagging behind and require additional investment. We also point out the importance of private investment for the listed resorts as the corresponding factor “Investment of private institutions to the infrastructure for electric vehicles” has the largest weight of 0.227. Only Neringa may be distinguished by good scores in terms of said factor.
More uniform development of infrastructure would ensure attractiveness of electric vehicles among citizens of Lithuania. Extension of facilities for electric vehicles in lagging cities, among which only Klaipėda and Vilnius have good positions (the 3rd and the 5th positions, respectively), is required. Other cities are lacking streets with the dedicated A lane; development of electric charging posts; investment of both state and private institutions to the infrastructure for electric vehicles; integrated electric vehicle infrastructure development projects; installation of high-power charge posts on roads of national importance within 50 km distance from major city center. Such development would make a significant contribution to reduction of ecological effect in towns, namely, lowering air pollution, noise levels and greenhouse gas emissions in cities.
A combination of techniques used for estimation of weights is used in the paper. Two sources for such estimation were used: experts and data itself. Opinions of experts were estimated in terms of their concordance based on ranks of importance of criteria, using Kendall theory. A balancing combination of experts’ estimations of weights and of the entropy weights, the method COIN, was proposed.
Four considerably different MCDM methods were used in the paper. The SAW method comprises normalized values of criteria multiplied by weights into the aggregate criterion of the method, the TOPSIS uses distances in the m-dimensional space (where m is the number of criteria) to the hypothetical worst and best alternatives, the EDAS method uses distances of each criterion from its average value, and the PROMETHEE II method makes pairwise comparison in all pairs of alternatives also by using a special type of normalization by applying a preference function. Such a combination of intrinsically different methods enhanced reliability of results. Especially it was observed in our case, when test statistics for correlation coefficients between all groups of methods appeared to be well above the critical value tcr = 2.120 for the t-distribution for 16 degrees of freedom at the chosen 5% level of significance. Namely, the correlation coefficient between TOPSIS and SAW: 0.990 (test statistics 28.57 > 2.120); between TOPSIS and EDAS: 0.972 (test statistics 16.60 > 2.120); between SAW and EDAS: 0.973 (test statistics 16.98 > 2.120); between TOPSIS and PROMETHEE: 0.998 (test statistics 67.06 > 2.120); between EDAS and PROMETHEE: 0.973 (test statistics 16.72 > 2.120); and between SAW and PROMETHEE: 0.992 (test statistics 30.96 > 2.120) appeared to reveal a high degree of correlation. Thus, we can be more confident in the obtained results.
The research carried out shows that the current promotion measures for the development of Lithuanian electric vehicles access infrastructure need to be reviewed since most of the funds for the development of electric vehicle‘s access infrastructure are directed to the big cities of Lithuania. For making infrastructure for electric vehicles uniform within the country, incentives should be directed to resort cities. For the purpose of implementing the development plan of the infrastructure for electric vehicles in Lithuania and achieving more coordinated distribution of incentives between municipalities, the model of MCDM evaluation is presented in this paper, which could be used by interested institutions. The theoretical model can be easily used in reality, which would provide suitable conditions for the development of electric vehicle access infrastructure in cities of different municipalities all around the country.


