Article

Energy-Saving Potential and an Economic Feasibility Analysis for an Arctic Route between Shanghai and Rotterdam: Case Study from China’s Largest Container Sea Freight Operator

1
College of Transport and Communications, Shanghai Maritime University, Shanghai 201306, China
2
Institute of Transportation Studies, University of California Davis, Davis, CA 95616, USA
3
Institute of Logistics Science & Engineering, Shanghai Maritime University, Shanghai 201306, China
*
Author to whom correspondence should be addressed.
Sustainability 2018, 10(4), 921; https://doi.org/10.3390/su10040921
Submission received: 12 February 2018 / Revised: 14 March 2018 / Accepted: 20 March 2018 / Published: 22 March 2018
(This article belongs to the Section Sustainable Transportation)

Abstract

:
Global warming has significantly reduced summer ice coverage in the Arctic region, providing long-awaited opportunities for the shipping industry to open new routes through a region known for its harsh navigational conditions. If a shortcut between Asia and Europe via the Northern Sea Route (NSR) is adopted, significant energy saving and pollution reduction are possible compared with conventional southern routes. However, opinions in literature differ regarding this shortcut’s economic viability. We present an analysis from the perspective of COSCO, China’s largest container sea freight operator. We perform a cost–benefit analysis under several scenarios considering the following current realities: (1) declining oil prices not seen for decades, even lower than the lowest prices assumed in previous studies; (2) declining Russian NSR tariff as an effort to attract shipping traffic; (3) possible emission control areas along a northern route may require much cleaner energy and thus impact costs not studied in previous models; and (4) the capital cost difference between a hired and a self-owned vessel. Classical case studies of shipping routes between Shanghai and Rotterdam are adopted for comparison. We explain how different factors impact the shipping costs and to what extent can the NSR be economically viable. Occasional usage of NSR (e.g., one time transit) is unlikely to be more profitable given the higher unit transportation cost, but the route could be economically competitive in terms of the total profits earned for continuous usage. A more aggressive scenario which requires ships on the NSR to switch to much cleaner fuel would erode this route’s competitiveness, but extra environmental benefits should be taken into consideration if future carbon emission trading schemes include the shipping industry.

1. Introduction

Exploration of marine transportation networks via the Arctic started centuries ago [1]. However, commercial navigation there remains rare and economically unviable due to operational challenges in this ice-covered region. In 2009, two German cargo ships were the first to successfully complete a commercial voyage from South Korea to the Netherlands, bypassing the Artic coastline instead of conventional transit through the southerly routes (e.g., the Suez Canal), thereby reducing the trip’s distance by approximately 5000 km [2]. The Northern Sea Route (NSR) shortcut between Asia and Europe via the Arctic, largely attributed to global warming and the subsequent ice retreat, can have a profound impact on the world’s shipping landscape because of the potential for energy cost savings [3]. An estimated 5% of the world’s future shipping trade could be rerouted through the NSR by 2030 [4].
Typically, there are three shipping shortcuts through the Arctic region: NSR, Northwest Passage (NWP), and a future Transpolar Sea Route (TSR). The NSR lies within Russia’s exclusive economic zone and runs through the Bering Strait to the Kara Sea. Separately, the Northwest Passage (NWP) is a series of connecting routes from the Arctic Ocean through the Pacific Ocean to the Canadian Arctic Archipelago. The TSR largely lies in international high seas and runs from the Atlantic to the Pacific Oceans across the Arctic center. Compared with the NSR, navigation in the NWP is much harsher due to complicated waterways, hostile weather, and thick ice conditions [5]. Reflected by real shipping traffic recorded by the automatic identification system (AIS), while the number of annual NSR transits is in double digits, the NWP is at best sporadically transited by merely one or two ships [6] and seems unlikely to be “a viable shipping route for several decades to come” [7].
From an economic and strategic perspective, Russia and China, the two key stakeholders, can greatly benefit from the NSR shortcut. As Russia’s interest in Arctic governance grows [8], it has issued an array of strategic plans for the social and economic development of the Arctic zone, including the Russian Federation Policy for the Arctic to 2020 [9] and the Energy Strategy of Russia for the period up to 2030 [10]. Russian maritime authorities have since then devoted much effort toward the NSR with the hope of upgrading the transportation infrastructure across the region in order to attract shipping activities and export raw materials, thus stimulating regional economic growth [11].
On the other hand, China views Arctic shipping as an important element in its Belt and Road Initiative [12]. The nation’s Vision for Maritime Cooperation under the Belt and Road Initiative reflects China’s ambition to utilize the NSR because these routes can not only reduce Sino-EU shipment costs, thus stimulating economic growth that largely favors China [4], but can also reduce China’s dependence on the conventional southerly routes (notably, the Malaccan Straits) for energy transports [13]. In addition, because of potential traffic shifts, China’s high-latitude shipping ports have an opportunity to become international shipping centers for East Asia.
China COSCO Shipping, the world’s fourth largest container sea freight operator after Maersk Line, Mediterranean Shipping Company, and CMA CGM [14], transited the NSR for the first time in 2013 with a multi-purpose cargo ship named the Yong Sheng. In 2016, five more COSCO vessels sailed through the icy route, with an ultimate goal of opening a new route to form a circum-Arctic economic circle [15]. This prompted industrial observers to wonder “when” the NSR between China and Europe would become operational rather than “if” it would be operational.
If a shortcut between Asia and Europe via the NSR is adopted, significant energy saving and pollutant reduction are expected compared with conventional southerly transit. However, the literature presents differing views on whether this shortcut is economically viable. Many shipping companies are concerned that Arctic shipping might not be profitable [16].
In this paper, we present our analysis from the perspective of COSCO, China’s largest container sea freight operator. Using partial information from previous studies, we take into account the latest industrial realities:
(1)
Oil prices lower than in the previous several decades (summer intermediate fuel oil (IF0380) costs only of about 266 USD/ton), which is not even included in the lowest price ranges of previous studies;
(2)
Declining Russian NSR tariff because of the Russian ambition to attract traffic and to stimulate regional port activities;
(3)
The impact of emission control areas (ECAs), where stringent regulations could be established to mitigate the impact of pollution along the route, which may require much cleaner energy, thus impacting costs not tapped in previous models;
(4)
The difference in capital costs between a rented and a self-owned vessel, which could impact a sensitivity analysis. Specifically, a self-owned ship has smaller capital costs, giving the shipping companies potential leverage in response to the other changing cost factors.
For comparison purposes, we use classical case studies on shipping routes between Shanghai and Rotterdam to explain how different factors affect shipping costs and to what extent can the NSR be economically viable.

2. Literature Review

Arpiainen and Killi [17] estimated the cost of container freight transport between Alaska and Iceland, excluding the NSR fee. Liu and Kronbak [18] used a case study of 4300-TEU container ships to study the comparative costs of using the NSR versus the Suez Canal Route (SCR). They argued that a 40% reduction in distance does not mean a reduction in operational cost by 40% and found that the ice-breaking fee was a key factor hindering shipping through the NSR. Schøyen and Bråthen [19], who studied shipment costs for Narvik–Qingdao and Porsgrunn–Shekou, concluded that the NSR could be profitable for bulk trades. They also argued that because of concerns about schedule reliability, bulk shipping is more suitable compared with liner service via the NSR.
Using routes between Rotterdam–Shanghai and Rotterdam–Yokohama, Lasserre [20], through a cost analysis, concluded that load factor is a key factor that impacts the potential competitiveness of the NSR. He further argued that among all cost components, the high NSR transit fee is a major factor limiting the profitability of the Arctic sea routes. Shanghai routes are unlikely to be profitable. Wang commented on this research and argued that “time value” could be considered in the analysis [21]. But “time value” is an opportunity cost that is not considered in the current accounting protocols and shipping companies do not use this approach. Lasserre later wrote a rebuttal letter (which we agree with) that explains why this concept is not suitable in cost and benefit analysis [22].
Cariou and Faury [23] found that fuel savings alone in the NSR are not large enough but internalizing the environmental benefits could slightly enhance the competitiveness of the NSR. They also [24] performed a simulation using a Panamax tanker, comparing the NSR and SCR; they further found that the NSR can save costs and transit time between August and November.
A number of Chinese scholars have been researching the cost–benefit analysis of Arctic routes. Li [25] emphasized that issues related to Arctic sea routes are interdisciplinary, comprehensive, dynamic, and complicated, involving geography, economics, politics, and traffic engineering. Li et al. [26] further conducted a case study using Shanghai–Rotterdam container transport as an example. They argued that due to the waterways’ hydrological constraints, a medium-sized container ship is preferred for the NSR. Therefore, they chose a 4100-TEU ship with a three-month transit window for this study. Because more ports were visited during the designed routes, including the ports of Busan, Vladivostok, Murmansk, and Hamburger, Li et al. [26] used a full load factor to perform calculations and concluded that the NSR was very competitive from a profitability perspective.
Zhang et al. [27] calculated maritime mileage and costs of future Arctic shipping for China and analyzed its impact on China’s international trade and coastal economic development. Their analysis showed that by 2020, if the Arctic routes are fully opened and the traditional routes replaced with the Arctic ones, shipping costs between $53.3 billion and $127.4 billion can be saved each year in international trade.

3. Methods

A classical cost–benefit analysis of a shipping route needs to incorporate three major costs: capital costs, operational costs, and voyage costs [28]. However, different assumptions of the parameters used in different models would lead to completely different results. Among the 26 models reviewed in [20], only 13 explicitly concluded that Arctic routes can be profitable. Lasserre himself concluded that the competitiveness of container transport via the NSR between Shanghai and Rotterdam would only be marginally profitable because of high Russian transit fees and a low load factor [20].
In this paper, we conduct an updated cost–benefit analysis using the latest publicly available data and operational data provided by COSCO’s management, some of which differ from previous assumptions, to compare the competitiveness of container transport via the NSR and the traditional Suez Canal route between Shanghai and Rotterdam. Publicly available data include route distance, fuel prices, freight rates etc. Operational data such as labor costs, insurance premiums, and harbor dues are provided by COSCO’s management; they are not publicly available. We then calculate the energy-saving and GHG-cutting potential for each round-trip voyage.
The parameters and data we use are listed in Table 1, with references and notes about how they are chosen. Additional explanations regarding the cost structure are provided in the rest of this section.
Our scenario models a post-Panama containership with a loading capacity of 5089 TEU, to serve both routes based on traditional Eurasian shipping lines. For the NSR, the containership needs to meet a Polar Class 7 standard, suitable for navigating in summer/autumn the thin ices of the current year or the interlayer ices of previous years, that complies with the requirements for maritime operations in polar water of the International Association of Classification Societies. A ship with ice-breaking capacity is more expensive due to its thicker hull and extra structural support.
Capital Costs. In an accounting system, capital costs can be calculated in two ways. Whether the ship is hired or owned is a strategic decision for shipping companies that could significantly affect their annual capital cost; in our case, this is to the tune of over 1 million USD. The 24-year straight-line depreciation (a depreciation protocol adopted by COSCO to comply with Chinese accounting rules) for self-owned assets and the hire rate for vessels and equipment are both adopted to calculate the capital cost. Since either is possible during real business operations, both situations are considered in our model.
While some studies carried out a year-round navigation simulation for comparison, we chose a more realistic five-month navigation window considering the current global climate model simulation results [29] as well as the historic transit data compiled from AIS [6]. The baseline scenario is a transit between Shanghai and Rotterdam from 1 June to 31 October (153 days) with the same number of calling ports.
We agree with Li’s suggestions that adding more ports on the NSR can significantly improve the load factor [26]. In the route design, we adopt COSCO’s classical Asia-Euro Express Service (AEX) routes by adding the ports of Ningbo, Pusan, Felixstowe, and Hamburg for the NSR and Ningbo, Shenzhen, Felixstowe, Hamburg, and Hong Kong for the SCR (See Figure 1). Considering the time-saving competitiveness, the load factor of the NSR could be even higher than of the SCR. However, for a conservative estimate, we lowered the load factor (by deducting five percentage points compared with the SCR) for the NSR.
Operational Costs. Operational costs include crew wages, maintenance, insurance premium, and administrative costs. The NSR is more expensive in terms of operation costs because the operation involves skilled staff and extra risks in icy water. Another significant difference is in terms of the insurance premium, which is composed of hull and machinery (H&M) insurance and protection and indemnity (P&I) insurance [30]. H&M usually covers losses or damage to the vessel caused by perils such as grounding, collision, fire, and explosion, while P&I covers third-party risks for damage caused to cargo and environmental damage such as oil spills. The factors that affect the rates include the specific routes, ship conditions, cargo type, and the insurance buyers’ reputation [31]. It should be noted that insurance premiums can be negotiated between policy underwriters and shipping companies. We use current market rates (H&M rate: 1.4%, P&I rate: 1.7%) provided by COSCO to calculate the SCR’s insurance premium. Because no consensus exists about insurance rates for Arctic sea routes, we assumed that insurance premium for the NSR was 50% higher than that for the SCR, in line with previous studies [20].
Voyage Costs. Voyage costs are directly affected by the shipping routes and the duration. They typically include fuel costs (including heavy fuel oil and diesel oil), port dues (including pilotage, towage, berth, etc.), and the Russian NSR tariff or the Suez Canal transit fees.
Fuel cost is directly impacted by fuel consumption, which depends on the engine power used at a given speed [32]. While ships can adopt the slow-steaming strategy to save fuel, a slower speed will increase the voyage time, which, in turn, could decrease the total revenue and increase other costs such as costs related to depreciation and labor [33]. Research has estimated speeds in the range of 14–25 knots as being economical [34]. We use an average speed of 14 knots within NSR core routes (between Cape Zhelaniya and Cape Dezhnev, as defined by the NSR administration) and 20 knots for outside the NSR and SCR. Our navigation window spans between May-Oct and we opt to use Lasserre’s choice of speeds for parallel comparison [20].
Fuel consumption at different speeds for a 5000-TEU class was calculated based on empirical results from [32]. Our model also considers an additional 10 tons/day of marine gas oil (MGO) consumed by auxiliary engines to drive generators during berthing. As all models are prone to simplifications, we follow the approaches of previous studies and do not precisely consider the effect of loose but dense ice in summer on fuel consumption due to a lack of data, but we do add 8% more fuel consumption on the NSR route due to heavier hulls to break the ice [20].
Our analysis include data about existing ECAs on these two routes to consider the costs of using much cleaner fuels so that airborne pollutants, mainly of SOx and NOx, can be reduced [35]. The more expensive MGO is usually required when sailing in these regions unless the ships are equipped with costly scrubbers to filter the exhaust gas so that the sulfur content is within the limit of 1000 ppm [36]. There is growing concern about the use of dirty bunker fuel in the Arctic region because it exacerbates Arctic warming, and strong calls for cleaner fuel regulations exist [37,38]. In view of this concern, we develop a second scenario in our model, which includes all NSR core routes as potential ECAs so that only MGO is allowed. It should be noted, however, that the usage of MGO is not a final solution, but a more accessible alternative right now because while lower sulphur fuels can reduce black carbon emissions linked with warming effects [39], they can simultaneously reduce radiative cooling from ship aerosols [40].
The Russian NSR tariff or the Suez Canal transit fees are important cost factors when calculating voyage costs. Before 2003, the Russian NSR tariff was subsidized by authorities for ice-breaking aid, but it was then raised to an average of 23 USD per ton of cargo [18]. Taking into account the Russian government’s intent in making the Arctic sea routes more competitive, that rate has been constantly adjusted [41]. Starting in July 2017, the Russian NSR administration adopted a much simpler toll calculation (similar to the Suez Canal transit fees) to calculate the fee, and ship owners can get an official tariff quotation by simply entering the gross tonnage (GT) of the ship, the zones the ship intends to sail through, the ice-breaking class, and the expected time of sailing (see Figure 2).
GT is a unitless index that measures the ship’s overall internal volume; the numerical value of the GT should not be confused with the weight (unit: ton) or volume (unit: cubic meters) measures. The use of this index ensures that the tariff rate is not impacted by the actual weight of the goods carried but by the ship’s fixed transporting capacity characterized by this unitless index. In our case, the GT is 54,005, and a one-way transit through seven zones in a summer–autumn season yields a transit fee of 2.4 million rubles (42,672 USD). COSCO mentions that not all zones require ice-breaking aid (in the Yong Sheng transit case, only 4–5 zones need ice-breaking aid). If four zones require ice-breaking aid, this could result in a lower transit fee of around 19.3 million rubles (around 328,188 USD).
As confirmed by Sinha and Bekkevold [42], “What had been compulsory rates now became maximum rates, i.e., the fees had become officially negotiable”. The bargaining power of each shipping company is different, and the exact transit fees are not transparent to the public. We believe that a commitment to using the NSR can gain a much favorable discount for the shipping company. Lasserre assumed a 78.7% discount in his analysis [20], while we only adopt a moderate 20% discount for frequent usage in our model. Further uncertainties on the NSR transit fees have been explained in a sensitivity analysis in Table 2. By comparison, navigation tolls via the SCR, using the Toll Calculator from suezcanal.gov. e.g., charged $250,969.

4. Results and Discussion

The cost analysis is separated into two categories (i.e., a ship is either hired or self-owned). We also design two scenarios (I and II) for a current ECA and its future possible expansion where fuel change must be performed to satisfy the emission regulations, that is, from IFO380 to MGO. Scenario II assumes that the NSR might be brought into the ECA in the future, meaning that IFO380 would not be allowed in these areas, which would only affect our NSR cost estimations.
The geological distance for a round trip via the NSR is 23.4% shorter, but it does not translate into proportional time savings as well as cost savings. A round-trip loop via the NSR from Shanghai to Rotterdam takes about 50 days considering port stops and costs about 1.13 million USD, while the loop via SCR requires about 60 days and costs about 1.5 million USD.
In terms of the five-month navigation time window, a ship can perform 3 full loops via the NSR compared with 2.5 loops via the SCR. For similar load factors for both routes, NSR route could possibly enable more shipments in a given time. Our model estimates that in the five-month window, 21,222 TEU can be transported via the NSR versus 19,764 TEU via the SCR. Further load factor uncertainties will be explained in a later sensitivity analysis.
Fuel cost is expectedly the dominant cost factor (Figure 3). For a hired vessel, fuel costs account for 32% of total costs under the NSR compared with 40% under the SCR. Capital costs come next for the SCR route, but they rank third for the NSR (18% for the NSR versus 17% for the SCR); the two other significant cost factors are marine insurance and transit tariffs and tolls. Via the NSR, marine insurance costs are even higher compared with the NSR transit fee, suggesting that future cost savings could come from this important source. How shipping companies negotiate this cost is important.
Unit transportation cost for the NSR exceeds that for the SCR due to a lower load factor we set. For a hired vessel, the average cost per TEU is 501.13 USD for the NSR versus 480.24 USD for the SCR. If the ship is self-owned, the average cost per TEU is 447.22 USD for the NSR versus 430.96 USD for the SCR. Scenario II yields even higher costs for the NSR because of the much cleaner fuel required for icy waters. The cost difference between these two scenarios is within the range of 3–8%.
In our baseline Scenario I, occasional usage of NSR (e.g., one time transit) is unlikely to be more profitable compared with the SCR given the higher unit transportation cost involved. But the NSR is not economically disadvantaged compared with the SCR in terms of total profits for the five-month navigation window; it could also be a more competitive alternative route as some parameters used in our model become more favorable to the shipping companies as revised by our sensitivity analysis (see Table 2).
Due to one more eastbound shipment in the five-month navigation window, the total revenue of NSR is higher (19.5 million USD for the NSR versus 18.2 million USD for the SCR). After deducting costs, for either a self-owned or a hired ship, under current market conditions in Scenario I, total profit on the NSR could be up to 370,440 USD or higher. However, under Scenario II, NSR total profits will be eroded because of the higher fuel costs linked with the use of much cleaner fuel. For a hired vessel, total profits using NSR could be 177,830 USD lower compared with using the SCR. While Scenario II is unlikely to happen soon, shipping companies should be aware that higher fuel emission standards in the Arctic region could diminish their competitiveness. As previously mentioned, the shipping companies should also be informed that using MGO under Scenario II encompasses industrial actions toward a much cleaner transport in the Artic system, but it is not a final solution. Further impact assessments of the Artic routes should be carried out to understand the unnoticed externalities [43].
The shipping industry currently benefits from declining crude oil prices due to increased oil production; IFO380 costs round 266 USD (three years’ average), while previous studies usually used a baseline price of around 600 USD. Any further increase in the fuel price will contribute to increased competitiveness for the NSR in terms of total profits, and this is at high odds because the industry is currently transitioning to a marine fuel with a 0.5% sulfur cap. The cost of this grade of fuel is between that of IFO380 and MGO.
Insurance premiums can fluctuate ad hoc, depending on ship type, age, past record of compliance with international laws, current operational standards, operational zones, and even the ship owner’s bargaining power with the insurance company. Better infrastructural and navigational conditions, combined with a well-formulated emergency response mechanism in Russia, could lead to a reduced premium rate [44]. Even a 10% cut in the premium rate could have a significant effect on the total profit that favors the NSR. However, by the same token, further premium increases due to the inferior safety records on this shortcut will erode the competitiveness of the NSR.
NSR tariff is another key cost concern that has an inverse relation with the total profit of the NSR. The higher fee is justified by the ice-breaking services to assist shipping activities in the harsh Arctic conditions, thus enabling safer navigation [45]. While we have used the official rate in our calculations, icebreaker fees are negotiable, as confirmed by several sources. A further discount will favor the NSR, and the effect will be similar to the cut in insurance premiums. However, NSR tariffs have long been criticized for their poor transparency and uncertainty. As shown in the sensitivity analysis, if the fee is increased above a certain level for a hired or a self-owned vessel, passing through the NSR would not remain a commercially attractive choice.
Last but not least, load factor is a dominant factor that impacts revenue and profit. As is evident from the sensitivity analysis, any decrease in the load factor from the baseline scenario will erode the competiveness of the NSR. But in our view, a much lower load factor on NSR is unlikely unless the navigation conditions are below expectation which impact cargo owners’ confidence. A middle-class containership combined with additional port visits usually obtains a high load factor. A shorter voyage time could increase NSR’s competitiveness based on the “time value” so a higher load factor is possible.
As shown in Table 3, if adopted, the NSR could achieve significant fuel reductions, which would limit greenhouse gas emissions (GHG) as well as other pollutants linked with the shipping industry. Specifically, GHG emissions, such as CO2, CH4, and N2O, and conventional shipping emissions, such as NOx, CO, and SOx, can be reduced by approximately 27% per loop. In particular, CO2 emissions can be cut by 43,751 tons per loop. If a CO2 emission trading scheme is implemented [46] and the trading price is about 15 USD/ton, one single round-trip freight transportation using the NSR could save an additional 656,265 USD. Because the shipping industry will inevitably be included in the global decarbonizing efforts, using the NSR as an alternative route could complement current operational strategies that only emphasize slow steaming [47].

5. Conclusions

The retreating of the summer sea ice is providing new opportunities for the shipping industry to expand to new routes with implications for new traffic patterns and associated energy reduction potential. However, a shorter distance does not translate into a proportionally shorter transit time and cost savings. A number of models, with diverse conclusions, have been developed over the past few years. In view of this discrepancy, we perform a cost–benefit analysis covering capital, operational, and voyage costs, as well as revenues gained from a simulated journey between Shanghai and Rotterdam using the latest publicly available data and operational data provided by COSCO’s management.
We find that the cost and profit are slightly different between a hired ship and a self-owned ship due to the difference in the calculation of the capital cost. This difference can slightly impact the sensitivity analysis; for example: if the ship is self-owned, a 10% increase in the insurance premium is still unlikely to decrease the competitiveness of the NSR on a total profit basis in a five-month navigation window, but for a hired ship, this 10% increase in the insurance premium could erode the NSR’s competitiveness. In addition, we find that no matter whether it is total costs or cost/TEU, for the NSR, these costs are higher than those for the SCR. More port visits and a high load factor combined with more rotations during a given navigational window could lead to higher revenue and contribute to a higher total profit even though unit profit is still less than the SCR.
Overall, higher fuel prices and load factors and lower NSR tariff rates and marine insurance costs will enhance the NSR’s competitiveness. However, a more aggressive Scenario II, which would require ships on the NSR to switch to much cleaner fuel, would erode this route’s competitiveness even on a total profit basis.
The NSR could achieve fuel reductions thanks to a shorter distance; this would bring down GHGs and other typical pollutants linked with the shipping industry. In particular, GHG emissions, such as CO2, CH4, and N2O, and conventional shipping emissions, such as NOx, CO, and SOx, can be reduced by approximately 27% per loop on the NSR compared with the SCR. These extra environmental benefits should be taken into consideration if future carbon emission trading schemes include the shipping industry.

Acknowledgments

We would like to thank the four reviewers and editor for their constructive comments and editorial suggestions during the revision stage. We also thank COSCO and Shanghai International Shipping Institute for data support. The authors are solely responsible for the views represented in this article. Zheng Wan is supported by the National Natural Science Foundation of China (71704103) and the National Social Science Fund of China (15BGL084), Jihong Chen is supported by Shanghai Pujiang Program (17PJC053).

Author Contributions

Zheng Wan conceived and designed the analytic framework; Jiawei Ge and Jihong Chen analyzed the data; Zheng Wan wrote the paper.

Conflicts of Interest

The authors declare no conflict of interest.

References

  1. Holland, C. Arctic Exploration and Development, c. 500 BC to 1915: An Encyclopedia; Garland Publishing: New York, NY, USA, 1993; ISBN 978-0824076481. [Google Scholar]
  2. German Ships Blaze Arctic Trail. Available online: http://news.bbc.co.uk/2/hi/europe/8251914.stm (accessed on 20 January 2018).
  3. Rogers, T.S.; Walsh, J.E.; Rupp, T.S.; Brigham, L.W.; Sfraga, M. Future Arctic marine access: Analysis and evaluation of observations, models, and projections of sea ice. Cryosphere 2013, 7, 321–332. [Google Scholar] [CrossRef]
  4. Bekkers, E.; Francois, J.F.; Rojas-Romagosa, H. Melting ice caps and the economic impact of opening the Northern Sea Route. Econ. J. 2016. [Google Scholar] [CrossRef]
  5. Haas, C.; Howell, S.E.L. Ice thickness in the Northwest Passage. Geophys. Res. Lett. 2015, 42, 7673–7680. [Google Scholar] [CrossRef]
  6. Eguíluz, V.M.; Fernández-Gracia, J.; Irigoien, X.; Duarte, C.M. A quantitative assessment of Arctic shipping in 2010–2014. Sci. Rep. 2016, 6. [Google Scholar] [CrossRef] [PubMed]
  7. Pizzolato, L.; Howell, S.E.L.; Dawson, J.; Laliberté, F.; Copland, L. The influence of declining sea ice on shipping activity in the Canadian Arctic. Geophys. Res. Lett. 2016, 43. [Google Scholar] [CrossRef]
  8. Young, O.R. Arctic governance—Pathways to the future. Arct. Rev. Law Politics 2010, 1, 164–185. [Google Scholar]
  9. ARCTIS, Russian Federation Policy for the Arctic to 2020. Available online: http://www.arctis-search.com/Russian+Federation+Policy+for+the+Arctic+to+2020 (accessed on 4 March 2018).
  10. Ministry of Energy of the Russian Federation 2010. Available online: http://www.energystrategy.ru/projects/docs/ES-2030 (Eng).pdf (accessed on 4 March 2018).
  11. Buixadé Farré, A.; Stephenson, S.R.; Chen, L.; Czub, M.; Dai, Y.; Demchev, D.; Efimov, Y.; Graczyk, P.; Grythe, H.; Keil, K.; et al. Commercial Arctic shipping through the Northeast Passage: Routes, resources, governance, technology, and infrastructure. Polar Geogr. 2014, 37, 298–324. [Google Scholar] [CrossRef]
  12. Stephens, P. Now China Starts to Make the Rules. Financial Times. 28 May 2015. Available online: https://www.ft.com/content/9dafcb30-0395-11e5-a70f-00144feabdc0 (accessed on 20 January 2018).
  13. Lanteigne, M. China’s maritime security and the “Malacca Dilemma”. Asian Secur. 2008, 4, 143–161. [Google Scholar] [CrossRef]
  14. Alphaliner. Alphaliner TOP 100. 2018. Available online: https://alphaliner.axsmarine.com/PublicTop100/ (accessed on 4 March 2018).
  15. Staalesen, A. COSCO Sends Five Vessels through Northern Sea Route. The Independent Barents Observer. 2016. Available online: https://thebarentsobserver.com/en/arctic-industry-and-energy/2016/10/cosco-sends-five-vessels-through-northern-sea-route (accessed on 20 January 2018).
  16. Beveridge, L.; Fournier, M.; Lasserre, F.; Huang, L.; Têtu, P.L. Interest of Asian shipping companies in navigating the Arctic. Polar Sci. 2016, 10, 404–414. [Google Scholar] [CrossRef]
  17. Arpiainen, M.; Killi, R. Arctic Shuttle Container Link from Alaska US and Europe, Report K-63; Aker Arctic Technology: Helsinki, Finland, 2006. [Google Scholar]
  18. Liu, M.; Kronbak, J. The potential economic viability of using the Northern Sea Route (NSR) as an alternative route between Asia and Europe. J. Transp. Geogr. 2010, 18, 434–444. [Google Scholar] [CrossRef]
  19. Schøyen, H.; Bråthen, S. The Northern Sea Route versus the Suez Canal: Cases from bulk shipping. J. Transp. Geogr. 2011, 19, 977–983. [Google Scholar] [CrossRef]
  20. Lasserre, F. Case studies of shipping along Arctic routes. Analysis and profitability perspectives for the container sector. Transp. Res. Part A Policy Pract. 2014, 66, 144–161. [Google Scholar] [CrossRef]
  21. Wang, N.; Yan, B.; Wu, N.; Zhao, W.J. Comments on “Case studies of shipping along Arctic routes. Analysis and profitability perspectives for the container sector” [Transp. Res. Part A: Policy Pract. 66 (2014) 144–161]. Transp. Res. Part A Policy Pract. 2016, 94, 699–702. [Google Scholar] [CrossRef]
  22. Lasserre, F. “Case studies of shipping along Arctic routes. Analysis and profitability perspectives for the container sector” [Transport. Res. Part A Pol. Pract. 66 (2014) 144–161]: A rejoinder. Transp. Res. Part A Policy Pract. 2016, 94, 703–704. [Google Scholar] [CrossRef]
  23. Cariou, P.; Faury, O. Relevance of the Northern Sea Route (NSR) for bulk shipping. Transp. Res. Part A Policy Pract. 2015, 78, 337–346. [Google Scholar]
  24. Faury, O.; Cariou, P. The Northern Sea Route competitiveness for oil tankers. Transp. Res. Part A Policy Pract. 2016, 94, 461–469. [Google Scholar] [CrossRef]
  25. Li, Z. Analysis of China’s strategy on Arctic Route. China Soft Sci. 2009, 1, 1–7. (In Chinese) [Google Scholar]
  26. Li, Z.; You, X.; Wang, W.; Ding, C. Economic Analysis of the Container Shipping on the Arctic Northeast Route. J. Jimei Univ. 2015, 1, 34–40. (In Chinese) [Google Scholar]
  27. Zhang, X.; Shou, J.; Zhou, H. Studies on North Pole Maritime Shipping Commodity Types and Related Economy Scale. Chin. J. Polar Res. 2013, 25, 66–74. [Google Scholar]
  28. Stopford, M. Maritime Economics 3e; Routledge: London, UK, 2009. [Google Scholar]
  29. Melia, N.; Haines, K.; Hawkins, E. Sea ice decline and 21st century trans-Arctic shipping routes. Geophys. Res. Lett. 2016, 43, 9720–9728. [Google Scholar] [CrossRef]
  30. Anderson, P. The Mariner’s Guide to Marine Insurance; Nautical Institute: London, UK, 1999. [Google Scholar]
  31. Puttevils, J.; Deloof, M. Marketing and Pricing Risk in Marine Insurance in Sixteenth-Century Antwerp. J. Econ. Hist. 2017, 77, 796–837. [Google Scholar] [CrossRef]
  32. Yao, Z.; Ng, S.H.; Lee, L.H. A study on bunker fuel management for the shipping liner services. Comput. Oper. Res. 2012, 39, 1160–1172. [Google Scholar] [CrossRef]
  33. Wan, Z.; el Makhloufi, A.; Chen, Y.; Tang, J. Decarbonizing the international shipping industry: Solutions and policy recommendations. Mar. Pollut. Bull. 2018, 126, 428–435. [Google Scholar] [CrossRef] [PubMed]
  34. Woo, J.K.; Moon, D.S. The effects of slow steaming on the environmental performance in liner shipping. Marit. Policy Manag. 2014, 41, 176–191. [Google Scholar] [CrossRef]
  35. Lindstad, H.; Sandaas, I.; Strømman, A.H. Assessment of cost as a function of abatement options in maritime emission control areas. Transp. Res. Part D Transp. Environ. 2015, 38, 41–48. [Google Scholar] [CrossRef]
  36. Wan, Z.; Zhu, M.; Chen, S.; Sperling, D. Pollution: Three steps to a green shipping industry. Nature 2016, 530, 275–277. [Google Scholar] [CrossRef] [PubMed]
  37. Comer, B.; Olmer, N.; Mao, X.; Roy, B.; Rutherford, D. Prevalence of Heavy Fuel Oil and Black Carbon in Arctic Shipping, 2015 to 2025. International Council on Clean Transportation. 2017. Available online: https://www.theicct.org/sites/default/files/publications/HFO-Arctic_ICCT_Report_01052017_vF.pdf (accessed on 20 January 2018).
  38. Yumashev, D.; van Hussen, K.; Gille, J.; Whiteman, G. Towards a balanced view of Arctic shipping: Estimating economic impacts of emissions from increased traffic on the Northern Sea Route. Clim. Chang. 2017, 143, 143–155. [Google Scholar] [CrossRef]
  39. Smith, K.R.; Jerrett, M.; Anderson, H.R.; Burnett, R.T.; Stone, V.; Derwent, R.; Atkinson, R.W.; Cohen, A.; Shonkoff, S.B.; Krewski, D.; et al. Public health benefits of strategies to reduce greenhouse-gas emissions: Health implications of short-lived greenhouse pollutants. Lancet 2009, 374, 2091–2103. [Google Scholar] [CrossRef]
  40. Sofiev, M.; Winebrake, J.J.; Johansson, L.; Carr, E.W.; Prank, M.; Soares, J.; Vira, J.; Kouznetsov, R.; Jalkanen, J.P.; Corbett, J.J. Cleaner fuels for ships provide public health benefits with climate tradeoffs. Nat. Commun. 2018, 9. [Google Scholar] [CrossRef] [PubMed]
  41. Gritsenko, D.; Kiiski, T. A review of Russian ice-breaking tariff policy on the northern sea route 1991–2014. Polar Rec. 2016, 52, 144–158. [Google Scholar] [CrossRef]
  42. Sinha, U.K.; Bekkevold, J.I. Arctic: Commerce, Governance and Policy; Routledge: London, UK, 2017; ISBN 978-1-13-885599-1. [Google Scholar]
  43. Pettersen, J.B.; Song, X. Life Cycle Impact Assessment in the Arctic: Challenges and Research Needs. Sustainability 2017, 9, 1605. [Google Scholar] [CrossRef]
  44. Sarrabezoles, A.; Lasserre, F.; Hagouagn’rin, Z. Arctic shipping insurance: Towards a harmonisation of practices and costs? Polar Rec. 2016, 52, 393–398. [Google Scholar] [CrossRef]
  45. Kiiski, T.; Solakivi, T.; Töyli, J.; Ojala, L. Long-term dynamics of shipping and icebreaker capacity along the Northern Sea Route. Marit. Econ. Logist. 2016. [Google Scholar] [CrossRef]
  46. Grubb, M.; Neuhoff, K. Allocation and competitiveness in the EU emissions trading scheme: Policy overview. Clim. Policy 2016, 6, 7–30. [Google Scholar] [CrossRef]
  47. Armstrong, V.N. Vessel optimisation for low carbon shipping. Ocean Eng. 2013, 73, 195–207. [Google Scholar] [CrossRef]
Figure 1. The Northern Sea Route and Suez Canal Route between Shanghai and Rotterdam.
Sustainability 10 00921 g001
Figure 2. Official NSR transit tariff calculator (http://www.nsra.ru).
Sustainability 10 00921 g002
Figure 3. Cost structure of the NSR and the SCR for a hired vessel (Scenario I).
Sustainability 10 00921 g003
Table 1. Cost-benefit comparison between the Northern Sea Route and Suez Canal Route.
Sailing ParametersNSRSuezRemarks
Distance per loop/n mile 16,968.322,156Calculation using ”McDistance” software
Operational time/days147151From June 1 to October 31 (153 days)
Maintenance and repair time (days): NSR: 6, SCR: 2
Load factor (eastbound)0.550.60SCR: Three year third-quarter average (2015–2017)
Data source: www.clarksons.net/portal;
NSR: see the main paper
Load factor (westbound)0.840.89
TEU transported, one-way eastbound27993078
TEU transported, one-way westbound42754536
Sailing time (normal sea conditions)/days21.0441.9120 kn
Sailing time (ECA)/days4.394.25ECA data: “McDistance”
Sailing time (ice area)/days14.17014 kn between Cape Zhelaniya and Cape Dezhnev, about 2380 nm each way
Delay at the Suez Canal/days04Industrial average, 1–2 days delay for one passage during summer
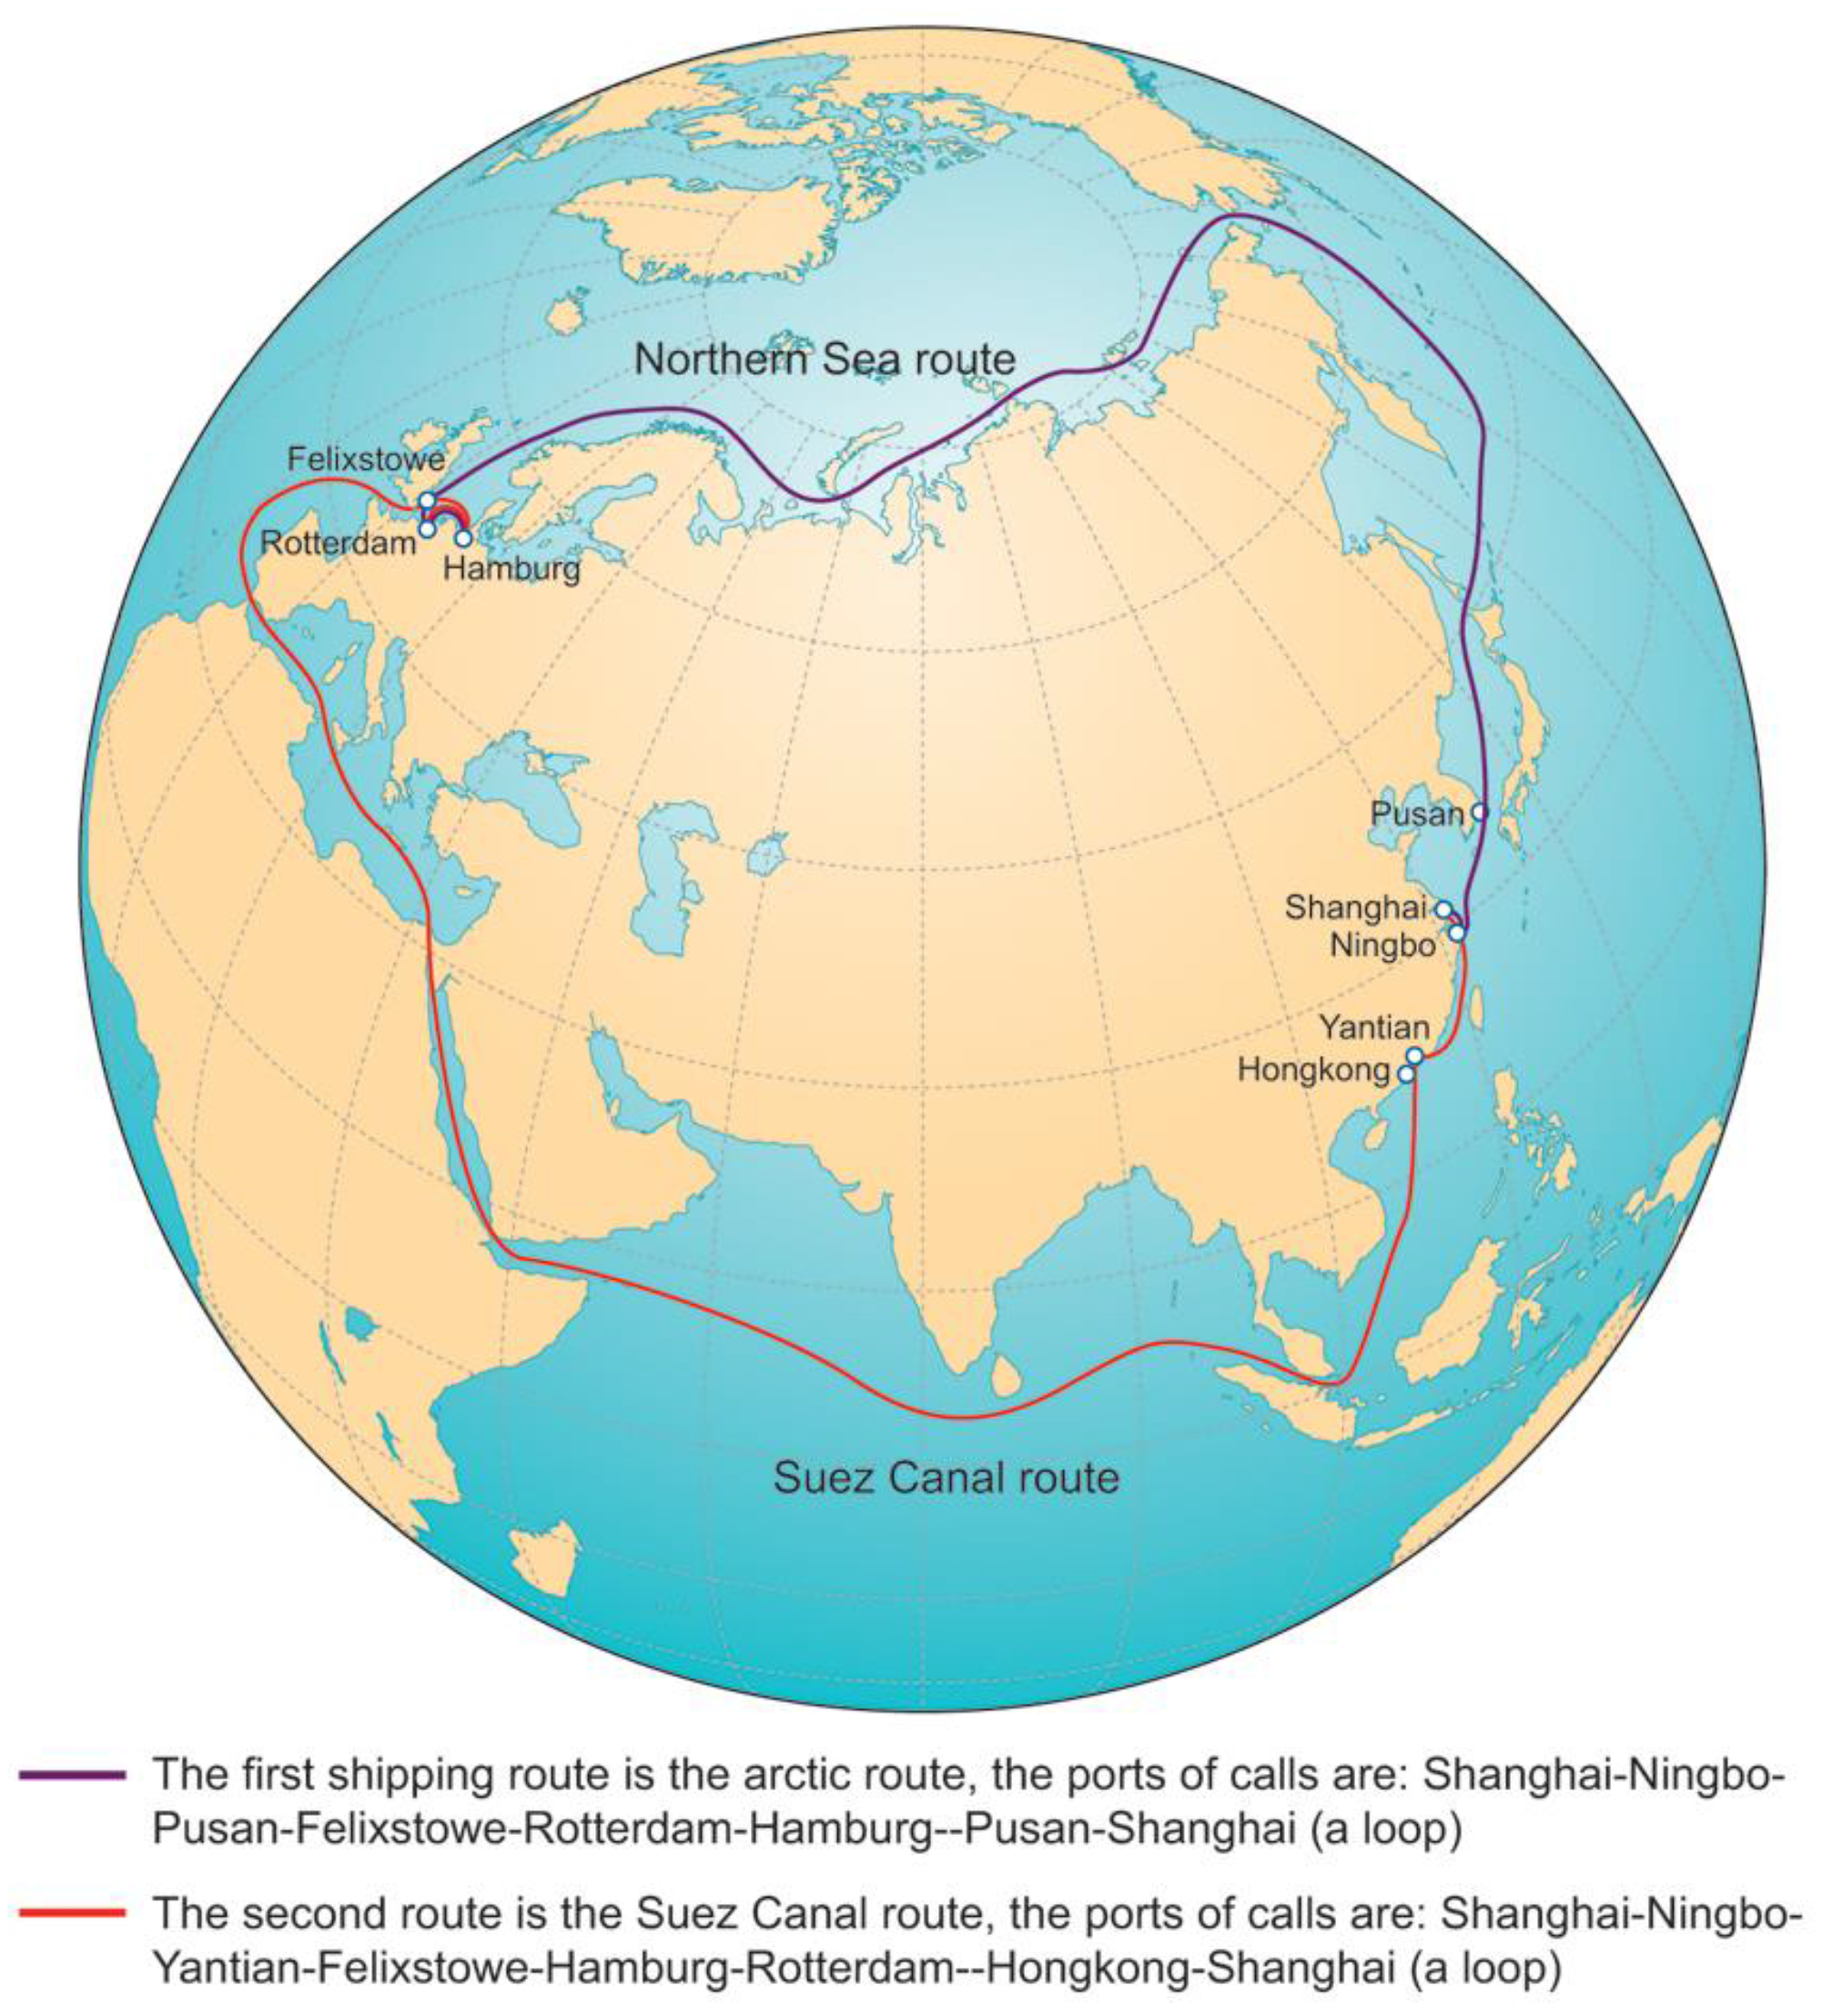
Number of intermediate ports66NSR: Shanghai-Ningbo-Pusan-Felixstowe-Rotterdam-Hamburg-Pusan-Shanghai.
SCR: Shanghai-Ningbo-Yantian-Felixstowe-Hamburg-Rotterdam-Hong Kong-Shanghai
Stop at port/days, per loop1010COSCO: one day at each Asian port; two days at each European port
Total voyage time per loop/days49.660.16
Number of loops32.5
Total TEU transported21,22219,764
Cost analysis (five months)
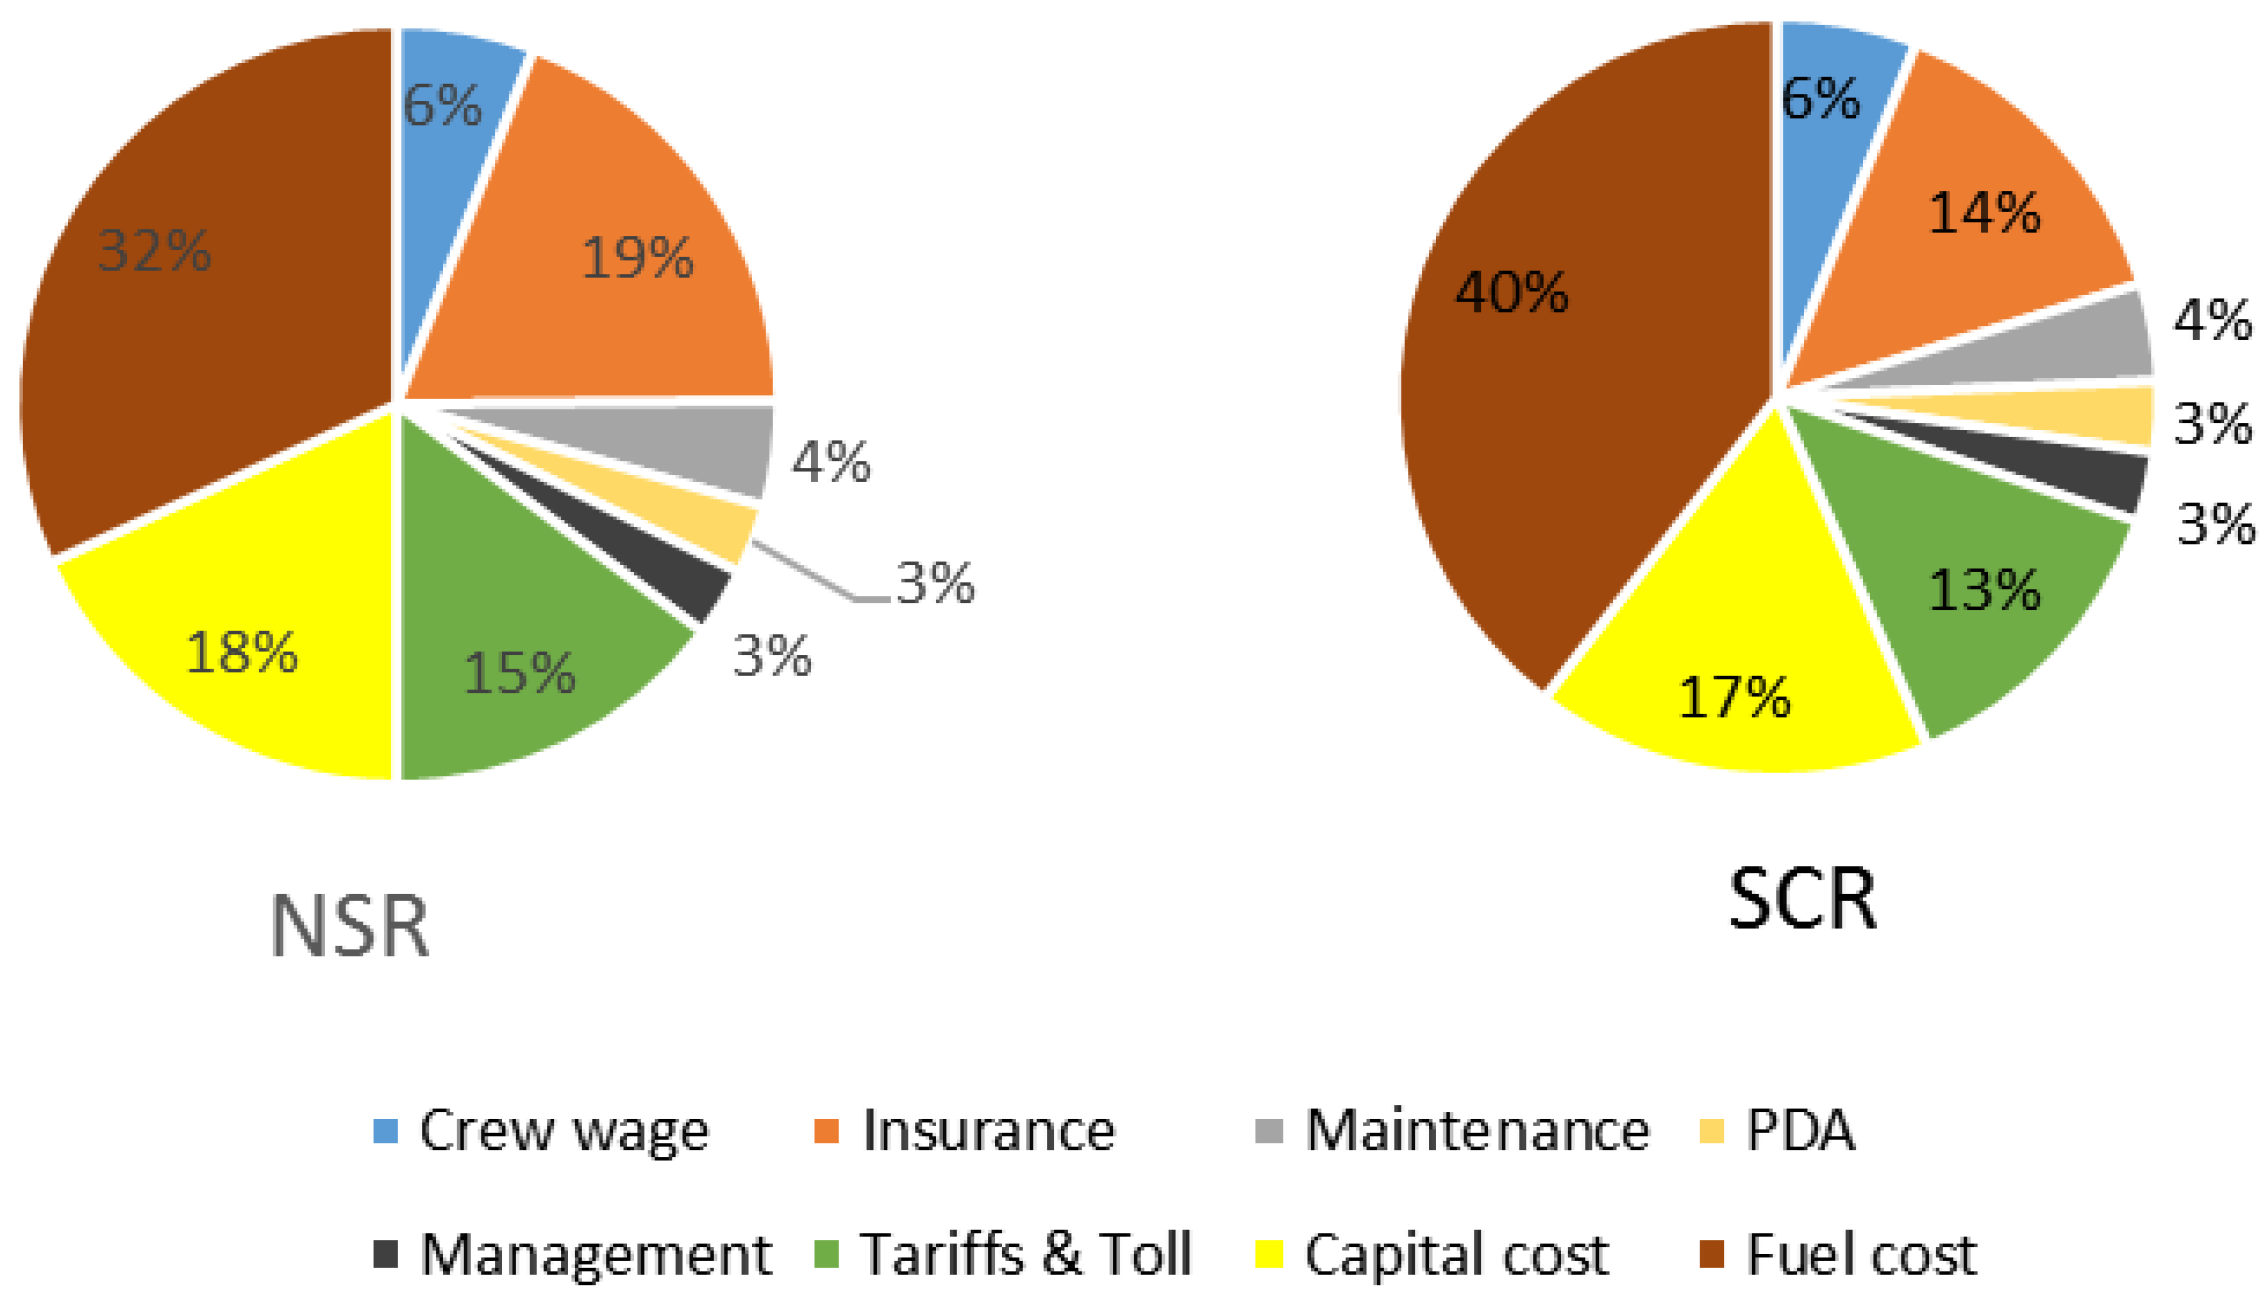
Crew wage/,000 USD621.50 565.00 SCR: 20 crew, $113,000 per month (COSCO); NSR: +10%
Insurance (H&M, P&I)/,000 USD2022.75 1348.5SCR: H&M rate: 1.4%, P&I rate: 1.7% (COSCO); NSR: +50%
Maintenance/,000 USD474.79 395.66 SCR data from COSCO estimates; NSR: +20%
Port Disbursement Account (PDA)/,000 USD315285COSCO: Average $15,000/port, cargo movement and handling not included
Management/,000 USD310.75 282.50 COSCO: Generally half of the crew wage. NSR: +10%
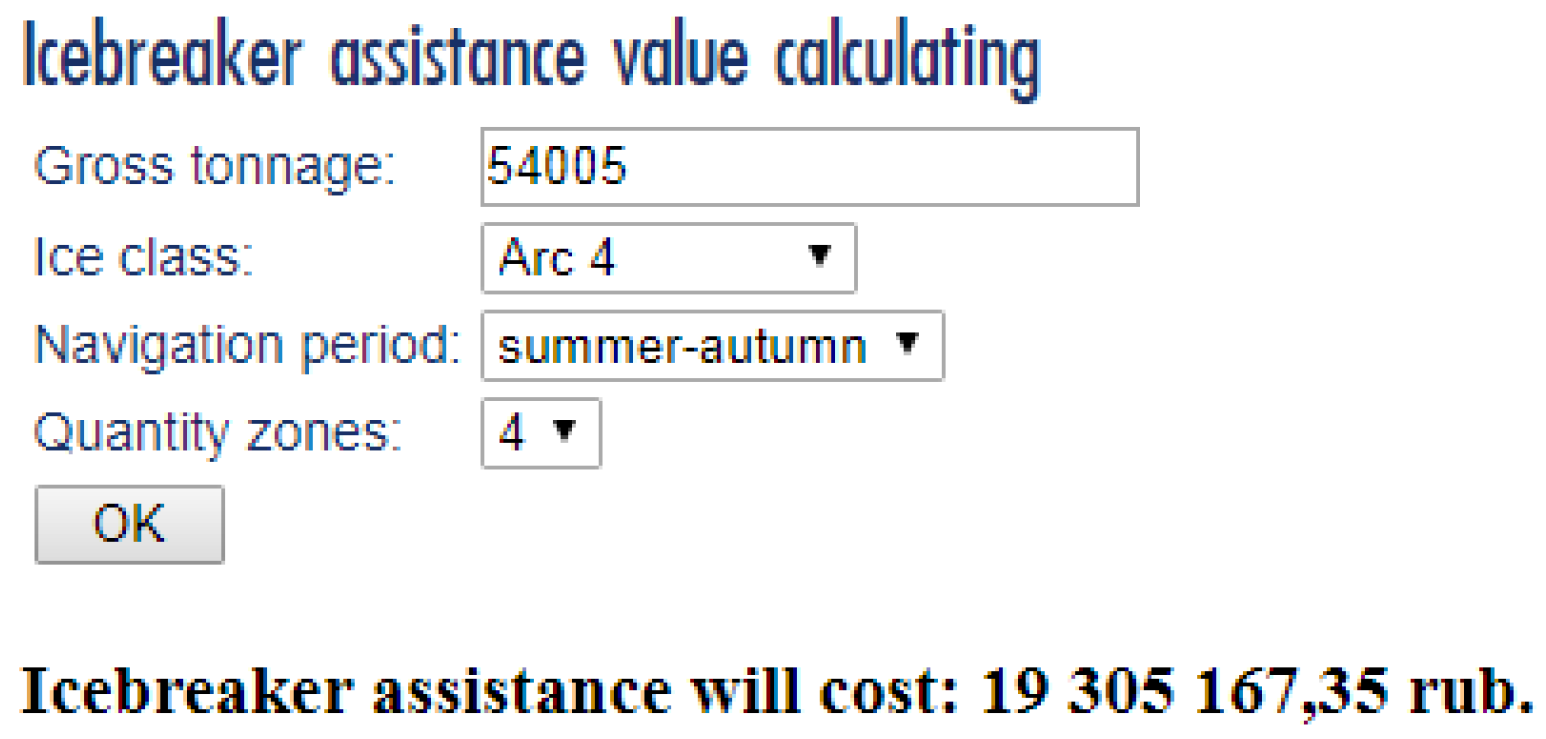
Tariffs and Tolls/,000 USD1575.30 1254.84 NSR: 19.3 million rubles/transit with a 20% discount, 1 rub = $0.017 (www.nsra.ru)
Suez Canal: $250,968.85/transit (www.suezcanal.gov.eg)
Fuel consumption rate t/day (main engine)118.8/48.6110/45Main engine: 45 t/d at 14 kn, 110 t/d at 20 kn +8% for ice-class ship. Auxiliary engine: 10 t/d at port
Average price for the last three years (Rotterdam), every June to October, from 2015 to 2017
IFO380 = $266.46/t,MGO = $449.52/t.
Data: www.clarksons.net/portal.
Fuel consumption rate t/day (auxiliary)1010
Fuel price USD/t (IFO380) 266.46266.46
Fuel price USD/t (MGO) 449.52449.52
Capital cost/,000 USDHired1927.81606.5Hire fee: Drewry Container Forecaster Quarter 3, 2017
Self-owned: 43.5 million USD for new building, 7.06 million USD for scrapping, 24-years straight-line depreciation (COSCO); NSR: +20% for ice-class ships.
Owned783.68632.64
Fuel consumption per loop/t (IFO380)I3188.454610.40
II2499.95
Fuel consumption per loop/t (MGO)I621.61607.02
II1310.11
Fuel cost/,000 USDI3387.053753.38NSR: 1129.02/1255.06 thousand USD per loop
II3765.17SCR: 1501.35 thousand USD per loop
Total cost/,000 USDHiredI10,634.959491.38 NSR: 3544.98/3671.02 thousand USD per loop
II11,013.06SCR: 3796.55 thousand USD per loop
OwnedI9490.938517.52 NSR: 3163.64/3289.68 thousand USD per loop
II9869.04SCR: 3407.01 thousand USD per loop
Unit cost (USD/TEU)HiredI501.13480.24
II518.95
OwnedI447.22 430.96
II465.04
Revenue analysis
Freight rate per TEU/USD921.7Shanghai Shipping Exchange for AEX route: $921.7/TEU (Q1–Q3 average, 2017)
Total Revenue/,000 USD19,560.3218,216.48
Total Profit/,000 USDHiredI8925.37 8725.09
II8547.26
OwnedI10,069.399698.95
II9691.28
Profit per TEU/USDHiredI420.57 441.46
II402.75
OwnedI474.48 490.74
II456.66
Scenario I = No fuel restriction; Scenario II = NSR as potential ECA.
Table 2. Sensitivity analysis of the total profit differential between NSR and SCR under Scenario I.
Sensitivity AnalysisDifferential (USD, 000)−50%−40%−30%−20%−10%0%10%20%30%40%50%
HiredFuel Cost17.11 53.74 90.37 127.01 163.64 200.27 236.90 273.54 310.17 346.80 383.44
NSR Tariff987.92 830.39 672.86 515.33 357.80 200.27 42.74 −114.79 −272.32 −429.85 −587.38
Insurance1211.65 1009.37 807.10 604.82 402.55 200.27 −2.00 −204.28 −406.55 −608.83 −811.10
Load Factor−9577.12 −7622.20 −5664.51 −3709.58 −1751.89 200.27 2157.96 3999.52 ---
Self-ownedFuel cost187.27 223.90 260.53 297.17 333.80 370.43 407.06 443.70 480.33 516.96 553.60
NSR Tariff1158.08 1000.55 843.02 685.49 527.96 370.43 212.90 55.37 −102.16 −259.69 −417.22
Insurance1381.81 1179.53 977.26 774.98 572.71 370.43 168.16 −34.12 −236.39 −438.67 −640.94
Load Factor−9406.96 −7452.04 −5494.35 −3539.42 −1581.73 370.43 2328.12 4169.68 ---
Table 3. Shipping emissions comparison between NSR and SCR. (unit: Ton/Voyage).
EmissionsNSRSuezEmission Factor Value
CO2 119,936.81 163,688.25 77,400 kg/TJ for IFO380 and MGO
CH4 4.65 6.34 3 kg/TJ for IFO380 and MGO
N2O 0.93 1.27 0.6 kg/TJ for IFO380 and MGO
NOx 301.64 413.26 79.3 kg/T for IFO380, 78.5 kg/T for MGO
CO 28.19 38.61 7.4 kg/T for IFO380 and MGO
SOx76.20 104.35 20 kg/T for IFO380 and MGO
Note: Emission factor value source: IPCC and EEA; TJ = terajoule, T = ton; detailed explanations and conversion of different measurements can be found at: https://www.eea.europa.eu/publications/emep-eea-guidebook-2016 and http://www.ipcc-nggip.iges.or.jp/public/2006gl/index.html.

