Analysis of Biomass Blend Co-Firing for Post Combustion CO2 Capture


1
Department of Risk Assessment in Industry, Central Mining Institute, Plac Gwarków 1, Katowice 40-166, Poland
2
Science Secretary in Central Mining Institute, Plac Gwarków 1, Katowice 40-166, Poland
3
Department of Mathematics, University of Oviedo, Calle Federico García Lorca 18, 33007 Oviedo, Spain
*
Author to whom correspondence should be addressed.
Sustainability 2018, 10(4), 923; https://doi.org/10.3390/su10040923
Submission received: 13 February 2018
/
Revised: 19 March 2018
/
Accepted: 20 March 2018
/
Published: 22 March 2018
(This article belongs to the Special Issue Clean Coal Technologies)
Abstract
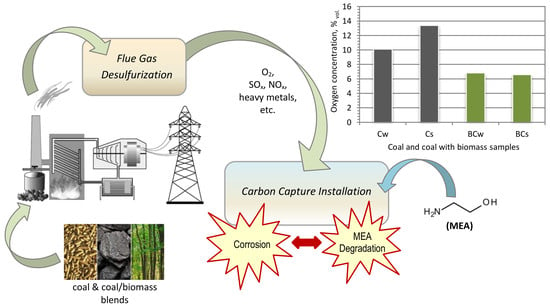
:The correct conduction of the CO2 capture process in coal-fired power plants with the use of monoethanolamine (MEA) requires constant process parameter monitoring and ensuring a specific flue gas chemical composition. One of the most common problems in these types of installations is the progressive corrosion and degradation of the valuable solvent. Despite the established reduction levels of oxygen and impurities entering into irreversible reactions with the absorber, the flue gas composition may change as a daily and annual function of time. The article presents a detailed analysis of the flue gas components that have the greatest influence on carbon dioxide capture installation technical safety, i.e., SOx, NOx, O2, and fly ash. The analysis was based on the results of experiments conducted at the Jaworzno III Tauron Wytwarzanie SA Polish coal power plant. The results show a significant influence of the flue gas desulfurization (FGD) process on MEA oxidative degradation. The amount of oxygen in flue gas during biomass and coal blend co-firing was nearly twice as low compared to pure coal combustion. Differences were also observed in the amounts of gas impurities with relation to the time of year and time of day of power plant operation.
1. Introduction
The coal industry has significant influence on maintaining the level of energy safety in Poland, which is one of the European countries that bases its energy policy on it. European Union priorities aim to limit CO2 emission into the atmosphere to less than 20% of the 1990 level and to produce 20% of the total amount of energy from renewable sources [1]. Therefore, a great deal of attention is being placed on studying CO2 capture in power plants. Combining energy from biomass with CO2 capture is an attractive option for reducing greenhouse gases and achieving climate change mitigation. Out of the three CO2 capture methods—pre-, oxy- and post-combustion [2]—only the last can be easily retrofitted to existing power plants. The widely studied technology for capturing CO2 from coal-fired power plants is chemical absorption with monoethanolamine (MEA).
Alkanolamines are very common because they are cheaper than other solvents, such as pure amines and blends of amines [2,3], and aqueous solutions of ionic liquids [4,5]. Despite their disadvantages, like degradation and high regeneration energy [6], they are still the most common solvents for post-combustion CO2 capture processes [7].
In Poland the first pilot and mobile CO2 capture installation was built by the Institute for the Chemical Processing of Coal and was tested at two Polish power plants: the Łaziska and the Jaworzno III Tauron Wytwarzanie SA [8]. Research shows that 85–99% of CO2 was captured, but in some parts of the installation corrosion was observed [9]. It was caused by wet acid gases and by the aggressive environment created by the amine degradation products.
This occurs when a considerable quantity of O2 and reactive flue gas components (e.g., CO2, SOx, NOx and inorganic oxides contained in fly ash) in a flue gas stream chemically induce the breakdown of MEA during the capture process [10]. All of these can accumulate in amine solvents and lead to different operational problems, such as solvent loss, the formation of volatile compounds which are potentially dangerous for the environment, foaming, fouling, and corrosion [11]. To reduce the solvent degradation it is recommended that the SOx and NOx concentration should be reduced to below 10 mg·Nm3 [3,12]. The level of the SOx absorber is much lower than the limit imposed by environmental regulations for coal-fired power plants (200 mg·Nm3) [1]. This means that flue gas desulfurization (FGD) for SOx removal plays an important role in the MEA process and wet FGD scrubbers have a significant impact on the composition of the gas stream entering the carbon capture system. That technology can achieve 95–99% SO2 removal efficiency.
This paper provides new insights into the likelihood of degradation of the MEA. So far, there has been focus on the source of the oxygen on the concentration in the flue gas stream. According to our research it should also be noted that the oxygen content in the flue gas stream comes not only from combustion, but also from the FGD process.
Heavy metals, like iron, chromium, nickel, and manganese may get into the amine solution from equipment and pipes made from stainless steel, however, copper and vanadium may be added to amine solvents as components of corrosion inhibitors [13].
Fly ash may also contain significant amounts of heavy metals [14,15]. To reduce the effect of oxidative degradation, corrosion inhibitors should be applied during the process. It has been proven that some of them may reduce significant amounts of degradation products and prevent solvent losses [16]. Despite using techniques to prevent amine solvent degradation, it is impossible to stop corrosion in CO2 capture installations. Oxidative degradation in pilot capture plants is still an issue which can be seen in the results of tests conducted in power plants in Germany [17,18] and Australia [19].
Recent literature review shows that the CO2 capture and storage process (CCS) integrated with biomass-fired power plants is an increasingly more often tackled subject [20]. CCS integration with biomass co-firing power plants will further enhance the possibility to limit CO2 emissions for the electrical power industry.
This paper presents the analysis of the streams of exhaust gases from a Polish coal power plant, Jaworzno III Tauron Wytwarzanie SA, using coal and coal with biomass blends.
The aim of this research was to compare oxygen concentration in flue gas streams to evaluate the possibility of degrading the amine solvent in relation to time and the type of fuel. The data presented here constitute sensitive data that are rarely published in the literature.
2. Oxidative Degradation of MEA Solution
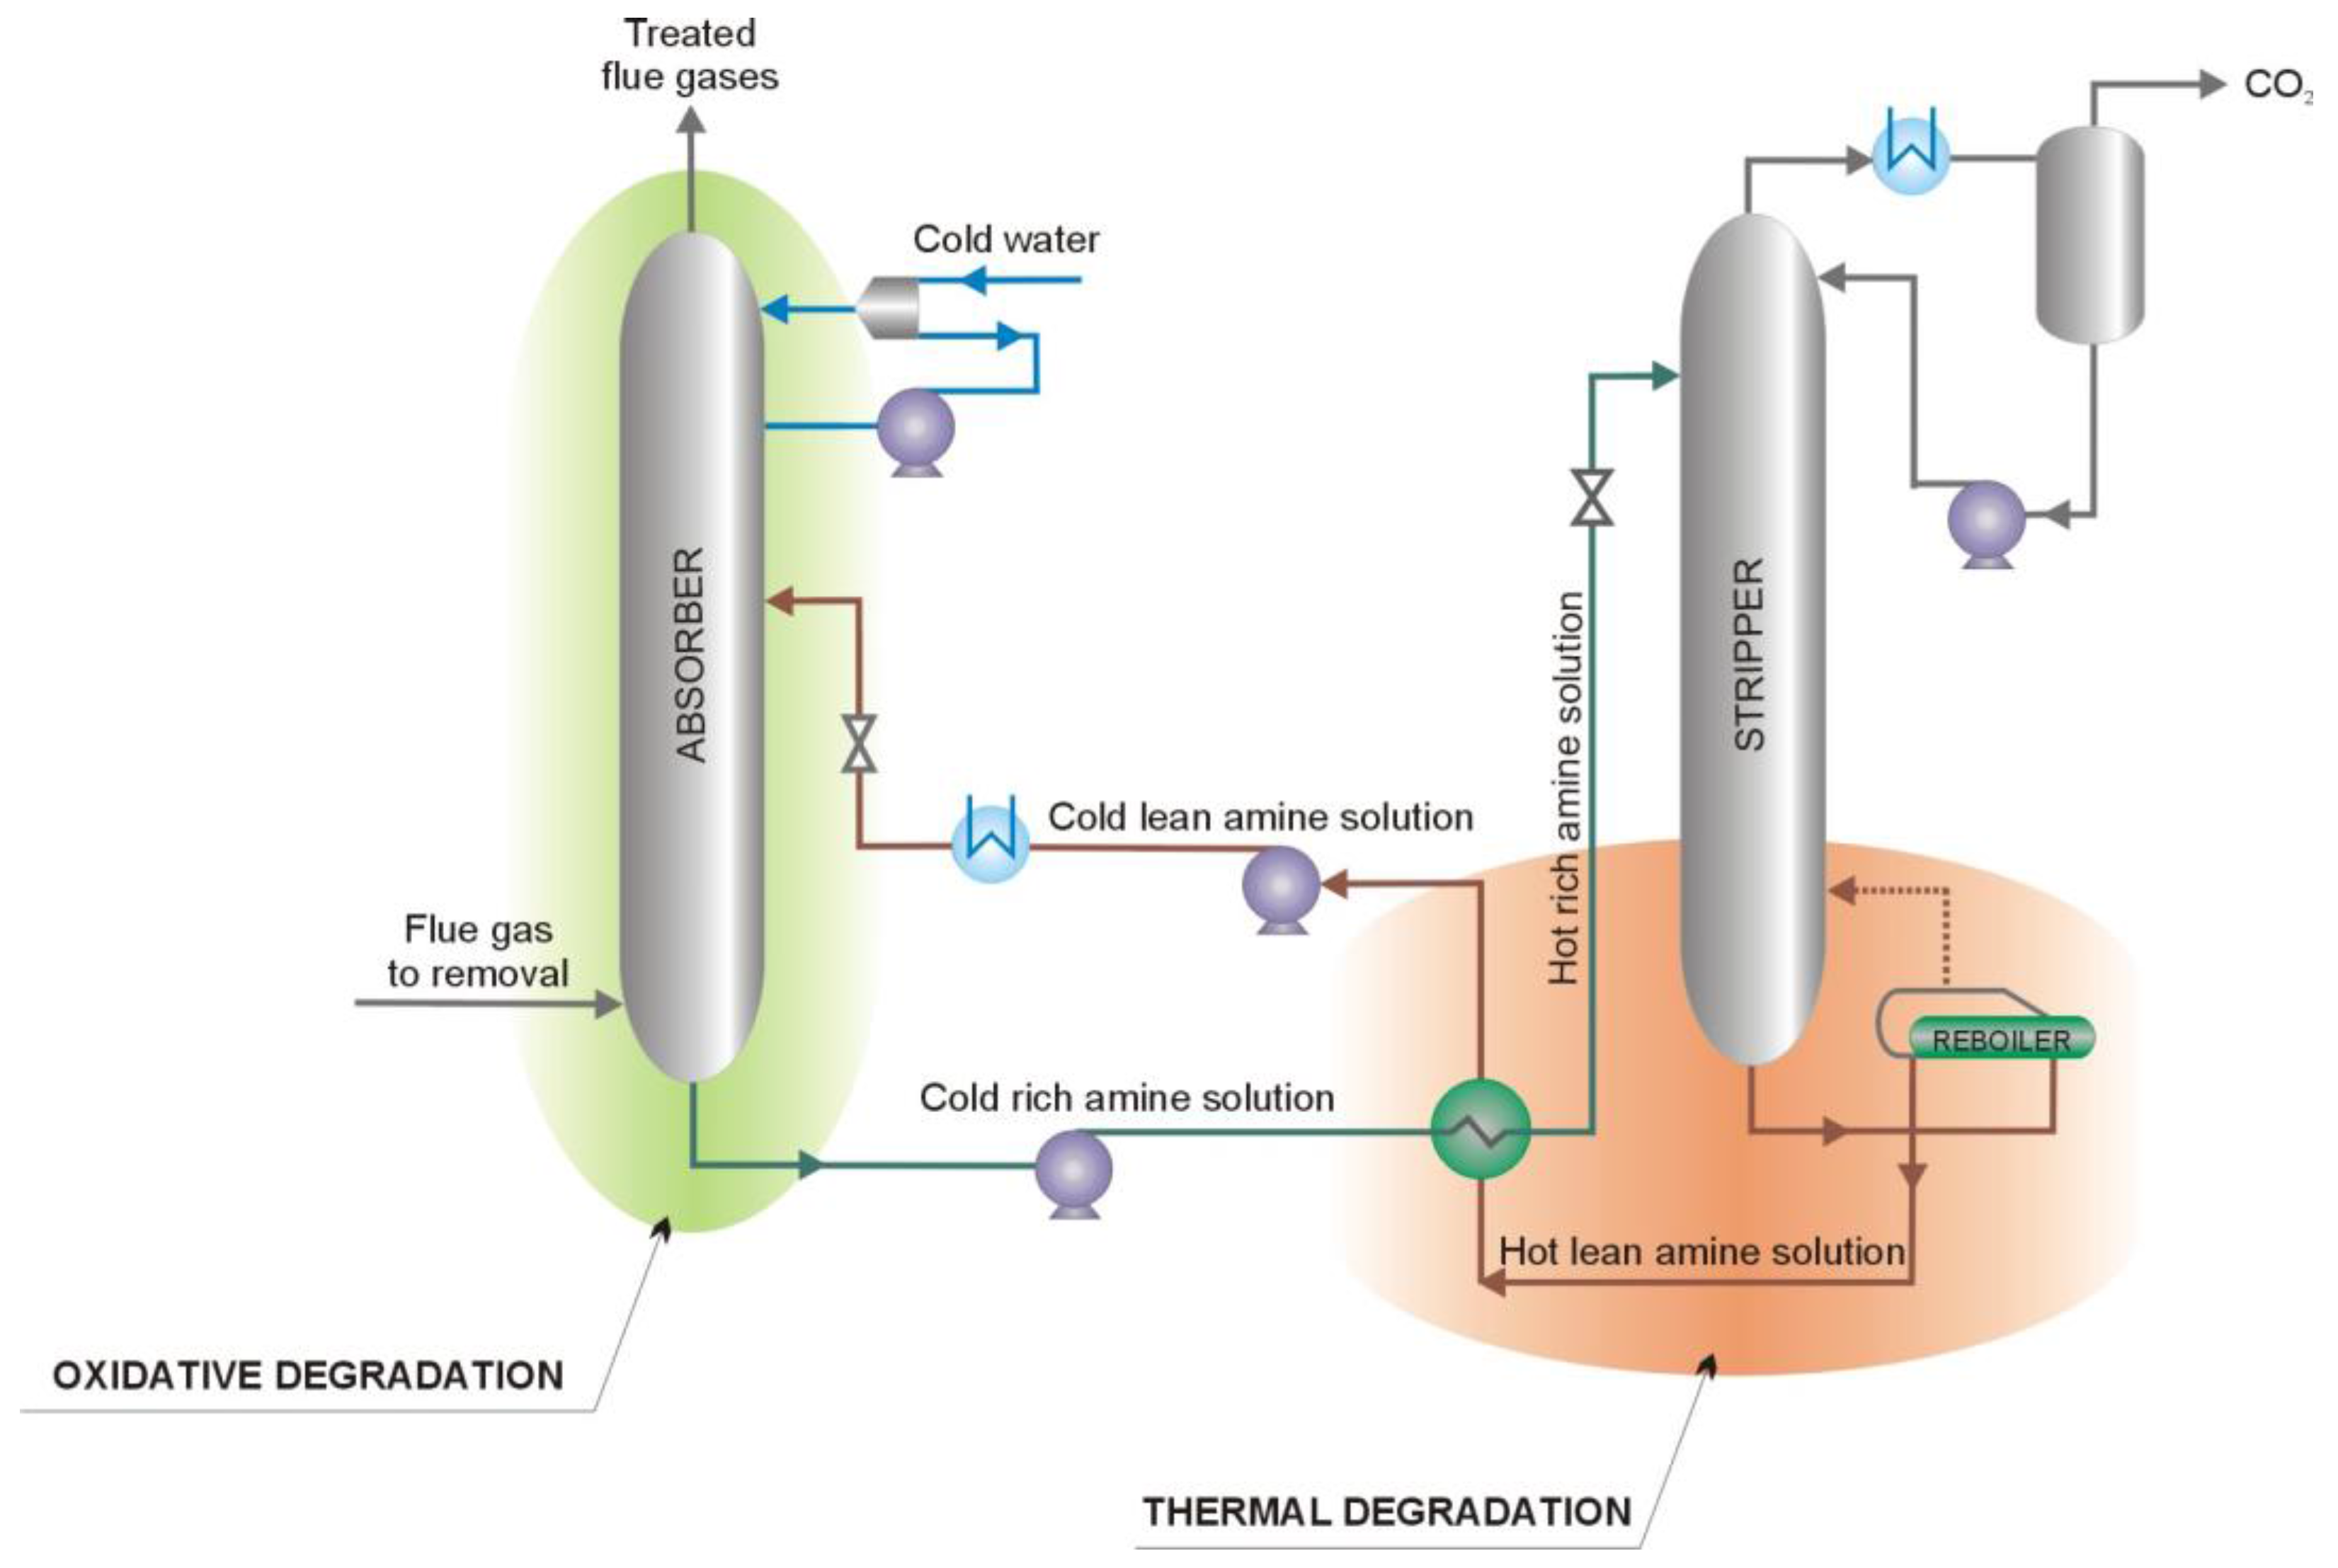
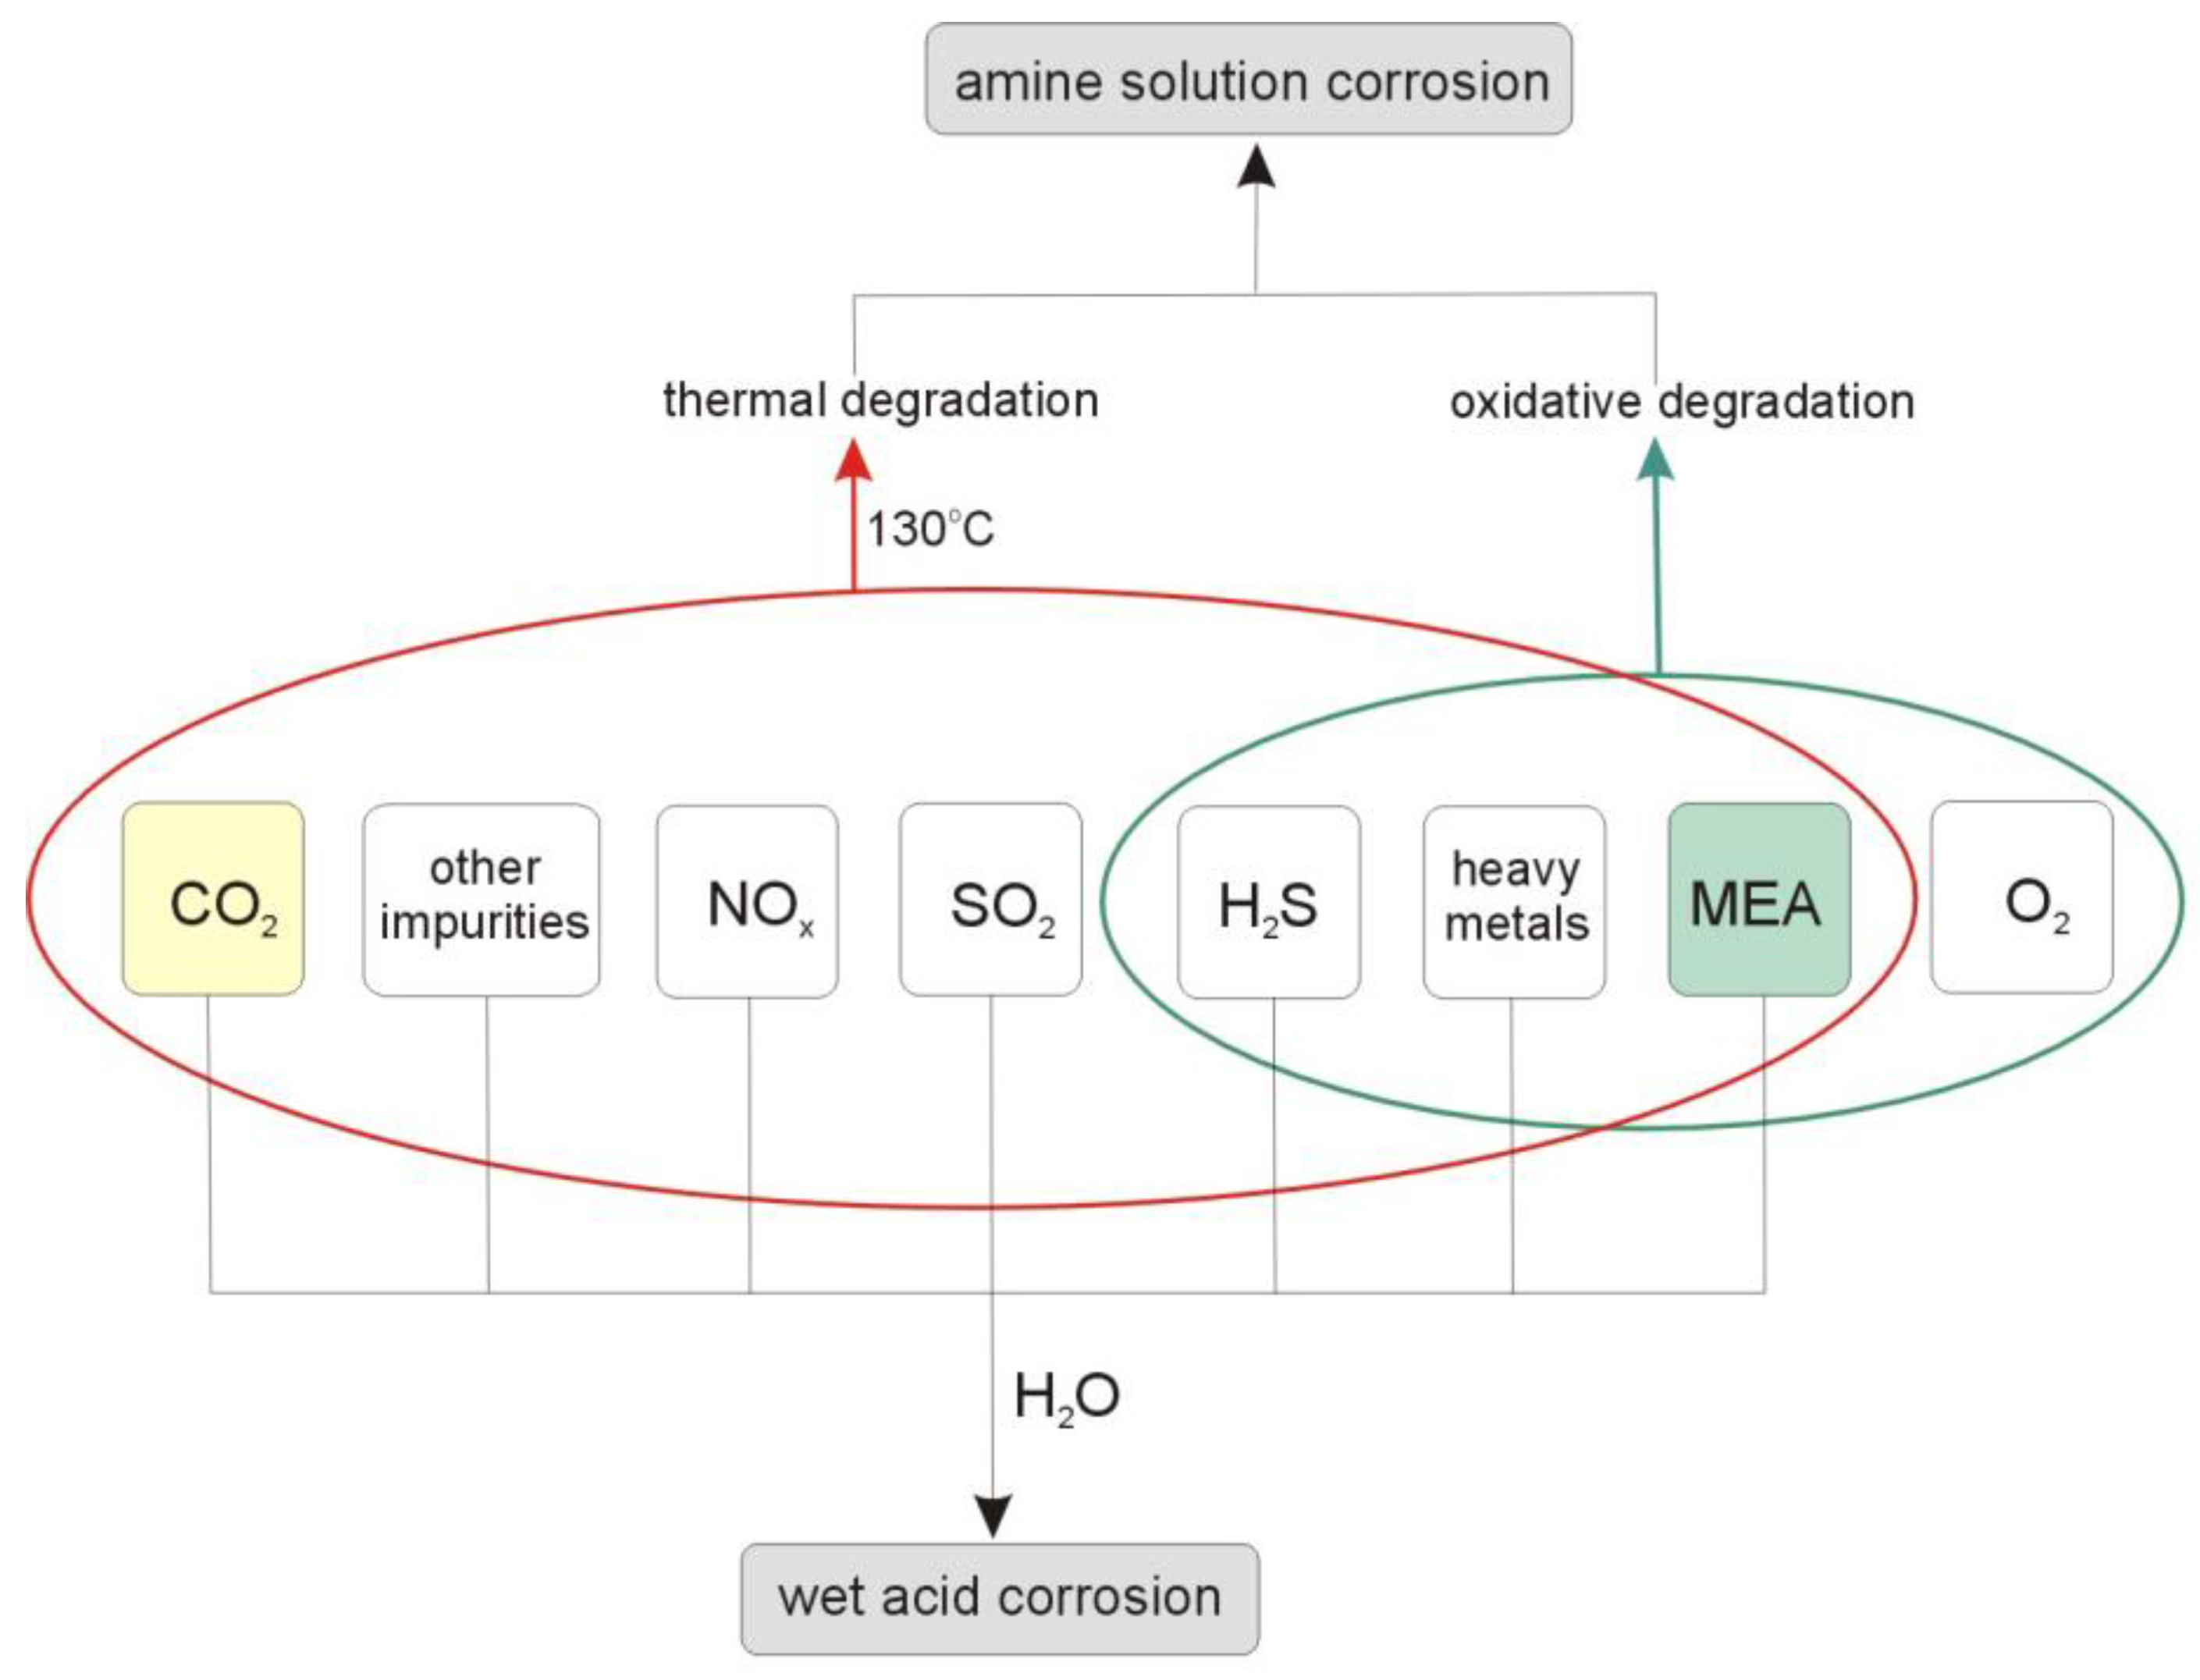
Flue gas streams from coal fired boilers are usually composed of nitrogen with 10–20 vol. % of CO2 and 5–10 vol. % of O2 [21] with contaminants, such as 500–3000 ppm(v) SO2, 20–30 ppm(v) SO3 with an assumed 20–30 ppm(v) of NOx. However, NOx is nominally 5–10 vol. % NO2 and 90–95 vol. % NO, and only NO2 reacts with MEA to degrade products [22]. There are also many other impurities contained in flue gas, such as H2S, hydrocarbons, heavy metals, and fly ash. In these conditions, three types of solvent degradation can occur: carbamate polymerization, thermal degradation, and oxidative degradation. The zones or equipment sections in a post-combustion system where solvent degradation is observed are presented in Figure 1.
Oxidative degradation is the dominant type of amine degradation in the post combustion capture (PCC) process based on MEA. It mainly takes place in the absorber section (absorber sump and absorber packing) where oxygen concentration is highest but it may also occur in piping leading to the cross exchanger and in the cross exchanger itself due to the presence of dissolved oxygen in the CO2 (rich amine solvent). For oxidative degradation to occur, oxygen with a maximum concentration of 5 vol. % of the flue gas stream must be present [23]. The forming of amine degradation and types of corrosion are presented in Figure 2.
Oxygen degrades the amine solution, while the reaction of MEA with components of the flue gas stream, like NO2 and SOx, lead to the formation of unregenerate heat stable salts in the amine solution. The presence of heat-stable salts can reduce the absorption capacity of an amine solution, as well as increase solution viscosity and solution foaming tendencies. These irreversible reactions may cause many operational problems and also contribute to amine plant corrosion [24,25]. Identification of the possible problems during a hazard and operability study (HAZOP) in an amine-based post-combustion system [26,27] showed that amine degradation is the most frequent reason for equipment and pipe corrosion.
The study of oxidative degradation is still the subject of numerous pieces of research. The role of oxygen on amine degradation has been investigated for decades and first in a publication by Hofmeyer et al. [28] in 1956. They reported that the result of the direct reaction of monoethanolamine with free oxygen and the indirect reaction of oxygen with H2S and MEA leads to the formation of carboxylic acid and amine degradation products called heat-stable salts. Monoethanolamine is subject to degradation when in contact with oxygen. It is more sensitive to oxidation than secondary and tertiary amines. Solvent degradation makes up an estimated 10% of the total operating costs of CO2 capture [29]. Oxidative degradation will occur in a short amount of time in absorber conditions due to the presence of oxygen in the flue gas. High temperatures and carbon dioxide are not needed for amine oxidative degradation. Oxidative degradation of MEA in laboratory conditions is widely discussed [30,31,32]. Sexton and Rochelle’s study [16] showed that the rate of oxidative degradation of amines seems to depend on temperature, the concentrations of amine, metal ions, dissolved oxygen, and CO2 in the solution, and the concentration of impurities in the flue gas. There is also a connection between the amount of oxygen and the presence of sulfur dioxide in the flue gas stream. According to Supap et al. [32] the rate of MEA degradation is increased by approximately 70 times if O2 concentration is raised from 6% to 100% and SO2 is present.
The reaction of MEA with oxygen in laboratory and pilot scale experiments was observed by Moser et al. [18] during 500–5000 h of operation. The study suggest that MEA degradation in pilot plants consists more of oxidative than thermal degradation. Research also shows that more degradation products are observed in samples from the pilot plant at Esbjerg than from lab-scale experiments [33].
Results of MEA degradation from two Australian PCC pilot plants, the black coal plant at Tarong for approximately 700 h of operation, and the brown coal-fired plant at Loy Yang Power for 500 h of operation [34], show that the type of fuel used in the process is of great importance. In the pilot power station at Loy Yang Power much higher concentrations of oxidative products were found during the use of brown coal.
Oxidative degradation is catalysed by iron but research shows [16] that other metals in stainless steel alloys like copper, chromium, nickel, or vanadium may catalyse the oxidative degradation of an MEA solution. The authors suggested that chromium and nickel, combined, have a greater catalytic effect than iron itself.
According to literature, oxidative degradation rates of MEA in industrial applications are predicted to be 0.32–0.80 kg of MEA/Mt of CO2 captured [35]. Laboratory-scale studies have reported that even small quantities of oxygen contained in a gas mixture lead to the formation of oxidative degradation products. Some degradation compounds of MEA, for example N-(2-hydroxyethyl)-glycine (HEGly), can be formed in low concentrations of oxygen [36]. HEGly was identified at 6 vol. % of O2 and was less significant at increasing oxygen concentrations compared to other degradation compounds. Accelerated tests at high oxygen concentrations may not give results that are representative of industrial conditions.
Oxidative and thermal degradation of amines leads to solvent loss, a decrease in the solvent capacity to purify the gas stream, hydrodynamic instability of the operating systems (foaming, increased viscosity etc.), fouling of the heat transfer surfaces, and corrosion of the plant equipment [37].
The oxidative degradation of an MEA solution can be minimalized by adding inhibitors to the systems. There are three main categories of additives that might prevent the oxidative degradation of monoethanolamine [38]:
- -
- O2 scavengers and reaction inhibitors, such us hydroquinone, manganese salts, ascorbic acids, Na2SO3, and formaldehyde;
- -
- chelating agents, such as EDTA, sodium phosphate and Na2S4; or
- -
- stable potassium salts, such as KCl, KBr, and formate.
When corrosion inhibitors are not employed in an MEA solution, oxygen levels of less than 1 ppm(v) are recommended [39].
3. Experimental
3.1. Fossil Fuels Characteristics
The analysis of the flue gas composition from an electric power plant was performed on samples of coal and biomass blends. The Polish hard coal provided by the Sobieski coal mine and biomass of forest and agricultural residue in mass ratio 20/80 were used in this investigation. The amount of biomass mixture in coal-biomass blends was 5–10% by weight.
The research was carried out during the winter (Cw and BCw) and the summer time (Cs and BCs) for hard coals Cw, Cs and coal with biomass blends BCw, BCs. The list of parameters of the fuel samples delivered from the electric power plant are presented in Table 1.
Coal samples had similar values across the presented parameters. In comparison to hard coal samples, biomass contained lower amounts of ash and moisture. Biomass samples had also a low heating value and low amounts of carbon and total sulfur. For that reason co-firing of biomass with coal in pulverized coal fired power plants can reduce SOx emission level. Studies by researchers [40] have also shown that with the increase of biomass content the decrease of NOx takes place. The volatile products present in the biomass particles promote the reduction reactions that cause the decrease of emission level of NOx.
Our previous study on physicochemical parameters of different kinds of fuel during their gasification [41] showed that the oxygen content in biomass (31–36 wt. %) was higher than in others fuels: lignite (16–20 wt. %) and hard coal (7–13 wt. %). Parameters of experiments during testing with coal-biomass blends (25–50 wt. %) [42] proved that the composition of the flue gas also depends on the temperature and time of combustion.
3.2. Data Analysis
The research was carried out at an electric power plant, Jaworzno III—TAURON Wytwarzanie SA, in 2013 and 2014 during the winter and summer seasons. Detailed data about the type of fuel, time of measurements (in the configuration: year, month, day and hour) and the components of the flue gas stream were collected. The data contained the concentration of oxygen, SO2, NOx, and fly ash. All the parameters were analysed during the study, but the greatest focus was placed on the probability of monoethanolamine oxidative degradation in the CO2 capture process.
The number of operable days taken into account in the analysis were: 29 for Cw, 25 for Cs, 30 for BCw and 28 for BCs. The number of days depended on the time that the electric power plant was operating.
The flue gas component concentrations obtained from the Jaworzno III power plant that were presented in the manuscript were not raw values. They had already been compared to the emission standards defined in Polish law, concerning their compliance with the Ordinance of the Minister of Environment [43].
According to the aforementioned regulation, the concentrations of substances in flue gases are to be given in mg·Nm3, where “Nm3” means cubic metre of air at the normal conditions (temperature of 25 °C, pressure of 101.3 kPa). SO2 and NOx concentration values were calculated using the following formula:
where:
- —substance concentration in flue gas at standard oxygen content in flue gas, mg·Nm3;
- —measured substance concentration in flue gas, mg·Nm3;
- —standard oxygen content in flue gas, vol. % (; and
- —measured oxygen content in flue gas, %.
4. Results
The analysis was performed based on real data obtained directly from a coal-fired power plant. The monthly averages for values of chosen flue gas component impurities such as SO2, NOx, oxygen, and fly ash, whose presence influences MEA degradation, as well as power plant data have been presented in Table 2. These results show the flue gas composition at the boiler outlet in two coal-fired power plant blocks, Block 1 and Block 2 (FGD inlet), and at the outlet of the flue gas desulfurization installation (FGD outlet). The flue gas streams from blocks 1 and 2 had been combined before entering to FGD unit.
The analysis of the data obtained at the boiler outlet has shown that the flue gas component concentrations are comparable for both installation blocks and for all four tests. Comparing the winter and summer seasons, it has been observed that slightly lower O2, SO2, and NOx concentration values were obtained at the boiler outlet in the case of coal and biomass blends. However, these differences are insignificant enough that they would have no influence on the CO2 removal process through the use of the chemical absorption method with the use of MEA. Comparing the flue gas component concentration values at the FGD installation outlet, it has been concluded that the oxygen concentration values during pure coal tests were approximately two times higher: 10.1 for Cw compared to 6.8 for BCw and 13.4 for Cs compared to 6.6 for BCs. Such a high concentration of oxygen in the flue gas stream at the CO2 capture installation absorber inlet is the cause of irreversible oxidative degradation; therefore, the permissible level of oxygen must be established at a maximum of 5 vol. %.
Data obtained from the power plant also made it possible to determine the influence of the time of day and night on the concentration values of specific flue gas components.
4.1. SO2, NOx and Fly Ash Concentration
Figure 3a,b present the SO2 and NOx average hourly concentration of analysis results for the summer season for pure coal (Cs) and the coal and biomass blends (BCs). The analysis presents the gas concentration dependence on the electric power plant after the desulfurization process.
Sulphur and nitrogen oxide concentrations are not homogeneous and may undergo major or minor changes over a twenty-four hour period of time. A considerable dependence of the emitted SO2 quantities on the coal plant power output was observed. The concentration value of this oxide, mg·Nm3, was within the following range: 77.4–250.5 (Cs) and 112.5–236.5 (BCs), while the power plant output, 106 kg·m2·s−3, amounted to, respectively: 205–317.2 (Cs) and 191.8–259.2 (BCs). The measured NOx concentration value did not exhibit as significant a dependence on the power plant output and was within the range of 279.0–334.5 and 205.3–317.2, mg·Nm3, respectively for samples Cs and BCs. Flue gases generated as a result of pure coal, as well as coal and biomass blend firing, both required a prior removal of their excess amounts during the flue gas purification process.
It must be observed that, in order to avoid CO2 capture installation corrosion, the concentration of SO2 and NOx must be limited to 10 mg·Nm3. This is why the presented results may not be employed for a direct MEA degradation rate evaluation, but only for the emission comparison of these components in relation to the employed fuel type and power plant work time.
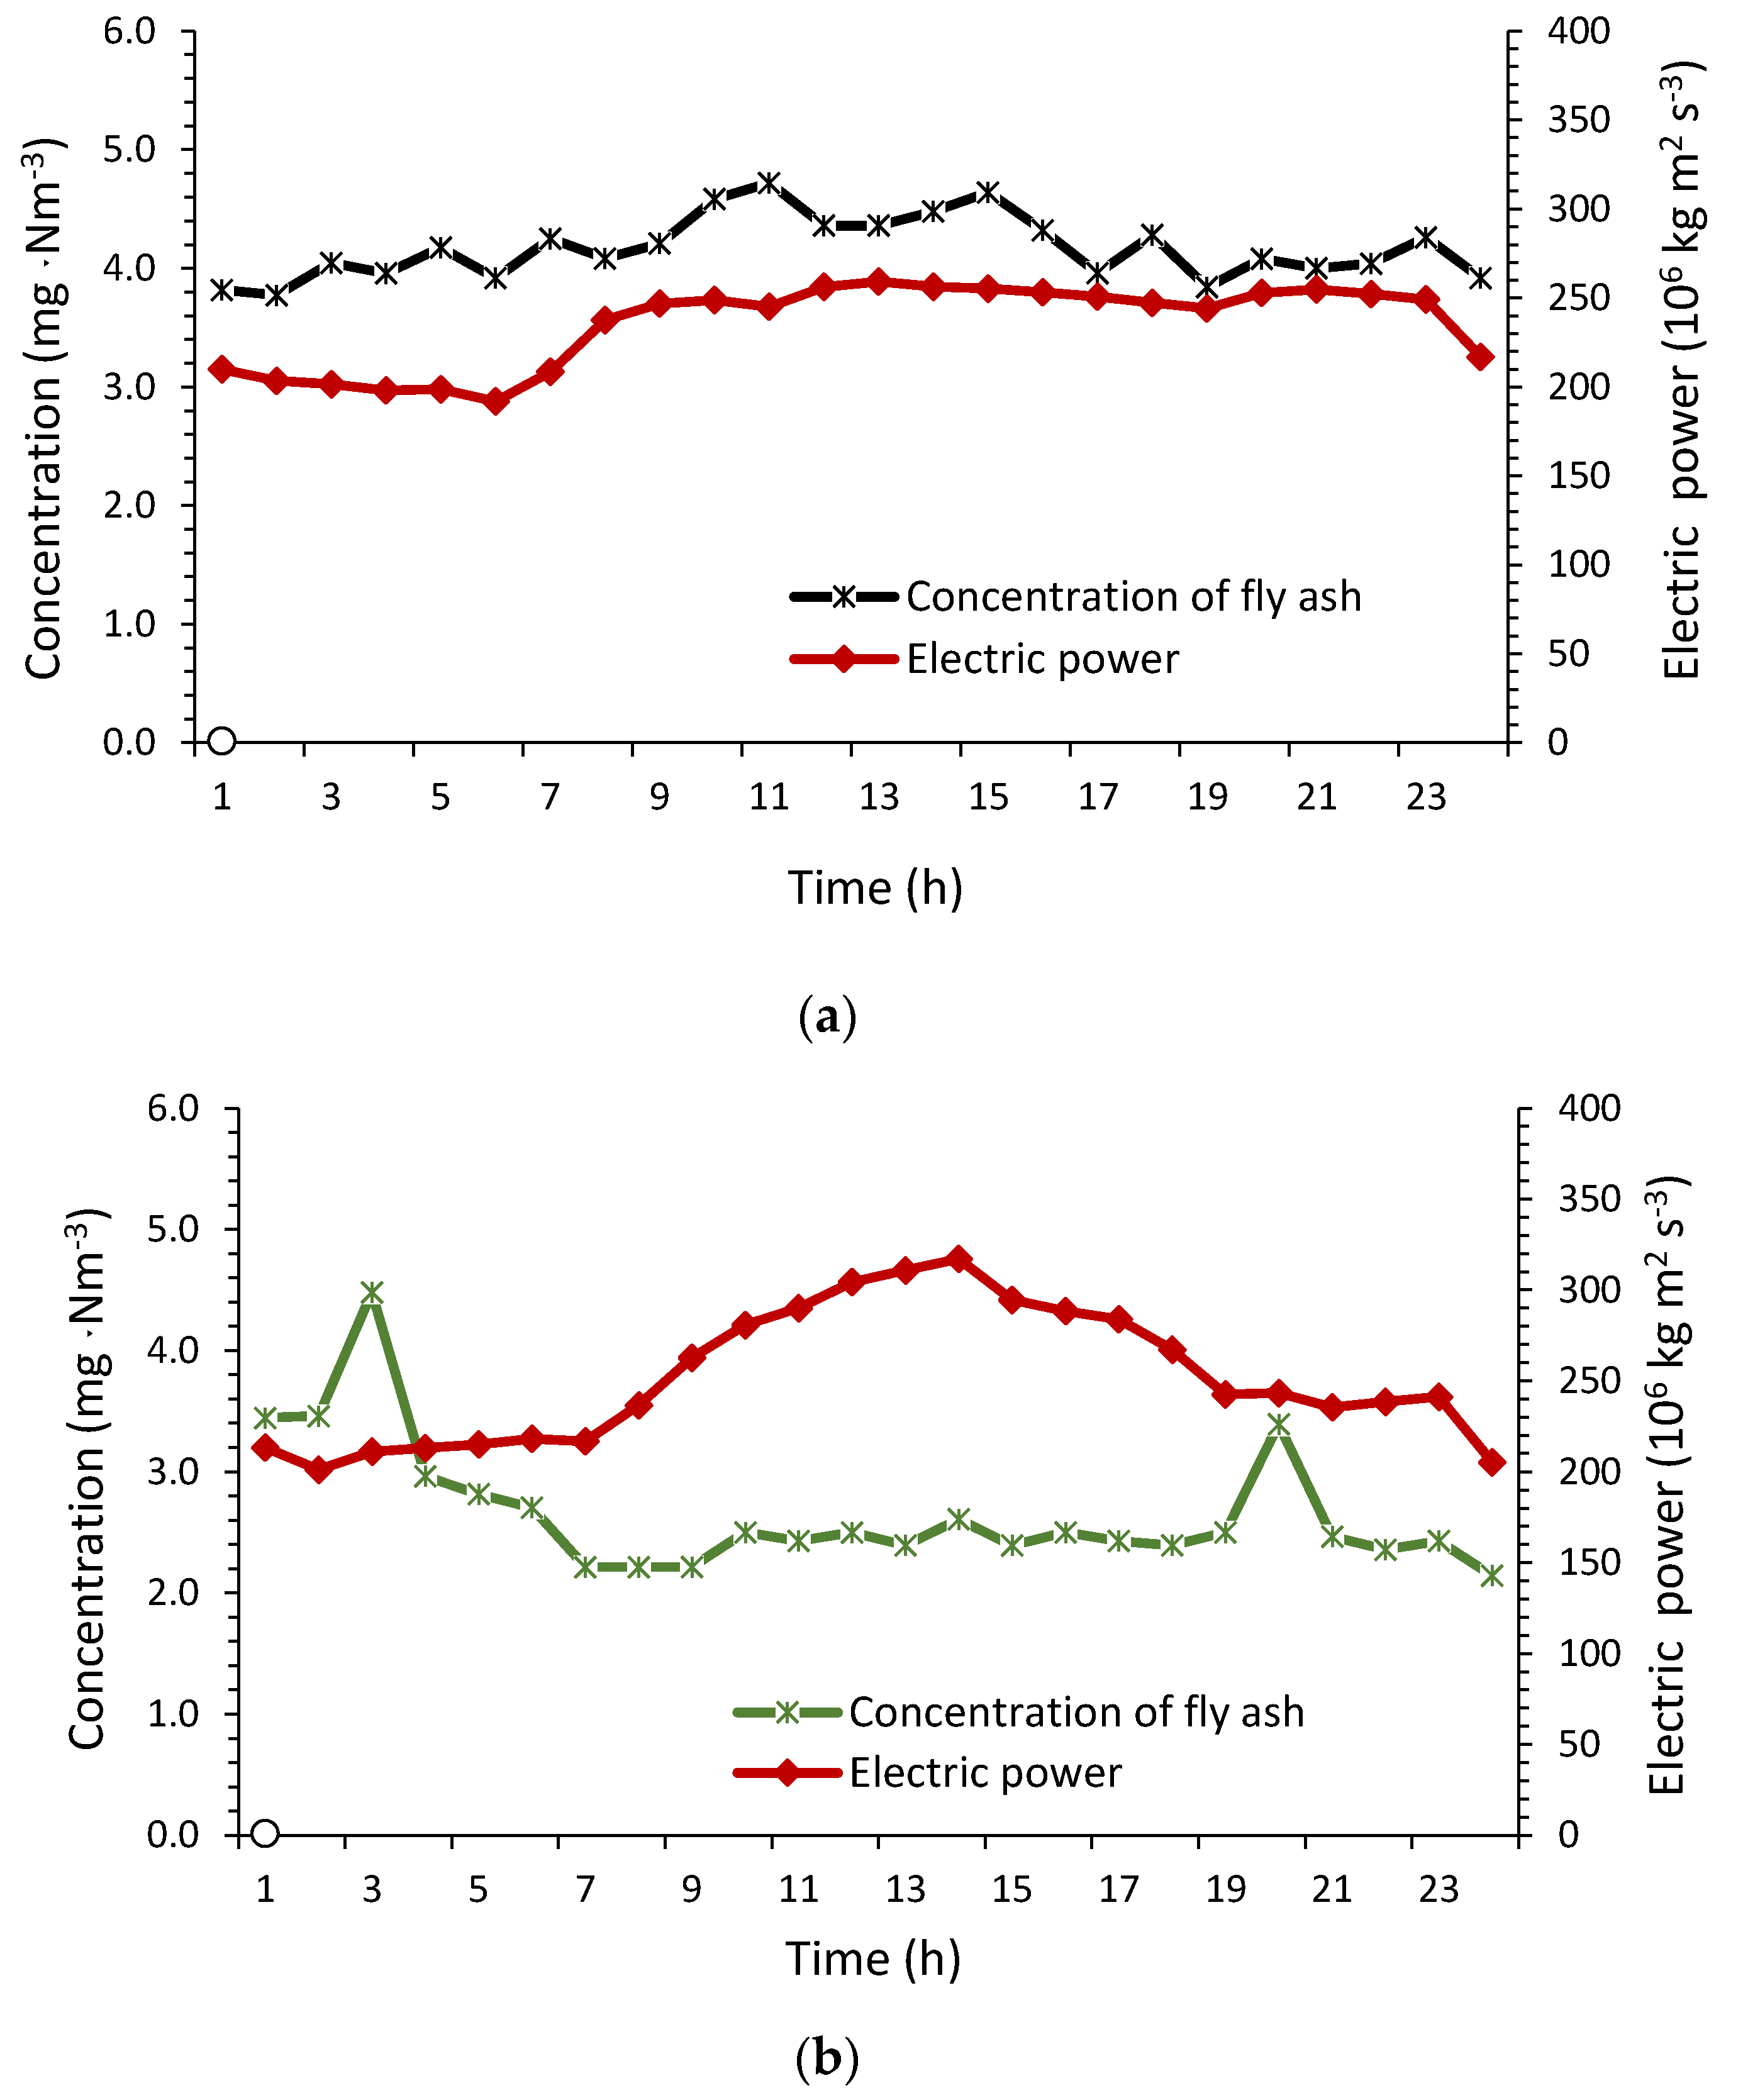
The observed fly ash emissions to the atmosphere during the studied time period typically did not exceed a concentration of 5 mg·Nm3 and did not exhibit a significant dependence on power plant output, unlike the case of SO2. The fly ash concentration values were within the following range: 3.8–4.7 (Cs) and 2.1–4.5 (BCs). The observed greater concentration deviations for the coal and biomass sample (Figure 4a,b) were a result of brief fly ash concentration increase occurrences, even as much as over 20 mg·Nm3.
4.2. Oxygen Concentration
Analyses of the daily average of oxygen concentration in the flue gas stream after the FGD process showed significant differences between the samples (Table 3). The oxygen concentration depends on the type of fossil fuel used in the combustion process and the time of the year.
Tests on biomass blends BCw and BCs showed that there is a lower concentration of oxygen in flue gas streams then the tests conducted on coal samples Cs and Cw. Similar results were obtained also related to SO2, NOx, and fly ash (Table 1).
The highest range of oxygen concentration in the flue gas stream, from 11.8% to 14.4 vol. %, was observed during the summer season for coal Cs. The average value for sample Cw (9.2–12.2 vol. %) was almost twice as high as that of coal with biomass BCw (5.7–8.1 vol. %) measured for the same season of the year. The oxygen concentration of sample BCs (5.2–10.6 vol. %) was 1.5 times lower than sample Cs.
The power plant output during its studied periods of operation, as presented in Table 4, was similar for Cs (136.2–397.3), Cw (141.5–391.6), BCs (120.1–374.1), and BCw (148.3–366.4). This shows that the power plant output could not have had an influence on the quantities of oxygen emitted to the flue gas, as it might have been assumed when inspecting the SO2 emission data.
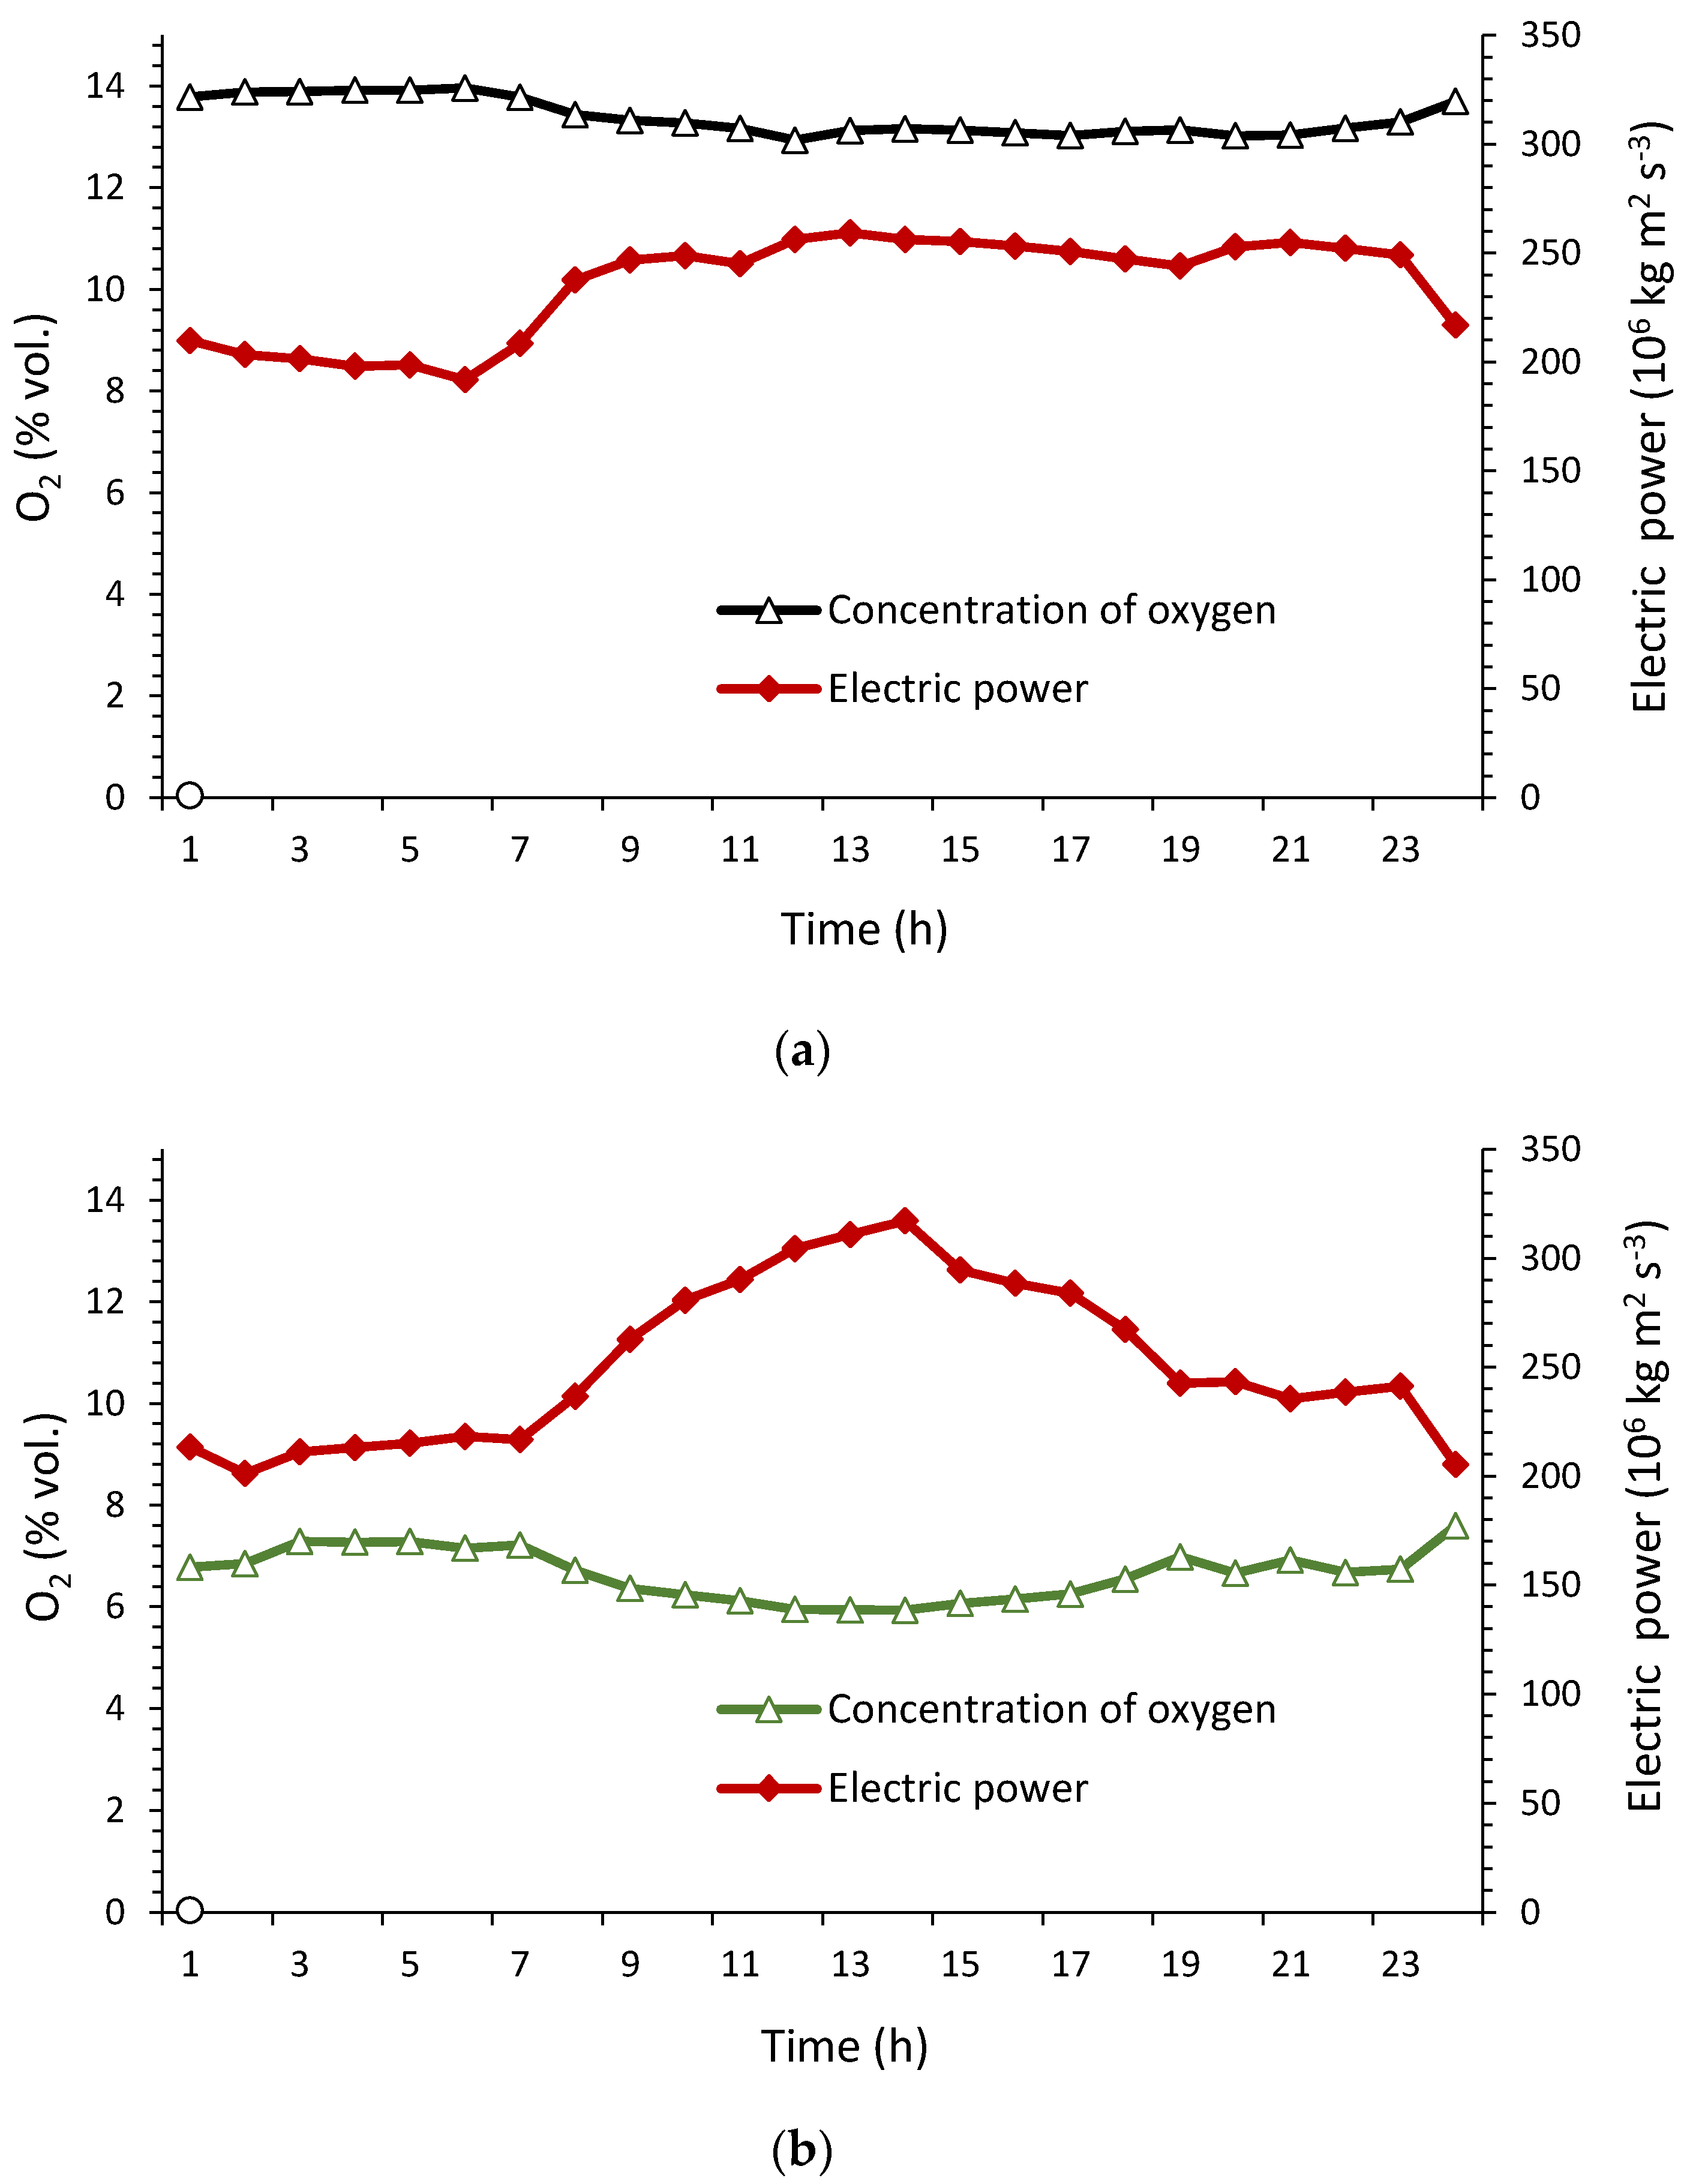
The range of oxygen concentration between during 24 h period was given as a monthly average for fuel samples and gave the values of, respectively: Cw (9.3–11.1 vol. %); Cs (12.9–13.9 vol. %); BCw (6.3–7.4 vol. %), and BCs (5.9–7.6 vol. %). Dependence of the power plant’s actual output on the oxygen concentration for samples Cs and BCs is presented in Figure 5a,b respectively.
The analysis of data presented in Figure 5a,b shows that the oxygen concentration increase in flue gas exhibits an inversely proportional tendency compared to power plant output.
Contrary to the measurements of the hourly average SO2 concentration in flue gases, the actual content of oxygen does not depend on the power plant’s output and it is stable throughout the analysed period.
Statistical analyses concerning the correlations between oxygen concentrations as twenty-four hour functions of time for all four samples (Cs, BCs, Cw and BCw) was conducted.
First, the normality of the O2 was checked by means of the Anderson-Darling Test, and a p-value lower than 0.05 was obtained, confirming that data does not follow a normal distribution. In order to achieve normality, a Box-Cox transformation was applied. The p-value of the Anderson-Darling Test for the transformed variable, indicates that it does not follow a normal distribution either and, therefore, the use of parametric tests was discarded. A non-parametric Kruskal-Wallis Test was conducted to the original variable. As the p-value was under 0.05, it can be established that there are significant differences between the median values of the original data for some hours of the days. In order to explore these differences from a graphical point of view, it is reasonable to use a monthly average value for each hour. In the next step, a confidence interval (CI) was plotted with a confidence level of 95% of the variable. The pooled standard deviation was used to calculate the intervals. It can be observed that there are significant differences between the confidence intervals of the mean values for different hours (Figure 6).
The purpose of the statistical analysis was to show how the mean oxygen level changes through the day. A graph as the one in Figure 6, that represents mean values and 95% confidence intervals allows, on the one hand, to see the evolution of the average values and, on the other, also to follow the variance of data.
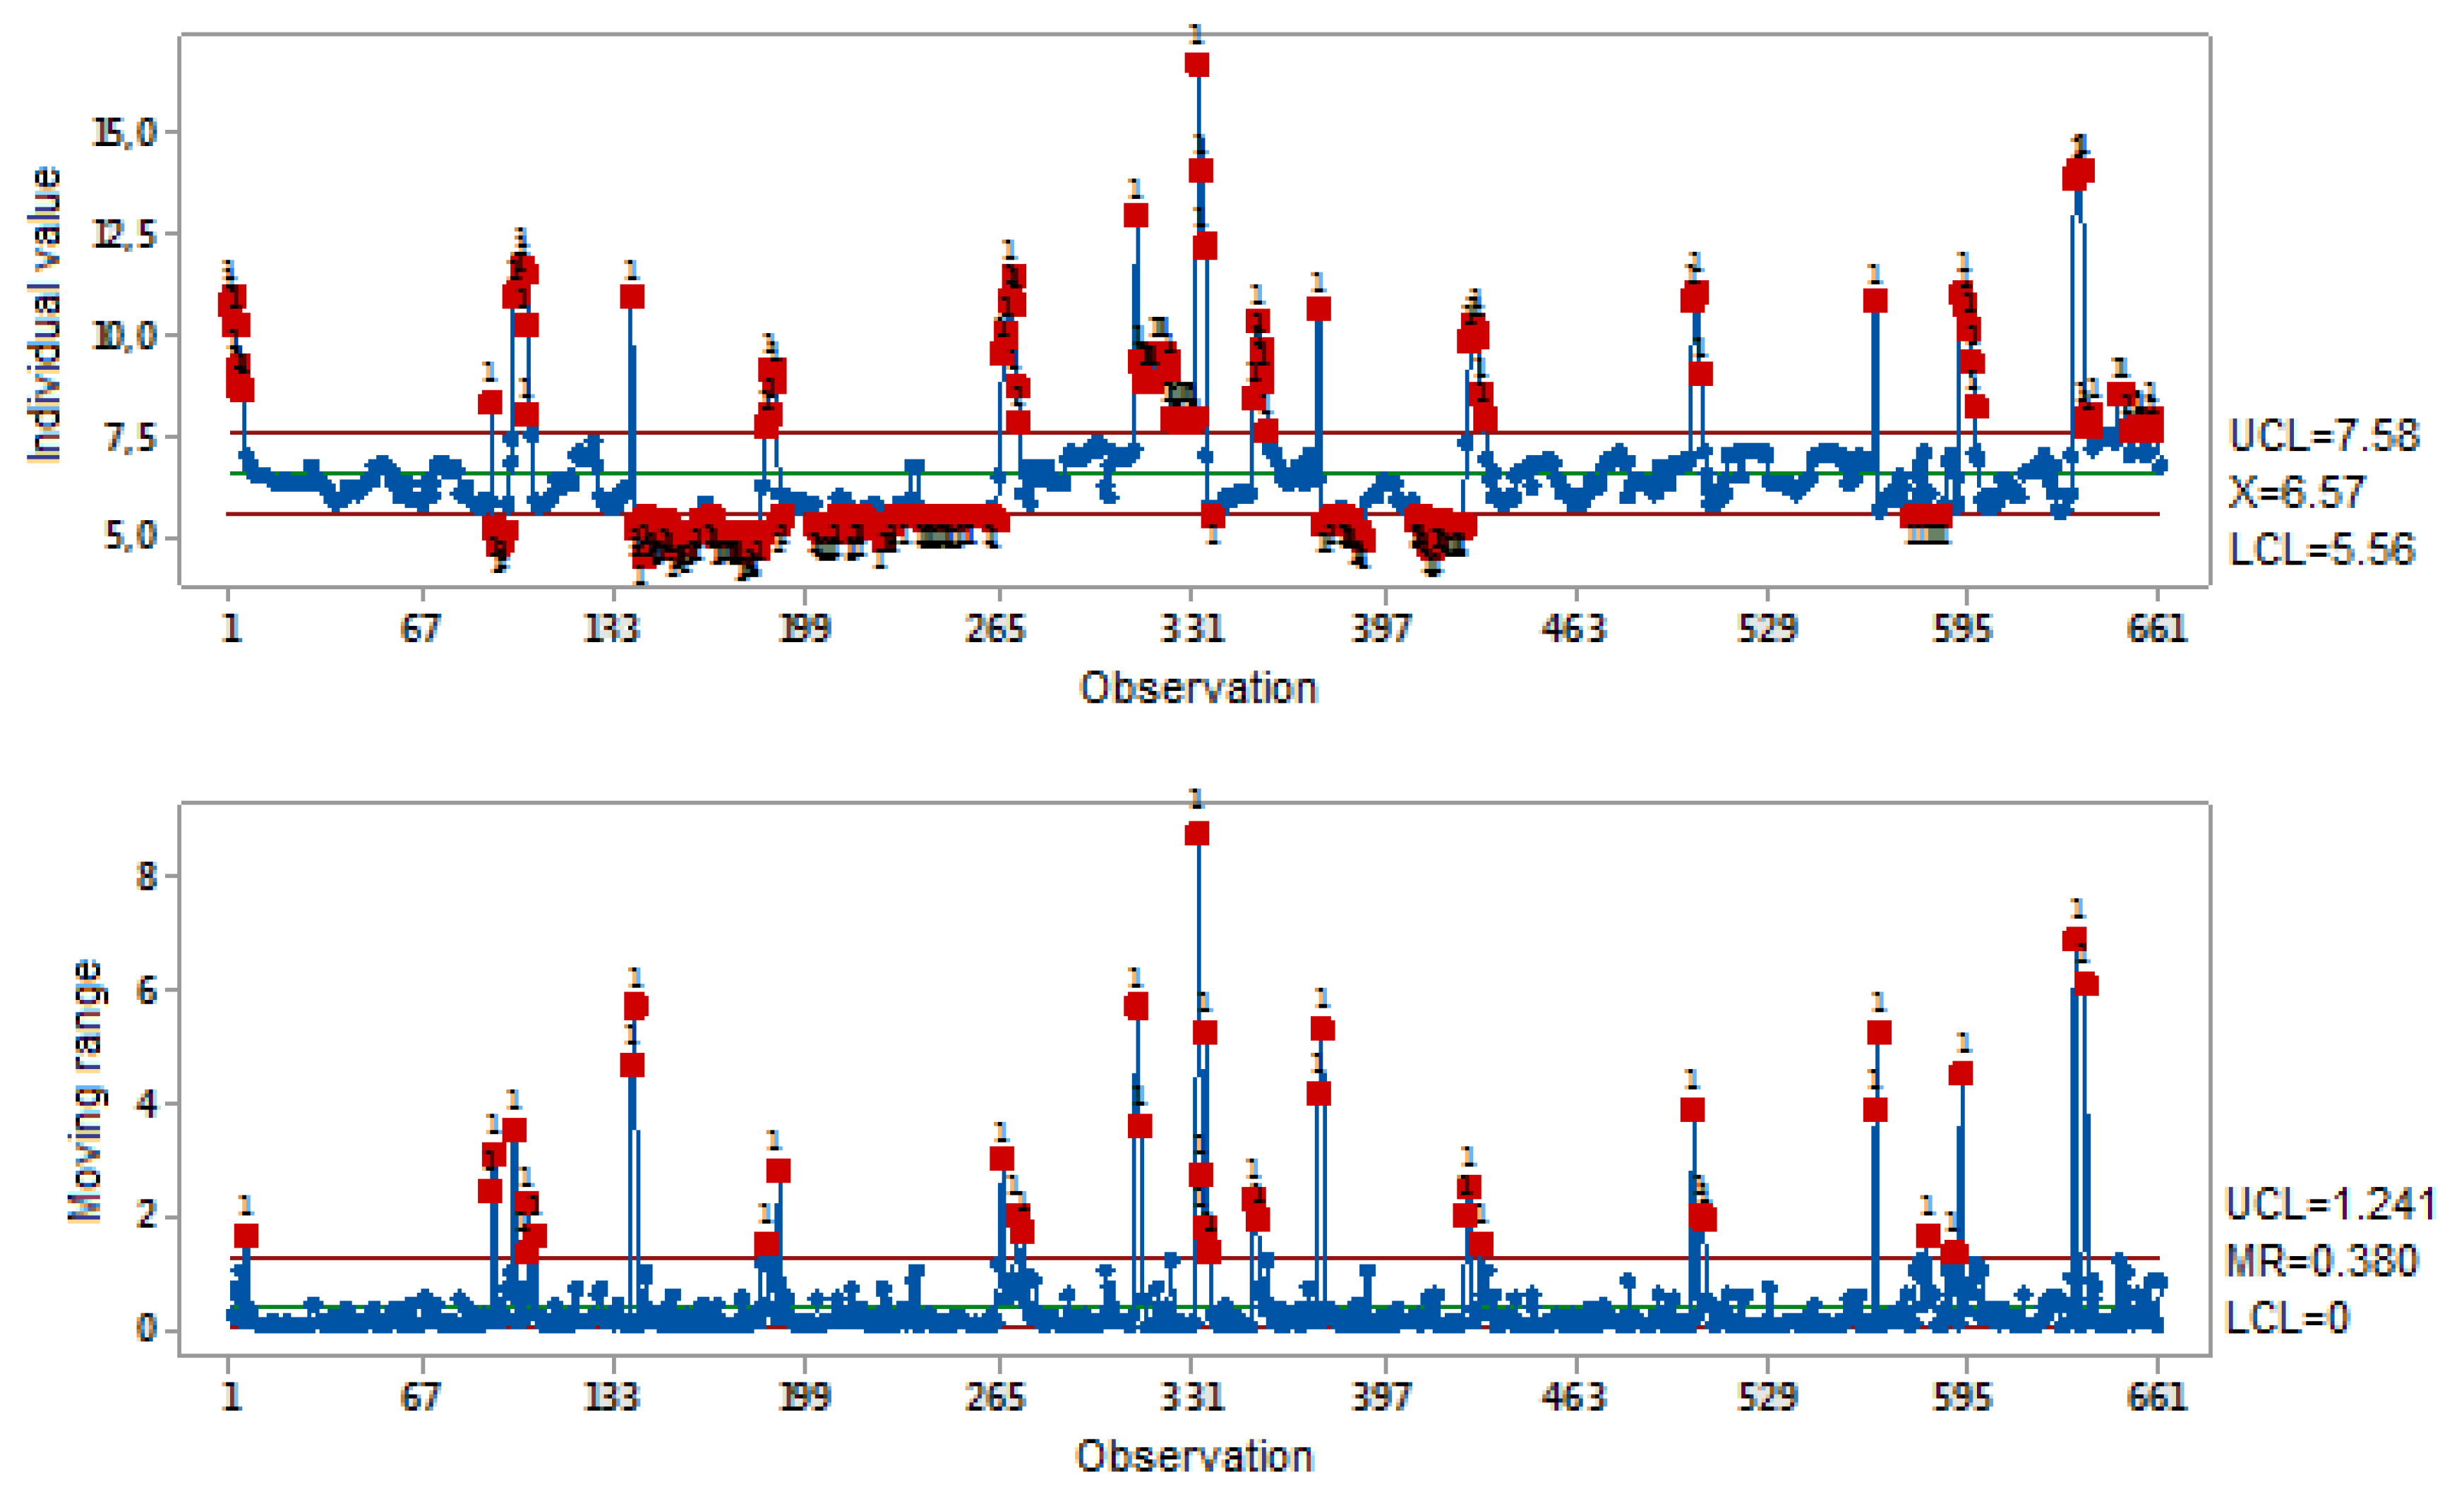
Finally, when creating individual and moving range charts (moving range is the absolute value of the difference between one value and the previous one) it can be seen that the process mean is not stable (Figure 7). This allows us to say that the difference between different hours’ emissions are not a random phenomenon. Many points are out of control limits UCL and LCL in the individual chart.
5. Discussion
The performed composition analysis of gases emitted during coal and biomass co-firing (at a volume of up to 5–10%) did not exhibit significant differences in their compositions and, consequently, no increased biomass influence on the amine degradation process. The oxygen content at the power boiler outlet, which leads to amine degradation, is comparable for coal and its mixture with biomass, and is safe for the CO2 removal process (Table 1). These study results indicate a positive effect of utilizing the CO2 removal method during the coal and biomass co-firing process.
Our analysis shows that significant care must be given regarding the quantity of oxygen that is emitted following the flue gas desulfurization process. During the CO2 capture process using the post-combustion method, it is important that the oxygen content in flue gas does not exceed 5 vol. %.
It was observed that, while biomass was co-fired with hard coal, the flue gas after the FGD process contained much less oxygen than after coal combustion. The reason for this is the application of limestone for flue gas desulfurization. The FGD system based on SO2 absorption in dissolved lime (CaO) or limestone (CaCO3) was designed to produce gypsum as a commercial product. During the limestone wet scrubber process, SO2 absorbed in the recirculated slurry reacts with dissolved limestone (CaCO3) to form calcium sulphite hydrate (gypsum). For the conversion of calcium carbonate into calcium sulphate dehydrate, i.e., synthetic gypsum, the air blowing is used. The following two reactions show from the chemical point of view the process:
SO2 + CaCO3→CaSO3 + CO2
SO2 + CaSO3 + 0.5O2 + 2H2O→CaSO4·2H2O (gypsum) + CO2
Lower content of oxygen in the gas stream from biomass blends after desulfurization may result from a lower content of sulphur oxides in the flue gases and a lower rate of air needed for the production of gypsum in the final phase of the oxidation reaction.
The oxygen content in the flue gas stream following the FGD process is not precisely monitored and it changes over the time of power plant operation. As can be seen in Table 4, the oxygen content may briefly exceed even 14%. Despite the fact that the process is not continuous, amine degradation occurs very quickly and is irreversible. Flue gas mixtures subjected to the carbon dioxide capture process should be carefully monitored from the point of view of oxidative degradation risks.
6. Conclusions
Co-firing biomass fuels with coal allow the reduction of CO2 emissions from existing coal-fired power plants because biomass is a CO2 neutral fuel. An important observation from the obtained data in this work is that the type of fuel used for combustion may not have a significant impact on the rate of degradation of the MEA solution and, subsequently, on corrosion of the CO2 capture installation. It is obvious that biomass is characterized by a higher oxygen content than coal fuel. Nevertheless, the flue gas composition at the power boiler outlet for coal is comparable to the coal and biomass blend. However, the flue gas composition analysis at the Jaworzno III Tauron Wytwarzanie SA power plant shows that the desulfurization process (i.e., FGD process based on wet scrubbers) may increase the risk of MEA oxidative degradation. It has been observed that the flue gas at the FGD installation outlet during biomass and coal co-firing had lower oxygen content than the flue gas originating from pure coal combustion.
The monthly average oxygen concentration in the flue gas stream for test samples with coal in winter and summer seasons were 10.1 vol. % and 13.4 vol. %, respectively. The amount of oxygen in coal with biomass samples was as much as two times lower, at 6.8 vol. % and 6.6 vol. %.
It was also observed that the content of SO2, NOx, or fly ash increases when the power plant operates at peak capacity, i.e., during winter and peak hours. No such relationship was found for oxygen.
These results may be useful when optimizing CO2 capture by amine methods as it can lower the risk of corrosion in installations. An additional advantage of using biomass fuel over coal is a negligible amount of sulphur compounds in the exhaust gases, which reduces the cost of sulphur oxides removal. To determine the degradation rate of amine solution and demonstrate the difference in relation to the type of fuel used requires further research.
Acknowledgments
The research was supported by the Polish Ministry of Science and Higher Education under contract No. 3989/E-263/SPUB/2015/1, Task: 11210355-143. The authors are in debt with TAURON Wytwarzanie SA Company for providing the information that made this research possible.
Author Contributions
A.W.-R., A.S. and A.K. conceived and designed the experiments; A.W.-R. and F.S.L. analyzed the data; A.W.-R., A.S. and A.K. wrote the paper.
Conflicts of Interest
The authors declare no conflict of interest.
References
- The European Parliament; Council of the European Union. Directive 2001/80/EC of 23 October 2001 on the Limitation of Emissions of Certain Pollutiants into the Air from Large Combustion Plants; Council of the European Union: Brussels, Belgium, 2001. [Google Scholar]
- Intergovernmental Panel on Climate Change (IPCC). IPCC Special Report on Carbon Dioxide Capture and Storage: Prepared by Working Group III of the Intergovernmental Panel on Climate Change; Metz, B., Davidson, O., de Coninck, H.C., Loos, M., Meyer, L.A., Eds.; Cambridge University Press: Cambridge, UK; New York, NY, USA, 2005. [Google Scholar]
- Global CCS Institute. The Global Status of CCS|2013; Global CCS Institute: Melbourne, Australia, 2013. [Google Scholar]
- Baj, S.; Siewniak, A.; Chrobok, A.; Krawczyk, T.; Sobolewski, A. Monoethanolamine and ionic liquid aqueous solutions as effective systems for CO2 capture. J. Chem. Technol. Biotechnol. 2013, 88, 1220–1227. [Google Scholar] [CrossRef]
- Sistla, Y.S.; Khanna, A. CO2 absorption studies in amino acid-anion based ionic liquids. Chem. Eng. J. 2015, 273, 268–276. [Google Scholar] [CrossRef]
- Tobiesen, F.A.; Svendsen, H.F.; Hoff, K.A. Desorber energy consumption amine based absorption plants. Int. J. Green Energy 2005, 2, 201–215. [Google Scholar] [CrossRef]
- Mills, S. Coal-Fired CCS Demonstration Plants, 2012; IEA Clean Coal Centre: London, UK, 2012. [Google Scholar]
- Więcław-Solny, L.; Krótki, A.; Tatarczuk, A.; Stec, M. Operational experiences of different scale Carbon Capture plants. Polityka Energy Energy Policy J. 2014, 17, 393–404. (In Polish) [Google Scholar]
- Krótki, A.; Tatarczuk, A.; Więcław-Solny, L.; Stec, M.; Sobolewski, A.; Tokarski, S. CO2 amine absorption as an oportunity to reduce emission from domestic coal-fired power plants. Przem. Chem. 2014, 12, 2241–2245. [Google Scholar]
- Supap, T.; Saiwan, C.; Idem, R. Part 2: Solvent management: Solvent stability and amine degradation in CO2 capture processes. Carbon Manag. 2011, 2, 551–566. [Google Scholar] [CrossRef]
- Islam, M.N.S.; Yusoff, R.; Ali, B.S.; Chakrabarti, M.H. Degradation studies of amines and alkanolamines during sour gas treatment process. Int. J. Phys. Sci. 2011, 6, 5883–5895. [Google Scholar]
- Irons, R.; Sekkapan, G.; Panesar, R.; Gibbins, J.; Lucquiaud, M. CO2 Capture Ready Plants; Technical Report 2007/4; IEA Greenhouse Gas R&D Programme: Cheltenham, UK, 2007. [Google Scholar]
- Léonard, G.; Voice, A.; Toye, D.; Heyen, G. Influence of dissolved metals and oxidative degradation inhibitors on the oxidative and thermal degradation of monoethanolamine in postcombustion CO2 capture. Ind. Eng. Chem. Res. 2014, 53, 18121–18129. [Google Scholar] [CrossRef]
- Nikolic, H.; Frimpong, R.A.; Liu, K. Trace metals accumulation in a coal-fired post combustion CO2 capture process with amine-based solvents. Int. J. Greenh. Gas Control 2015, 42, 59–65. [Google Scholar] [CrossRef]
- Adams, D. Flue Gas Treatment for CO2 Capture; IEA Clean Coal Centre: London, UK, 2010. [Google Scholar]
- Sexton, A.J.; Rochelle, G.T. Catalysts and inhibitors for oxidative degradation of monoethanolamine. Int. J. Greenh. Gas Control 2009, 3, 704–711. [Google Scholar] [CrossRef]
- De Vroey, S.; Huynh, H.; Lepaumier, H.; Absil, P.; Thielens, M.L. Corrosion investigations in 2-ethanolamine based post-combustion CO2 capture pilot plants. Energy Procedia 2013, 37, 2047–2057. [Google Scholar] [CrossRef]
- Moser, P.; Schmidt, S.; Sieder, G.; Garcia, H.; Stoffregen, T. Performance of MEA in a long-term test at the post-combustion capture pilot plant in Niederaussem. Int. J. Greenh. Gas Control 2011, 5, 620–627. [Google Scholar] [CrossRef]
- Cousins, A.; Ilyushechkin, A.; Pearson, P.; Cottrell, A.; Huang, S.; Feron, P.H.M. Corrosion coupon evaluation under pilot-scale CO2 capture conditions at an Australian coal-fired power station. Greenh. Gases Sci. Technol. 2013, 3, 169–184. [Google Scholar] [CrossRef]
- EBTP-ZEP. Biomass with CO2 Capture and Storage (Bio-CCS) the Way Forward for Europe; JTF Bio-CCS: Rueil-Malmaison, France, 2014. [Google Scholar]
- Kittel, J.; Idem, R.; Gelowitz, D.; Tontiwachwuthikul, P.; Parrain, G.; Bonneau, A. Corrosion in MEA units for CO2 capture: Pilot plant studies. Energy Procedia 2009, 1, 791–797. [Google Scholar] [CrossRef]
- Lee, J.-Y.; Keener, T.C.; Yang, Y.J. Potential flue gas impurities in carbon dioxide streams separated from coal-fired power plants. J. Air Waste Manag. Assoc. 2009, 59, 725–732. [Google Scholar] [CrossRef] [PubMed]
- Davidson, R.M. Post-Combustion Carbon Capture from Coal Fired Plants—Solvent Scrubbing; IEA Clean Coal Centre: London, UK, 2007. [Google Scholar]
- Kittel, J.; Fleury, E.; Vuillemin, B.; Gonzalez, S.; Ropital, F.; Oltra, R. Corrosion in alkanolamine used for acid gas removal: From natural gas processing to CO2 capture. Mater. Corros. 2012, 63, 223–230. [Google Scholar] [CrossRef]
- Kohl, A.L.; Nielsen, R.B. Gas Purification, 5th ed.; Gulf Publishing Company: Houston, TX, USA, 1997. [Google Scholar]
- Krzemień, A.; Więckol-Ryk, A.; Duda, A.; Koteras, A. Risk assessment of a post-combustion and amine-based CO2 Capture Ready Process. J. Sustain. Min. 2013, 12, 18–23. [Google Scholar] [CrossRef]
- Krzemień, A.; Więckol-Ryk, A.; Smoliński, A.; Koteras, A.; Więcław-Solny, L. Journal of loss prevention in the process industries assessing the risk of corrosion in amine-based CO2 capture process. J. Loss Prev. Process Ind. 2016, 43, 189–197. [Google Scholar] [CrossRef]
- Hofmeyer, B.; Scholten, H.G.; Lloyd, W.G. Contamination and corrosion in monoethanolamine gas treating solutions. In Proceedings of the Symposium on Chemicals from Petroleum, Dallas, TX, USA, 8–13 April 1956. [Google Scholar]
- Rao, A.B.; Rubin, E.S. A technical economic and environmental assessment of amine-based CO2 capture technology for power plant greenhouse gas control. Environ. Sci. Technol. 2002, 36, 4467–4475. [Google Scholar] [CrossRef] [PubMed]
- Chi, S.; Rochelle, G. Oxidative degradation of monoethanolamine. Ind. Eng. Chem. Res. 2002, 41, 4178–4186. [Google Scholar] [CrossRef]
- Liu, H.; Namjoshi, O.A.; Rochelle, G.T. Oxidative degradation of amine solvents for CO2 capture. Energy Procedia 2014, 63, 1546–1557. [Google Scholar] [CrossRef]
- Supap, T.; Idem, R.; Tontiwachwuthikul, P.; Saiwan, C. Kinetics of sulfur dioxide-and oxygen-induced degradation of aqueous monoethanolamine solution during CO2 absorption from power plant flue gas streams. Int. J. Greenh. Gas Control 2009, 3, 133–142. [Google Scholar] [CrossRef]
- Lepaumier, H.; Da Silva, E.F.; Einbu, A.; Grimstvedt, A.; Knudsen, J.N.; Zahlsen, K.; Svendsen, H.F. Comparison of MEA degradation in pilot-scale with lab-scale experiments. Energy Procedia 2011, 4, 1652–1655. [Google Scholar] [CrossRef]
- Reynolds, A.J.; Verheyen, T.V.; Adeloju, S.B.; Meuleman, E.; Chaffee, A.; Cottrell, A.J.; Feron, P. Chemical characterization of MEA degradation in PCC pilot plants operating in Australia. Energy Procedia 2013, 37, 877–882. [Google Scholar] [CrossRef]
- Goff, G.S.; Rochelle, G.T. Monoethanolamine degradation: O2 mass transfer effects under CO2 capture conditions. Ind. Eng. Chem. Res. 2004, 43, 6400–6408. [Google Scholar] [CrossRef]
- Vevelstad, S.J.; Grimstvedt, A.; Einbu, A.; Knuutila, H.; da Silva, E.F.; Svendsen, H.F. Oxidative degradation of amines using a closed batch system. Int. J. Greenh. Gas Control 2013, 18, 1–14. [Google Scholar] [CrossRef]
- Thong, D.; Dave, N.; Feron, P.; Merched, A. Environmental Impact of Amine-Based CO2 Post Combustion Capture (PCC) Process; Report to ANLECR&D; Commonwealth Scientific and Industrial Research Organisation (CSIRO): Canberra, Australia, 2012. [Google Scholar]
- Goff, G.S.; Rochelle, G.T. Oxidation inhibitors for copper and iron catalyzed degradation of monoethanolamine in CO2 capture processes. Ind. Eng. Chem. Res. 2006, 45, 2513–2521. [Google Scholar] [CrossRef]
- Riemer, P.; Audus, H.; Smith, A. Carbon Dioxide Capture from Power Stations; IEA Greenhouse Gas R&D Programme: Cheltenham, UK, 1993. [Google Scholar]
- Narayanan, K.V.; Natarajan, E. Experimental studies on cofiring of coal and biomass blends in India. Renew. Energy 2007, 32, 2548–2558. [Google Scholar] [CrossRef]
- Smoliński, A.; Howaniec, N.; Stańczyk, K. A comparative experimental study of biomass, lignite and hard coal steam gasification. Renew. Energy 2011, 36, 1836–1842. [Google Scholar] [CrossRef]
- Heinzel, T.; Siegle, V.; Spliethoff, H.; Hein, K.R.G. Investigation of slagging in pulverized fuel co-combustion of biomass and coal at a pilot-scale test facility. Fuel Process. Technol. 1998, 54, 109–125. [Google Scholar] [CrossRef]
- Regulation of the Minister of Environment of 7 November 2014, Concerning Emission Standards for Certain Types of Installations, Fuel Combustion Sources and Waste Firing or Co-Firing Systems. Available online: http://www.dziennikustaw.gov.pl/du/2014/1546/1 (accessed on 19 March 2018).
Figure 1.
The areas of the amine solution degradation in CO2 capture installation.

Figure 2.
Diagram of amine degradation and corrosion in PCC carbon process based on MEA.

Figure 3.
Hourly average of SO2 and NOx concentration in the flue gas stream at outlet of the FGD absorber during summer season: (a) sample Cs, and (b) sample BCs.
Figure 3.
Hourly average of SO2 and NOx concentration in the flue gas stream at outlet of the FGD absorber during summer season: (a) sample Cs, and (b) sample BCs.
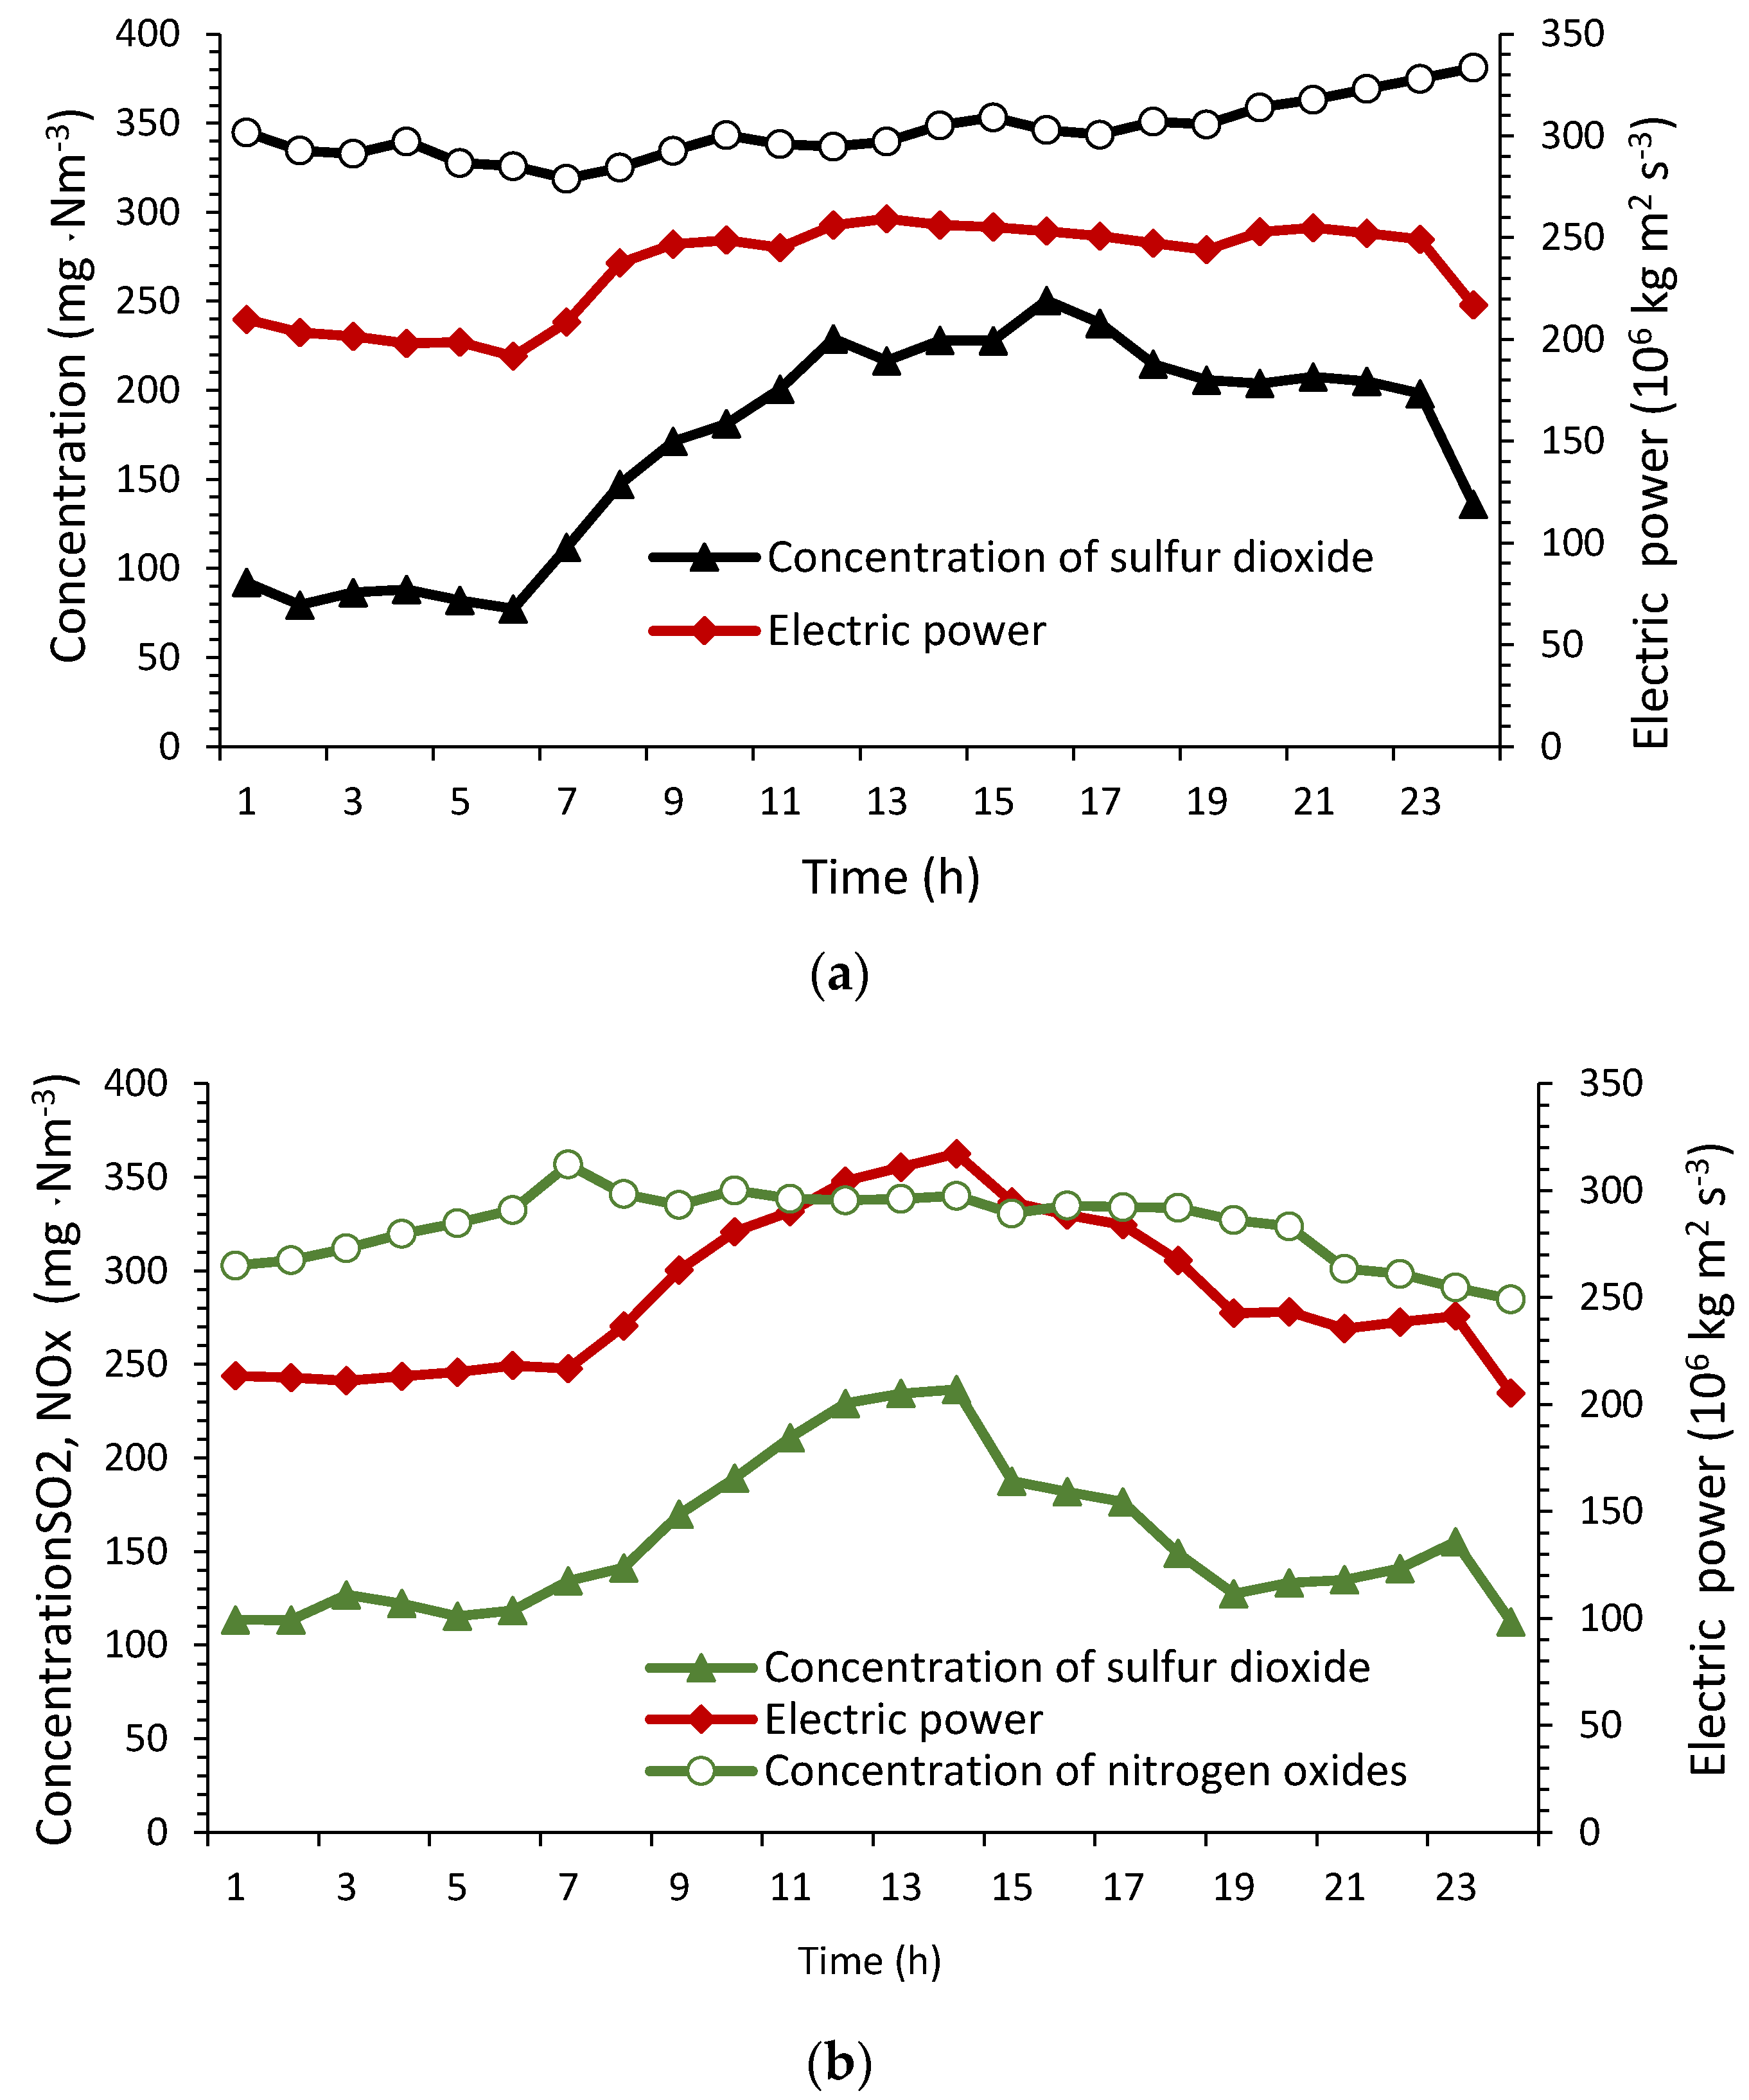
Figure 4.
Hourly average of fly ash concentration in the flue gas stream at outlet of the FGD absorber during summer season: (a) sample Cs, and (b) sample BCs.
Figure 4.
Hourly average of fly ash concentration in the flue gas stream at outlet of the FGD absorber during summer season: (a) sample Cs, and (b) sample BCs.

Figure 5.
Hourly average of oxygen concentration in the flue gas stream at outlet of the FGD absorber during summer season: (a) sample Cs and (b) sample BCs.
Figure 5.
Hourly average of oxygen concentration in the flue gas stream at outlet of the FGD absorber during summer season: (a) sample Cs and (b) sample BCs.

Figure 6.
Interval plot of the O2 concentration vs. hours (95% CI for the mean).
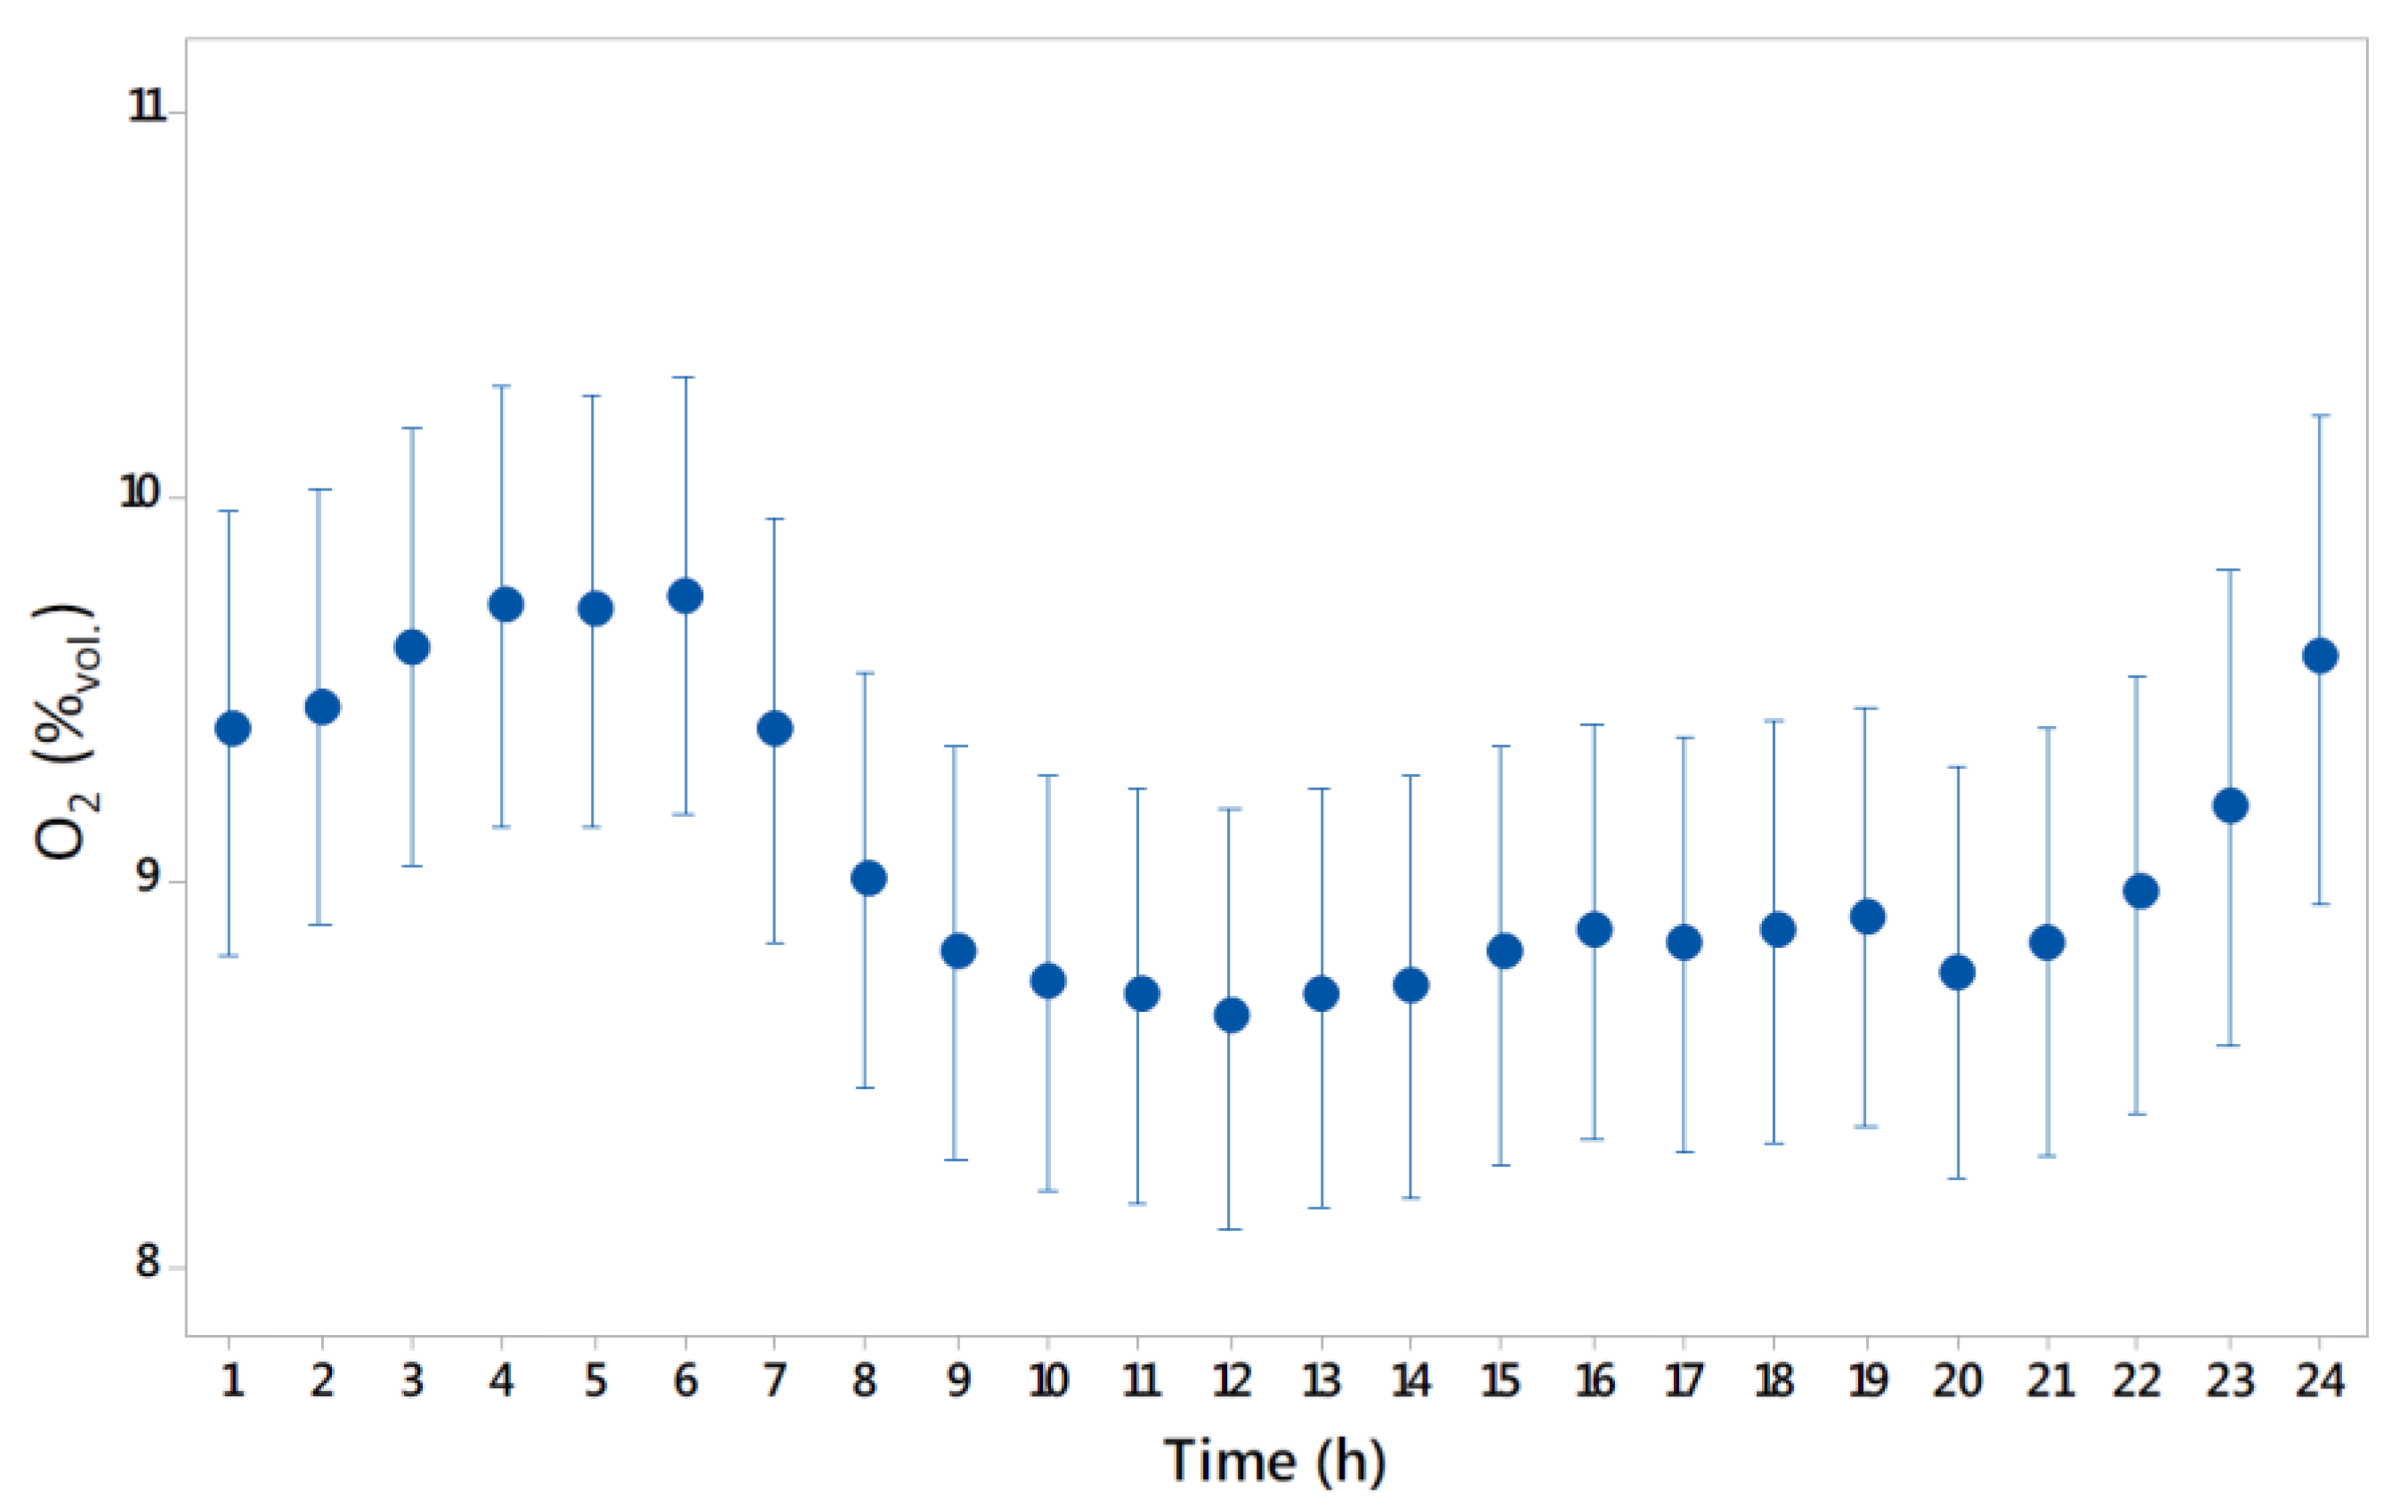
Figure 7.
Individual and moving range charts of O2.


Table 1.
Parameters of the coal and biomass samples from the electric power plant in Poland.
| Parameter | Sample | |||||
|---|---|---|---|---|---|---|
| Cw | Cs | BCw | BCs | |||
| Coal | Coal | Coal | Biomass | Coal | Biomass | |
| Caloric value (Qia, kJ·kg−1) | 19,765 | 19,665 | 19,705 | 16,551 | 19,395 | 16,245 |
| Ash, Aa (%) | 15.9 | 16.0 | 16.4 | 6.0 | 17.5 | 3.9 |
| Total moisture, Wa (%) | 17.9 | 18.5 | 17.5 | 12.7 | 18.0 | 14.0 |
| Total sulfur Sta (%) | 1.3 | 1.3 | 1.1 | 0.2 | 1.1 | 0.1 |
| Carbon Cta (%) | 52.8 | 51.2 | 52.4 | 45.2 | 50.9 | 44.1 |
Cw—hard coal (April 2013), Cs—hard coal (July 2013), BCw—hard coal with biomass (January 2014), BCs—hard coal with biomass (July 2014), a—analytical state.
Table 2.
Results of the monthly average of the power and impurity concentration in the flue gas stream.
Table 2.
Results of the monthly average of the power and impurity concentration in the flue gas stream.
| Result | Sample | |||
|---|---|---|---|---|
| Cw | Cs | BCw | BCs | |
| FGD inlet-Block 1 | ||||
| Power (106·kg·m2·s−3) | 179.9 | 182.1 | 161.2 | 144.7 |
| O2 (vol. %) | 5.6 | 6.4 | 6.1 | 6.9 |
| SO2 (mg·Nm−3) | 2810.1 | 2661.0 | 2702.7 | 2389.9 |
| NOx (mg·Nm−3) | 436.8 | 423.3 | 414.9 | 425.3 |
| Fly ash (mg·Nm−3) | 5.6 | 6.4 | 6.1 | 6.9 |
| FGD inlet-Block 2 | ||||
| Power (106·kg·m2·s−3) | 179.3 | 175.9 | 158.9 | 167.3 |
| O2, vol. % | 6.8 | 5.9 | 6.1 | 5.8 |
| SO2 (mg·Nm−3) | 2990.1 | 2914.5 | 2954.9 | 2702.8 |
| NOx (mg·Nm−3) | 196.0 | 188.4 | 195.5 | 180.8 |
| Fly ash (mg·Nm−3) | 15.7 | 8.8 | 8.4 | 10.1 |
| FGD outlet-Absorber | ||||
| O2, vol. % | 10.1 | 13.4 | 6.8 | 6.6 |
| SO2 (mg·Nm−3) | 218.1 | 172.8 | 200.9 | 157.5 |
| NOx (mg·Nm−3) | 365.7 | 302.1 | 338.0 | 286.8 |
| Fly ash (mg·Nm−3) | 4.9 | 4.8 | 2.9 | 3.3 |
Table 3.
Oxygen concentration, vol. %, in flue gas streams from coal and coal with biomass samples from FGD system during different periods of the year.
Table 3.
Oxygen concentration, vol. %, in flue gas streams from coal and coal with biomass samples from FGD system during different periods of the year.
| Day | Sample | Day | Sample | ||||||
|---|---|---|---|---|---|---|---|---|---|
| Cs | Cw | BCs | BCw | Cs | Cw | BCs | BCw | ||
| 1 | 11.9 | (nd) | 7.3 | 6.8 | 16 | 13.6 | 10.2 | 10.6 | 6.6 |
| 2 | 12.1 | 10.5 | 6.2 | 6.7 | 17 | 13 | 11.1 | 6.4 | 6.7 |
| 3 | 12.0 | 10.0 | 6.3 | 6.7 | 18 | (nd) | 11.3 | 7.25 | 6.2 |
| 4 | 11.8 | 9.2 | 6.1 | 6.6 | 19 | 13.39 | 9.4 | 5.69 | 7.1 |
| 5 | 12.8 | 9.9 | (nd) | 5.7 | 20 | 13.15 | 10.4 | 5.41 | 6.9 |
| 6 | 13.9 | 10.0 | (nd) | 5.9 | 21 | 13.33 | 11.5 | 7.13 | 7.3 |
| 7 | (nd) | 10.6 | 7.4 | 7.7 | 22 | 13.3 | 10.2 | 6.35 | 6.7 |
| 8 | 14.0 | 9.6 | 6.3 | 6.6 | 23 | 13.21 | 9.9 | 6.53 | 7.1 |
| 9 | 14.2 | 9.4 | 5.2 | 6.3 | 24 | 13.41 | 9.4 | 7.05 | 7.6 |
| 10 | 14.1 | 9.9 | 5.7 | 6.3 | 25 | 13.4 | 9.5 | 6.57 | 7.5 |
| 11 | 14.1 | 10.0 | 5.6 | 6.3 | 26 | 13.54 | 9.2 | 6.90 | 7.1 |
| 12 | 14.3 | 9.7 | 5.6 | 6.5 | 27 | 13.73 | 9.4 | 6.01 | 8.1 |
| 13 | 14.4 | 10.2 | 5.5 | 6.9 | 28 | 13.87 | 9.7 | 6.94 | 7.7 |
| 14 | (nd) | 12.2 | 7.4 | 6.3 | 29 | (nd) | 10.1 | 7.55 | 7.6 |
| 15 | 14.2 | 11.3 | 7.2 | 6.3 | 30 | (nd) | 9.8 | 8.04 | 7.0 |
(nd) not detected.
Table 4.
Electric power, 106 kg·m2·s−3, during the firing of coal and coal and biomass samples from the FGD system.
Table 4.
Electric power, 106 kg·m2·s−3, during the firing of coal and coal and biomass samples from the FGD system.
| Day | Sample | Day | Sample | ||||||
|---|---|---|---|---|---|---|---|---|---|
| Cs | Cw | BCs | BCw | Cs | Cw | BCs | BCw | ||
| 1 | 397.3 | (nd) | 304.9 | 316.9 | 16 | 163.7 | 343.2 | 120.1 | 309.2 |
| 2 | 387.4 | 311.2 | 374.1 | 324.3 | 17 | 192.7 | 277.7 | 139.9 | 306.9 |
| 3 | 373.9 | 354.0 | 340.4 | 307.7 | 18 | (nd) | 200.4 | 288.5 | 169.9 |
| 4 | 392.4 | 388.0 | 317.5 | 323.2 | 19 | 148.8 | 374.9 | 150.4 | 260.8 |
| 5 | 329.2 | 386.4 | (nd) | 165.2 | 20 | 190.0 | 326.3 | 157.2 | 291.7 |
| 6 | 195.3 | 374.1 | (nd) | 159.4 | 21 | 178.9 | 163.5 | 278.4 | 285.4 |
| 7 | (nd) | 326.1 | 293.0 | 257.0 | 22 | 175.0 | 337.8 | 321.2 | 348.5 |
| 8 | 285.1 | 388.5 | 300.2 | 301.1 | 23 | 190.3 | 339.2 | 313.4 | 291.0 |
| 9 | 323.1 | 372.9 | 181.6 | 311.8 | 24 | 194.5 | 360.1 | 289.1 | 298.1 |
| 10 | 284.0 | 385.3 | 184.5 | 349.6 | 25 | 196.9 | 367.8 | 324.8 | 174.2 |
| 11 | 190.8 | 366.4 | 177.3 | 360.3 | 26 | 197.8 | 385.7 | 279.5 | 180.7 |
| 12 | 189.2 | 368.7 | 191.5 | 335.3 | 27 | 183.0 | 391.6 | 151.6 | 259.0 |
| 13 | 184.4 | 349.6 | 208.6 | 307.5 | 28 | 185.4 | 377.1 | 310.9 | 148.3 |
| 14 | (nd) | 141.5 | 297.4 | 366.2 | 29 | (nd) | 366.4 | 280.2 | 245.9 |
| 15 | 136.2 | 280.3 | 288.4 | 366.4 | 30 | (nd) | 370.4 | 167.7 | 285.6 |
(nd) not detected.
© 2018 by the authors. Licensee MDPI, Basel, Switzerland. This article is an open access article distributed under the terms and conditions of the Creative Commons Attribution (CC BY) license (http://creativecommons.org/licenses/by/4.0/).
Share and Cite
MDPI and ACS Style
Więckol-Ryk, A.; Krzemień, A.; Smoliński, A.; Lasheras, F.S. Analysis of Biomass Blend Co-Firing for Post Combustion CO2 Capture. Sustainability 2018, 10, 923. https://doi.org/10.3390/su10040923
AMA Style
Więckol-Ryk A, Krzemień A, Smoliński A, Lasheras FS. Analysis of Biomass Blend Co-Firing for Post Combustion CO2 Capture. Sustainability. 2018; 10(4):923. https://doi.org/10.3390/su10040923
Chicago/Turabian StyleWięckol-Ryk, Angelika, Alicja Krzemień, Adam Smoliński, and Fernando Sánchez Lasheras. 2018. "Analysis of Biomass Blend Co-Firing for Post Combustion CO2 Capture" Sustainability 10, no. 4: 923. https://doi.org/10.3390/su10040923
Note that from the first issue of 2016, this journal uses article numbers instead of page numbers. See further details here.