Identification and Quantification of Physicochemical Parameters Influencing Chlorophyll-a Concentrations through Combined Principal Component Analysis and Factor Analysis: A Case Study of the Yuqiao Reservoir in China

Abstract
:1. Introduction
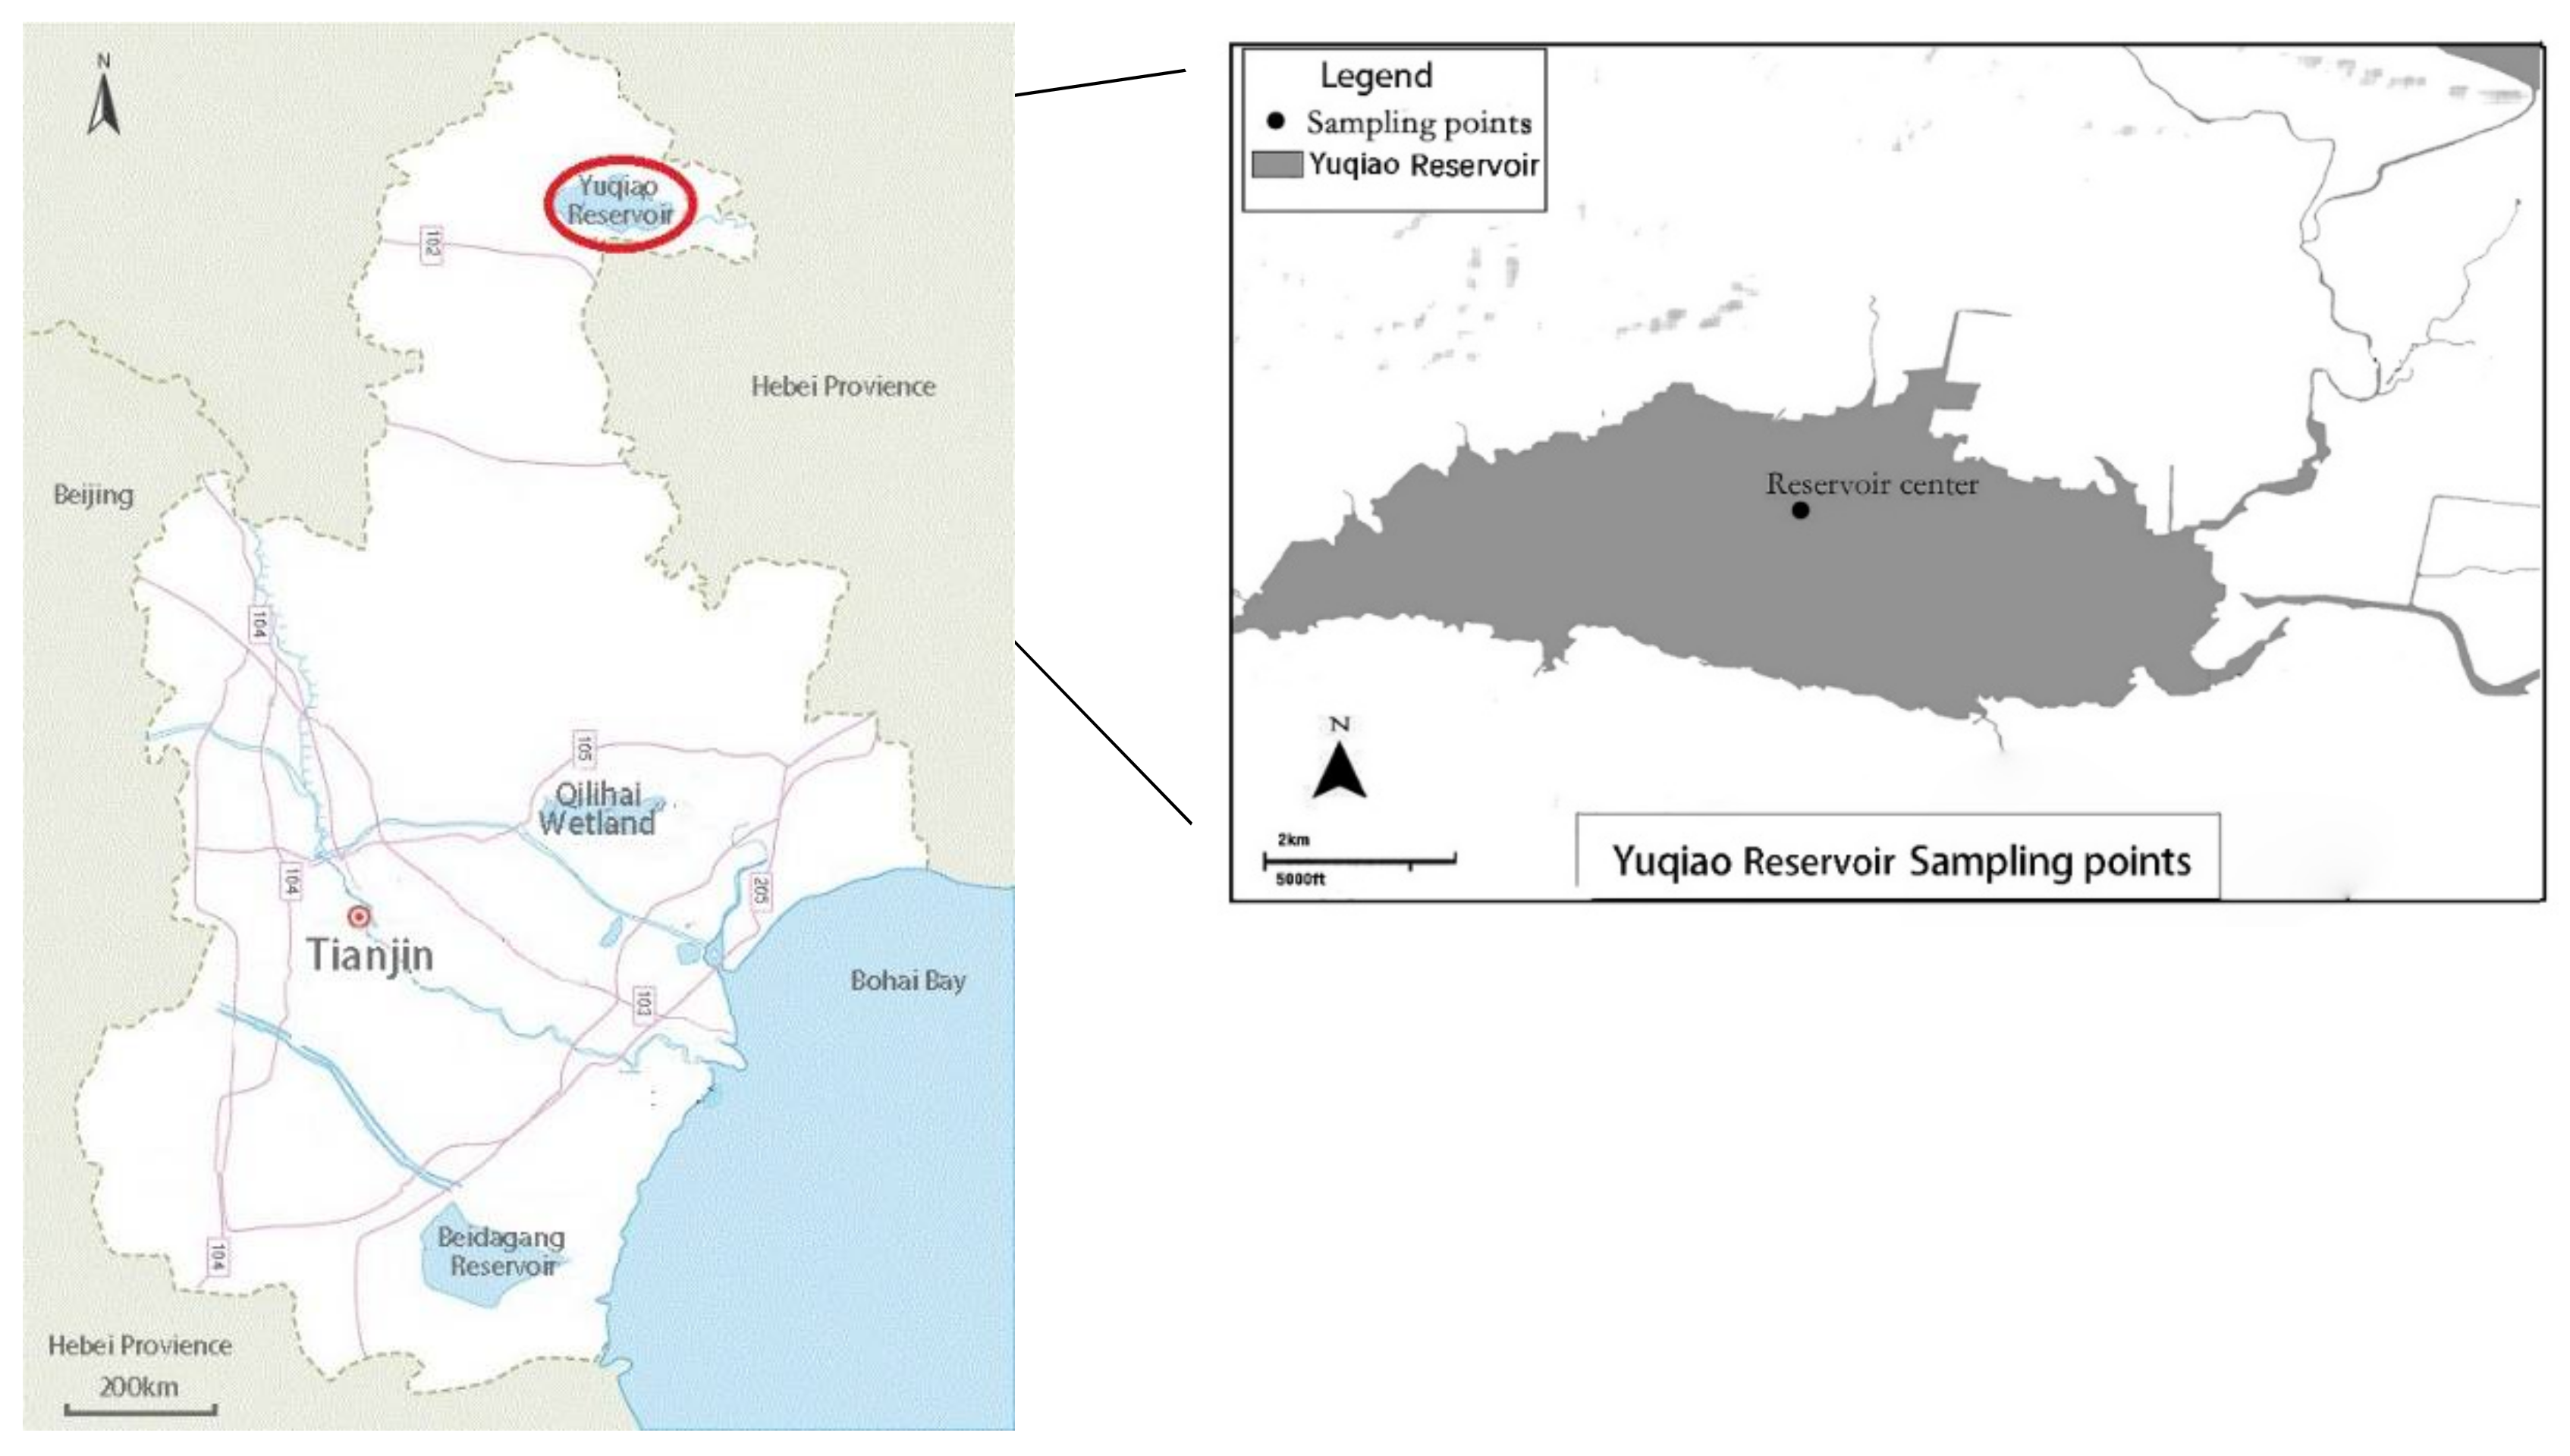
2. Research Area
3. Date and Method
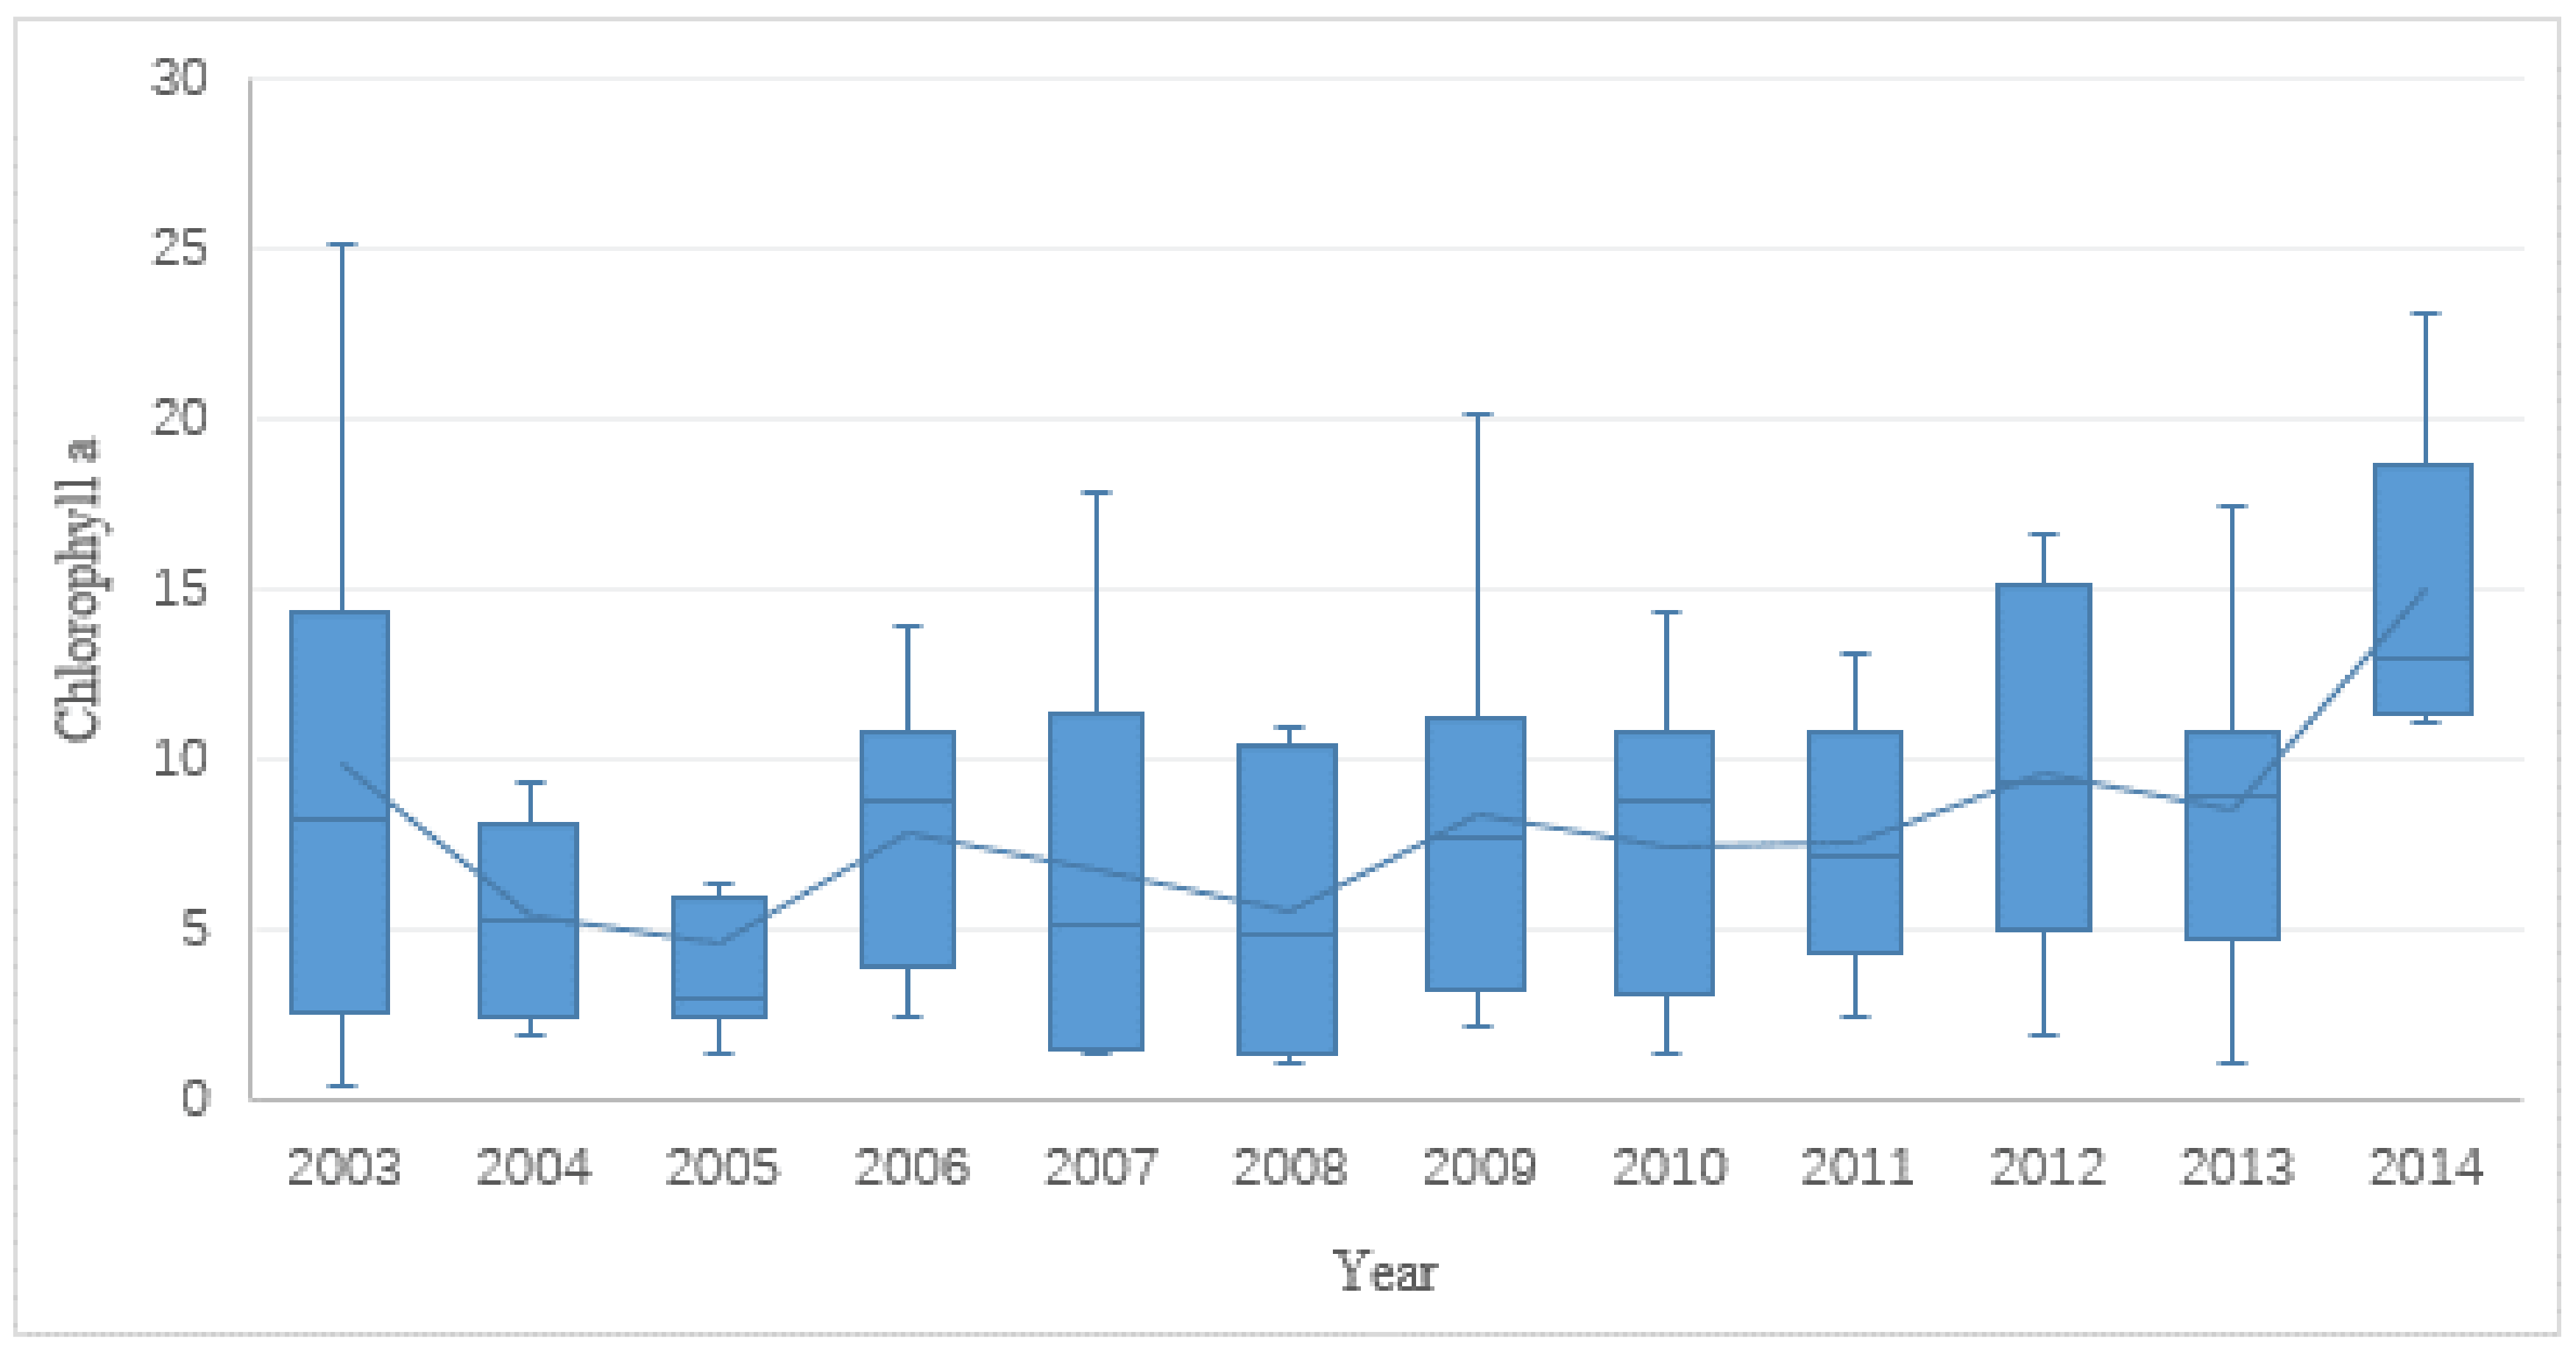
3.1. Data Selection
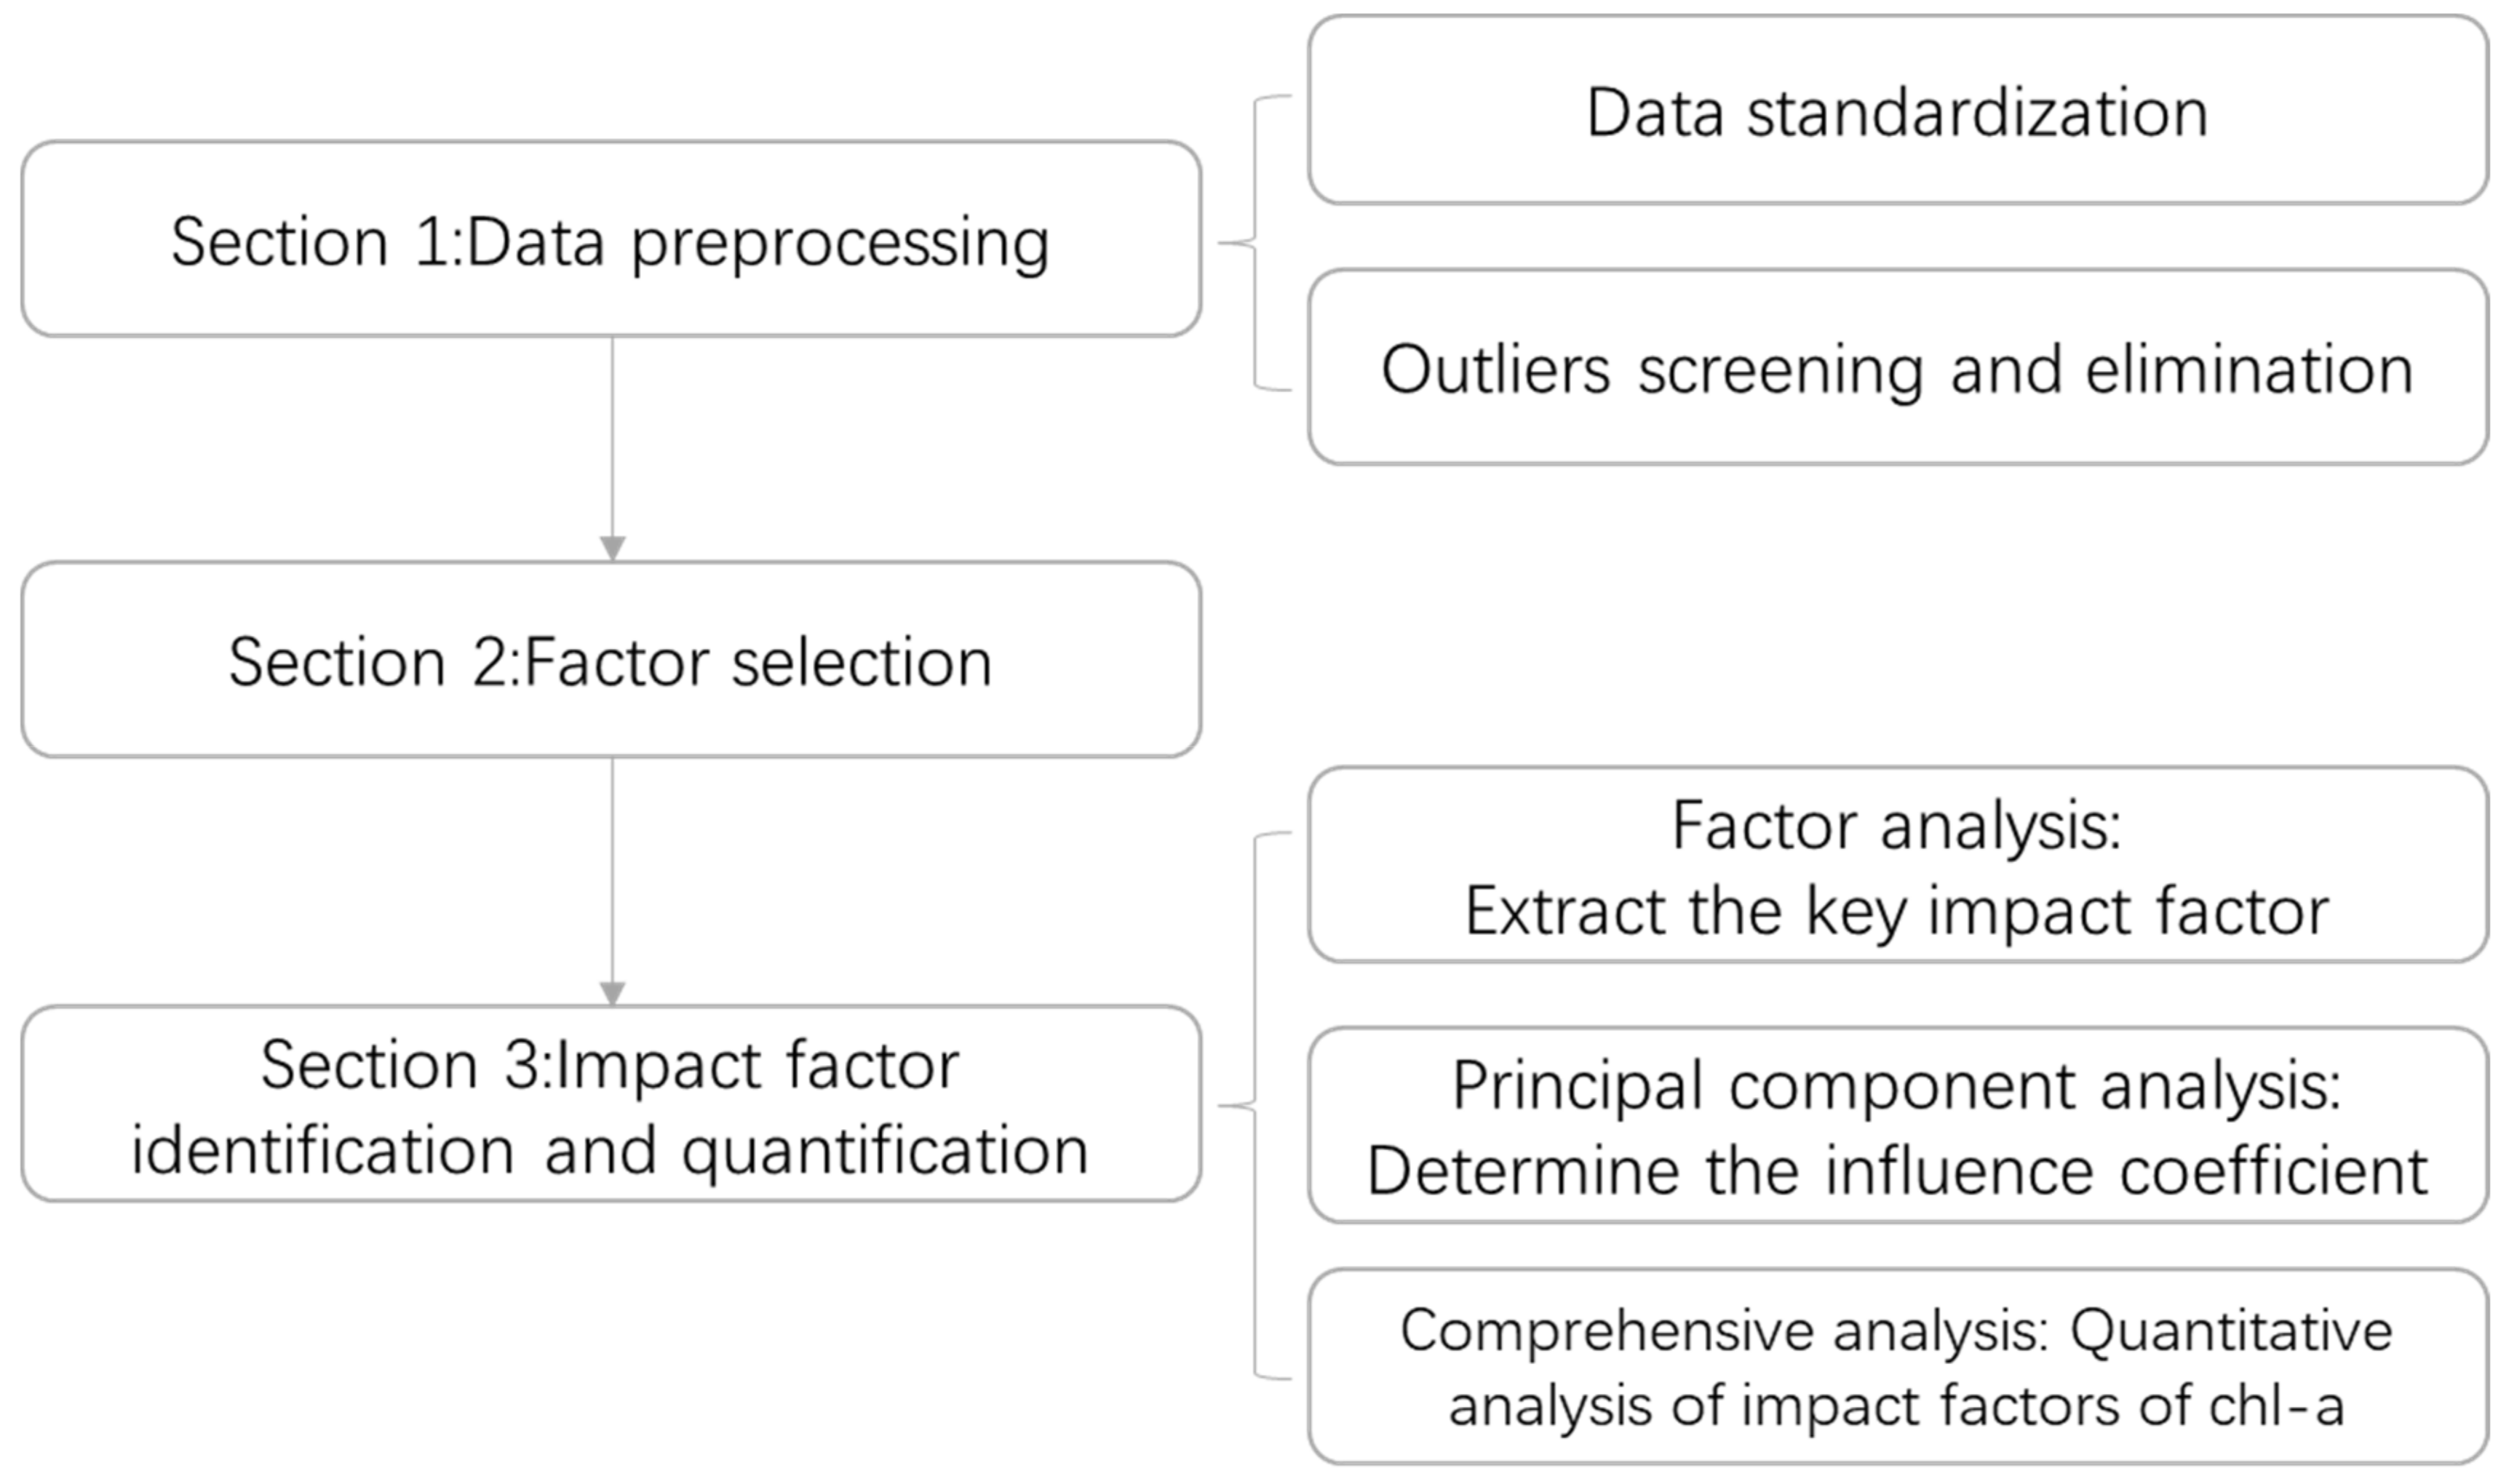
3.2. Research Method
3.2.1. The Standardization of Data
3.2.2. Screening and Elimination Outliers
3.2.3. Principal Component Analysis
3.2.4. Factor Analysis
4. Results
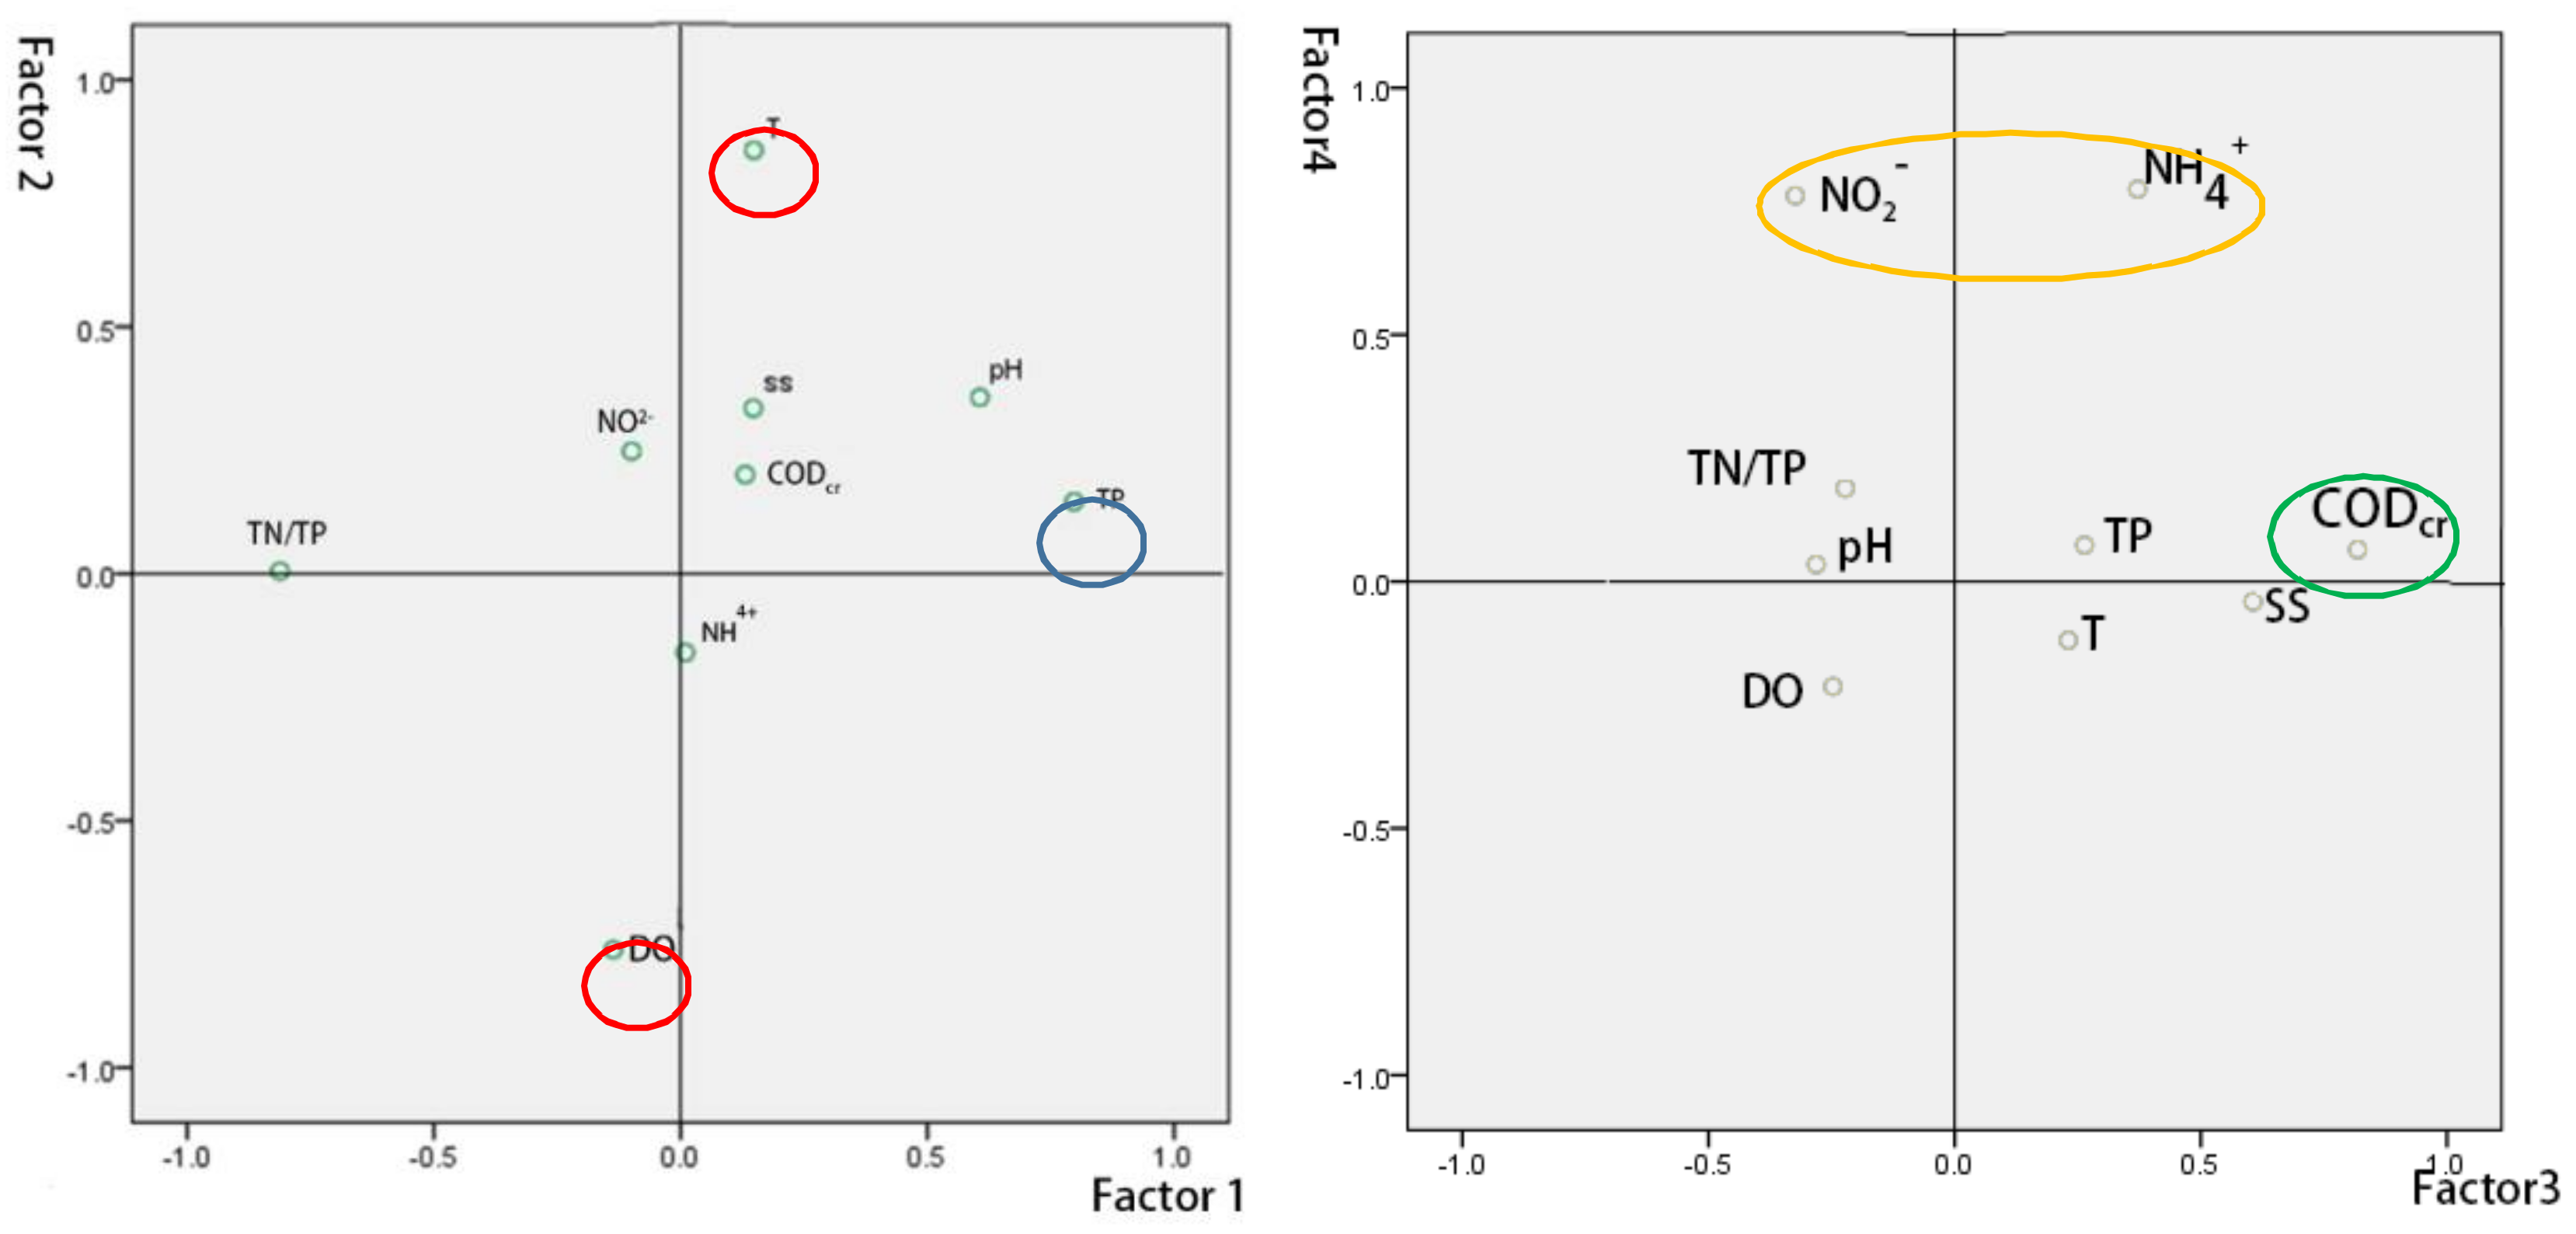
4.1. Factor Selection
4.2. Identification and Quantification of Key Physicochemical Parameters
5. Discussion
6. Conclusions
Acknowledgments
Author Contributions
Conflicts of Interest
References
- Schindler, D.W. Eutrophication and recovery in experimental lakes: Implications for lake management. Science 1974, 184, 897–899. [Google Scholar] [CrossRef] [PubMed]
- Carpenter, S.R.; Ludwig, D.; Brock, W.A. Management of eutrophication for lakes subject to potentially irreversible change. Ecol. Appl. 1998, 9, 751–771. [Google Scholar] [CrossRef]
- Smith, V.H. Eutrophication of freshwater and coastal marine ecosystems: A global problem. Environ. Sci. Pollut. Res. Int. 2003, 10, 126. [Google Scholar] [CrossRef] [PubMed]
- Conley, D.J.; Paerl, H.W.; Howarth, R.W.; Boesch, D.F.; Seitzinger, S.P.; Havens, K.E.; Lancelot, C.; Gene, E.; Likens, G.E. Controlling eutrophication: Nitrogen and phosphorus. Science 2009, 323, 1014. [Google Scholar] [CrossRef] [PubMed]
- Pant, M.C.; Sharma, A.P.; Sharma, P.C. Evidence for the increased eutrophication of lake Nainital as a result of human interference. Environ. Pollut. 1980, 1, 149–161. [Google Scholar] [CrossRef]
- Paerl, H.W. Controlling Eutrophication along the Freshwater–Marine Continuum: Dual Nutrient (N and P) Reductions are Essential. Estuar. Coasts 2009, 32, 593–601. [Google Scholar] [CrossRef]
- Carpenter, S.R.; Bennett, E.M. Reconsideration of the planetary boundary for phosphorus. Environ. Res. Lett. 2011, 6, 14009–14020. [Google Scholar] [CrossRef]
- Anderson, D.M.; Glibert, P.M.; Burkholder, J.M. Harmful algal blooms and eutrophication: Nutrient sources, composition, and consequences. Estuaries 2002, 25, 704–726. [Google Scholar] [CrossRef]
- Howarth, R.W.; Marino, R. Nitrogen as the limiting nutrient for eutrophication in coastal marine ecosystems: Evolving views over three decades. Limnol. Oceanogr. 2006, 51, 364–376. [Google Scholar] [CrossRef]
- Fisher, T.R.; Melack, J.M.; Grobbelaar, J.U.; Howarth, R.W. Phosphorus in the global environment. In Nutrient Limitation of Phytoplankton and Eutrophication of Inland, Estuarine and Marine Waters; Wiley and Sons: Chichester, UK, 1995. [Google Scholar]
- Nixon, S.W. Coastal marine eutrophication: A definition, social causes, and future concerns. Ophelia 1995, 41, 199–219. [Google Scholar] [CrossRef]
- Biggs, B.J.F. Eutrophication of streams and rivers: Dissolved nutrient-chlorophyll relationships for benthic algae. J. N. Am. Benthol. Soc. 2000, 19, 17–31. [Google Scholar] [CrossRef]
- Qiao, Y.; Feng, J.; Cui, S.; Zhu, L. Long-term changes in nutrients, chlorophyll a and their relationships in a semi-enclosed eutrophic ecosystem, Bohai Bay, China. Mar. Pollut. Bull. 2017, 117, 222. [Google Scholar] [CrossRef] [PubMed]
- Genkaikato, M.; Carpenter, S.R. Eutrophication due to phosphorus recycling in relation to Lake Morphometry, temperature and macrophysics. Ecology 2005, 86, 210–219. [Google Scholar] [CrossRef]
- Jiang, X.; Jin, X.; Yang, Y.; Li, L.; Wu, F. Effects of biological activity, light, temperature and oxygen on phosphorus release processes at the sediment and water interface of Taihu Lake, China. Water Res. 2008, 42, 2251–2259. [Google Scholar] [CrossRef] [PubMed]
- Rixen, T.; Baum, A.; Sepryani, H.; Pohlmann, T.; Jose, C.; Samiaji, J. Dissolved oxygen and its response to eutrophication in a tropical black water river. J. Environ. Manag. 2010, 91, 1730–1737. [Google Scholar] [CrossRef] [PubMed]
- Xia, R.; Zhang, Y.; Critto, A.; Wu, J.; Fan, J.; Zheng, Z.; Zhang, Y. The Potential Impacts of Climate Change Factors on Freshwater Eutrophication: Implications for Research and Countermeasures of Water Management in China. Sustainability 2007, 8, 229. [Google Scholar] [CrossRef]
- Doering, P.H.; Chamberlain, R.H.; Haunert, K.M. Chlorophyll A and its use as an indicator of eutrophication in the Caloosahatchee Estuary. Fla. Sci. 2006, 69, 51–72. [Google Scholar]
- Zeng, N.; Liu, Z.; Miao, Z.; Wei, Y. Design and Implementation of Chlorophyll a and Eutrophication Remote Sensing Monitoring System Based on ArcGIS Engine. In Proceedings of the 2008 International Workshop on Education Technology and Training & 2008 International Workshop on Geoscience and Remote Sensing, Shanghai, China, 21–22 December 2008; pp. 840–843. [Google Scholar]
- Terauchi, G.; Tsujimoto, R.; Ishizaka, J.; Nakata, H. Preliminary assessment of eutrophication by remotely sensed chlorophyll-a, in Toyama Bay, the Sea of Japan. J. Oceanogr. 2014, 70, 175–184. [Google Scholar] [CrossRef]
- Tongeren, O.F.R.V.; Liere, L.V.; Gulati, R.D.; Postema, G.; Boesewinkel-De Bruyn, P.J. Multivariate analysis of the plankton communities in the Loosdrecht lakes: Relationship with the chemical and physical environment. Hydrobiologia 1992, 233, 105–117. [Google Scholar] [CrossRef]
- Romo, S.; Donk, E.V.; Gylstra, R.; Gulati, R. A multivariate analysis of phytoplankton and food web changes in a shallow biomanipulated lake. Freshw. Biol. 2010, 36, 683–696. [Google Scholar] [CrossRef]
- Zheng, Y.; Wang, X.J.; Jiang, Y.C.; Zhou, X.W. Analysis on water quality of rivers around Tai Lake and estimation of total pollutant load into Tai Lake. Geogr. Territ. Res. 2001, 17, 40–44. [Google Scholar]
- Arhonditsis, G.B.; Winder, M.; Brett, M.T.; Schindler, D.E. Patterns and mechanisms of phytoplankton variability in Lake Washington (USA). Water Res. 2004, 38, 4013–4027. [Google Scholar] [CrossRef] [PubMed]
- Thomas, G.; Eckmann, R. The influence of eutrophication and population biomass on common white. Can. J. Fish. Aquat. Sci. 2007, 64, 402–410. [Google Scholar] [CrossRef]
- Cacho, O.J. Systems modelling and bioeconomic modelling in aquaculture. Aquac. Econ. Manag. 1997, 1, 45–64. [Google Scholar] [CrossRef]
- Tufford, D.L.; Mckellar, H.N. Spatial and temporal hydrodynamic and water quality modeling analysis of a large reservoir on the South Carolina (USA) coastal plain. Ecol. Model. 1999, 114, 137–173. [Google Scholar] [CrossRef]
- Momen, B.; Eichler, L.W.; Boylen, C.W.; Zehr, J.P. Application of multivariate statistics in detecting temporal and spatial patterns of water chemistry in Lake George, New York. Ecol. Model. 1996, 91, 183–192. [Google Scholar] [CrossRef]
- Lau, S.S.; Lane, S.N. Biological and chemical factors influencing shallow lake eutrophication: A long-term study. Sci. Total Environ. 2002, 288, 167. [Google Scholar] [CrossRef]
- Wang, X.H.; Yin, C.Q.; Shan, B.Q. Control of diffuse P-pollutants by multiple buffer/detention structures by Yuqiao Reservoir, North China. J. Environ. Sci. 2004, 16, 616–620. [Google Scholar]
- Zhao, Z.W.; Cui, F.Y. Multivariate statistical analysis for the surface water quality of the Luan River, China. J. Zhejiang Univ. 2009, 10, 142–148. [Google Scholar] [CrossRef]
- Liu, X.; Dong, F.; He, G.; Liu, J. Use of PCA-RBF model for prediction of chlorophyll-a in Yuqiao Reservoir in the Haihe River Basin, China. Water Sci. Technol. Water Supply 2014, 14, 73. [Google Scholar]
- Liu, X.; Nie, Y.; Zhao, X.; Liu, Q. A Correlation Analysis of the Phytoplankton Community and Environment Factors in the Yuqiao Reservoir in Spring and Summer of 2014. Environ. Monit. China 2016, 32, 64–68. [Google Scholar]
- Wang, B.; Ma, J.; Wang, Y.Y.; Yin, X.J. Distribution of Chlorophyll-a and Eutrophication State in Tianchi Lake of Tianshan Mountains in Summer. Huanjing Kexue 2015, 36, 2465. [Google Scholar] [PubMed]
- Li, Y.; Yan, X.; Wu, Z.; He, B. Quantitative relationship between chlorophyll a and key controlling factors in Four Plateau Lakes in Yunnan Province, China. Huanjing Kexue Xuebao 2015, 35, 402–410. [Google Scholar]
- Wu, D.; Wang, H.; Zhang, Z. Investigation of summer plankton community structure in Yuqiao Reservoir, Tianjin. J. Lake Sci. 2013, 25, 735–742. [Google Scholar]
- Chen, S.R.; Guang-Hong, W.U.; Rui-Xian, S.U. Change characteristics of water quality and its impact factor at the Yuqiao Reservoir in Tianjin. Water Resour. Prot. 2011, 27, 27–30. [Google Scholar]
- Morrison, D.F. Multivariate Statistical Methods; McGraw-Hill Book Company: New York, NY, USA, 1967; pp. 299–309. [Google Scholar]
- Kaiser, H.F. The application of electronic computers to factor analysis. Educ. Psychol. Meas. 1960, 20, 141–151. [Google Scholar] [CrossRef]
- Chakrapani, G.J.; Subramanian, V. Heavy metals distribution and fractionation in sediments of the Mahanadi River basin, India. Environ. Geol. 1993, 22, 80–87. [Google Scholar] [CrossRef]
- Borovec, Z. Trace elements levels in sediments of the Czech part of the Elbe River. Geojournal 1996, 40, 299–309. [Google Scholar] [CrossRef]
- Loska, K.; Wiechuła, D. Application of principal component analysis for the estimation of source of heavy metal contamination in surface sediments from the Rybnik Reservoir. Chemosphere 2003, 51, 723–733. [Google Scholar] [CrossRef]
- Li, X.; Xu, Y.; Zhao, G.; Shi, C.; Wang, Z.L.; Wang, Y. Assessing threshold values for eutrophication management using Bayesian method in Yuqiao Reservoir, North China. Environ. Monit. Assess. 2015, 187, 195. [Google Scholar] [CrossRef] [PubMed]
- Xu, H.; Wang, L.; Wang, Y.; Tabuchi, J.-P. Non-point Pollution Estimation of Zhouhe River Basin. In Proceedings of the International Conference on Automation, Mechanical Control and Computational Engineering, Lijiang, China, 8 August 2015; pp. 1118–1122. [Google Scholar]
- Xie, R.; Xu, Y.; Wang, Y. Temporal characteristics of eutrophication and pollution source analysis in Yuqiao reservoir. J. Water Resour. Water Eng. 2014, 25, 132–136. [Google Scholar]
- Yuan, X.U.; Xie, R.; Wei, L.U. Evaluation and spatial characteristics of eutrophication in Yuqiao reservoir. J. Water Resour. Water Eng. 2014, 25, 1–6. [Google Scholar]
- Zhang, H. Analysis on Treatment Solutions on External Pollution at Water Source of Yuqiao Reservoir. Anhui Agric. Sci. Bull. 2014, Z1, 101–105. [Google Scholar]
- Meng, C.; Wang, Y.; Li, Y.; Zhou, J.; Li, Y.; Wu, J. Deteriorated Water Quality of Agricultural Catchments in South China by Net Anthropogenic Phosphorus Inputs. Sustainability 2017, 9, 1480. [Google Scholar] [CrossRef]
- Wu, G.H.; Cao, S.S.; Yu, Y.Q. Distribution and enrichment of nutrients in superficial sediment in Tianjin typical waters. Environ. Sci. 2011, 30, 726–732. [Google Scholar]
- Haopeng, L.; Shen, L.N. Distribution Characteristics of Carbon, Nitrogen and Phosphorous of River Surface and Pollution Status Evaluation of Sediments in Yuqiao Reservoir Basin, Tianjin. J. Anhui Agric. Sci. 2017, 45, 98–102. [Google Scholar]
- Qiaoqiao, D.U.; Yan, K. Factor analysis of eutrophication in Yuqiao reservoir based on PCA. J. Water Resour. Water Eng. 2013, 24, 212–214. [Google Scholar]
- Cong, H.B.L.; Huang, T.L.; Chuang, Y.L.I. Study on internal pollution of sediments in Yuqiao Reservoir. Water Resour. Prot. 2006, 22, 20–23. [Google Scholar]
- Duan, W.; He, B.; Nover, D. Water Quality Assessment and Pollution Source Identification of the Eastern Poyang Lake Basin Using Multivariate Statistical Methods. Sustainability 2016, 8, 133. [Google Scholar] [CrossRef]


| Coefficient | T | pH | SS | DO | CODcr | BOD5 | NH4+ | NO2− | NO3− | TN | TP | N/P | Chl-a |
|---|---|---|---|---|---|---|---|---|---|---|---|---|---|
| T | 1 | 0.272 ** | 0.351 ** | −0.631 ** | 0.326 ** | 0.162 | −0.038 | −0.016 | −0.184 | −0.144 | 0.284 ** | −0.241 * | 0.501 ** |
| pH | 0.272 ** | 1 | 0.202 | −0.118 | 0.056 | −0.145 | −0.061 | 0.069 | 0.079 | 0.060 | 0.296 ** | −0.247 * | 0.248 * |
| SS | 0.351 ** | 0.202 | 1 | −0.231 * | 0.467 ** | 0.041 | 0.082 | −0.041 | −0.298 ** | −0.208 * | 0.239 * | −0.213 * | 0.412 ** |
| DO | −0.631 ** | −0.118 | −0.231 * | 1 | −0.310 ** | −0.122 | −0.165 | −0.166 | 0.189 | 0.118 | −0.345 ** | 0.206 * | −0.485 ** |
| CODcr | 0.326 ** | 0.056 | 0.467 ** | −0.310 ** | 1 | 0.181 | 0.214 * | −0.108 | −0.305 ** | −0.241 * | 0.354 ** | −0.185 | 0.431 ** |
| BOD5 | 0.162 | −0.145 | 0.041 | −0.122 | 0.181 | 1 | 0.077 | −0.058 | 0.026 | 0.080 | −0.049 | 0.103 | 0.095 |
| NH4+ | −0.038 | −0.061 | 0.082 | −0.165 | 0.214 * | 0.077 | 1 | 0.281 ** | 0.144 | 0.133 | 0.043 | 0.032 | 0.291 ** |
| NO2− | −0.016 | 0.069 | −0.041 | −0.166 | −0.108 | −0.058 | 0.281 ** | 1 | 0.507 ** | 0.506 ** | −0.037 | 0.258 * | 0.208 * |
| NO3− | −0.184 | 0.079 | −0.298 ** | 0.189 | −0.305 ** | 0.026 | 0.144 | 0.507 ** | 1 | 0.902 ** | −0.188 | 0.517 ** | −0.157 |
| TN | −0.144 | 0.060 | −0.208 * | 0.118 | −0.241 * | 0.080 | 0.133 | 0.506 ** | 0.902 ** | 1 | −0.068 | 0.519 ** | −0.032 |
| TP | 0.284 ** | 0.296 ** | 0.239 * | −0.345 ** | 0.354 ** | −0.049 | 0.043 | −0.037 | −0.188 | −0.068 | 1 | −0.568 ** | 0.478 ** |
| N/P | −0.241 * | −0.247 * | −0.213 * | 0.206 * | −0.185 | 0.103 | 0.032 | 0.258 * | 0.517 ** | 0.519 ** | −0.568 ** | 1 | −0.220 * |
| chl-a | 0.501 ** | 0.248 * | 0.412 ** | −0.485 ** | 0.431 ** | 0.095 | 0.291 ** | 0.208 * | −0.157 | −0.032 | 0.478 ** | −0.220 * | 1 |
| Kaiser–Meyer–Olkin Measuring Sampling Adequacy | 0.623 |
|---|---|
| Sphere calibration of Bartlett | 192.999 |
| Df | 36 |
| Significance | 0.000 |
| Communalities | ||
|---|---|---|
| Origin | Extract | |
| T | 1.000 | 0.825 |
| pH | 1.000 | 0.576 |
| SS | 1.000 | 0.503 |
| DO | 1.000 | 0.704 |
| CODcr | 1.000 | 0.732 |
| NH4+ | 1.000 | 0.796 |
| NO2− | 1.000 | 0.787 |
| TP | 1.000 | 0.732 |
| N/P | 1.000 | 0.744 |
| Factor | Characteristic Value | ||
|---|---|---|---|
| Total | Variation % | Accumulation % | |
| 1 | 2.810 | 31.219 | 31.219 |
| 2 | 1.473 | 16.361 | 47.580 |
| 3 | 1.112 | 12.359 | 59.939 |
| 4 | 1.004 | 11.158 | 71.097 |
| 5 | 0.876 | 9.734 | 80.832 |
| 6 | 0.583 | 6.478 | 87.310 |
| 7 | 0.523 | 5.817 | 93.127 |
| 8 | 0.332 | 3.687 | 96.813 |
| 9 | 0.287 | 3.187 | 100.000 |
© 2018 by the authors. Licensee MDPI, Basel, Switzerland. This article is an open access article distributed under the terms and conditions of the Creative Commons Attribution (CC BY) license (http://creativecommons.org/licenses/by/4.0/).
Share and Cite
Chen, R.; Ju, M.; Chu, C.; Jing, W.; Wang, Y. Identification and Quantification of Physicochemical Parameters Influencing Chlorophyll-a Concentrations through Combined Principal Component Analysis and Factor Analysis: A Case Study of the Yuqiao Reservoir in China. Sustainability 2018, 10, 936. https://doi.org/10.3390/su10040936
Chen R, Ju M, Chu C, Jing W, Wang Y. Identification and Quantification of Physicochemical Parameters Influencing Chlorophyll-a Concentrations through Combined Principal Component Analysis and Factor Analysis: A Case Study of the Yuqiao Reservoir in China. Sustainability. 2018; 10(4):936. https://doi.org/10.3390/su10040936
Chicago/Turabian StyleChen, Ran, Meiting Ju, Chunli Chu, Weiqiang Jing, and Yuqiu Wang. 2018. "Identification and Quantification of Physicochemical Parameters Influencing Chlorophyll-a Concentrations through Combined Principal Component Analysis and Factor Analysis: A Case Study of the Yuqiao Reservoir in China" Sustainability 10, no. 4: 936. https://doi.org/10.3390/su10040936