Article

Impact of Competitive Capabilities on Sustainable Manufacturing Applications in Romanian SMEs from the Textile Industry

by
Eduard Gabriel Ceptureanu
1,*,
Sebastian Ion Ceptureanu
1,
Razvan Bologa
2 and
Ramona Bologa
2
1
Department of Management, The Bucharest University of Economic Studies, Bucharest 010374, Romania
2
Department of Computer Science and Cybernetics, The Bucharest University of Economic Studies, Bucharest 010374, Romania
*
Author to whom correspondence should be addressed.
Sustainability 2018, 10(4), 942; https://doi.org/10.3390/su10040942
Submission received: 25 February 2018 / Revised: 18 March 2018 / Accepted: 19 March 2018 / Published: 23 March 2018

Abstract

:
This paper examines the impact of competitive capabilities on sustainable manufacturing practices in Romanian small and medium-sized enterprises from the textile industry. We developed an econometric model based on previous research conducted by prestigious specialists and validated on a survey data from 221 Romanian small and medium enterprises from the textile industry. Our article proposes a number of implications to encourage entrepreneurs and managers from textile industry to engage in pro-environmental behaviour.

1. Introduction

Sustainable manufacturing (SM) is a relatively new field that has received attention during the last two decades. It has evolved rapidly from traditional operational practices to using innovative processes that consider social, environmental and economic effects [1]. Specifically, SM ensures that operational processes such as product design, procurement, managerial practices, quality control, selecting appropriate technology, scheduling, maintenance, production, and packaging have no negative effects on natural resources and stakeholders throughout the product’s lifetime [2]. SM has become an important topic that can positively contribute to global GDP and sustainability awareness, particularly when we recognise that the manufacturing of goods contributes over 20 percent of carbon dioxide emissions worldwide [3].
Although there is no universally accepted definition for the term “sustainable manufacturing,” numerous efforts have been made in the recent past, with many more concurrent efforts well underway. The U.S. Department of Commerce defines sustainable manufacturing as: “the creation of manufactured products that use processes that minimize negative environmental impacts, conserve energy and natural resources, are safe for employees, communities, and consumers and are economically sound” [4].
Further, according to The National Council for Advanced Manufacturing (NACFAM) in the U.S. [5] sustainable manufacturing includes the manufacturing of “sustainable” products and the sustainable manufacturing of all products. The former includes manufacturing of renewable energy, energy efficiency, green building, and other “green” & social equity-related products, and the latter emphasizes the sustainable manufacturing of all products taking into account the full sustainability/total life-cycle issues related to the products manufactured.
Research on SM has historically focused on Environmentally Conscious Manufacturing (ECM) [6], the formation of the ‘Rs’ strategies (e.g., reduction, remanufacturing, recycling and reuse, etc.) [7], and identifying good practices of SM [8]. The environmental, economic and social effects of growing CO2 emissions, waste in water, energy and natural resources, toxic materials and products, and so on, have enforced a new manufacturing philosophy that respects the direct and indirect impact of manufacturing activities on our planet as well as valuing the positive operational effects on cost, quality, adaptability and responsiveness of products and services.
The main themes of SM research tend to develop environmental indicators or to assess the environmental impact of SM [9,10]. Seuring and Müller [11] argued that sustainability is often abridged to environmental improvements, which call for an integrated perspective that combines sustainability issues. Moreover, an absence of relevant theoretical frameworks that lay the foundation for such SM practices, factors and output is evident. Diverse research contexts including both large plants and SMEs are also observed. Researchers articulated a need for further SM research within the context of SMEs that link SME’s adoption of sustainable manufacturing practices (SMP) to performance benefits [12].
Despite recent SM research, there have been limited studies in SMEs concerning practices and impact on their competitive capabilities when using SM. Realising the above-mentioned gap, the key objective of this study is to investigate the impact of technology, organisational and environmental practice on SMP, as well as reviewing the effects of these practices on the competitive capabilities of a wide range of Romanian SMEs by using the partial least squares approach to structural equation modelling (PLS-SEM) model.
The current understanding of SMP assumes that SMEs are a particularly pertinent context to study for many reasons. First, global industrialisation has given SMEs tremendous opportunities to adopt regulations concerning their environmental responsibilities and manufacturing standards that lead to less waste [13]. Second, sustainable development pressures such as increasing energy prices and pollution rates urge SMEs to adopt manufacturing paradigms that allow them to compete globally. This is particularly relevant as SMEs are responsible for about 64% of industrial environmental impact [14]. Third, there is a great deal of ambiguity concerning SMEs’ knowledge of the best ways for sustainable improvement which is accompanied with a shortage of capital, personnel and other resources [15]. Fourth, prior research on the key factors and operational outcomes of SM in SMEs in Romania barely exists. According to Ramayah et al. [16], it is vital to validate the link between implementing SMP and the corresponding performance benefits. Thus, we may assert that this study contributes to theory and practice of SM as well as SMEs research.
The research results will endow information for competitive capabilities on sustainable management applications from the Romanian textile industry. Insights developed from extant literature, research hypotheses and theoretical models have been organized in Section 2. Section 3 presents the research methodology for obtaining data and explanatory variables data analysis and results, followed in Section 4 by discussion and findings and Conclusions covered in Section 5.
Regarding the novelty of the paper, we must emphasize that, as far as we know, is the first paper ever to treat the linkage between competitive capabilities and sustainable manufacturing application in Romanian SMEs from the textile industry. Accordingly, this study presents detailed insights from one of the most important Romanian industry in terms of exports.

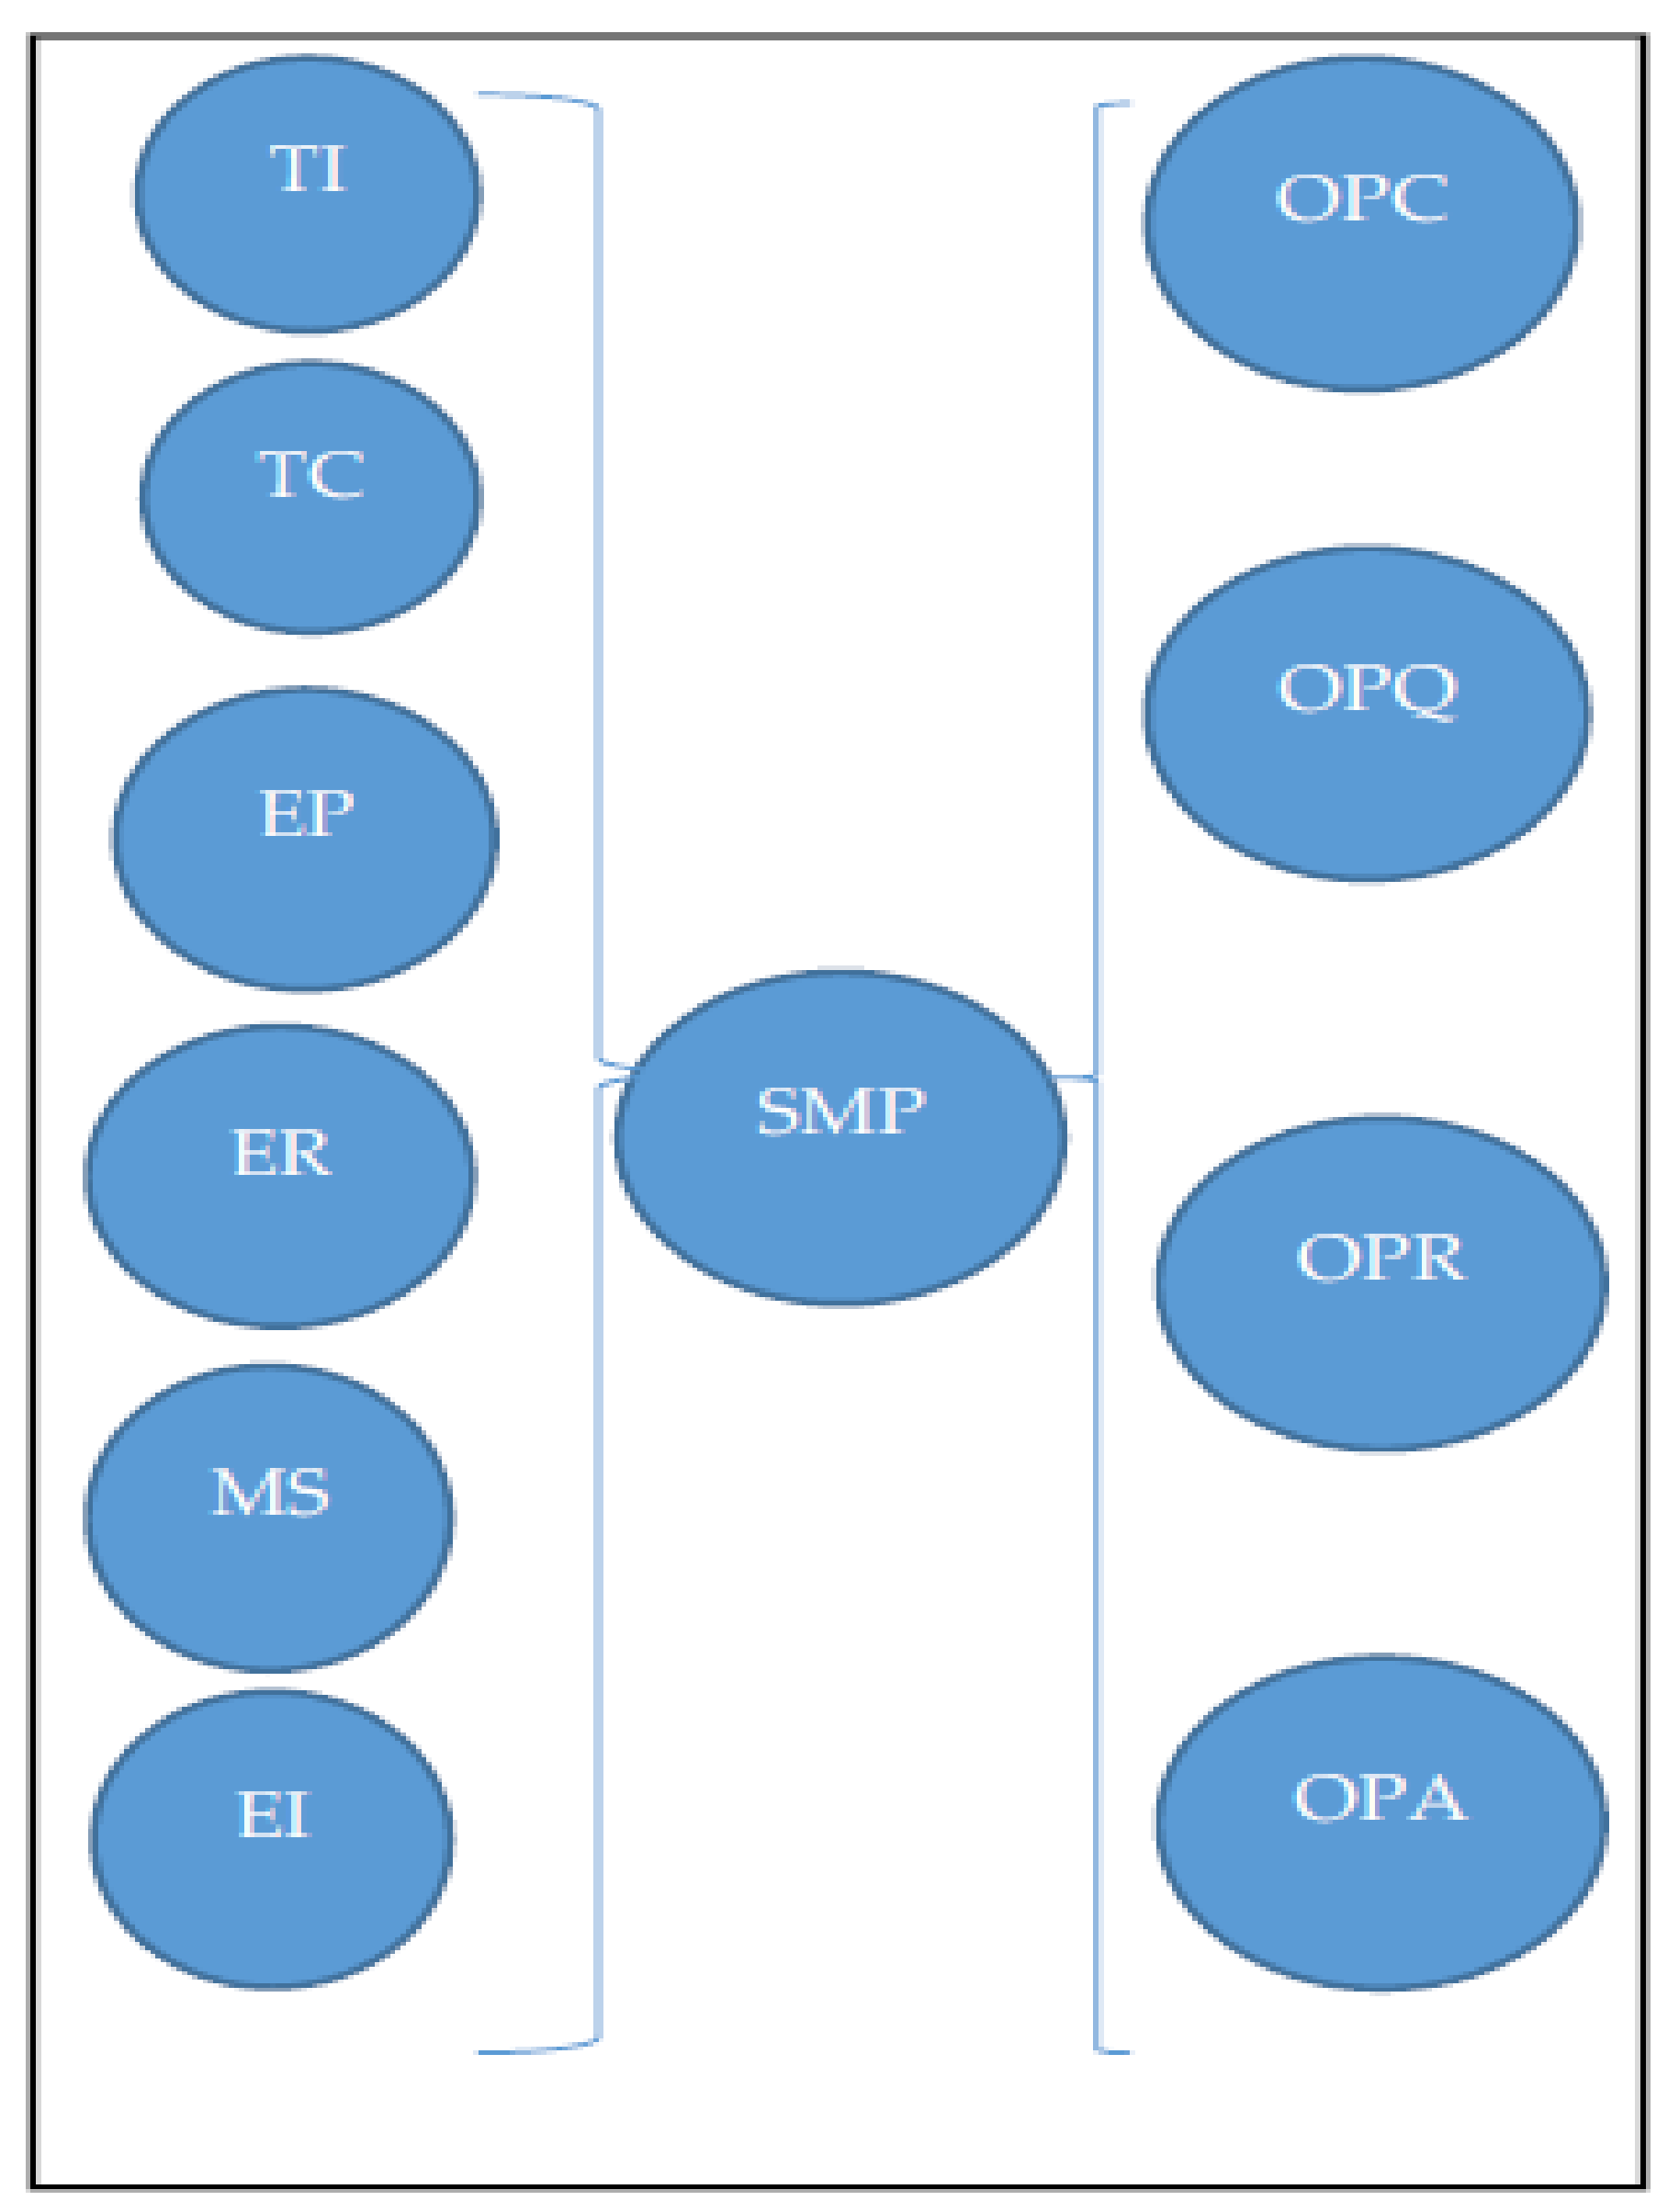
2. Research Hypotheses and Theoretical Model

2.1. Technology-Organization-Environment Framework Applications for SMP

The TOE framework has been developed by DePietro et al. [17] to reflect three contexts through which a firm implements innovative practices. In this study we modify the TOE framework in order to emphasize the competitive capabilities. Therefore, the technological context reflects technical infrastructure, processes and capabilities that influence the implementation of innovative instruments and practices, while the organizational context involves resources and interactions concerned with the new innovation. The environmental context reflects external aspects such as competition, stakeholder pressures and the regulatory environment that influence the new innovation.
However, studies that have used the TOE framework in sustainability research are scarce. Current examples involve the green supply chain [18] and green IT initiatives [19]. Hence, identifying the key determinants of SMP using the TOE framework is an apt choice due to its generic nature and applicability across a wide variety of contexts. The framework is also appropriate as the theoretical foundation for diagnosing sustainable initiatives and practices [20,21].
Advanced technology has a vital impact on sustainable initiatives from different perspectives. Routroy and Kumar [22] contended that technology applications are key antecedents for implementing green practices in manufacturing organizations. Technology infrastructure can also make manufacturing operations such as material movement in the production line, power transmission, water management and waste control more sustainable through reducing the consumption of energy and cost of operations as well as increasing the throughput ratio. Chuang and Yang [23] indicated that green design, green manufacturing processes, and green packaging are a result of advanced applications and innovation. With regard to technology competence, Ifinedo [24] assumed that when technology competence concerning specific innovative practices is high, firms are more inclined to effectively implement these practices. This can also be applied to SMP when technical knowledge and expertise related to sustainable technologies are high. For example, promoting technical knowledge and skills concerning pollution, waste prevention, and the value of green technology are essential factors of firm’s sustainable practices [25]. Technical knowledge competence also contributes in enhancing the performance of green product innovations in manufacturing firms [26].
As a result, the following hypotheses are established:
H1. 
Technology infrastructure positively impact SMP.
H2. 
Technology competence positively impact SMP.
The environmental context includes the size and structure of the industry, the firm’s competitors, the macroeconomic context, and the regulatory environment [17]. Also, we modify the TOE framework in order to emphasize firms’ sustainable practices and behaviors.
Environmental regulations have emerged as key factors of sustainable practices in many contexts. Regulations guide sustainability policies and processes in organisations and offer guidelines that shape sustainable behaviours and actions. Romania’s environmental regulations have been gradually underpinned by laws, executive orders and ministerial decrees for the protection and development of many aspects of the local environment. Government regulations impose direct pressure over organisations and reflect local and international concerns regarding clean production, resource utilisation and social responsibilities. In this regard, it is not surprising that sustainability research initially recognised the significant influence of governmental regulations on sustainable manufacturing. Roni et al. [27] considered that the legislation and incentives imposed by the local government have forced Malaysian manufacturers to consider SMP of high priority. Using the analytical hierarchy process (AHP), Shankar et al. [28] and Mittal and Sangwan [29] analysed common factors of green manufacturing in Indian and Malaysian organisations. They indicated that current and imminent legislation are one of the top factors that lead to efficient resource utilization and clean production in manufacturing organisations. This notion is also supported by Govindan et al. [30] who drew on a fuzzy multi-criteria approach to revisit the link between compliance with regulations and maintaining green manufacturing processes. With regard to the sustainable supply chain, Zhu and Geng [31] contemplated regulations as coercive pressures that have the potential to force the implementation of supply chain practices in Chinese factories. Researchers have also highlighted the contribution of environmental pressures that are brought about by the power of customers, media, competitors, suppliers, investors, and non-governmental organizations, etc., that affect an organisation’s decisions to implement sustainability initiatives. Schrettle et al. [32] considered environmental pressures as exogenous factors that influence organisations’ sustainability practices beside local and international environmental regulations. Mittal and Sangwan [29] revealed that environmental pressures are ranked second by experts in terms of their influence on sustainable manufacturing. Customers’ environmental concerns, for example, drive firms to make their products and services green sensitive since customers usually prefer products that are environmentally friendly [27]. Similarly, pressure from non-governmental and voluntary organisations supported by public media can play a crucial part in influencing sustainable practices in organisations [33]. These pressures can also be extended to drive strategic green initiatives in organisations. Accordingly, the following hypotheses can be delineated:
H3. 
Environmental pressures positively impact SMP.
H4. 
Environmental regulations positively impact SMP.
Although we have offered insights into the role of the technological and environmental factors in influencing SMP, organisational determinants highlighted by top management support and employees’ involvement in sustainability initiatives provide the bond that ensures the effectiveness of SMP. Using survey data and case studies from wine producing SMEs in South Africa, Hamann et al. [34] demonstrated that managers’ environmental responsibility is a vital determinant for wineries’ environmental practices. Vinodh et al. [35] identified the mutual relationship as among the most influential factors that drive the implementation of a lean sustainable manufacturing system. Their study revealed that top management commitment is the main force that pushes SMP in Indian automotive companies. Bhardwaj [25] used resource-based theory and value chain analysis to develop a sustainability strategy model in Indian organisations. His findings suggested that management support is a key success for executing sustainable strategies in Indian organisations. In summary, top managers can stimulate their employees, spread a positive attitude and provide financial support for employing sustainable initiatives [12]. In the same vein, employees’ involvement in rethinking traditional manufacturing operations and their impact on the environment could enhance sustainable practices by establishing a culture of shared responsibility, control and goal internalisation concerning sustainability [36]. Employees’ involvement can also drive sustainable manufacturing when they affect decisions and champion sustainable efforts at various organisational levels. Thus, the former argument may lead to the following hypotheses:
H5. 
Management support positively impact SMP.
H6. 
Employees’ involvement positively impact SMP.

2.2. Competitive Capabilities and SMP

Competitive capabilities reflect the power of generating superior value for consumers that outperform competitors. It usually covers dimensions of competitiveness such as quality, cost, efficiency, responsiveness, adaptability, innovation, productivity, and so on. For the purpose of our study, we focus only on quality, cost, responsiveness and adaptability as the most acceptable measures of competitive capabilities in operations research [37]. A firm can enjoy these capabilities by affording a product or service that meets customer’s expectations, is offered at a low cost, responds to circumstances and customers’ desires and is delivered fast. In their seminal article, Porter and van der Linde [38] argued that green practices are highly associated with competitiveness. Green practices can lead to vast savings in all types of resources, less downtime, better utilisation of by-products, safer workplace conditions, reductions in operations and product handling costs, higher product quality, and higher product resale and scrap value [38]. As a result, these enhancements in products and processes can also increase the adaptability of manufacturing operations and speed up product and responsiveness to customers [25]. Hence, sustainable manufacturing can yield valuable products with a high sustainable impact through the efficient use of resources [29]. In total, SMP can minimise the cost of production and add value to the final product with less environmental and social impact [39]. Besides, SMP can improve production processes leading to quality products that satisfy customers’ expectations and help grow an enterprise’s market share [40]. Ramayah et al. [16] examined the impact of SMP in Malaysian SMEs and indicated that practices such as reducing solid waste have a positive effect on competitive performance. In their study of companies from varied sectors in Turkey, Sezen and Çankaya [41] inferred that green manufacturing applications positively impact operations performance through enhancing production efficiency and occupational safety, and minimising production cost. The effects of SMP are incremental and can boost competitive advantages and profit in the long term [12]. Based on the above discussion, we can hypothesise that SMP has a positive impact on competitive capabilities as follows:
H7. 
SMP have a positive impact on textile product cost.
H8. 
SMP have a positive impact on textile product quality.
H9. 
SMP have a positive impact on responsiveness to the market of textile products.
H10. 
SMP have a positive impact on textile production adaptability to the market.
Figure 1 illustrates the proposed research model and hypotheses based on the former discussion.

3. Research Methodology

The research methodology is conducted in three phases. The cross-sectional survey instrument was firstly designed and validated based on prior research. Then, the instrument was sent to a stratified random sample of managers in a wide spectrum of SMEs. Finally, the responses were validated by relevant statistical tests to ensure their adequacy for further analysis.

3.1. Instrument Development and Validity

The survey entails multiple reflective items that are measured using the Likert scale, ranging from 1 “strongly disagree” to 5 “strongly agree”. Operationalisation of these items is derived from previous literature which lends high validity to the results (see Table 1). Items representing SMP are adapted from Despeisse et al. [8] and Rusinko [42]. The items reflect the use of energy, water and materials as well as reducing emissions and the waste of water and solids. Competitive capabilities are assessed by 14 items that reflect the cost (OPC), quality (OPQ), responsiveness (OPR) and adaptability (OPA) dimensions. The items are adapted from Conceptia Software Technologies [43]. Environmental regulations (ER) are presented as two items that reflect the level of national and regional regulations regarding waste, emissions, cleaner production, and so on, while the environmental pressures (EP) items include pressures from customers, media and competitors. Items of both variables are adapted from Zhu and Geng [31]. Technology infrastructure (TI) is assessed by three items adapted from Robert and Varun [44] to manifest using information, communication, networking, smart devices and manufacturing technology. Items measuring technology competence (TC) are adapted from Shankar et al. [28]. The items represent technology skills, training and resources. Management support (MS) is evaluated using two items concerning top managers’ commitment to reduce waste, save energy and take necessary decisions to foster sustainability. The items are adapted from [12] and Roni et al. [27]. Employees’ control over their work and responsibility for protecting the environment are used to delineate the employees’ involvement (EI) variable. The items are adapted from Yusoff et al. [36]. The second part of the questionnaire is designed to collect demographic information. Content validity is further assessed following the guidelines of Cooper and Schindler [45].

3.2. Data Collection

The frame of the SMEs population is originated from datasets of the Romanian National Trade Register Office. 748 SMEs were selected by means of stratified random sampling to reflect various sizes of enterprises from textile industry in Romania. In addition, the selected SMEs are screened and revised based on their accessibility using active contact data (e.g., phone, email, websites, personal contact data). 427 self-administering questionnaires with cover letters, that assure confidentiality and aggregation of data, were distributed to owners and top managers in manufacturing and operations positions using personal contact (phone calls and face-to-face) to ensure an acceptable response rate. Follow-up phone calls and email rounds were conducted every two weeks to maximise the response rate, from September to December 2017. Of 273 returned questionnaires, 221 are completed and ready for further analysis, yielding an acceptable response rate of 51.76% [46,47]. To ensure the adequacy of the responses, preliminary t-tests were conducted following Lohr’s [48] extrapolation procedures for non-response bias. The independent sample t-test between late and early returned responses is found to be insignificant (p = 0.19, 0.24 and 0.13, respectively). Additionally, a truncated version of the questionnaire is randomly sent again to 98 non-respondent managers via email, to secure a comparative nonresponse sample. The t-test between the earliest 20 complete responses from non-respondents and the original respondents’ answers concedes an insignificant difference (p = 0.21, 0.09 and 0.15, respectively). Accordingly, non-response bias cannot be considered as a critical issue.

3.3. Data Analysis and Results

The partial least squares approach to structural equation modelling (PLS-SEM) using the SmartPLS 3.0 software SmartPLS GmbH, Bönningstedt, Germany) is applied to analyse the research data through two phases involving assessing the measurement model and testing the structural model [49].
Hair [46] indicated that PLS-SEM was originally designed for prediction purposes so that it is preferred over covariance based SEM software. PLS-SEM is also less sensitive to sample size so that multivariate normal sample data is not strictly necessary [50]. Moreover, the results of the kurtosis and skewness values of the measurement model are between ±1 which indicate no violation of normality assumptions of the sample data. The quality of the measurement model is also evaluated by various measures. The standardised outer factor loading for constructed items in Table 2 are considered highly satisfactory as they exceed the threshold value of 0.70 (p < 0.001), except for two constructs that are considered adequate as they exceed the acceptable threshold value of 0.60 [46]. Table 3 shows that the values of Cronbach’s alpha, composite reliability (CR) and rho_A are greater than 0.707 which indicates the acceptable internal reliability of all variables [51].
In addition, the minimum average variance extracted (AVE) value (0.558) surpasses the required cut-off value of 0.5 [52], which reveals an adequate convergent validity level. Additionally, we follow the Fornell and Larcker [53] criterion to assess discriminant validity. The square root of the AVE (italic diagonal elements), as shown in Table 3, are higher than the interconstruct correlations. Henseler and Sarstedt [50] devised another measure of discriminant validity using Monte Carlo simulation- Hetrotrait Monotrait correlations (HTMT) with a threshold value less than 0.90. Table 4 shows that 0.84 is the greatest HTMT correlation ratio which establishes an acceptable discriminant validity level and reflects a satisfactory quality level of the measurement model.

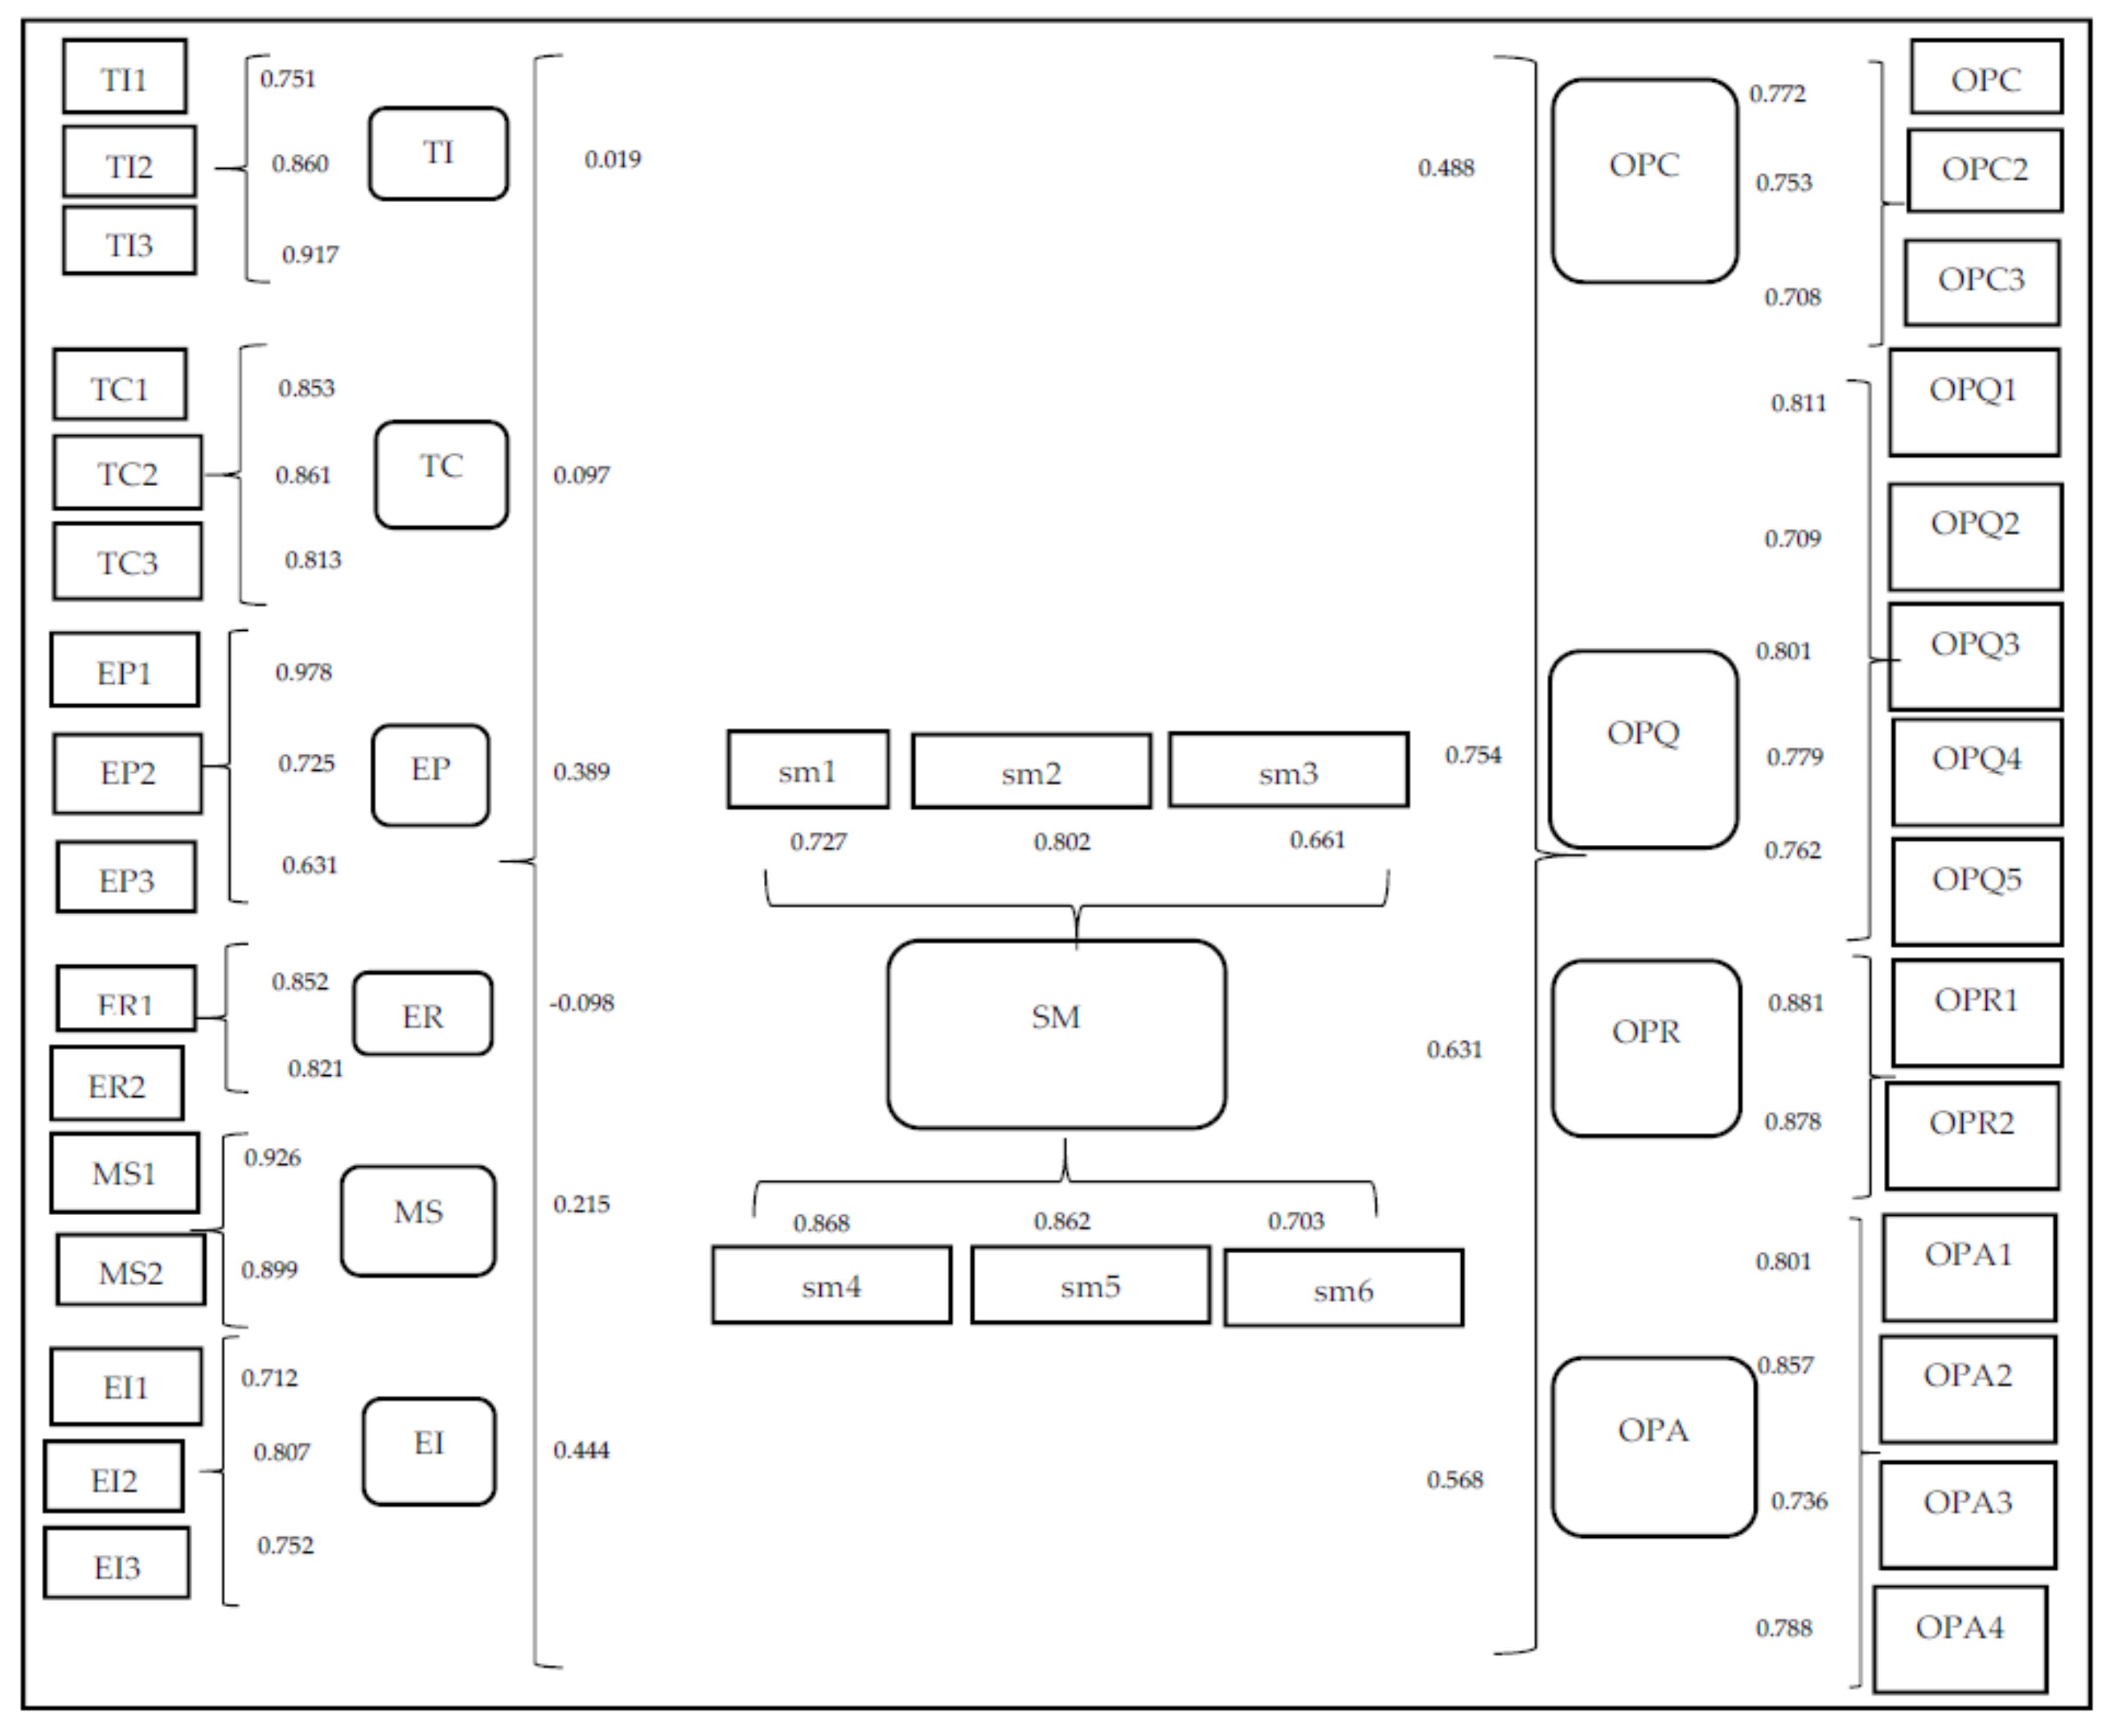
3.4. Testing the Structural Model

Henseler and Sarstedt [54] consider the standardised path coefficients and R2 values of endogenous latent variables determine the quality of the structural model and its predictive competence. The bootstrap method with 999 subsamples using the SmartPLS 3.0 software is applied to test the direction, strength and significance of the hypothesised path coefficients. SEM-PLS indices for model fit include Standardized Root Mean Square Residual SRMR = 0.0738 (<0.08), dULS = 0.829 (<0.95), dG = 0.846 (<0.95), Chi- Square = 0.966 and NFI = 0.827 demonstrate a significantly reliable and adequate fit (see Table 5) [50].
Figure 2 indicates that 50 percent of variance, adjuster R2, in sustainable manufacturing is explained by three factor (t = 6.737, p < 0.001). Hypotheses H1 and H2 predicted that technology determinants positively impact sustainable manufacturing in SMEs.
As Table 6 shows, the impact of technology infrastructure (β = 0.019, t = 0.27, ns) and technology competence (β = 0.097, t = 1.42, ns) are not significant. Thus, H1 and H2 are not supported. With regard to environmental determinants, we have found that environmental determinants partially support sustainable manufacturing in SMEs through the significant effect of environmental pressures (β = 0.389, t = 6.86, p < 0.001). This provides stronger support to hypothesis H3. Unexpectedly, we found a negative and insignificant effect of environmental regulations on sustainable manufacturing in SMEs (β = −0.098, t = 1.38, ns) which denotes no support for hypothesis H4. Organisational determinants show a strong impact on sustainable manufacturing which explains a great deal of its variance. Both management support (β = 0.215, t = 2.51, p < 0.01), and employees’ involvement (β = 0.444, t = 6.83, p < 0.001), positively and significantly influence sustainable manufacturing as assumed, supporting hypotheses H5 and H6. Hypotheses H7, H8, H9 and H10 capture the effect of SMP on competitive capabilities. The coefficients of sustainable manufacturing are positive and significant for cost performance (β = 0.488, t = 6.73, p < 0.001), quality performance (β = 0.754, t = 16.12, p < 0.001), responsiveness performance (β = 0.631, t = 11.27, p < 0.001) and adaptability performance (β = 0.568, t = 9.36, p < 0.001).

4. Discussion

This study introduces a model that extends our knowledge regarding the determinants of SMP in SMEs and their impact on dimensions of competitive capabilities.
An analysis of survey data from 221 respondents yielded important results that provide support for the influence of the organisational determinants and environmental pressures on SMP. In contrast, the results show no support for the effect of technology determinants on SMP, while the influence of environmental factors is partially maintained. With regard to the consequences of SMP, the findings demonstrate a positively significant impact on competitive capabilities of SMEs. These findings, while partially supporting our hypotheses, provide intriguing insights, especially when compared to the results of prior research. First, as for the effect of technology determinants on SMP, our result did not confirm their significance in influencing SMP. This is inconsistent with previous research [22] which perceived that technology infrastructure and competencies tend to have no influence on SMP. A potential explanation is the lack of technical capacity of SMEs, to recognise, evaluate and take advantage of opportunities associated with sustainability. Second, our result suggests that while environmental pressures from customers, competitors and media significantly influence SMP in Romanian SMEs from the textile industry, environmental regulations do not. This result contradicts prior research that patronises the role of environmental laws and rules in influencing SMP [28]. A plausible interpretation of this finding is the weak enforcement of environmental laws in Romania. In the same vein, previous research also found environmental regulations hardly play any role in regulating SMEs, such as Hamann et al.’s [34] study on wine-producing SMEs in South Africa. With regard to the impact of stakeholder’s environmental pressures on SMP, the finding is in harmony with other researchers [32] who emphasised the significant impact of customers, suppliers, media and other stakeholders on implementing SMP. One may argue that many SMEs are subcontractors to large firms, so they are not under direct stakeholder pressures to adopt SMP. A contrary interpretation of this argument contemplates the nature of Romanian SMEs, where their locations are scattered across different developing regions; they comprise more than 95% of the private sector and contribute about 60% of the Romanian GDP. These features show that they are actually accountable for a notable environmental impact that attracts the attention of various stakeholders. Third, the results confirm prior research concerning the significant impact of organisational determinants on SMP [35]. For SMEs, employees’ involvement and top management support are vital for the effective implementation of sustainable programs [55]. In developed countries, SMEs’ employees exercise great power over sustainable practices as a result of local authorities’ adoption of a dialogue-based rather than a control-based approach concerning sustainable programs at work, as in the case of adopting environmental health and safety schemes in Denmark [56]. However, this impact may have an alternate interpretation. Romanian SMEs are mainly owned and run as sole proprietorships where there is no legal distinction between the owner and the business. Accordingly, managers are likely to influence the enterprise’ ethos and the implementation of sustainable practices as a result. Likewise, the limited number of employees, smaller and flatter organisational hierarchies, and an informal working culture allow for effective knowledge transfer among all members and upsurge their involvement to make swift decisions concerning sustainability programs. Though Romanian SMEs lack financial and technological capabilities, their managers and employees tend to recognise and influence SMP to a great extent. Fourth, the findings are similarly in line with our hypotheses on the influence of SMP on competitive capabilities. The findings confirm past research on the impact of sustainable practices on cost, quality, adaptability and responsiveness [37]. Though there are various constraints facing SMEs in countries like Romania, SMP tends to be valuable in promoting competitive performance, which in turn, can reduce the effect of these constraints over the long term. This is in line with Hart [57] that strongly bonds environmental initiatives in product design, production processes, packaging, quality control, responsiveness, sourcing, and so on, to competitive advantages, which can be facilitated by the flexible nature and structure of SMEs [58].

5. Conclusions

Understanding the factors and outcomes of sustainable practices is an essential quest at the heart of sustainability research. In contrast to previous studies, this paper is an early attempt to examine SMP in the Romanian context [59]. The study also contributes to the existing body of sustainable manufacturing literature by expanding our knowledge about key factors of SMP in SMEs and introducing the TOE framework to delineate the tenets of these factors. Another significance of this study is linking SMP to competitive capabilities. This link has been barely established in previous sustainable manufacturing research. We proposed a research model that posits the impact of six factors (technology infrastructure, technology competence, environmental pressures, environmental regulations, management support and employees’ involvement) on SMP, and the impact of these practices on four competitive capabilities (cost, quality, responsiveness and adaptability). The model is empirically validated by means of the PLS-SEM method using data from 221 owners and managers from Romanian SMEs from textile industry. This study demonstrates that environmental pressures, management support and employees’ involvement predicts SMP in Romanian SMEs from the textile industry. In contrast to existing literature, this study establishes that technology infrastructure, technology competence, and environmental regulations do not significantly influence SMP [60,61]. Interestingly, the relationship between SMP and competitive capabilities of Romanian SMEs from the textile industry is positively significant, which supports the contribution of SMP to enhance firms’ competitive performance. From a managerial perspective, the present research offers policy makers and managers a frame of reference to boost SMP in the context of SMEs, not only to patronise managers’ and employees’ environmental responsibility towards various pressures from customers, suppliers and public media but also to encourage their engagement in developing sustainable programs. Therefore, increasing managers’ awareness, knowledge and specialised training concerning sustainability issues in SMEs will be of great importance for the textile industry [62,63]. Furthermore, Romanian environmental authorities need to establish an institutional framework and organizational capacity that reflect SMEs’ variations and feedback to enforce the implementation of environmental regulations, so that, accessing, monitoring and reporting actual environmental data by the managers of SMEs will no longer be a difficult process that is scattered among numerous authorities. Great prospects are also expected from sustainable manufacturing technology when the government considers SMEs capacity building by matching technology investments with actual sustainability needs whilst monitoring the textile SMEs role in creating sustainable value at a strategic level.
Although this study provides new insights into SMP in SMEs from the textile industry, the work still has inherent limitations related to data collection and generalization. First, it is suggested that future research on SMP should use a larger sample to better validate the current study in different settings, which further contributes to sustainable manufacturing in organizations. Second, snapshot survey research does not reflect a deep understanding of the context, as in the case of Romanian SMEs from the textile industry, when compared to theory building methods. Therefore, future research should follow a constructive research perspective where reality is created by actors when trying to discover and understand sustainable manufacturing issues (e.g., the role of organizational culture) in similar contexts. Third, it is worth revealing that the impact of environmental regulations and technology factors on SMP necessitate more exploration, and/or comparison between SMEs and large enterprises (i.e., lohn industry) to confirm or refute their effect. Fourth, with regard to the consequences of SMP, the study does not reflect the single impact of each SMP on competitive capabilities. Thus, further research may bring more insights into the relative importance of each practice. Fifth, although the PLS algorithm considers model complexity, discrepancies and uncertainties in the modelling process concerning structural parameters or measurement errors may allow for the application of other approaches that take these uncertainties into consideration [64,65] and compare the results to those mentioned in our study. Finally, upcoming research may use actual performance outcomes rather than self-reported or perceptual data when examining post-implementation practices to gain a true and substantial understanding of the impact of SMP.

Author Contributions

All authors share equal contribution to this paper. All authors wrote the paper and revised the manuscript for intellectual content and read and approved the final manuscript.

Conflicts of Interest

Authors declares no conflict of interest.

References

  1. Carter, C.R.; Rogers, D.S. A framework of sustainable supply chain management: Moving toward new theory. Int. J. Phys. Distrib. Logist. Manag. 2008, 38, 360–387. [Google Scholar] [CrossRef]
  2. Garetti, M.; Mummolo, G.; Taisch, M. Special issue on “sustainable manufacturing”. Prod. Plan. Control 2012, 23, 79–82. [Google Scholar] [CrossRef]
  3. Jakob, M.; Marschinski, R.; Hübler, M. Between a rock and a hard place: A trade-theory analysis of leakage under production- and consumption-based policies. Environ. Resour. Econ. 2013, 56, 47–72. [Google Scholar] [CrossRef]
  4. International Trade Administration. How Does Commerce Define Sustainable Manufacturing? U.S. Department of Commerce, 2007. Available online: https://www.oecd.org/sti/ind/45010349.pdf (accessed on 22 December 2017).
  5. Huang, A.; Badurdeen, F. Sustainable Manufacturing Performance Evaluation: Integrating Product and Process Metrics for Systems Level Assessement. Procedia Manuf. 2017, 8, 563–570. [Google Scholar] [CrossRef]
  6. Richards, D. Environmentally conscious manufacturing. World Class Des. Manuf. 1994, 1, 15–22. [Google Scholar] [CrossRef]
  7. Seliger, G. Sustainability in Manufacturing: Recovery of Resources in Product and Material Cycles; Springer: Berlin, Germany, 2007. [Google Scholar]
  8. Despeisse, M.; Mbaye, F.; Ball, P.; Levers, A. The emergence of sustainable manufacturing practices. Prod. Plan. Control 2012, 23, 354–376. [Google Scholar] [CrossRef] [Green Version]
  9. Singh, S.; Olugu, E.U.; Fallahpour, A. Fuzzy-based sustainable manufacturing assessment model for SMEs. Clean Technol. Environ. Policy 2014, 16, 847–860. [Google Scholar] [CrossRef]
  10. Singh, S.; Olugu, E.; Musa, S. Decoupling growth from resource use development of sustainable manufacturing performance evaluation expert system for small and medium enterprises. Procedia CIRP 2016, 40, 608–613. [Google Scholar] [CrossRef]
  11. Seuring, S.; Müller, M. From a literature review to a conceptual framework for sustainable supply chain management. J. Clean. Prod. 2008, 16, 1699–1710. [Google Scholar] [CrossRef]
  12. Agan, Y.; Acar, M.; Borodin, A. Drivers of environmental processes and their impact on performance: A study of Turkish SMEs. J. Clean. Prod. 2013, 51, 23–33. [Google Scholar] [CrossRef]
  13. Thanki, S.; Govindan, K.; Thakkar, J. An investigation on lean-green implementation practices in Indian SMEs using analytical hierarchy process (AHP) approach. J. Clean. Prod. 2016, 135, 284–298. [Google Scholar] [CrossRef]
  14. Entr, D. Public Policy Initiative to Promote the Uptake of Environmental Management Systems in Small and Medium-Sized Enterprises; European Commission: Brussels, Belgium, 2004. [Google Scholar]
  15. Chen, D.; Thiede, S.; Schudeleit, T.; Herrmann, C. A holistic and rapid sustainability assessment tool for manufacturing SMEs. CIRP Ann. 2014, 63, 437–440. [Google Scholar] [CrossRef]
  16. Ramayah, T.; Leen, J.; Marimuthu, M.; Omar, A.; Mohamad, O. Green Manufacturing Practices and Performance among SMEs: Evidence from a Developing Nation; IGI-Global: Hershey, PA, USA, 2013. [Google Scholar]
  17. DePietro, R.; Wiarda, E.; Fleischer, M. The Context for Change: Organization, technology and environment. In The Processes of Technological Innovation; Tornatzky, L.G., Fleischer, M., Eds.; Lexington Books: Lexington, MA, USA, 1990; pp. 151–175. [Google Scholar]
  18. Hwang, B.-N.; Huang, C.; Wu, C. A TOE approach to establish a green supply chain adoption decision model in the semiconductor industry. Sustainability 2016, 8, 168. [Google Scholar] [CrossRef]
  19. Hernandez, A.; Ona, S. Exploring green IT adoption: A case of a business process outsourcing firm. Int. J. Green Comput. 2014, 5, 13–28. [Google Scholar] [CrossRef]
  20. Angeles, R. Wal-Mart’s sustainable packaging scorecard initiative through the lens of the technology-organisation-environment (TOE) framework. Int. J. Sustain. Strateg. Manag. 2012, 3, 270–281. [Google Scholar] [CrossRef]
  21. Angeles, R. Using the technology-organization-environment framework for analyzing Nike’s considered index green initiative, a decision support system driven system. J. Manag. Sustain. 2014, 4, 96–103. [Google Scholar] [CrossRef]
  22. Routroy, S.; Kumar, S. An approach to develop green capability in manufacturing supply chain. Int. J. Process Manag. Benchmarking 2016, 6, 1–28. [Google Scholar] [CrossRef]
  23. Chuang, S.; Yang, C. Key Success factors when implementing a green manufacturing system. Prod. Plan. Control 2014, 25, 923–937. [Google Scholar] [CrossRef]
  24. Ifinedo, P. Internet e-business technologies acceptance in Canada’s SMEs: An exploratory investigation. Internet Res. 2011, 21, 255–281. [Google Scholar] [CrossRef]
  25. Bhardwaj, B. Role of green policy on sustainable supply chain management. Benchmarking Int. J. 2016, 23, 456–468. [Google Scholar] [CrossRef]
  26. Wong, C.; Lai, W.; Shang, K.; Lu, C.; Leung, T. Green operations and the moderating role of environmental management capability of suppliers on manufacturing firm performance. Int. J. Prod. Econ. 2012, 140, 283–294. [Google Scholar] [CrossRef]
  27. Roni, M.; Jabar, J.; Mohamad, M.; Yusof, M. Conceptual study on sustainable manufacturing practices and firm performance. In Proceedings of the International Symposium on Research in Innovation and Sustainability, ISoRIS’14, Malacca, Malaysia, 15–16 October 2014; pp. 1459–1465. [Google Scholar]
  28. Shankar, K.; Kumar, K.; Kannan, D. Analyzing the drivers of advanced sustainable manufacturing system using AHP approach. Sustainability 2016, 8, 824. [Google Scholar] [CrossRef] [Green Version]
  29. Mittal, V.; Sangwan, K. Development of a model of barriers to environmentally conscious manufacturing implementation. Int. J. Prod. Res. 2014, 52, 584–594. [Google Scholar] [CrossRef]
  30. Govindan, K.; Diabat, A.; Shankar, M. Analyzing the drivers of green manufacturing with fuzzy approach. J. Clean. Prod. 2015, 96, 182–193. [Google Scholar] [CrossRef]
  31. Zhu, Q.; Geng, Y. Drivers and barriers of extended supply chain practices for energy saving and emission reduction among Chinese manufacturers. J. Clean. Prod. 2013, 40, 6–12. [Google Scholar] [CrossRef]
  32. Schrettle, S.; Hinz, A.; Scherrer-Rathje, M.; Friedli, T. Turning sustainability into action: Explaining firms’ sustainability efforts and their impact on firm performance. Int. J. Prod. Econ. 2014, 147, 73–84. [Google Scholar] [CrossRef]
  33. Schrader, U.; Fricke, V.; Doyle, D.; Thoresen, V.W. Enabling Responsible Living; Springer: Berlin, Germany, 2013. [Google Scholar]
  34. Hamann, R.; Smith, J.; Tashman, P.; Marshall, R. Why do SMEs go green? An analysis of wine firms in South Africa. Bus. Soc. 2017, 56, 23–56. [Google Scholar] [CrossRef]
  35. Vinodh, S.; Ramesh, K.; Arun, C. Application of interpretive structural modelling for analysing the factors influencing integrated lean sustainable system. Clean Technol. Environ. Policy 2016, 18, 413–428. [Google Scholar] [CrossRef]
  36. Yusoff, R.; Imran, A.; Qureshi, M.; Kazi, A. Investigating the relationship of employee empowerment and sustainable manufacturing performance. Int. Rev. Manag. Mark. 2016, 6, 284–290. [Google Scholar]
  37. Schoenherr, T. The role of environmental management in sustainable business development: A multi-country investigation. Int. J. Prod. Econ. 2012, 140, 116–128. [Google Scholar] [CrossRef]
  38. Porter, M.; van der Linde, C. Green and competitive: Ending the stalemate. Harv. Bus. Rev. 1995, 73, 128–134. [Google Scholar]
  39. Paul, I.; Bhole, G.; Chaudhari, J. A review on green manufacturing: It’s important, methodology and its application. Procedia Mater. Sci. 2014, 6, 1644–1649. [Google Scholar] [CrossRef]
  40. Deif, A. A system model for green manufacturing. J. Clean. Prod. 2011, 19, 1553–1559. [Google Scholar] [CrossRef]
  41. Sezen, B.; Çankaya, S. Effects of green manufacturing and eco-innovation on sustainability performance. Procedia Soc. Behav. Sci. 2013, 99, 154–163. [Google Scholar] [CrossRef]
  42. Rusinko, C.A. Green manufacturing: An evaluation of environmentally sustainable manufacturing practices and their impact on competitive outcomes. IEEE Trans. Eng. Manag. 2007, 54, 445–454. [Google Scholar] [CrossRef]
  43. Conceptia Software Technologies Supplier Scorecard. Available online: http://www.conceptia.in/ (accessed on 18 December 2017).
  44. Roberts, N.; Varun, G. Leveraging Information Technology Infrastructure to Facilitate a Firm’s Customer Agility and Competitive Activity: An Empirical Investigation. J. Manag. Inf. Syst. 2012, 28, 231–270. [Google Scholar] [CrossRef]
  45. Cooper, D.; Schindler, P. Business Research Methods, 12th ed.; McGraw-Hill Education: New York, NY, USA, 2014. [Google Scholar]
  46. Hair, J. Multivariate Data Analysis, 7th ed.; Pearson: Harlow, UK, 2014. [Google Scholar]
  47. Rotundo, G.; Ausloos, M.; Herteliu, C.; Ileanu, B. Hurst exponent of very long birth time series in XX century Romania. Social and religious aspects. Phys. A Stat. Mech. Appl. 2015, 429, 109–117. [Google Scholar] [CrossRef]
  48. Lohr, S. Sampling: Design and Analysis, 2nd ed.; Brooks/Cole: Boston, MA, USA, 2010. [Google Scholar]
  49. Hair, J. A Primer on Partial Least Squares Structural Equation Modelling (PLS-SEM), 2nd ed.; SAGE: Los Angeles, CA, USA, 2017. [Google Scholar]
  50. Henseler, J.; Sarstedt, M. Goodness-of-fit indices for partial least squares path modelling. Comput. Stat. 2013, 28, 565–580. [Google Scholar] [CrossRef]
  51. Straub, D.; Boudreau, M.; Gefen, D. Validation guidelines for is positivist research. Commun. Assoc. Inf. Syst. 2004, 13, 380–427. [Google Scholar]
  52. Henseler, J.; Ringle, C.; Sarstedt, M. A new criterion for assessing discriminant validity in variance-based structural equation modeling. J. Acad. Mark. Sci. 2015, 43, 115–135. [Google Scholar] [CrossRef]
  53. Fornell, C.; Larcker, D. Evaluating structural equation models with unobservable variables and measurement error. J. Mark. Res. 1981, 18, 39–50. [Google Scholar] [CrossRef]
  54. Henseler, J.; Hubona, G.; Ray, P. Using PLS path modeling in new technology research: Updated guidelines. Ind. Data Syst. 2016, 116, 2–20. [Google Scholar] [CrossRef]
  55. Langwell, C.; Heaton, D. Using human resource activities to implement sustainability in SMEs. J. Small Bus. Enterp. Dev. 2016, 23, 652–670. [Google Scholar] [CrossRef]
  56. Madsen, H.; Ulhøi, J. Stakeholder pressures, environmental impact and managerial initiatives of SMEs: A longitudinal study. J. Transdiscipl. Environ. Stud. 2015, 14, 13–22. [Google Scholar]
  57. Hart, S. A natural-resource-based view of the firm. Acad. Manag. Rev. 1995, 20, 986–1014. [Google Scholar]
  58. Dragan, I.M.; Isaic-Maniu, A. An Alternate for Indicators that Characterize the Structure of Economic Systems. Entropy 2017, 19, 346. [Google Scholar] [CrossRef]
  59. Ceptureanu, S.I.; Ceptureanu, E.G.; Visileanu, E. Comparative analysis of small and medium enterprises organizational performance in clothing industry. Ind. Textila 2017, 68, 156–162. [Google Scholar]
  60. Bey, N.; Hauschild, M.; McAloone, T. Drivers and barriers for implementation of environmental strategies in manufacturing companies. CIRP Ann. 2013, 62, 43–46. [Google Scholar] [CrossRef]
  61. Phungrassami, H. Eco-efficiency as a decision tool for cleaner production: Application for SMEs in Thailand. Environ. Res. J. 2008, 2, 217–221. [Google Scholar]
  62. Wang, L.; Li, Y.; He, W. The Energy Footprint of China’s Textile Industry: Perspectives from Decoupling and Decomposition Analysis. Energies 2017, 10, 1461. [Google Scholar] [CrossRef]
  63. Osadolor, O.A.; Lennartsson, P.R.; Taherzadeh, M.J. Introducing Textiles as Material of Construction of Ethanol Bio reactors. Energies 2014, 7, 7555–7567. [Google Scholar] [CrossRef]
  64. Panda, B.; Garg, A.; Jian, Z.; Heidarzadeh, A.; Gao, L. Characterization of the tensile properties of friction stir welded aluminium alloy joints based on axial force, traverse speed, and rotational speed. Front. Mech. Eng. 2016, 11, 289–298. [Google Scholar] [CrossRef]
  65. Garg, A.; Lam, J.; Gao, L. Power consumption and tool life models for the production process. J. Clean. Prod. 2016, 131, 754–764. [Google Scholar] [CrossRef]
Figure 1. Research model. Note: TI—technology infrastructure; TC—technology competence; EP—environmental pressures; ER—environmental regulations; SMP—sustainable manufacturing practices; MS—management support; EI—employees’ involvement; OPC—cost; OPQ—quality; OPR—responsiveness, OPA—adaptability.
Sustainability 10 00942 g001
Figure 2. Structural model with path coefficients (b) and adjusted R2 values. Note: TI—technology infrastructure; TC—technology competence; EP—environmental pressures; ER—environmental regulations; MS—management support; EI—employee involvement; SMP—sustainable manufacturing practices; OPC—cost; OPQ—quality; OPR—responsiveness, OPA—adaptability.
Sustainability 10 00942 g002
Table 1. Research constructs.
Competitive Capabilities
CCC1Overhead cost is low
CCC2Low prices
CCC3Low costs of raw materials
CCQ1High quality of textile products
CCQ2Low rate of defects on textile products
CCQ3Appropriate specifications of textile products
CCQ4Appropriate working conditions and safety in the company
CCQ5Textile products do not harm the environment
CCR1Rapid response to our customer needs and behaviour
CCR2R&D responsiveness to the market
CCF1Amount of products are quickly altered
CCF2Rapid introduction of products on the market
CCF3A broad range of textile products
CCF4We customize textile products to customer needs
Sustainable Manufacturing Practices
SMP1Reducing energy use
SMP2Improving water use
SMP3Reducing material use
SMP4Reducing emissions
SMP5Reducing waste water
SMP6Reducing solid waste
Environmental Regulations
ER1Level of national environmental regulations
ER2Level of local environmental regulations
Environmental Pressures
EP1Extent of environmental pressures from customers
EP2Extent of environmental pressures from suppliers
EP3Extent of environmental pressures from competitors
Technology Infrastructure
TI1Our firm uses information, communication and networking technology
TI2Our firm uses smart devices and appliances that can be used to save waste and energy
TI3Our firm uses new innovations on manufacturing
Technology Competence
TC1Our employees have the skills to manage new technology and smart devices
TC2Our employees are trained in using new technology and smart devices
TC3Our firm recruits staff with advanced technology skills
Management Support
MS1Top/middle managers are committed to reduce waste and save energy
MS2Top/middle managers take necessary decisions to foster sustainability in the firm
Employees’ involvement
EI1Our employees have motivation and control over their work
EI2Our employees share the responsibility for sustainability
EI3Our employees are concerned with protecting the environment
Table 2. Standardized factor loading.
Items EIEPER MSOPCOPDOPAOPQSMTCTIVIF
EI10.712 1.203
EI20.807 1.271
EI30.752 1.287
EI1 0.978 1.997
EP2 0.725 2.041
EP3 0.631 2.295
ER1 0.852 1.203
ER2 0.821 1.202
MS1 0.926 1.847
MS2 0.899 1.845
OPC1 0.772 1.213
OPC2 0.753 1.278
OPC3 0.708 1.167
OPD1 0.881 1.472
OPD2 0.878 1.471
OPA1 0.801 1.726
OPA2 0.857 1.963
OPA3 0.736 1.652
OPA4 0.788 1.763
OPQ1 0.811 1.872
OPQ2 0.709 1.525
OPQ3 0.801 1.849
OPQ4 0.779 1.694
OPQ5 0.762 1.77
TC1 0.853 1.759
TC2 0.861 1.803
TC3 0.813 1.628
TI1 0.7512.075
TI2 0.862.04
TI3 0.9171.831
SM1 0.727 2.023
SM2 0.802 2.511
SM3 0.661 1.698
SM4 0.868 3.187
SM5 0.862 3.711
SM6 0.703 2.096
Table 3. Reliability and validity measures.
VariableCronbach’s AlphaRho_ACRAVEEIEPERMSOPCOPDOPAOPQSMTCTI
EI0.7070.720.8030.5770.75
EP0.7280.70.8070.5870.220.76
ER0.7610.880.8620.7650.170.220.82
MS0.8020.780.9080.8330.180.080.040.88
OPC0.7680.690.7880.5580.290.350.080.160.73
OPD0.7210.710.8750.7810.40.4100.110.440.84
OPA0.8090.810.8710.6340.350.360.020.220.350.570.78
OPQ0.8320.820.8790.60.490.550.060.150.530.690.570.74
SM0.8630.840.8980.5990.540.470.030.310.430.590.550.730.75
TC0.7990.780.880.7110.01−0.010.010.080.040.080.030.020.110.81
TI0.8350.90.8810.718−0.07−0.030.03−0.24−0.08−0.030.01−0.05−0.09−0.170.83
Notes: EI—employees’ involvement; EP—environmental pressures; ER—environmental regulations; MS—management support; OPC—cost; OPR—responsiveness, OPA—adaptability; OPQ—quality; SM—sustainable manufacturing; TC—technology competence; TI—technology infrastructure. The square roots of the average variance extracted (AVE) are shown as underline italic values along the diagonal line.
Table 4. Hetrotrait Monotrait correlations (HTMT) ratio.
EIEPERMSOPCOPROPAOPQSM
EI
EP0.34
ER0.210.43
MS0.20.120.09
OPC0.520.520.180.25
OPR0.610.560.040.130.67
OPA0.480.450.060.270.480.75
OPQ0.670.70.090.210.740.840.69
SM0.730.570.040.340.620.770.620.86
TC0.070.080.050.130.110.110.110.090.11
TI0.050.10.090.280.130.020.040.110.09
Table 5. The fit indices of structural model.
Goodness-of-Fit StatisticsRecommended RangeModel 1Model 2Model 3
0.9610.9580.966
Degree of Freedom 979797
2)/f<3.01.5251.5321.503
RMRclose to zero0.07430.07510.0738
GFI>0.900.9140.9160.91
NFI>0.900.8360.8980.827
RFI>0.900.9280.9630.919
TLI>0.900.9720.9810.969
CFI>0.900.9750.9780.973
RMSEA<0.080.0440.0450.043
PCLOSE>0.500.5520.5610.683
Table 6. Path coefficient and t-values of the structural model.
HypothesisPathβt-ValueResult
H1TI-SM0.0190.27Not supported
H2TC-SM0.0971.42Not supported
H3EP-SM0.3896.86 **Supported
H4ER-SM−0.0981.38Not supported
H5MS-SM0.2152.51 *Supported
H6EI-SM0.4446.83 **Supported
H7SM-OPC0.4886.73 **Supported
H8SM-OPQ0.75416.12 **Supported
H9SM-OPR0.63111.27 **Supported
H10SM-OPA0.5689.36 **Supported

