Impacts of Land-Use and Land-Cover Changes on Water Yield: A Case Study in Jing-Jin-Ji, China


1
School of Nature Conservation, Beijing Forestry University, Qinghua East Road 35, Haidian District, Beijing 100083, China
2
Eawag, Swiss Federal Institute of Aquatic Science and Technology, Uberlandstrasse, 133, 8600 Dubendorf, Switzerland
3
Department of Environmental Science, MGU, University of Basel, Vesalgasse 1, 4051 Basel, Switzerland
4
EnviroSPACE, Institute for Environmental Sciences, University of Geneva, Bd Carl-Vogt 66, 1205 Geneva, Switzerland
5
Guangdong Provincial Key Laboratory of Soil and Groundwater Pollution Control, School of Environmental Science and Engineering, Southern University of Science and Technology, Xueyuan Road 1088, Nanshan District, Shenzhen 518055, China
*
Author to whom correspondence should be addressed.
Sustainability 2018, 10(4), 960; https://doi.org/10.3390/su10040960
Submission received: 8 March 2018
/
Revised: 18 March 2018
/
Accepted: 19 March 2018
/
Published: 26 March 2018
Abstract
:Knowing the impact of land-use and land-cover (LULC) changes on the distribution of water yield (WY) is essential for water resource management. Using the Integrated Valuation of Ecosystem Services and Tradeoffs (InVEST) model, we investigated the spatial-temporal variations of WY from 1990 to 2015 in China’s northern semi-arid region of Beijing–Tianjin–Hebei (Jing-Jin-Ji). We quantified the combined effects of LULC dynamics and climatic variation on WY. Furthermore, we identified the relative contribution of main LULC types to WY. For our study region, the built-up area increased by 35.66% (5380 km2) during the study period. In the meantime, cropland, grassland, and wetland decreased continuously. The expansion of built-up area and decline of vegetated land led to an increase of 1047 million m3 (5.1%) in total WY. The impacts of LULC changes on WY were mainly determined by the biophysical characteristics of LULC composition. Vegetated land has relatively lower WY coefficients due to higher rates of evapotranspiration and water infiltration. Built-up areas and bare land have higher WY coefficients as a result of their impermeable surface. The spatial-temporal analysis of WY with specification of WY coefficients by LULC types can facilitate integrated land-use planning and water resource management.

1. Introduction
Land-use and land-cover (LULC) change has direct impacts on ecosystems and their associated services, particularly on water yield (WY). WY is the total amount of water that runs off the ground within a region [1]. The regular distribution of WY is essential to the hydrological balance, since a decrease may result in water scarcity and a sharp increase causes flooding [2]. Studies have demonstrated that LULC change can modify the underlying mechanisms of transferring rainfall to WY through altering an ecosystem’s hydrological characteristics such as infiltration, evapotranspiration, and groundwater recharge capacity [3,4,5]. Therefore, in response to LULC changes, WY variation reflects the hydrological services of different land ecosystems.
Many researchers have explored the effects of LULC changes on WY over a range of spatial and temporal scales [4,6]. In general, these studies have focused on the impact of LULC change on total WY over a certain time span [7,8] and/or WY responses to a typical LULC type, such as forest, cropland, or built-up land (urbanization/commercial land) [9,10,11,12]. Little attention has been given to quantative evaluation on the WY capacities of different LULC types. Quantifying WY specific to individual LULC type is not only useful to the after-event analysis, but also crucial to improve the predictability of WY responses to LULC dynamics, which will facilitate future integration of LULC planning and water resource management.
In the past, studies investigating the impact of LULC change on WY have been mainly based on paired catchment experiments. However, it is difficult to locate two catchments with similar characteristics in terms of slope, area, soil, climate and vegetation. Strict selection criteria restrict the studies to a small scale. In addition, those experiments are time consuming and the results are sometimes contradictory [10,13]. Zhou et al. [14], for example, pointed out the opposite findings from two similar experiments in China’s Yangtze River basins: one found out that there was a significant increase in WY as a result of the clearing of forest; in contrast, the other concluded that the WY increased greatly after afforestation. In recent years, models for ecosystem service evaluation have been developed. They generally have the characteristics of ease of use, using globally available data, accepting spatially explicit inputs and producing spatially explicit outputs, and limiting the model structure to key biophysical processes involved in LULC change [15]. The InVEST (Integrated Valuation of Environment Services and Tradeoffs) model was developed in line with this philosophy. Based on the different LULC scenarios, InVEST provides a way of evaluating WY from an ecosystem services perspective [16]. The WY suite of InVEST is designed to simulate the annual biophysical contribution of LULC to WY. It is flexible for use with regards to scale (local, regional or global), data input, assessment, and mapping details, and could provide more direct and visual results for decision-making support [17,18,19].
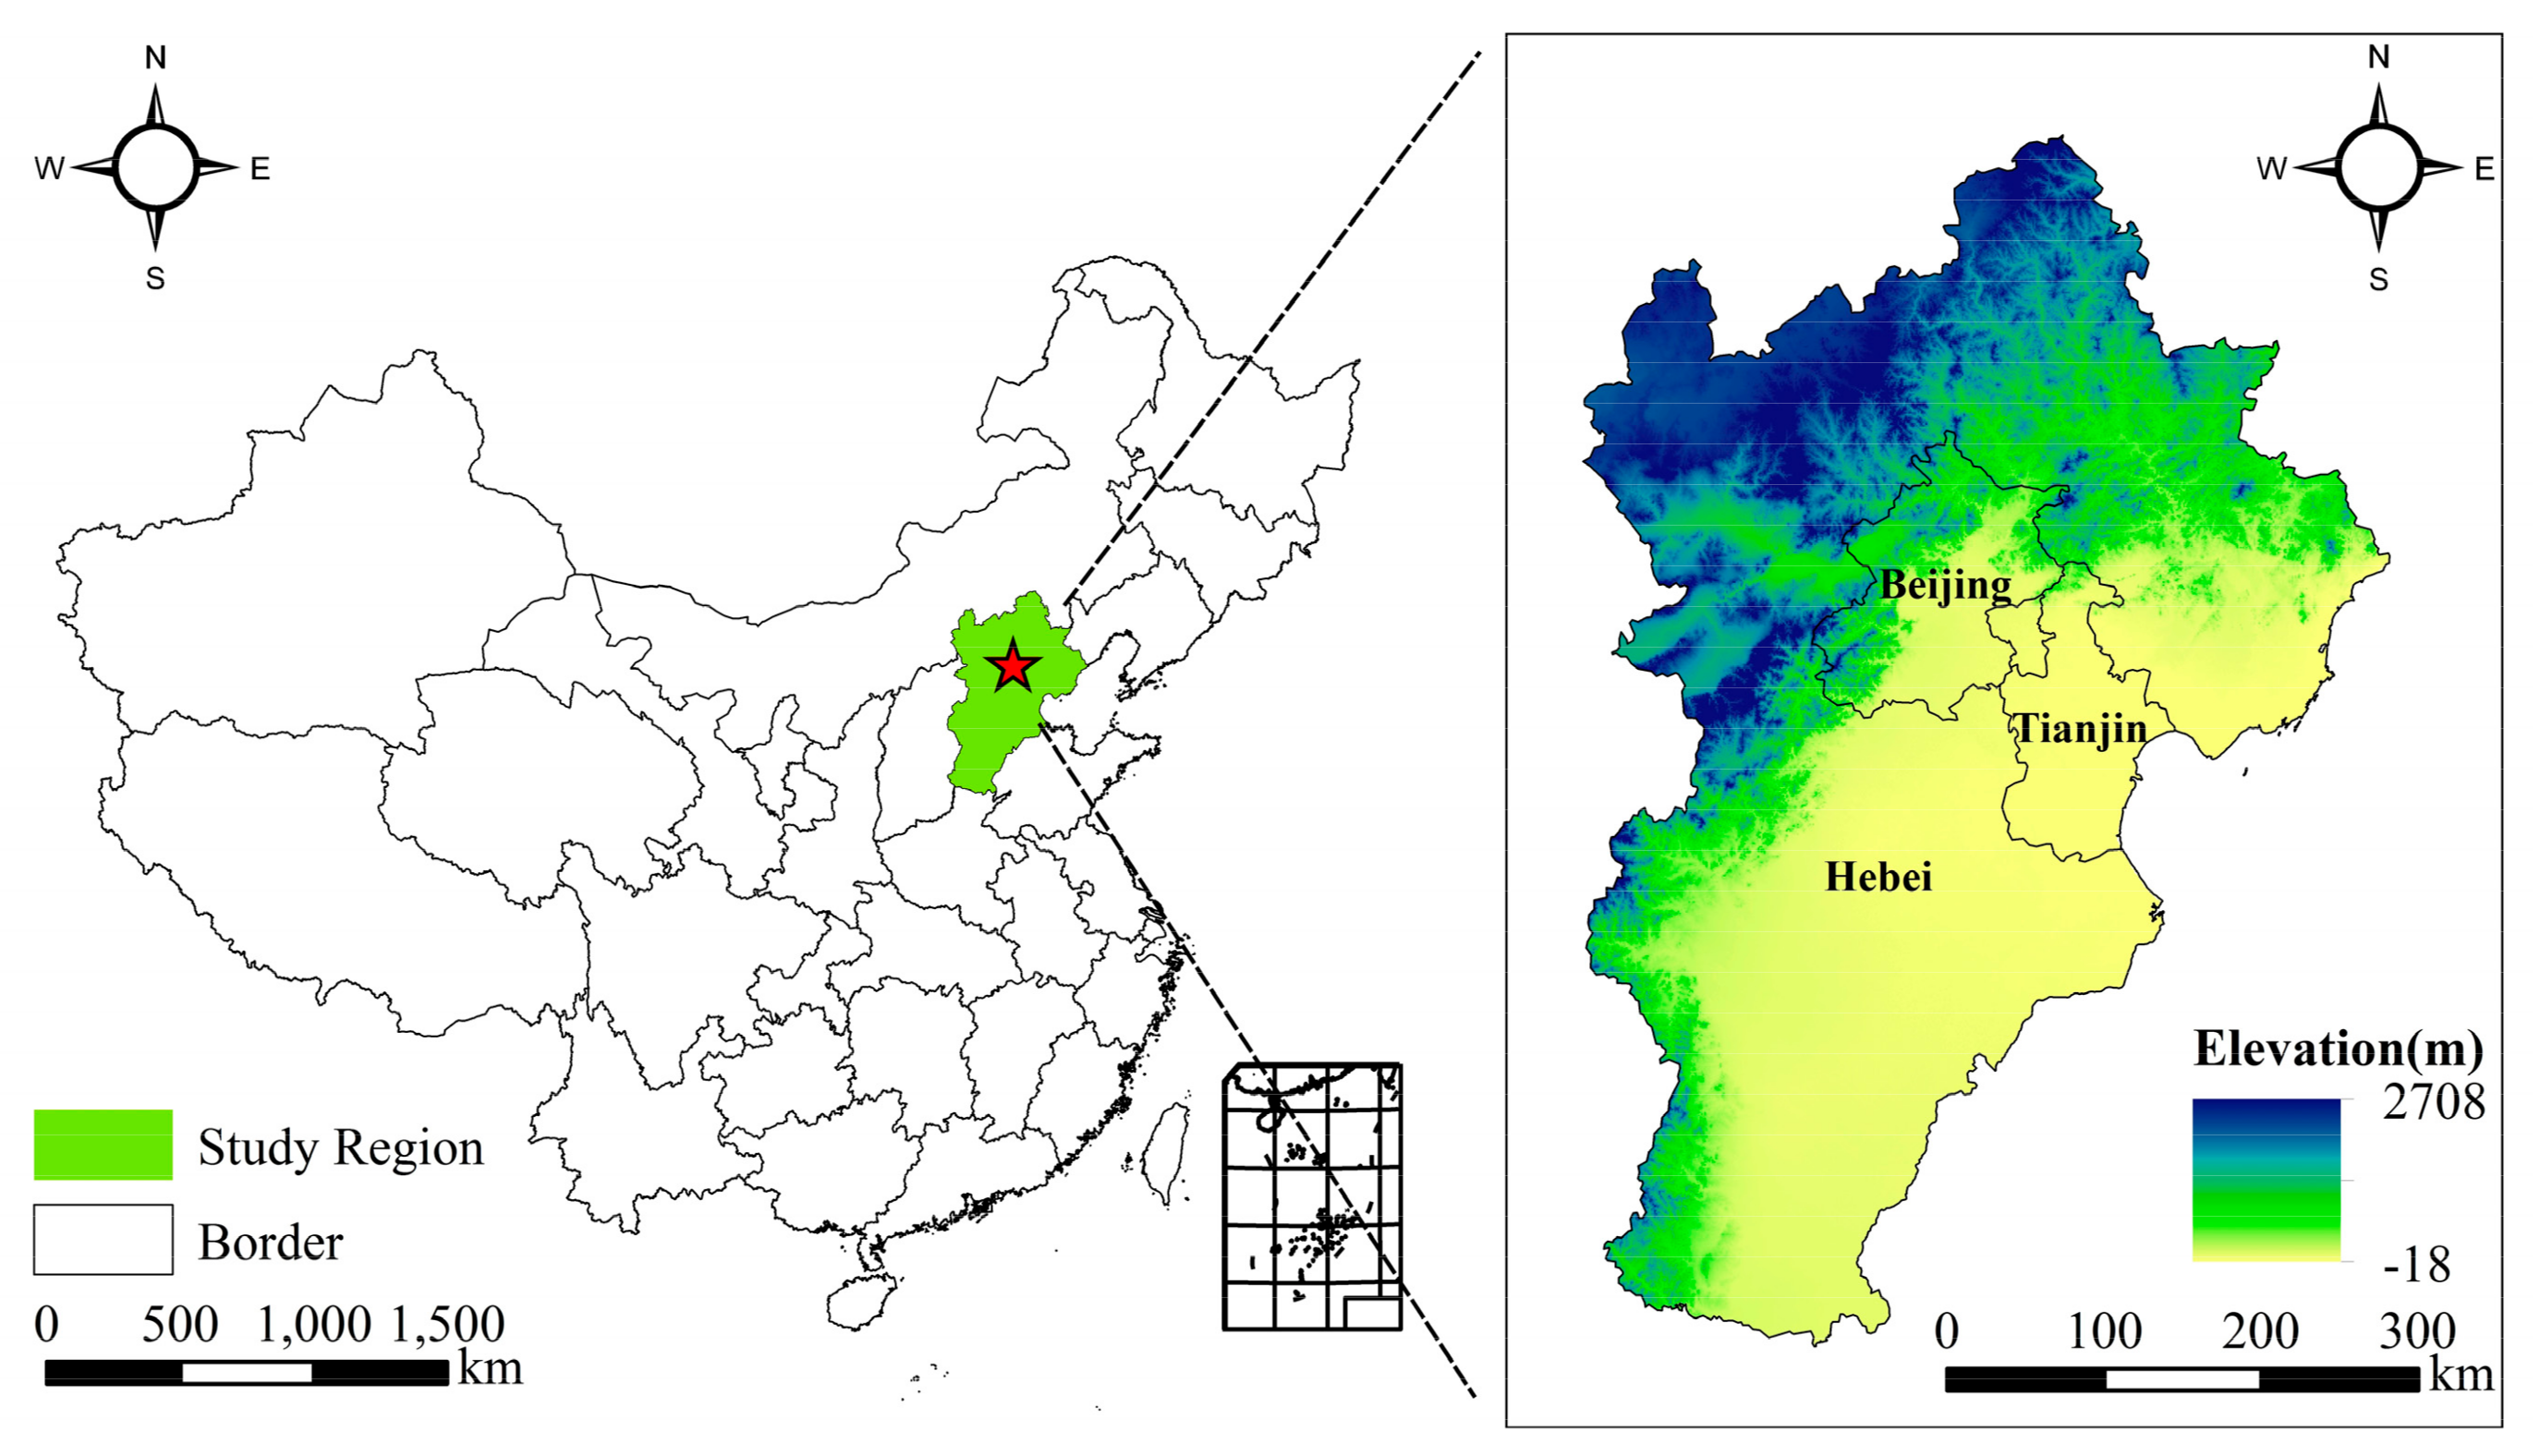
The Jing-Jing-Ji region in the northern semi-arid China (Figure 1) is the abbreviation for the capital city Beijing (Jing) and its neighboring areas Tianjin (Jin) and Hebei (Ji). The region is the third largest economic center after the Yangtze River delta region and the Pearl River delta region in China [20]. However, Jing-Jin-Ji has been suffering increasing water scarcity [21,22,23]. The annual water resource per capita decreased from about 300 m3 per capita in 1990 to 143 m3 per capita in 2015 [24]. The average annual water deficit increased from 6.5 billion m3 during the period from 1990 to 1999, to around 7.4 billion m3 for the period from 2000 to 2015 [25,26]. Over-exploitation of water in the region has resulted in serious ecological deterioration [27]. On the other hand, urban flooding events have frequently occurred in recent years, of which the most catastrophic were the “7.21” flood in Beijing city on 21 July 2012 and the “7.19” flood in Xingtai city of Hebei province on 19 July 2016. The region, therefore, is in a situation with a paradoxical coexistence of increased water scarcity and urban flooding [28]. The paradox in the Jing-Jin-Ji region stimulated many hydrological and hydraulic studies, of which the majority focused on the influences of LULC changes on WY at the individual river basin level for the Hai river, Luan river, Miyun reservoir, Chaobai river, and Baiyangdian river [8,29,30,31,32,33]. However, there is a lack of quantitative analysis of the relationship between LULC change and WY for the whole Jing-Jin-Ji region.
Focusing on the Jing-Jin-Ji region, the primary aim of our study is to provide fundamental knowledge for sustainable LULC planning and water resource management. The specific objectives of this study are to: (1) evaluate the spatial-temporal changes of the WY response to climatic variation and LULC change over the period of 1990 to 2015; (2) identify the impacts of LULC changes on WY by assessing LULC change scenarios with the InVEST model; and (3) define and analyze the WY coefficients of various LULC to predict WY for future LULC planning.
2. Materials and Methods
2.1. Study Area
The Jing-Jin-Ji region is located in the heart of northern China between 113°04′–119°53′ E and 36°01′–42°37′ N, and covers an area of approximately 215,000 km2, accounting for 2.3% of the national territorial area of China (Figure 1). The region contains the capital city Beijing, Tianjin municipality and 11 city-level administrative entities in Hebei province, and is home to more than 110 million people, accounting for 7.23% of the national population. The region belongs to the continental semi-arid monsoon climate, which is characterized by cold-dry winters and hot-rainy summers. Most precipitation happens from June to September and the mean annual precipitation is 508 mm. The mean annual evapotranspiration of the region ranges between 1500–2000 mm.
The Jing-Jing-Ji region is the political, cultural and economic center, and the important base for advanced technology and heavy industries, in north China. Rapid and extensive economic development have resulted in major changes in LULC in the region over years. This has placed enormous pressure on water resources in terms of quantity and distribution in the region. The average annual water resource per capita for Beijing and Tianjin is only approximately 120 m3/year/capita and that for Hebei is about 160 m3/year/capita [24]. With increasing water demand and water pollution, the water environment is getting worse in terms of incremental groundwater depletion, river dry-ups, and degradation of wetland [34].
In order to mitigate ecological threats and promote the sustainable development of capital areas, the national strategy of “Jing-Jin-Ji coordinated development strategy” was released in 2015. The strategy stresses the goal of ecological sustainability in the region [35]. However, increasing water scarcity is the key obstacle in achieving sustainable economic and ecological development of the region.
2.2. Data Collection and Processing
2.2.1. Land-Use and Land-Cover (LULC) Change
In this study, land use refers to the purposes for which humans use landscape resources, and land cover refers to both natural and artificial components of the landscape [33]. Land-use and land-cover (LULC) change demonstrates how land has changed over time under the effects of natural factors and human activities. LULC change has become an important theme of research in areas of ecological problems and ecosystem services [36,37,38].
Two data sources, governmental statistics and geographic information system (GIS) data by remote sensing, are usually used for LULC change studies [20,39]. The statistics on LULC by governmental departments are regarded as authoritative in China. However, due to different statistical calibers and different administrative departments in charge of the statistics of different land uses, e.g., the agricultural department is in charge of cropland statistics and the forestry department in charge of statistics on forest and wetland, it is difficult to get consistent and complete time series data for this study purpose. Even the data that is available for several years or for some LULC types lacks spatial information, which cannot meet the requirement of the InVEST model for WY. Geographic information system (GIS) data can show land-use changes spatially and temporally and has been widely applied in the LULC change research based on remote sensing [40,41,42].
In this study, we used the LULC GIS images of 1990, 2000, 2010 and 2015, which were obtained from the Data Center for the Resources and Environmental Sciences, Chinese Academy of Sciences (RESDC). We rectified and reclassified the LULC maps according to governmental statistics [43,44].
The spatial resolution of those LULC images is in a 100 m × 100 m grid, with a relatively high interpretation accuracy of 94.3% [45]. The LULC types were reclassified for all the studied years into six major types, namely cropland, forest, grassland, wetland, built-up land, and bare land (see Table S1 in Supplementary Material). We adopted the definition of the Ramsar Convention on wetlands as “areas of marsh, fen, peatland or water, whether natural or artificial, permanent or temporary, with water that is static or flowing, fresh, brackish or salt, including areas of marine water the depth of which at low tide does not exceed six meters” [46]. The wetlands of the Jing-Jin-Ji region mainly consist of river, lake, marsh, paddy land, and reservoir. A LULC conversion matrix from 1990 to 2015 was calculated by using the ArcGIS toolkit (Esri).
2.2.2. Input Data for Water Yield (WY) Simulation
The WY module of InVEST requires input data of precipitation, reference evapotranspiration (ET0), soil depth, plant available water content (PAWC), LULC, the biophysical table reflecting the attributes of each LULC, and the seasonality factor Z. Precipitation and measured evapotranspiration data were obtained from daily climate datasets for 1988–2015 from the Meteorological Center of China Meteorological Administration [47]. The ET0 was calculated based on the measured evapotranspiration by referring to Allen et al. [48] and calibrated repeatedly in line with the WY result validation. We calculated and interpolated the pixel-averaged annual precipitation and ET0 using ArcGIS.
Soil depth was obtained from the China Database of Soil Properties for Land Surface Modeling [49]. PAWC was calculated as:
where , , and are, respectively, the percentage of the content of sand, silt, clay, and carbon in the soil [50].
LULC maps were obtained from RESDC (see details in Section 2.2.1). The root depth and evapotranspiration coefficient Kc were determined following the Food and Agriculture Organization (FAO) 56 guidelines [48]. The Z value was tested and verified based on the model sensitivity analysis and WY result validation.
The InVEST model was run for each of the four LULC periods (1990, 2000, 2010 and 2015). We ran the model separately for each of the three administrative entities of Beijing city, Tianjin city, and Hebei province to fine-tune and validate the model. The validated WY values for the three administrative entities were summed-up to obtain the total WY of the Jing-Jin-Ji region.
2.3. The Integrated Valuation of Ecosystem Services and Tradeoffs (InVEST) Model
InVEST is a spatially explicit tool consisting of a suite of free and open-source software that use LULC patterns to map and quantify goods and services from natural systems [1]. It enables quantifying the ecosystem service spatially and dynamically and allows the impact of LULC change on ecosystem services to be evaluated [16].
The InVEST WY model is based on the Budyko theory, which is a unique empirical function that relates the ratio of actual evapotranspiration to precipitation to the ratio of potential evapotranspiration to precipitation [1]. It can simulate the impact of LULC on WY by incorporating the biophysical components of different LULC types into the simulation, and computing the WY by different ecosystems of the landscape. To observe and represent grid-level changes to the landscape, the InVEST WY model represents explicitly the spatial variability in precipitation, potential evapotranspiration (PET), soil depth, and biophysical characteristics of different LULC like root depth and evapotranspiration coefficient. The model runs in gridded format and acquires the input in raster format, which in turn helps the heterogeneity of LULC influencing the WY to be understood. It produces spatially explicit output and shows the WY results under different biophysical processes involved in LULC changes. The good performance of the model has been demonstrated in previous studies [51,52,53].
In this study, the WY model of InVEST version 3.3.2 was used to simulate the WY changes for the Jing-Jin-Ji region. The outputs of the model were shown in both rasters, representing an average WY per pixel (100 m × 100 m), and tables illustrating the detailed simulated information at regional level. As defined in the InVEST user’s guide [1], the WY model is based on the Budyko curve and annual average precipitation. The annual WY for each pixel on the landscape is calculated as follows:
where is the annual actual evapotranspiration for pixel and is the annual precipitation on pixel .
For vegetated LULC, the evapotranspiration portion of the water balance is based on an expression of the Budyko curve:
where is the potential evapotranspiration and is a non-physical parameter that characterizes the natural climatic-soil properties. Potential evapotranspiration is defined as:
where is the reference evapotranspiration from pixel and is the plant (vegetation) evapotranspiration coefficient associated with the LULC on pixel .
is an empirical parameter that can be expressed as a linear function of , where is the number of events per year, and is the volumetric plant available water content, and is defined as:
where is an empirical constant referred to as “seasonality factor”, which captures the local precipitation pattern and additional hydrogeological characteristics. It is positively correlated with N, the number of rain events per year. The floating point value is in the order of 1 to 30 corresponding to the seasonal distribution of precipitation.
2.4. WY Under Four LULC Change Scenarios
With the calibrated model, scenario simulations were used to explore the contribution of LULC to WY. Four LULC scenarios, namely the 1990 baseline (1990B), 2000S, 2010S and 2015S, were considered. In each simulation, all inputs were kept fixed except LULC. For the 1990B, the WY was simulated under the climatic condition and LULC of 1990. Under the LULC change scenarios, the climatic variables of precipitation and ET0 were set to the 1990B and the LULC data of 2000, 2010, and 2015 were used. The difference of WY between the 1990B and other scenarios were considered as directly caused by LULC changes.
2.5. WY Coefficient
The WY coefficient is defined as the ratio between WY and precipitation per hectare of each LULC type. The WY coefficient describes the amount of WY converted from precipitation under the effects of evapotranspiration, degree of saturation and infiltration [54]. Based on the modeled WY under LULC change scenarios, and taking in consideration of climatic variation, we quantified the WY coefficient for each LULC type.
3. Results
3.1. InVEST Calibration and Validation
The modeled WY was checked and validated against the observed yearly data in three administrative entities [26]. Based on the sensitivity analysis and calibration of the input parameters, it was found that for the Jing-Jin-Ji region, the yearly WY variation mainly followed the changes of yearly precipitation, LULC, and Z constant. After testing repeatedly by taking into consideration the number of rainy days for the simulated year, results closer to the measured data were achieved when Z ranged from 10 to 15.
In consideration of the small sample size and possible outliers, we applied the permutation linear regression that deals with non-normal data to compare the modeled WY with observed WY [55]. The permutation test showed a close correlation with R2 = 0.98 (p < 0.01), which demonstrated that InVEST can be used to simulate the spatial and temporal variation in yearly WY at the regional scale.
3.2. Annual WY
The annual WY was simulated for 1990, 2000, 2010, and 2015 under varying precipitation and LULC changes. The annual amounts of WY for 1990, 2000, 2010, and 2015 were 20.5 × 10⁹ m3, 13.5 × 10⁹ m3, 27.08 × 10⁹ m3, and 22.91 × 10⁹ m3, respectively. The WY had a large variation for the simulated period. The highest WY was produced in 2010, which was twice the WY in 2000. In line with the trend in the total WY, the average WY depth per hectare for the studied periods were 94.37 mm, 61.54 mm, 130.51 mm, and 105.75 mm respectively (Figure 2a). The average WY depth per hectare showed temporal and spatial differences for each year. In 1990, more than 1/4 of the area with a WY depth of 100–200 mm was located in the central part of the study region, accounting for nearly half of eastern Beijing and western Tianjin. In 2000, only a small portion of area had a WY depth of 100–200 mm, located in the north-east. In 2010, the area with a WY depth of 100–200 mm covered about half of the region, and was located in the east and south-west. In 2015, the area with a WY depth of 100–200 mm was mainly concentrated in the north-east. Generally, the WY depth decreased from west to east and the highest WY depth was in the north-east.
Based on the pixel-level Pearson correlation, the correlation between precipitation and WY was moderate (r = 0.52), which means that the increase of precipitation is likely to have a positive effect on WY in the region. The temporal and spatial pattern of precipitation (Figure 2b) shows that the average annual precipitation has a gradient of decline from east to west. The parts of lower annual precipitation are located in the north-west and west, and the areas with annual precipitation above 600 mm are concentrated in the east. Such precipitation distribution partly explained the trend that the average WY depth decreased from east to west. Comparing the geographical distribution of yearly precipitation to WY depth per pixel, the WY generally rises with high precipitation. For instance, in 2010, the highest precipitation was located in the eastern part of the region (Figure 2b). Correspondingly, the average WY depth also tended to be higher in the same location (Figure 2a). The average precipitation of 2010 was up to 552 mm, which directly resulted in the highest WY in this year. The lowest precipitation was observed in 2000 with average precipitation of 440 mm, which resulted directly in the least WY in the year 2000.
3.3. Impacts of LULC Changes on WY
3.3.1. Spatial and Temporal LULC Changes
Over the study period, cropland was the major land-use type (~50%) in the Jing-Jin-Ji region, followed by forest (~21%) and grassland (~16%). While cropland is mostly located at the south-east of the region, forest is mainly distributed in the western Beijing city and northern Hebei province, and grassland is mainly located at the western and northern parts of Beijing city and Hebei province. As a region of water scarcity, wetland covers only around 6% of the area, located at the east coastal area, middle, and north-west of the region (Figure 3).
Cropland, grassland, wetland, and bare land were in continuous decline during the study period. Cropland and wetland decreased by 3588 km2 (3.39%) and 1046 km2 (7.75%), respectively. Forest area increased from 1990 to 2000 and kept steady from 2010 to 2015, presumably because of the effect of the “grain to green” policy [56]. The built-up land gradually increased to 20,466 km2 in 2015 with an increase rate of 35.66%, which is consistent with the rapid urbanization trend of the region. The LULC changes in the Jing-Jin-Ji region are presented in Table 1.
3.3.2. LULC Conversion Matrix
According to LULC conversion matrix analysis between 1990 and 2015 (Table 2), 4333 km2 (4.10%) of cropland and 147 km2 (0.33%) of forest were converted to built-up land, and additionally 138 km2 (0.31%) of forest was converted to cropland. Wetland decreased by a relatively large extent of 8%, of which 1005 km2 (7.45%) was converted to cropland and 642 km2 (4.76%) was converted to built-up land. Of bare land, 55 km2 was converted to built-up land and 27 km2 was converted to cropland. In general, almost all the decreases in cropland, grassland and wetland were converted to built-up areas, which increased by 5380 km2 (35.66%).
3.3.3. WY Under LULC Change Scenarios
Compared to the LULC baseline in 1990, the average annual WY under three LULC change scenarios consistently increased over time and ranged from 20.50 × 10⁹ m3 to 21.55 × 10⁹ m3 (Table 3).
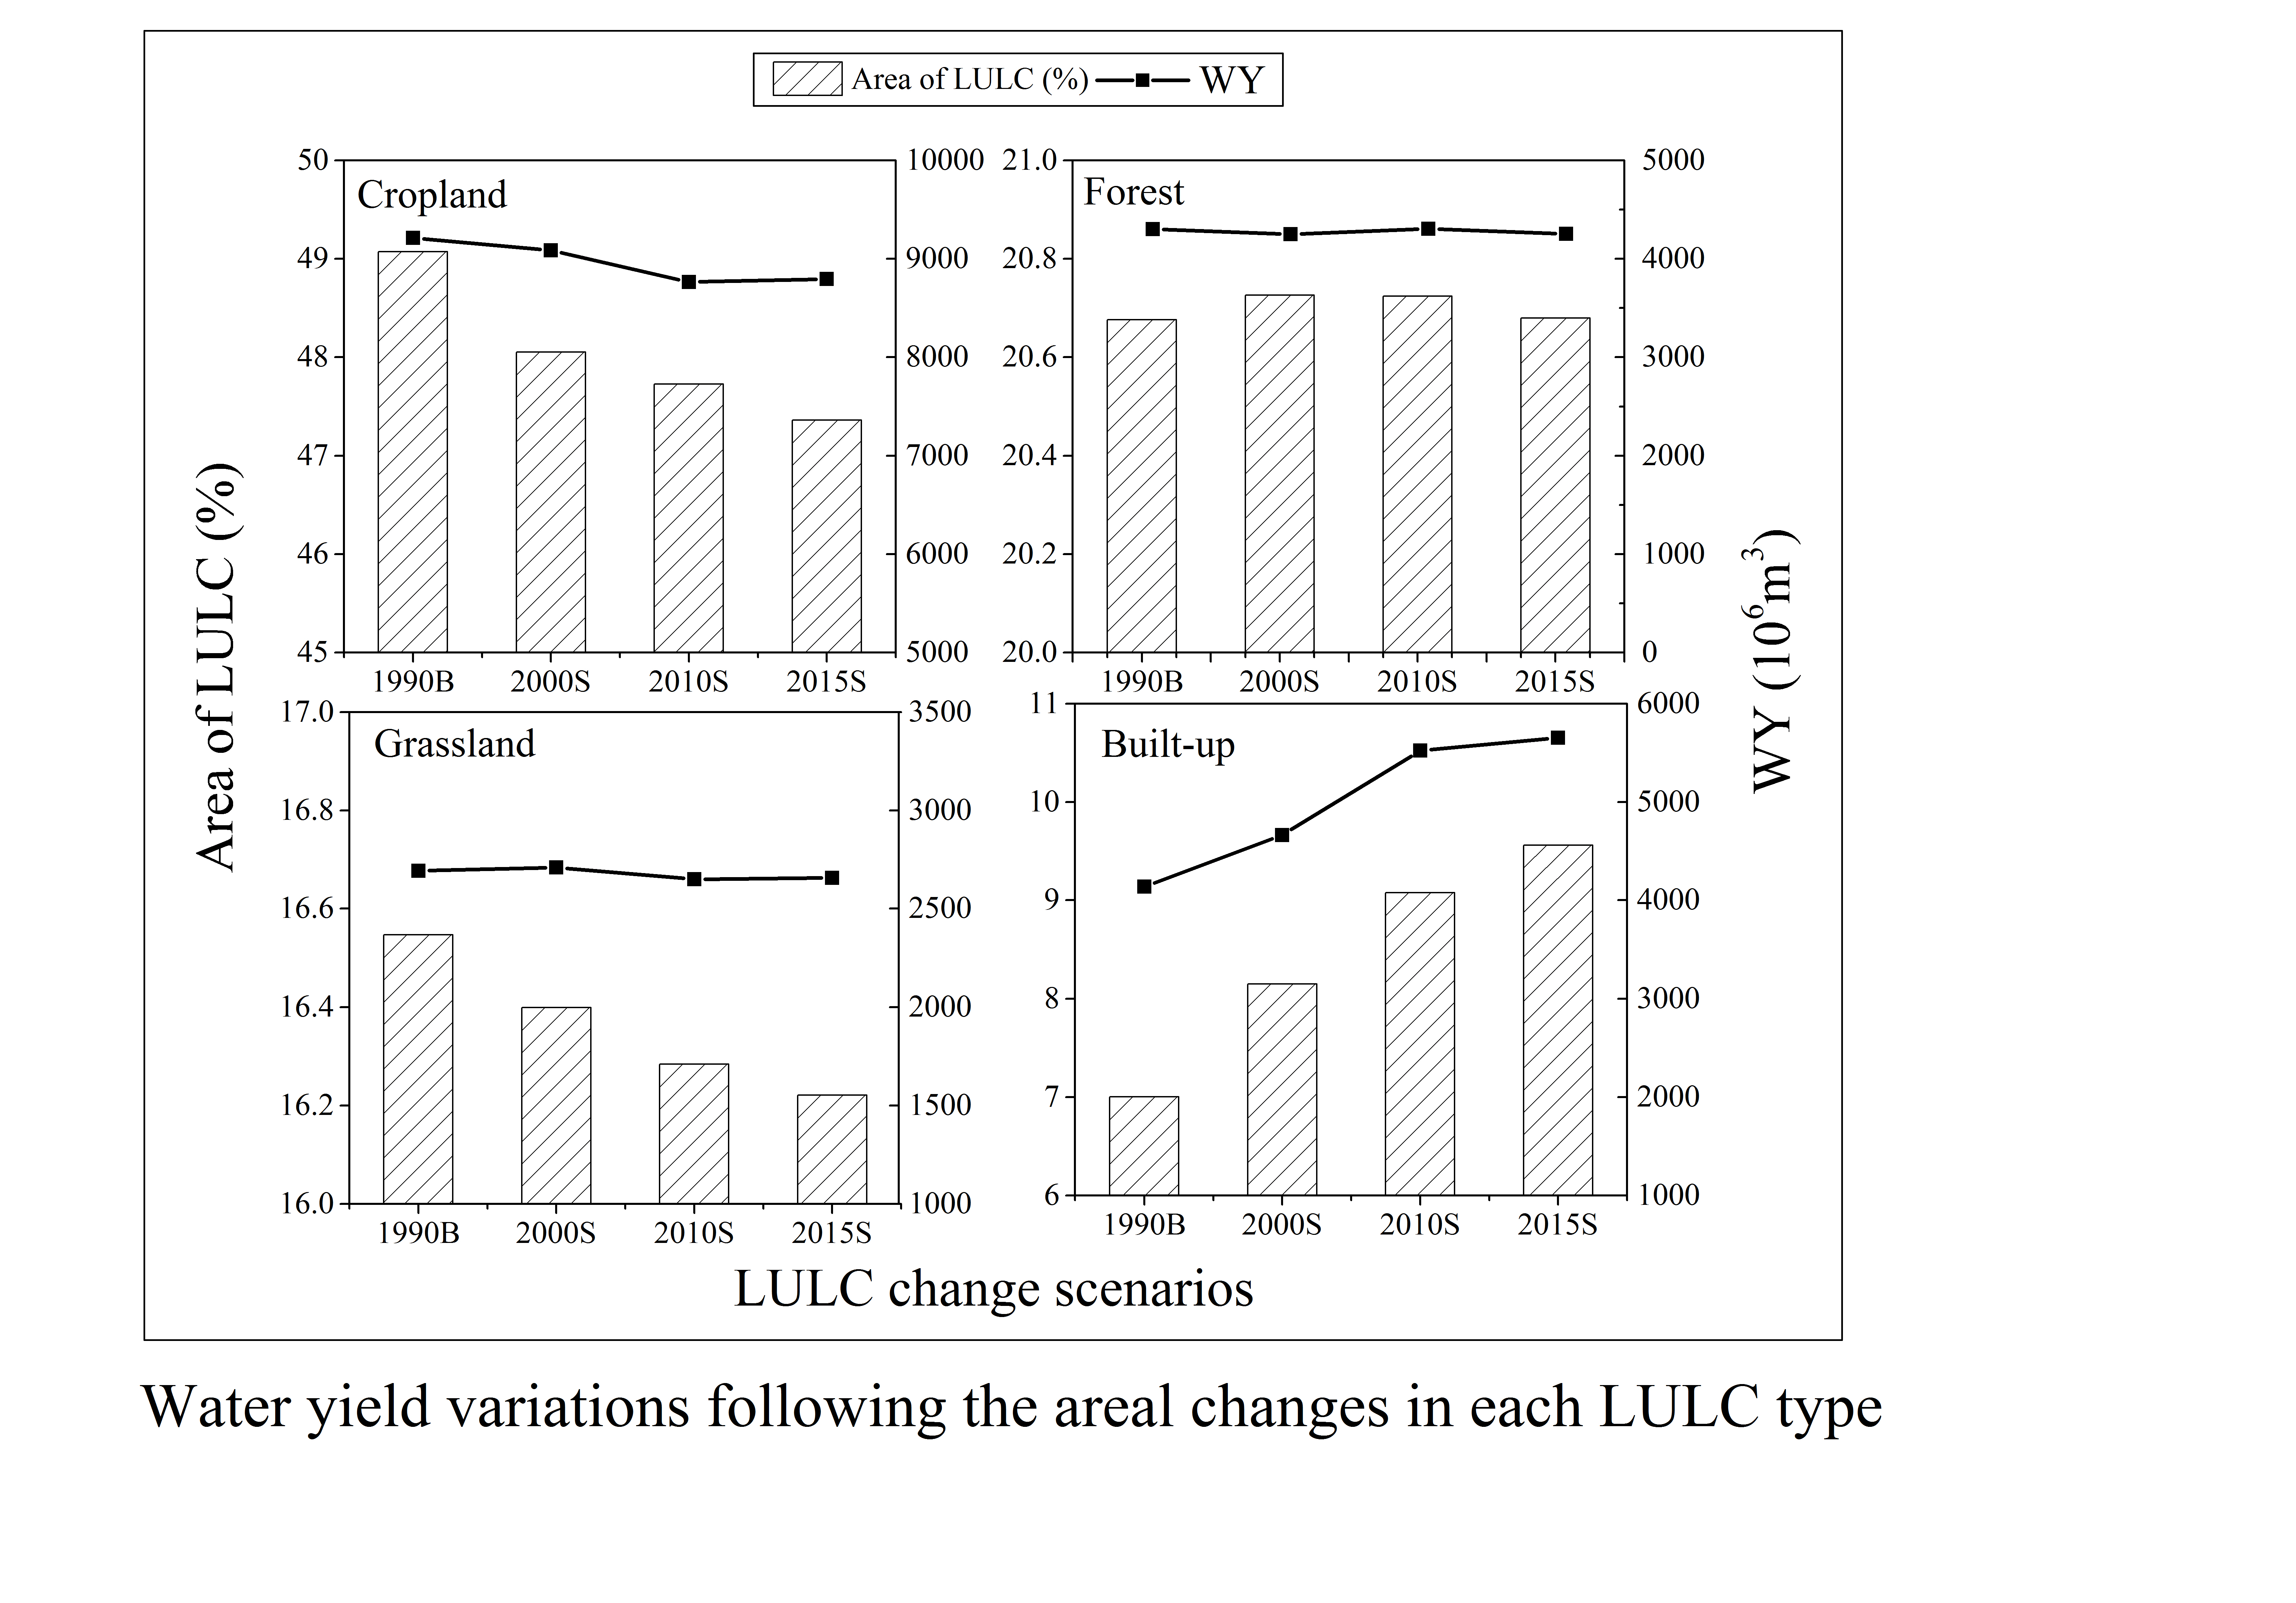
Although three scenarios were based on the same climatic inputs, the simulated average actual evapotranspiration (AET) for different LULC types differs greatly. The highest AET of 468 mm was observed in forest land and the lowest AET of 244 mm was observed in built-up land. At the same precipitation, the higher the AET, the lower will be the WY. The differences of WY responding to changes in each LULC type can be visualized in Figure 4. As the WY of bare land and wetland accounted for a small proportion of the total WY, they are not shown in Figure 4. The total area of cropland decreased from 49.07% in 1990 to 47.36% in 2015. Accordingly, the percentage of annual WY by cropland decreased from 45% to 41%. Conversely, the area taken by built-up land increased by 2.5% of the total region, and the corresponding WY of built-up land increased from 4.14 × 10⁹ m3 to 5.65 × 10⁹ m3, an increase of 36.47%. Such trends suggest that the decrease of annual total WY could be ascribed to the shrinkage of cropland and the increase of annual total WY mainly resulted from the expansion of built-up land.
The Pearson correlation was also analyzed between the change of each LULC type and hydrological components of WY and AET. Results showed that the built-up land changes were strongly correlated to the changes in WY and AET (p < 0.05). A very strong positive correlation was found between the built-up land and WY (Pearson’ r = 0.99). In contrast, the AET was negatively associated with the expansion of built-up land (Pearson’s r = −0.94). Such correlation results indicate again that built-up land has a larger impact on lowering the AET and increasing the WY than vegetated land. The finding that built-up land produces more WY while vegetation land generates lower WY was in line with the existing studies [7,57].
3.3.4. WY Coefficients of LULC Types
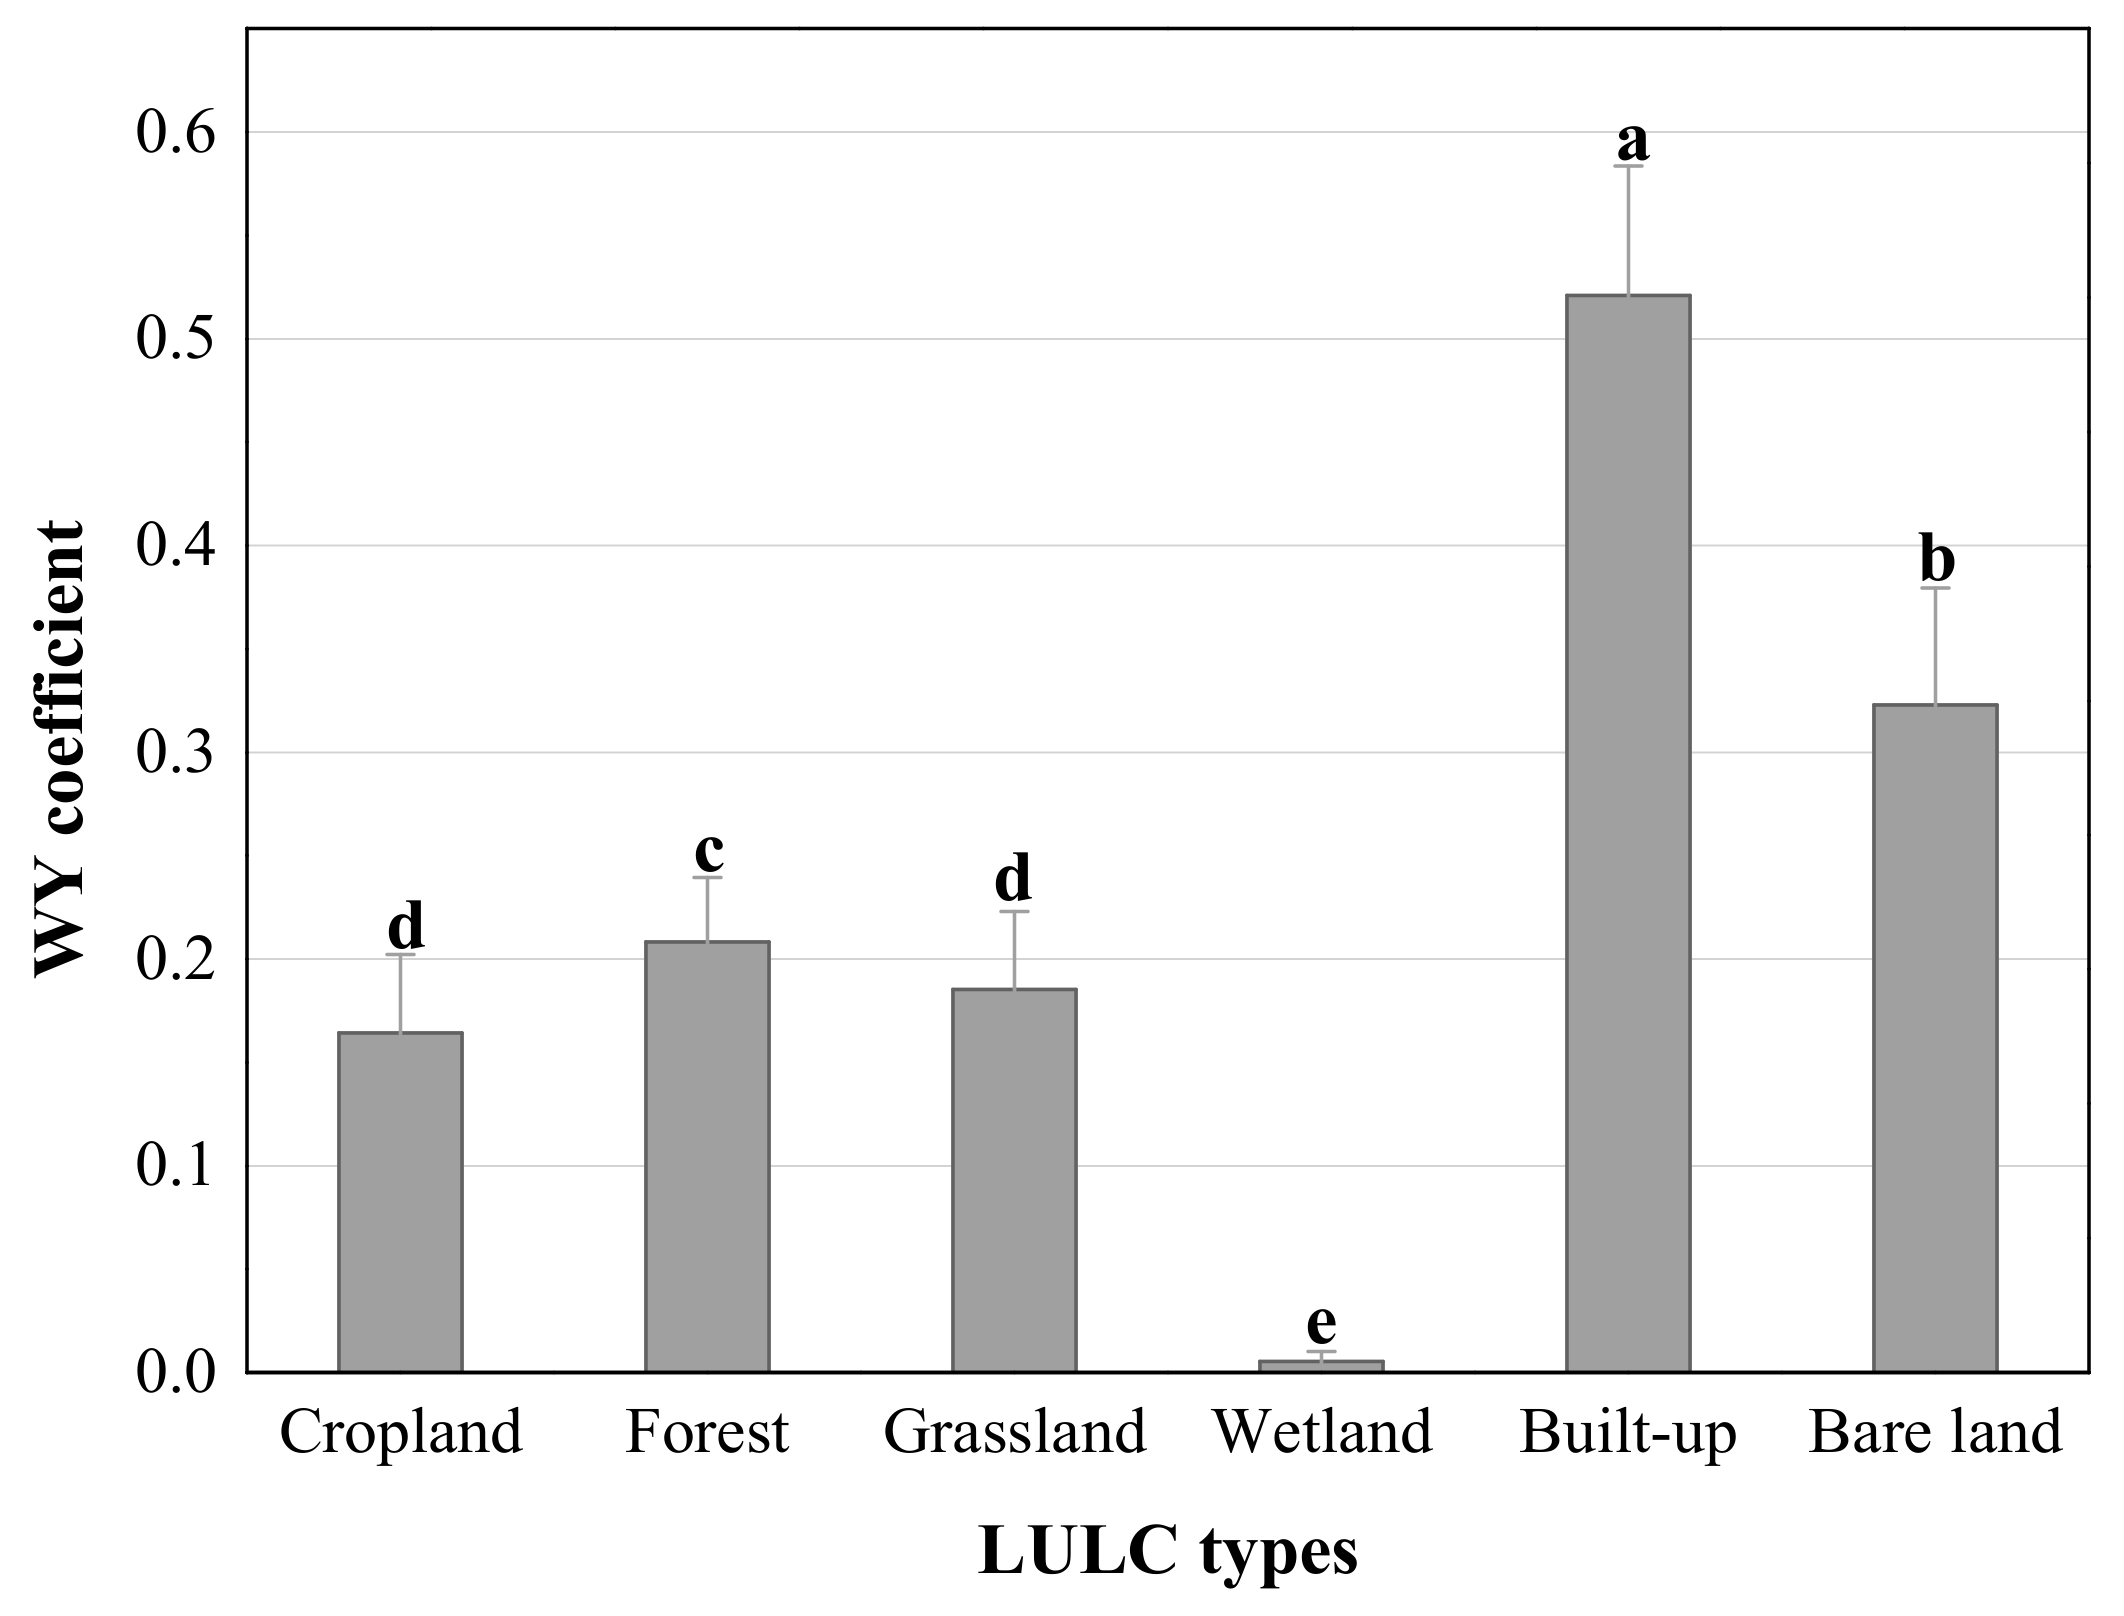
Due to the infiltration and evapotranspiration affected by the variation of climatic conditions from 1990 to 2015, the WY coefficient for the same LULC type was lower in dry years than in rainy years. Although there is such variation, the magnitude of WY coefficient of each LULC type kept stable and WY coefficients of six LULC types showed significant differences (p < 0.05) (Figure 5). On average, the WY coefficient of built-up land (0.52 ± 0.06) was the highest, followed by bare land (0.32 ± 0.06) and vegetated lands of forest (0.21 ± 0.03), grassland (0.18 ± 0.04) and cropland (0.16 ± 0.04). The WY coefficient of wetland was close to 0.
4. Discussion
4.1. WY under LULC Changes
Precipitation and LULC change are key drivers to the change of WY in the Jing-Jin-Ji region. The results suggest that while precipitation determines how much water is provided by nature, it is the LULC that determines the amount of water converted to WY and water storage. LULC change can modify hydrological regimes of evapotranspiration, infiltration and water retention, and the water available to rivers and ground water resources [58]. For the InVEST model, the WY from each cell in the landscape is calculated as the annual amount of rainfall minus the actual evapotranspiration, and is determined by the LULC vegetation characteristics [59]. Therefore, the WY results under different LULC scenarios implied the hydrological consequences of LULC changes.
In the Jing-Jin-Ji region, agricultural areas are mostly under rotated cultivation, which have a greater capacity to hold the water in plants and soil than single-season cropland. This might explain the relatively lower WY coefficient of cropland (0.16 ± 0.04). Nearly half of the region was croplands, and about 40% of the total WY of the region was generated from croplands. The WY coefficient of forest (0.21 ± 0.03) was higher than that of cropland. This is inconsistent with most previous studies which suggested that forest caused the biggest decrease in WY [60,61]. A possible reason is that up to 60% of forest in our study region were shrubs and sparse forest, which have lower water-retention capacity compared to natural dense forest. Similarly, more than 80% of the grassland in the region has a low to medium coverage, which lowered the water-retention capacity. Although the built-up land only covered 7–9% of the total area, it accounted for around 20% to 26% of the total WY due to its high WY coefficient ranging from (0.52 ± 0.06).
Our results indicated that the WY coefficient of vegetated land was far lower than that of the built-up land, which revealed that the canopy, coverage and roots of vegetation increase evapotranspiration, soil and water retention, and water infiltration along with the capacity of plants to capture the moisture [62,63,64]. More WY could be produced by built-up land especially in storm periods because impervious surfaces reduce the infiltration and concentration time [65]. Similar conclusions were also reached by Yang et al. [66] and Zhao et al. [67], who showed urbanization increased flooding while vegetated land could transfer water to the soil. Wetlands could perform an important role in hydrological flows like water storage and retention, ground water recharge/discharge, and flood regulation. Wetlands can also act as sponges to soak up water during wet periods and release it in dry seasons [68]. However, the wetland area in Jing-Jin-Ji covered only around 6% of the total area and continues to decrease. Therefore, wetland protection and restoration are urgently needed for the region to enhance water regulation.
4.2. WY Prediction for LULC Planning
With regard to the impacts of LULC change on WY, previous studies have mainly investigated the annual WY variation in response to LULC changes over a certain temporal scale by using the InVEST model [33,63,69,70]. There is a lack of knowledge regarding the WY capacity of individual LULC types, particularly in the Jing-Jin-Ji region. Based on the assessment of annual WY variation, our study examined the WY coefficient assigned to each LULC type in order to specify the different WY capacities of LULC types. The WY coefficient plays a fundamental role in the planning, design and operation of water resources in the region.
The LULC change analysis showed that Jing-Jin-Ji has been experiencing a rapid expansion of urban areas, which means more WY is produced on its impermeable surface. Using the WY coefficient and areas changed to built-up land, we can predict the amount of WY increased by urbanization, based on which the capacity of infrastructure or the green spaces that contribute as urban ecological venues [40,71] can be designed and constructed to retain water in artificial or natural ways. For example, according to the WY coefficients illustrated in Section 3.3.4, the mean WY coefficient of cropland is 0.16 and the mean WY coefficient of built-up land is 0.52. If we change cropland to built-up land, the WY will be more than triple under the same climatic conditions.
The impact of LULC change on the hydrological regime is a complex process and the effects vary depending on the land-use types, the size of the affected areas, and their landscape location [5]. To improve predictions, the differences in sub-types of the main LULC type, land-use history and development stage of the vegetation and climatic conditions should be taken into consideration [72]. For example, generally, forest with high canopy has a higher capacity of evapotranspiration than sparse forest and shrub land [48] so that the newly reforested land or sparse forest areas may have a higher WY coefficient than existing cropland with year-round cultivation. In wet years, more precipitation is likely to be converted to WY if the soil is saturated and the WY coefficient tends to be at its maximum, while the opposite would occur in dry years.
4.3. WY and Blue Water Availability: Policy Implication
From the ecosystem service perspective, changes in WY associated with LULC changes have two major effects: contributing to the blue water available for consumption and/or increasing flood risk during storms [73]. How rainfall converts to water availability is the key question for land-use planning and water resource management. Our study suggested that creating vegetated land can reduce WY and conversion to built-up land may increase WY due to decreased permeability and evapotranspiration. Plant coverage can also affect micro-climatic interactions to increase precipitation, especially with forest coverage [74]. Many studies have shown that reduced forest coverage results in an increase in annual flow, flood peaks and flood volume [75]. Therefore, it is crucially important to enhance the policies of “grain to green” and “forest conservation projects” to strengthen water retention and the regulation function of ecosystems [76].
The LULC change analysis implied a rapid urbanization in the region, accompanying enlarged construction areas of residential, road, and other facilities taking up former cropland and other land-use types [77]. Consequently, the total WY under LULC change scenarios was gradually increasing from 1990 to 2015. Urbanization has induced frequent urban flooding in recent years [28]. For urban WY management, well-positioned infrastructure for water collection, delivery, and treatment may work temporarily. However, in the long term, management should consider human–nature interactions to avoid unintended environmental and socio-economic consequences resulting from rapid and large-scale development [78]. Ecosystem-based “green” infrastructures, such as wetlands, well-structured soils, and forest patches, could greatly enhance water storage and flood regulation [79]. The “sponge city” policy currently promoted in China is also an option demonstrating how ecological urban planning can utilize nature for water storage and permeation from rainfall [80]. Our methods of estimating the WY coefficients of different LULC types are useful for calculating regional WY and thus facilitate “sponge city” design.
4.4. Uncertainty of InVEST Model
The InVEST model has been widely applied to evaluate ecosystem services concerning the impact of LULC change [81]. WY is generally evaluated either for prediction of hydrological change or water provision/regulation analysis following LULC changes caused by human activities [82,83]. In this study, we fine-tuned the model parameters using measured data, and performed sensitivity analysis. The results showed that the model was sensitive to climate variables, land-use change, and the Z constant, which is consistent with the findings of existing studies [53,68,84,85]. Although this study has taken full consideration of the above sensitivities and validated the results with observed data, there were still uncertainties resulting from the model itself. The WY module assumes all WY from a pixel reaches the point of interest, and therefore does not distinguish between surface and subsurface water. In addition, because of the limitation of data availability, except for the forest and grassland, the parameters of root depth and the evapotranspiration rate for other major LULC types were given as averages with no consideration of the sub-types within the major type. This resulted in a slight overestimation of the regional WY against measured data. The uncertainties mean that an exact description of the natural processes is still elusive. Nevertheless, our simulation results do reflect the general tendency.
5. Conclusions
We simulated the spatial-temporal changes of WY based on climatic variation and LULC changes in the Jing-Jin-Ji region from 1990 to 2015. Our results demonstrated that InVEST could model the regional WY with high accuracy (R2 = 0.98). By integrated analysis of LULC change and WY, we showed that urbanization was the decisive factor of WY increase during the study period. By estimating WY coefficients of major LULC types, the study investigated the contribution of each LULC type to WY variation. The results indicated that the WY coefficient was determined by the biophysical characteristics of vegetation types, plant coverage and roots, and soil permeability. The WY coefficients of built-up land and bare land are the highest, followed by forest, cropland, and grassland. Using the estimated WY coefficient of each LULC type, we could predict WY variations in future LULC change scenarios. The results could inform policy makers in order for them to make science-based land-use and water management decisions.
Supplementary Materials
The following are available online at https://www.mdpi.com/2071-1050/10/4/960/s1, Table S1: Land use and land cover (LULC) classification.
Acknowledgments
This study was jointly supported by the National Science Fund for Distinguished Youth Scholars (41625001), the National Natural Science Foundation of China (41571022), and the Sino Swiss Science and Technology Cooperation project (EG08-032016).
Author Contributions
Suxiao Li and Hong Yang contributed to the topic, structure design and paper writing. Martin Lacayo contributed to the InVEST simulation data check and English correction. Junguo Liu and Guangchun Lei contributed to the overall research design, ideas and improvement of the writing.
Conflicts of Interest
The authors declare no conflict of interest.
References
- Sharp, R.; Tallis, H.; Ricketts, T.; Guerry, A.; Wood, S.; Chaplin-Kramer, R.; Nelson, E.; Ennaanay, D.; Wolny, S.; Olwero, N.; et al. InVEST 3.3.2 User’s Guide; The Natural Capital Project: Stanford, CA, USA, 2016. [Google Scholar]
- De Groot, R.S.; Wilson, M.A.; Boumans, R.M. A typology for the classification, description and valuation of ecosystem functions, goods and services. Ecol. Econ. 2002, 41, 393–408. [Google Scholar] [CrossRef]
- DeFries, R.; Eshleman, N.K. Land-use change and hydrologic processes: A major focus for the future. Hydrol. Process. 2004, 18, 2183–2186. [Google Scholar] [CrossRef]
- Foley, J.A.; DeFries, R.; Asner, G.P.; Barford, C.; Bonan, G.; Carpenter, S.R.; Chapin, F.S.; Coe, M.T.; Daily, G.C.; Gibbs, H.K. Global consequences of land use. Science 2005, 309, 570–574. [Google Scholar] [CrossRef] [PubMed]
- Woldesenbet, T.A.; Elagib, N.A.; Ribbe, L.; Heinrich, J. Hydrological responses to land use/cover changes in the source region of the Upper Blue Nile Basin, Ethiopia. Sci. Total Environ. 2017, 575, 724–741. [Google Scholar] [CrossRef] [PubMed]
- Li, Q.F.; Cai, T.; Yu, M.X.; Lu, G.B.; Xie, W.; Bai, X. Investigation into the impacts of land-use change on runoff generation characteristics in the upper huaihe river basin, China. J. Hydrol. Eng. 2013, 18, 1464–1470. [Google Scholar] [CrossRef]
- Im, S.; Kim, H.; Kim, C.; Jang, C. Assessing the impacts of land use changes on watershed hydrology using MIKE SHE. Environ. Geol. 2008, 57, 231–239. [Google Scholar] [CrossRef]
- Tang, L.; Yang, D.; Hu, H.; Gao, B. Detecting the effect of land-use change on streamflow, sediment and nutrient losses by distributed hydrological simulation. J. Hydrol. 2011, 409, 172–182. [Google Scholar] [CrossRef]
- Bent, G.C. Effects of forest-management activities on runoff components and ground-water recharge to Quabbin Reservoir, central Massachusetts. For. Ecol. Manag. 2001, 143, 115–129. [Google Scholar] [CrossRef]
- Brown, A.E.; Zhang, L.; McMahon, T.A.; Western, A.W.; Vertessy, R.A. A review of paired catchment studies for determining changes in water yield resulting from alterations in vegetation. J. Hydrol. 2005, 310, 28–61. [Google Scholar] [CrossRef]
- Sun, G.; Zhou, G.; Zhang, Z.; Wei, X.; McNulty, S.G.; Vose, J.M. Potential water yield reduction due to forestation across China. J. Hydrol. 2006, 328, 548–558. [Google Scholar] [CrossRef]
- Sajikumar, N.; Remya, R.S. Impact of land cover and land use change on runoff characteristics. J. Environ. Manag. 2015, 161, 460–468. [Google Scholar] [CrossRef] [PubMed]
- Wang, G.; Yang, H.; Wang, L.; Xu, Z.; Xue, B. Using the SWAT model to assess impacts of land use changes on runoff generation in headwaters. Hydrol. Process. 2014, 28, 1032–1042. [Google Scholar] [CrossRef]
- Zhou, X.; Zhao, H.; Sun, H. Proper assessment for forest hydrological effect. J. Natl. Resour. 2001, 16, 420–426. [Google Scholar]
- Guswa, A.J.; Brauman, K.A.; Brown, C.; Hamel, P.; Keeler, B.L.; Sayre, S.S. Ecosystem services: Challenges and opportunities for hydrologic modeling to support decision making. Water Resour. Res. 2014, 50, 4535–4544. [Google Scholar] [CrossRef]
- Nelson, E.; Mendoza, G.; Regetz, J.; Polasky, S.; Tallis, H.; Cameron, D.R.; Chan, K.M.A.; Daily, G.C.; Goldstein, J.; Kareiva, P.M.; et al. Modeling multiple ecosystem services, biodiversity conservation, commodity production, and tradeoffs at landscape scales. Front. Ecol. Environ. 2009, 7, 4–11. [Google Scholar] [CrossRef]
- Vorstius, A.C.; Spray, C.J. A comparison of ecosystem services mapping tools for their potential to support planning and decision-making on a local scale. Ecosyst. Serv. 2015, 15, 75–83. [Google Scholar] [CrossRef]
- Berg, C.E.; Mineau, M.M.; Rogers, S.H. Examining the ecosystem service of nutrient removal in a coastal watershed. Ecosyst. Serv. 2016, 20, 104–112. [Google Scholar] [CrossRef]
- Redhead, J.W.; Stratford, C.; Sharps, K.; Jones, L.; Ziv, G.; Clarke, D.; Oliver, T.H.; Bullock, J.M. Empirical validation of the InVEST water yield ecosystem service model at a national scale. Sci. Total Environ. 2016, 569–570, 1418–1426. [Google Scholar] [CrossRef] [PubMed] [Green Version]
- Xie, H.; He, Y.; Xie, X. Exploring the factors influencing ecological land change for China’s Beijing–Tianjin–Hebei region using big data. J. Clean. Prod. 2017, 142, 677–687. [Google Scholar] [CrossRef]
- Liu, J.; Zang, C.; Tian, S.; Liu, J.; Yang, H.; Jia, S.; You, L.; Liu, B.; Zhang, M. Water conservancy projects in China: Achievements, challenges and way forward. Glob. Environ. Chang. 2013, 23, 633–643. [Google Scholar] [CrossRef]
- Zhao, X.; Liu, J.G.; Liu, Q.Y.; Tillotson, M.R.; Guan, D.B.; Hubacek, K. Physical and virtual water transfers for regional water stress alleviation in China. Proc. Natl. Acad. Sci. USA 2015, 112, 1031–1035. [Google Scholar] [CrossRef] [PubMed]
- Cai, J.L.; Varis, L.; Yin, H. China’s water resources vulnerability: A spatio-temporal analysis during 2003–2013. J. Clean. Prod. 2017, 142, 2901–2910. [Google Scholar] [CrossRef]
- Hebei Statistic Bureau (HBTJ). Hebei Economic Statistical Yearbook 2016. Available online: http://www.hetj.gov.cn/res/nj2016/indexch.htm (accessed on 15 November 2017). (In Chinese)
- Feng, Z.; Liu, D. A study on water resources carrying capacity in Jingjinji region. J. Natl. Resour. 2006, 21, 689–699. (In Chinese) [Google Scholar]
- Haihe River Water Resource Conservance Commission (HWCC). Haihe River Water Resources Bulletin. Available online: http://www.hwcc.gov.cn/hwcc/wwgj/xxgb/szygb/ (accessed on 26 November 2017).
- Bao, C.; He, D. Spatiotemporal characteristics of water resources exploitation and policy implications in the Beijing-Tianjin-Hebei Urban Agglomeration (in Chinese). Prog. Geogr. 2017, 36, 58–67. [Google Scholar]
- Zhou, X.; Bai, Z.; Yang, Y. Linking trends in urban extreme rainfall to urban flooding in China. Int. J. Clim. 2017. [Google Scholar] [CrossRef]
- Lu, S.; Wu, B.; Wei, Y.; Yan, N.; Wang, H.; Guo, S. Quantifying impacts of climate variability and human activities on the hydrological system of the Haihe River Basin, China. Environ. Earth Sci. 2014, 73, 1491–1503. [Google Scholar] [CrossRef]
- Chen, F.L.; Li, J.Z. Quantifying drought and water scarcity: A case study in the Luanhe river basin. Nat. Hazards 2016, 81, 1913–1927. [Google Scholar] [CrossRef]
- Zhan, C.; Xu, Z.; Ye, A.; Su, H. LUCC and its impact on run-off yield in the Bai River catchment—Upstream of the Miyun Reservoir basin. J. Plant Ecol. 2011, 4, 61–66. [Google Scholar] [CrossRef]
- Wang, G.; Xia, J.; Chen, J. Quantification of effects of climate variations and human activities on runoff by a monthly water balance model: A case study of the Chaobai River basin in northern China. Water Resour. Res. 2009, 45. [Google Scholar] [CrossRef] [Green Version]
- Bai, Y.; Jiang, B.; Alatalo, J.M.; Zhuang, C.W.; Wang, X.Y.; Cui, L.J.; Xu, W.H. Impacts of land management on ecosystem service delivery in the Baiyangdian river basin. Environ. Earth Sci. 2016, 75. [Google Scholar] [CrossRef]
- Zhao, D.; Tang, Y.; Liu, J.; Tillotson, M.R. Water footprint of Jing-Jin-Ji urban agglomeration in China. J. Clean. Prod. 2017, 167, 919–928. [Google Scholar] [CrossRef]
- Mao, H. Innovation of mechanism and regional policy for promoting coordinated development of Beijing-Tianjin-Hebei. Prog. Geogr. 2017, 36, 2–14. (In Chinese) [Google Scholar]
- Cetin, M. Determining the bioclimatic comfort in Kastamonu City. Environ. Monit. Assess. 2015, 187. [Google Scholar] [CrossRef] [PubMed]
- Ceti̇n, M. Evaluation of the sustainable tourism potential of a protected area for landscape planning: A case study of the ancient city of Pompeipolis in Kastamonu. Int. J. Sustain. Dev. World 2015, 22, 490–495. [Google Scholar] [CrossRef]
- Lawler, J.J.; Lewis, D.J.; Nelson, E.; Plantinga, A.J.; Polasky, S.; Withey, J.C.; Helmers, D.P.; Martinuzzi, S.; Pennington, D.; Radeloff, V.C. Projected land-use change impacts on ecosystem services in the United States. Proc. Natl. Acad. Sci. USA 2014, 111, 7492–7497. [Google Scholar] [CrossRef] [PubMed]
- Deng, X.; Gibson, J.; Wang, P. Relationship between landscape diversity and crop production: A case study in the Hebei Province of China based on multi-source data integration. J. Clean. Prod. 2017, 142, 985–992. [Google Scholar] [CrossRef]
- Cetin, M. Using GIS analysis to assess urban green space in terms of accessibility: Case study in Kutahya. Int. J. Sust. Dev. World 2015, 22, 420–424. [Google Scholar] [CrossRef]
- Cetin, M.; Adiguzel, F.; Kaya, O.; Sahap, A. Mapping of bioclimatic comfort for potential planning using GIS in Aydin. Environ. Dev. Sustain. 2016, 20, 361–375. [Google Scholar] [CrossRef]
- Ceti̇n, M.; Sevi̇k, H. Evaluating the recreation potential of Ilgaz Mountain National Park in Turkey. Environ. Monit. Assess. 2016, 188. [Google Scholar] [CrossRef] [PubMed]
- National Bureau of Statistics of China (NBSC). China Statistical Yearbook. Available online: http://www.stats.gov.cn/tjsj/ndsj/ (accessed on 26 November 2017). (In Chinese)
- State Forestry Agency (SFA). China Wetlands Resources; China Forestry Press: Beijing, China, 2015.
- Liu, J.; Kuang, W.; Zhang, Z.; Xu, X.; Qin, Y.; Ning, J.; Zhou, W.; Zhang, S.; Li, R.; Yan, C. Spatiotemporal characteristics, patterns, and causes of land-use changes in China since the late 1980s. J. Geogr. Sci. 2014, 24, 195–210. [Google Scholar] [CrossRef]
- Davis, T.J. The Ramsar Convention Manual: A Guide to the Convention on Wetlands of International Importance Especially as Waterfowl Habitat; Ramsar Convention Bureau: Gland, Switzerland, 1994. [Google Scholar]
- China Meteorological Data Service Center (CMDC). Available online: http://data.cma.cn/ (accessed on 1 June 2017).
- Allen, R.G.; Pereira, L.S.; Raes, D.; Smith, M. Crop Evapotranspiration-Guidelines for Computing Crop Water Requirements-FAO Irrigation and Drainage Paper 56; FAO: Rome, Italy, 1998. [Google Scholar]
- Shangguan, W.; Dai, Y.; Liu, B.; Zhu, A.; Duan, Q.; Wu, L.; Ji, D.; Ye, A.; Yuan, H.; Zhang, Q.; et al. A China data set of soil properties for land surface modeling. J. Adv. Model. Earth Syst. 2013, 5, 212–224. [Google Scholar] [CrossRef]
- Zhou, W.; Liu, G.; Pan, J.; Feng, X. Distribution of available soil water capacity in China. J. Geogr. Sci. 2005, 15, 3–12. [Google Scholar] [CrossRef]
- Shukla, A.K.; Pathak, S.; Ojha, C.S.P.; Mijic, A.; Garg, R.D. Spatio-temporal assessment of annual water-balance model for Upper Ganga Basin. Hydrol. Earth Syst. Sci. Dis. 2017, 536, 1–29. [Google Scholar] [CrossRef]
- Goyal, M.K.; Khan, M. Assessment of spatially explicit annual water-balance model for Sutlej River Basin in eastern Himalayas and Tungabhadra River Basin in peninsular India. Hydrol. Res. 2017, 48, 542–558. [Google Scholar] [CrossRef]
- Hamel, P.; Guswa, A.J. Uncertainty analysis of a spatially explicit annual water-balance model: Case study of the Cape Fear basin, North Carolina. Hydrol. Earth Syst. Sci. 2015, 19, 839–853. [Google Scholar] [CrossRef]
- Goel, M.K. Runoff Coefficient. Encyclopedia of Snow, Ice and Glaciers; Springer: Dordrecht, The Netherlands, 2011. [Google Scholar]
- Wheeler, R.E. Permutation tests for linear models in R. Compr. R Arch. Netw. 2010, 1, 1–2. [Google Scholar]
- Wang, T.; Lv, C. Quantitative structural analysis on land use change in Beijing-Tianjin-Hebei Region. J. Shanxi Univ. 2010, 33, 473–478. (In Chinese) [Google Scholar]
- Im, S.; Brannan, K.M.; Mostaghimi, S. Simulating hydrologic and water quality impacts in an urbanizing watershed. J. Am. Water Resour. Assoc. 2003, 39, 1465–1479. [Google Scholar] [CrossRef]
- Sanchez-Canales, M.; Lopez Benito, A.; Passuello, A.; Terrado, M.; Ziv, G.; Acuna, V.; Schuhmacher, M.; Elorza, F.J. Sensitivity analysis of ecosystem service valuation in a Mediterranean watershed. Sci. Total Environ. 2012, 440, 140–153. [Google Scholar] [CrossRef] [PubMed]
- Bangash, R.F.; Passuello, A.; Sanchez-Canales, M.; Terrado, M.; López, A.; Elorza, F.J.; Ziv, G.; Acuña, V.; Schuhmacher, M. Ecosystem services in Mediterranean river basin: Climate change impact on water provisioning and erosion control. Sci. Total Environ. 2013, 458, 246–255. [Google Scholar] [CrossRef] [PubMed]
- Sahin, V.; Hall, M.J. The effects of afforestation and deforestation on water yields. J. Hydrol. 1996, 178, 293–309. [Google Scholar] [CrossRef]
- Bi, H.; Liu, B.; Wu, J.; Yun, L.; Chen, Z.; Cui, Z. Effects of precipitation and landuse on runoff during the past 50 years in a typical watershed in Loess Plateau, China. Int. J. Sediment Res. 2009, 24, 352–364. [Google Scholar] [CrossRef]
- Zhang, L.; Dawes, W.; Walker, G. Response of mean annual evapotranspiration to vegetation changes at catchment scale. Water Resour. Res. 2001, 37, 701–708. [Google Scholar] [CrossRef]
- Arunyawat, S.; Shrestha, R. Assessing land use change and its impact on ecosystem services in northern Thailand. Sustainability 2016, 8, 768. [Google Scholar] [CrossRef]
- Jujnovsky, J.; Ramos, A.; Caro-Borrero, A.; Mazari-Hiriart, M.; Maass, M.; Almeida-Lenero, L. Water assessment in a peri-urban watershed in Mexico City: A focus on an ecosystem services approach. Ecosyst. Serv. 2017, 24, 91–100. [Google Scholar] [CrossRef]
- Liu, Y.Y.; Zhang, X.N.; Xia, D.Z.; You, J.S.; Rong, Y.S.; Bakir, M. Impacts of land-use and climate changes on hydrologic processes in the qingyi river watershed, China. J. Hydrol. Eng. 2013, 18, 1495–1512. [Google Scholar] [CrossRef]
- Yang, C.G.; Yu, Z.B.; Hao, Z.C.; Lin, Z.H.; Wang, H.M. Effects of vegetation cover on hydrological processes in a large region: Huaihe river basin, China. J. Hydrol. Eng. 2013, 18, 1477–1483. [Google Scholar] [CrossRef]
- Zhao, G.J.; Mu, X.M.; Jiao, J.Y.; An, Z.F.; Klik, A.; Wang, F.; Jiao, F.; Yue, X.L.; Gao, P.; Sun, W.Y. Evidence and causes of spatiotemporal changes in runoff and sediment yield on the Chinese Loess plateau. Land Degrad. Dev. 2017, 28, 579–590. [Google Scholar] [CrossRef]
- Millennium Ecosystem Assessment. Ecosystems and Human Well-Being: Wetlands and Water; World Resources Institute: Washington, DC, USA, 2005. [Google Scholar]
- Li, Y.F.; Luo, Y.C.; Liu, G.; Ouyang, Z.Y.; Zheng, H. Effects of land use change on ecosystem services, a case study in Miyun reservoir watershed. Acta Ecol. Sin. 2013, 33, 726–736. (In Chinese) [Google Scholar]
- Geng, X.L.; Wang, X.S.; Yan, H.M.; Zhang, Q.; Jin, G. Land use/land cover change induced impacts on water supply service in the upper reach of Heihe River Basin. Sustainability 2015, 7, 366–383. [Google Scholar] [CrossRef]
- Cetin, M. Sustainability of urban coastal area management: A case study on Cide. J. Sustain. For. 2016, 35, 527–541. [Google Scholar] [CrossRef]
- Liu, M.; Tian, H.; Chen, G.; Ren, W.; Zhang, C.; Liu, J. Effects of land-use and land-cover change on evapotranspiration and water yield in china during 1900–2000. J. Am. Water Resour. Assoc. 2008, 44, 1193–1207. [Google Scholar] [CrossRef]
- Brauman, K.A.; Daily, G.C.; Duarte, T.K.E.; Mooney, H.A. The nature and value of ecosystem services: An overview highlighting hydrologic services. Annu. Rev. Environ. Resour. 2007, 32, 67–98. [Google Scholar] [CrossRef]
- Brauman, K.A.; Freyberg, D.L.; Daily, G.C. Land cover effects on groundwater recharge in the tropics: Ecohydrologic mechanisms. Ecohydrology 2012, 5, 435–444. [Google Scholar] [CrossRef]
- Andréassian, V. Waters and forests: From historical controversy to scientific debate. J. Hydrol. 2004, 291, 1–27. [Google Scholar] [CrossRef]
- Xu, W.H.; Xiao, Y.; Zhang, J.J.; Yang, W.; Zhang, L.; Hull, V.; Wang, Z.; Zheng, H.; Liu, J.G.; Polasky, S.; et al. Strengthening protected areas for biodiversity and ecosystem services in China. Proc. Natl. Acad. Sci. USA 2017, 114, 1601–1606. [Google Scholar] [CrossRef] [PubMed]
- Hu, Q.-L.; Qi, Y.-Q.; Hu, Y.-C.; Zhang, Y.-C.; Wu, C.-B.; Zhang, G.-L.; Shen, Y.-J. Changes and driving forces of land use/cover and landscape patterns in Beijing-Tianjin-Hebei region. Chin. J. Eco-Agric. 2011, 19, 1182–1189. (In Chinese) [Google Scholar] [CrossRef]
- Liu, J.; Yang, W. Water sustainability for China and beyond. Science 2012, 337, 649–650. [Google Scholar] [CrossRef] [PubMed]
- Palmer, M.A.; Liu, J.; Matthews, J.H.; Mumba, M.; D’odorico, P. Manage water in a green way. Science 2015, 349, 584–585. [Google Scholar] [CrossRef] [PubMed]
- Shao, W.; Zhang, H.; Liu, J.; Yang, G.; Chen, X.; Yang, Z.; Huang, H. Data integration and its application in the sponge city construction of China. Procedia Eng. 2016, 154, 779–786. [Google Scholar] [CrossRef]
- Goldstein, J.H.; Caldarone, G.; Duarte, T.K.; Ennaanay, D.; Hannahs, N.; Mendoza, G.; Polasky, S.; Wolny, S.; Daily, G.C. Integrating ecosystem-service tradeoffs into land-use decisions. Proc. Natl. Acad. Sci. USA 2012, 109, 7565–7570. [Google Scholar] [CrossRef] [PubMed]
- Chen, L.; Xie, G.; Zhang, C.; Pei, S.; Fan, N.; Ge, L.; Zhang, C. Modelling ecosystem water supply services across the Lancang River Basin. J. Resour. Ecol. 2011, 2, 322–327. [Google Scholar]
- Xiao, Y.; Xiao, Q.; Ouyang, Z.Y.; Qin, M.M. Assessing changes in water flow regulation in Chongqing region, China. Environ. Monit. Assess. 2015, 187, 1–13. [Google Scholar] [CrossRef] [PubMed]
- Boithias, L.; Acuna, V.; Vergonos, L.; Ziv, G.; Marce, R.; Sabater, S. Assessment of the water supply: Demand ratios in a Mediterranean basin under different global change scenarios and mitigation alternatives. Sci. Total Environ. 2014, 470, 567–577. [Google Scholar] [CrossRef] [PubMed]
- Terrado, M.; Acuna, V.; Ennaanay, D.; Tallis, H.; Sabater, S. Impact of climate extremes on hydrological ecosystem services in a heavily humanized Mediterranean basin. Ecol. Indic. 2014, 37, 199–209. [Google Scholar] [CrossRef]
Figure 1.
The location of the Jing-Jin-Ji region in China.

Figure 2.
Spatial distribution of water yield (WY) (a), and average annual precipitation (b), of Jing-Jin-Ji from 1990 to 2015.
Figure 2.
Spatial distribution of water yield (WY) (a), and average annual precipitation (b), of Jing-Jin-Ji from 1990 to 2015.

Figure 3.
Spatial land-use and land-cover (LULC) changes in Jing-Jin-Ji from 1990 to 2015.
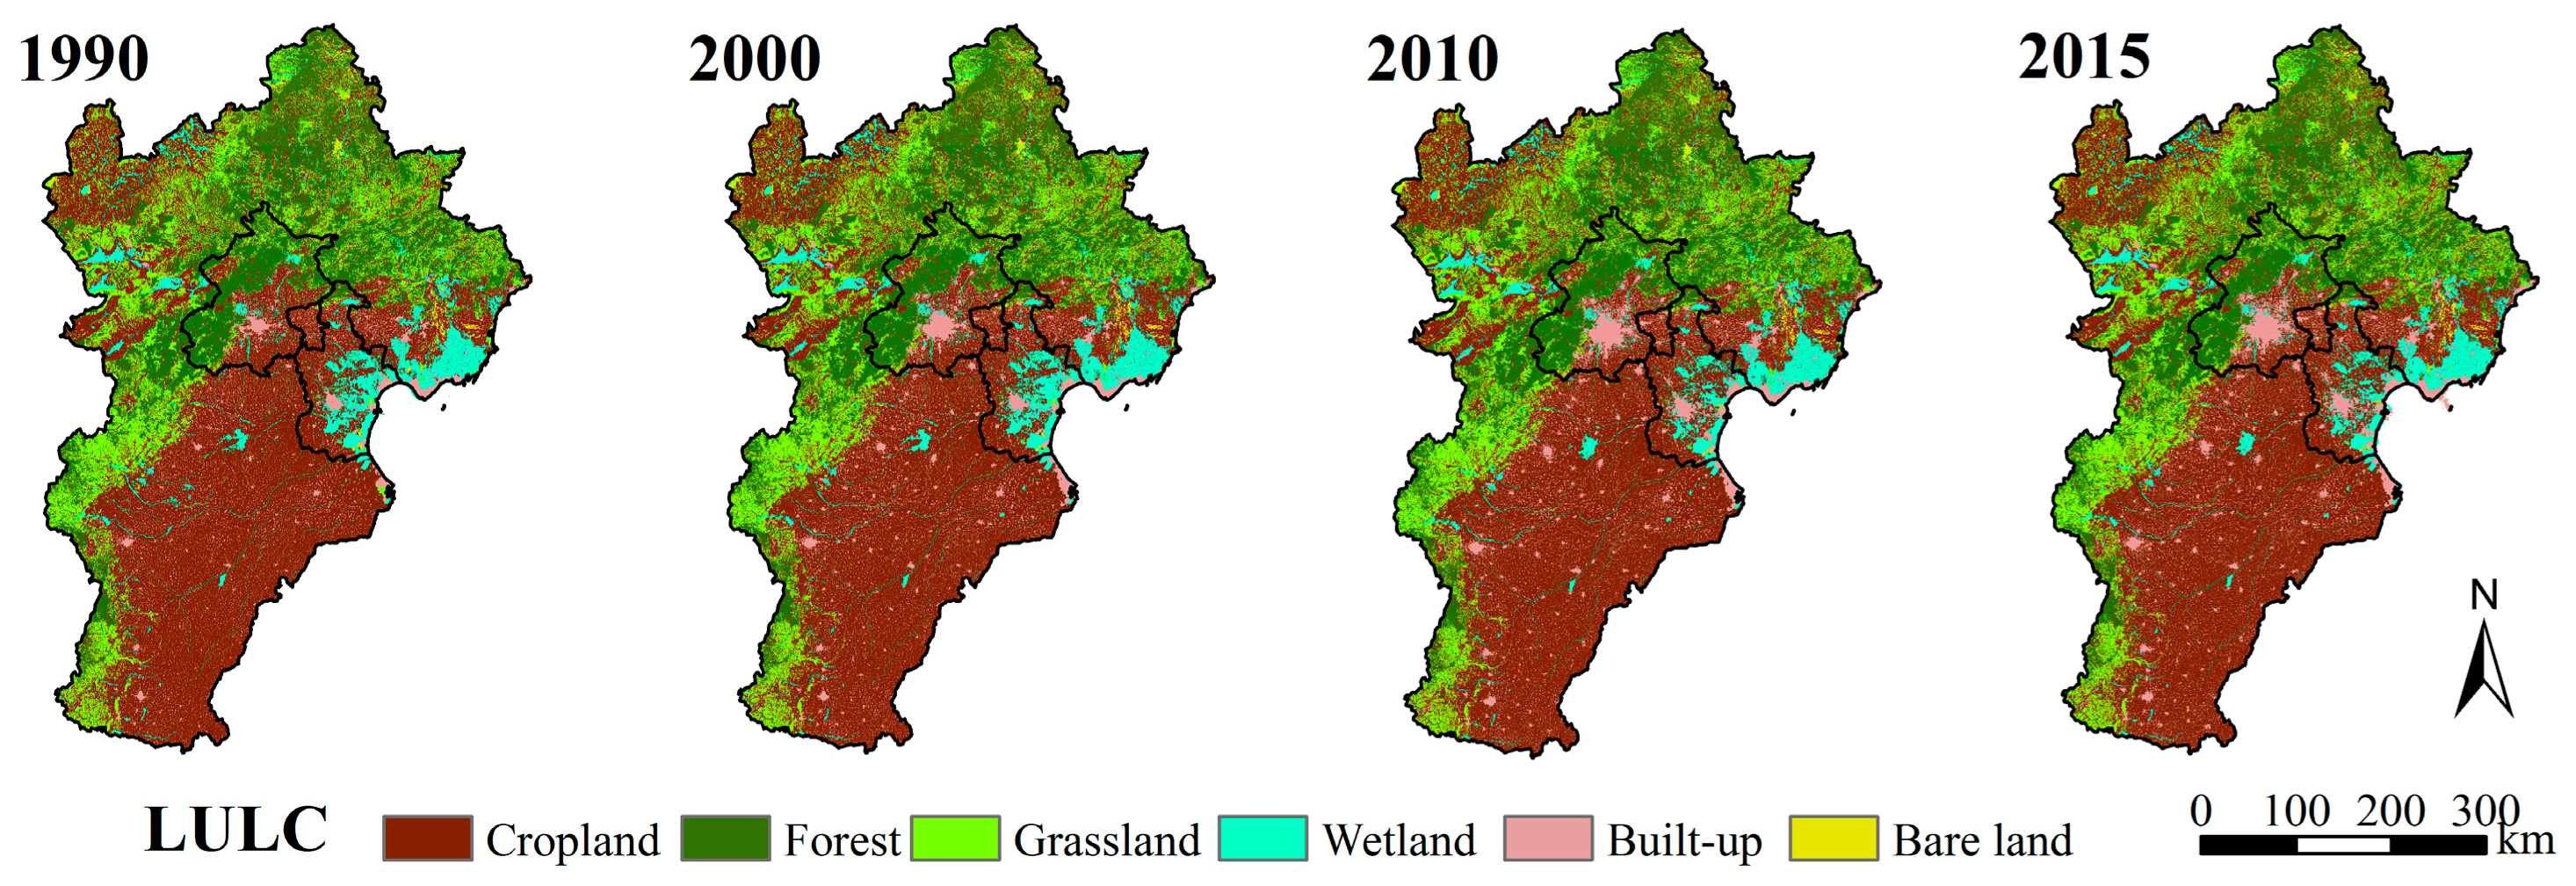
Figure 4.
WY variations following the areal changes in each LULC type.
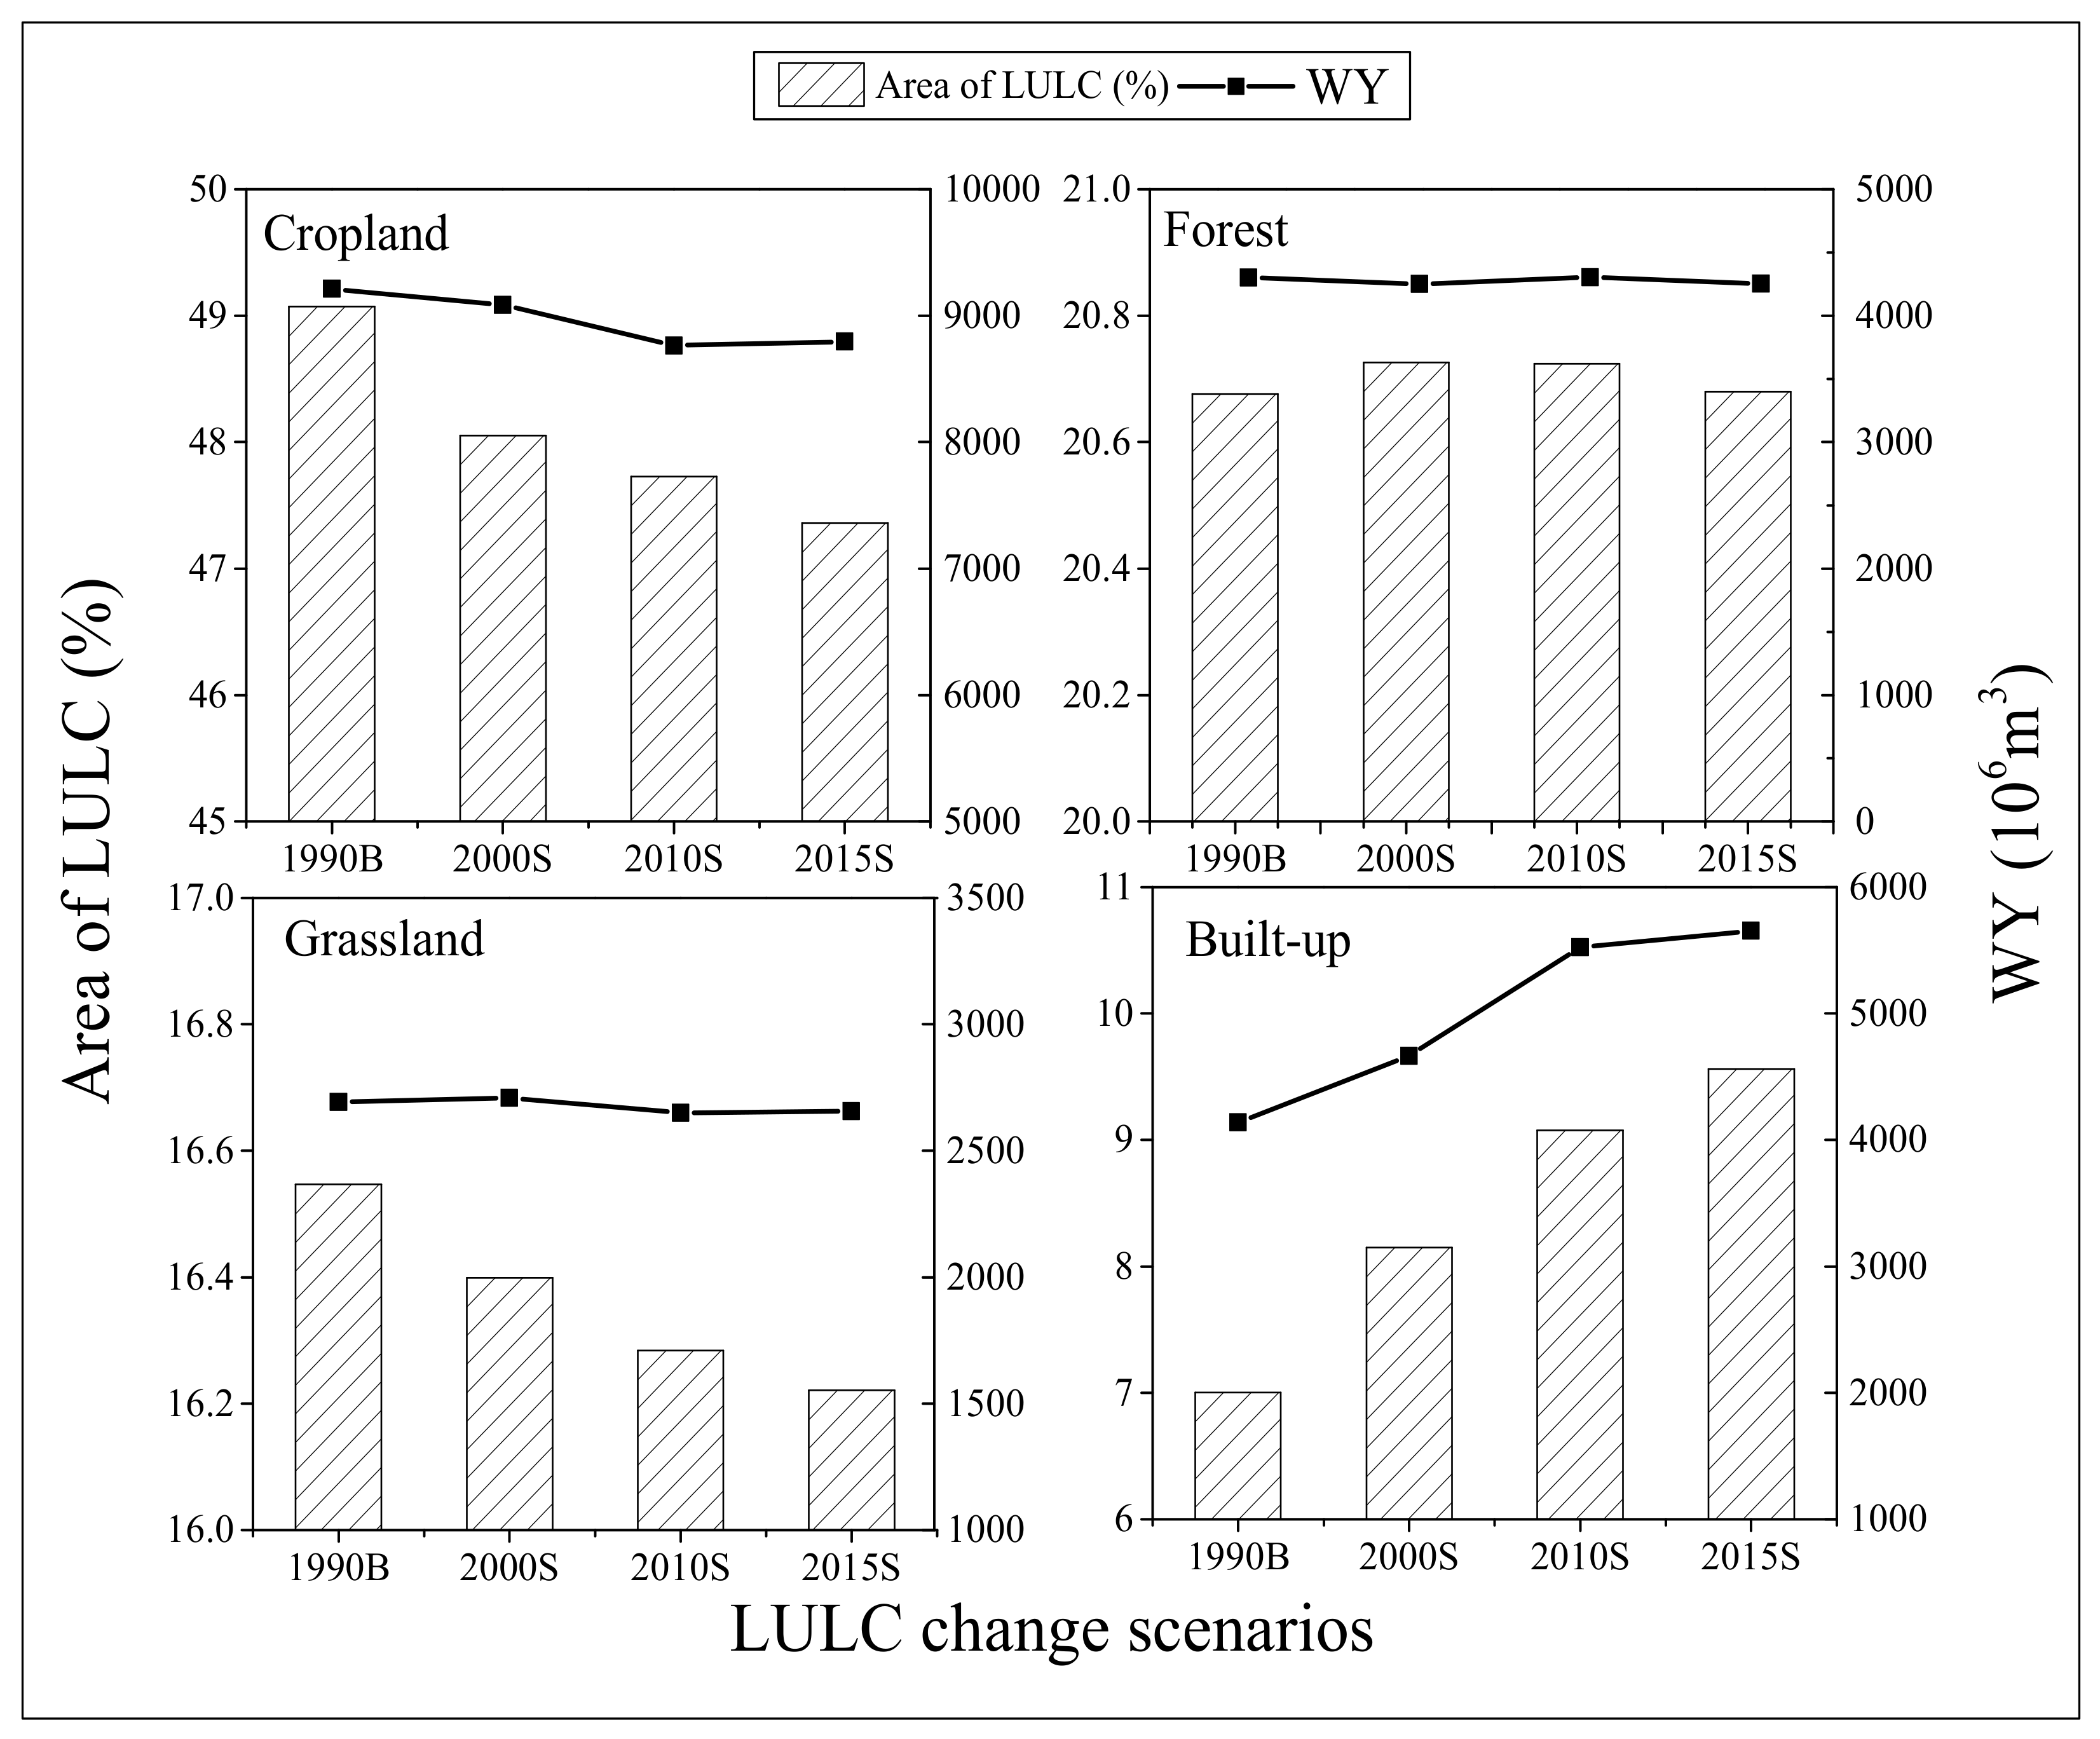
Figure 5.
WY coefficient of each LULC type (mean ± 1sd, n = 4); Different letters indicate significant difference (p < 0.05).
Figure 5.
WY coefficient of each LULC type (mean ± 1sd, n = 4); Different letters indicate significant difference (p < 0.05).


Table 1.
The LULC changes from 1990 to 2015 in Jing-Jin-Ji.
| Year | 1990 | 2000 | 2010 | 2015 | Changes between 1990 and 2015 | |||||
|---|---|---|---|---|---|---|---|---|---|---|
| LULC | km2 | % | km2 | % | km2 | % | km2 | % | km2 | % |
| Cropland | 105,734 | 49.07 | 103,431 | 48.05 | 102,732 | 47.73 | 102,146 | 47.36 | −3588 | −3.40 |
| Forest | 44,549 | 20.68 | 44,611 | 20.73 | 44,607 | 20.72 | 44,600 | 20.68 | 51 | 0.11 |
| Grassland | 35,652 | 16.55 | 35,298 | 16.40 | 35,051 | 16.28 | 34,985 | 16.22 | −667 | −1.87 |
| Wetland | 13,498 | 6.26 | 13,435 | 6.24 | 12,443 | 5.78 | 12,452 | 5.77 | −1046 | −7.75 |
| Built-up | 15,086 | 7.00 | 17,538 | 8.15 | 19,535 | 9.08 | 20,466 | 9.50 | 5380 | 35.66 |
| Bare land | 949 | 0.44 | 931 | 0.43 | 880 | 0.41 | 868 | 0.40 | −81 | −8.54 |
Table 2.
The LULC conversion matrix between 1990 and 2015 in Jing-Jin-Ji.
| 2015 a | Cropland | Forest | Grassland | Wetland | Built-up | Bare Land | |||||||
|---|---|---|---|---|---|---|---|---|---|---|---|---|---|
| 1990 b | km2 | % | km2 | % | km2 | % | km2 | % | km2 | % | km2 | % | 1990 Total |
| Cropland | 100,632 | 95.17 | 244 | 0.23 | 32 | 0.03 | 468 | 0.44 | 4333 | 4.1 | 26 | 0.02 | 105,734 |
| Forest | 138 | 0.31 | 44,171 | 99.15 | 83 | 0.19 | 10 | 0.02 | 147 | 0.33 | 0 | 0 | 44,549 |
| Grassland | 298 | 0.84 | 149 | 0.42 | 34,833 | 97.7 | 88 | 0.25 | 281 | 0.79 | 3 | 0.01 | 35,652 |
| Wetland | 1005 | 7.45 | 34 | 0.25 | 21 | 0.16 | 11,792 | 87.36 | 642 | 4.76 | 4 | 0.03 | 13,498 |
| Built-up | 45 | 0.3 | 2 | 0.01 | 5 | 0.04 | 26 | 0.17 | 15,008 | 99.48 | 0 | 0 | 15,086 |
| Bare land | 27 | 2.89 | 1 | 0.13 | 10 | 1.02 | 21 | 2.17 | 55 | 5.78 | 835 | 88.01 | 949 |
| 2015 total | 102,146 | - | 44,600 | - | 34,984 | - | 12,405 | - | 20,466 | - | 868 | - | - |
| Change | −3588 | - | 51 | - | −667 | - | −1093 | - | 5380 | - | −81 | - | - |
| Change (%) | −3.4 | - | 0.11 | - | −1.87 | - | −8.1 | - | 35.66 | - | −8.54 | - | - |
a In the table, the row was the LULC of 1990; b the column was the LULC of 2015. The values in the table were the area and percentage of 1990 LULC converted to 2015 LULC.
Table 3.
Simulated WY and actual evapotranspiration (AET) under LULC change scenarios.
| LULC | 1990B | 2000S | 2010S | 2015S | Average AET (mm) | ||||
|---|---|---|---|---|---|---|---|---|---|
| WY | WY | WY | WY | ||||||
| (109 m3) | % | (109 m3) | % | (109 m3) | % | (109 m3) | % | ||
| Cropland | 9.21 | 45 | 9.09 | 43 | 8.77 | 41 | 8.80 | 41 | 425 |
| Forest | 4.30 | 21 | 4.25 | 21 | 4.31 | 20 | 4.26 | 20 | 468 |
| Grassland | 2.69 | 13 | 2.71 | 13 | 2.65 | 12 | 2.66 | 12 | 425 |
| Built-up | 4.14 | 20 | 4.67 | 22 | 5.53 | 26 | 5.65 | 26 | 244 |
| Bare land | 0.11 | 1 | 0.11 | 1 | 0.11 | 1 | 0.11 | 1 | 414 |
| WY total | 20.50 | 100 | 20.97 | 100 | 21.43 | 100 | 21.55 | 100 | - |
© 2018 by the authors. Licensee MDPI, Basel, Switzerland. This article is an open access article distributed under the terms and conditions of the Creative Commons Attribution (CC BY) license (http://creativecommons.org/licenses/by/4.0/).
Share and Cite
MDPI and ACS Style
Li, S.; Yang, H.; Lacayo, M.; Liu, J.; Lei, G. Impacts of Land-Use and Land-Cover Changes on Water Yield: A Case Study in Jing-Jin-Ji, China. Sustainability 2018, 10, 960. https://doi.org/10.3390/su10040960
AMA Style
Li S, Yang H, Lacayo M, Liu J, Lei G. Impacts of Land-Use and Land-Cover Changes on Water Yield: A Case Study in Jing-Jin-Ji, China. Sustainability. 2018; 10(4):960. https://doi.org/10.3390/su10040960
Chicago/Turabian StyleLi, Suxiao, Hong Yang, Martin Lacayo, Junguo Liu, and Guangchun Lei. 2018. "Impacts of Land-Use and Land-Cover Changes on Water Yield: A Case Study in Jing-Jin-Ji, China" Sustainability 10, no. 4: 960. https://doi.org/10.3390/su10040960
Note that from the first issue of 2016, this journal uses article numbers instead of page numbers. See further details here.