Article

Renovation of a School Building: Energy Retrofit and Seismic Upgrade in a School Building in Motta Di Livenza

Department of Design and Planning in Complex Environments, University IUAV of Venice, Santa Croce, 191, 30135 Tolentini Venice, Italy
*
Author to whom correspondence should be addressed.
Sustainability 2018, 10(4), 969; https://doi.org/10.3390/su10040969
Submission received: 15 February 2018 / Revised: 16 March 2018 / Accepted: 20 March 2018 / Published: 26 March 2018
(This article belongs to the Special Issue Energy and Seismic Renovation Strategies for Sustainable Cities)

Abstract

:
The main part of Italian building stock was built before the energy and seismic regulations, so most of buildings need comprehensive refurbishment to achieve the performance required by laws that are in force. This paper presents an experimental study for an energy and structural upgrade methodology, applied to an existing school building in the north-east of Italy. The methodology is based on the International Energy Agency–Energy in Buildings and Communities Programme (IEA–EBC) Annex 56 project guidelines. For the energy retrofit, a set of interventions is defined concerning the building envelope and systems. Among these interventions, the optimal cost is identified: this minimizes the energy demand and the CO2 emissions, and reduces the financial commitment. The analysis of the seismic retrofit is developed using innovative techniques of intervention and high-performance materials. The proposed interventions are evaluated in terms of efficacy and cost. The results show that it is possible to identify a comprehensive energy retrofit at optimal cost, thanks to high energy saving and subsidies. For the seismic retrofit, the intervention with the higher cost-effectiveness ratio is determined, but the related investment does not have a payback time. The union of the two retrofits permits the combination of benefits and has a payback time for both the interventions. It is possible to state that the cost of a combined intervention is lower than the costs of two different interventions; therefore, when a single retrofit is needed, the possibility of a combined intervention should be evaluated.

Graphical Abstract

1. Introduction

The European Parliament approved the recast of the Energy Performance of Buildings Directive (EPBD recast) in 2010 [1]. As in the previous European Directive 2002/91/EU [2], this concerns the energy efficiency of buildings, but the new directive reinforces the requirements regarding the energy performance of existing and newly constructed buildings and fixes the target of nearly zero-energy buildings (nZEB) for new constructions by 2021. According to the EPBD recast, member states (MS) should consider cost-optimality to establish minimum energy performance requirements in buildings at the lowest cost. In Italy, the national school stock represents a strategic sector to promote interventions for energy retrofits and environmental impact reduction on existent buildings or to convert them into nZEB. In general, non-residential buildings are around 13% of the Italian building stock [3], where around 51,000 buildings are used entirely or partly as schools which, however, have higher energy consumption: in fact, schools use about 1 million TEPyear (70% for heating and 30% for electricity), representing 2% of the 50 million TEP of total civil use in Italy [4]. So, acting on schools does not have a huge effect from an energy-saving point of view, but from the point of view of training citizens [5]. Most of existing school buildings have inefficient heating systems and old technologies. Space heating is still the main end-use, with 43% of heating needs met using natural gas in 2012. In most school buildings, heating generation mainly uses gas-/oil-fired boilers [6] and radiator heating systems are installed. Moreover, the vast majority of schools are in public ownership and, as consequence, the possibility for comprehensive renovations is limited due to lack of funds for public administration. Howqever, national and European projects represent a way to find funding and incentives for the redevelopment of existing schools with the aim of spreading strategies and best practice among MS, such as the ENTRANZE, RENEW SCHOOL, ZEMeds, School of the Future [7] and VERYSchool [8] projects. Among these, a selection aims to achieve to a kind of retrofitting according to the nZEB target. The ENTRANZE project (2012–2014) supported policy makers by providing the required data, the analysis, and the guidelines to achieve a fast and strong penetration of the nZEB goal within the existing national building stocks by connecting building experts from European research and academia to national decision makers and key stakeholders [9]. The RENEW SCHOOL project (2014–2017) aims at retrofitting a large number of school buildings to highest nZEB standards, by promoting appropriate tools and measures, helping to downsize the energy use significantly as well as create and secure comfortable conditions for pupils and teachers [10]. The ZEMedS project (2013–2016) [11] focuses on the refurbishment of Mediterranean schools to nZEB. The project covers a complete renovation path, tackling strategies for the envelope, the systems and renewable-energy applications as well as the energy management and users’ behavior. In this context, the first results are presented with case studies of school buildings that have been analyzed in terms of the energy efficiency and cost optimality so as to define a detailed renovation action plan [12].
Historically and in recent years, Italian territory has been the site of some seismic events that have affected ancient and newly constructed buildings [13,14]. Italian technical standards deal in depth with the procedures for the seismic analysis of buildings [15,16,17,18,19,20,21]. Mainly these are structures built in the past which have undergone various adaptation and expansion works, in most cases without considering the situation from a construction point of view, and in combination with techniques and materials that tend to weaken the overall response of the building in case of a seismic event. The study of the seismic vulnerability of existing buildings translates into a determination of the structure’s ability to withstand horizontal stresses such as seismic events; in particular, as regards masonry constructions, it is important to study the non-linear behavior of the structure to know the level of safety and structural deficit [22,23,24,25,26].
The main part of the Italian building stock was built before energy and seismic regulations, so the majority of constructions need a comprehensive refurbishment in both these aspects to achieve the EU requirements. This paper proposes a method for defining and comparing different measures for energy retrofitting and seismic improvement, as interventions on the building envelope and the heating system, as long as the decision-making process advances those measures. The overall strategy consists in considering energy and seismic topics at the same time in order to achieve benefits from several points of views, such as economic, time-saving and logistics management during the building-intervention process.

2. Materials and Methods

2.1. Methodology

The methodology foresees a comparison in terms of costs [27] and energy performance [
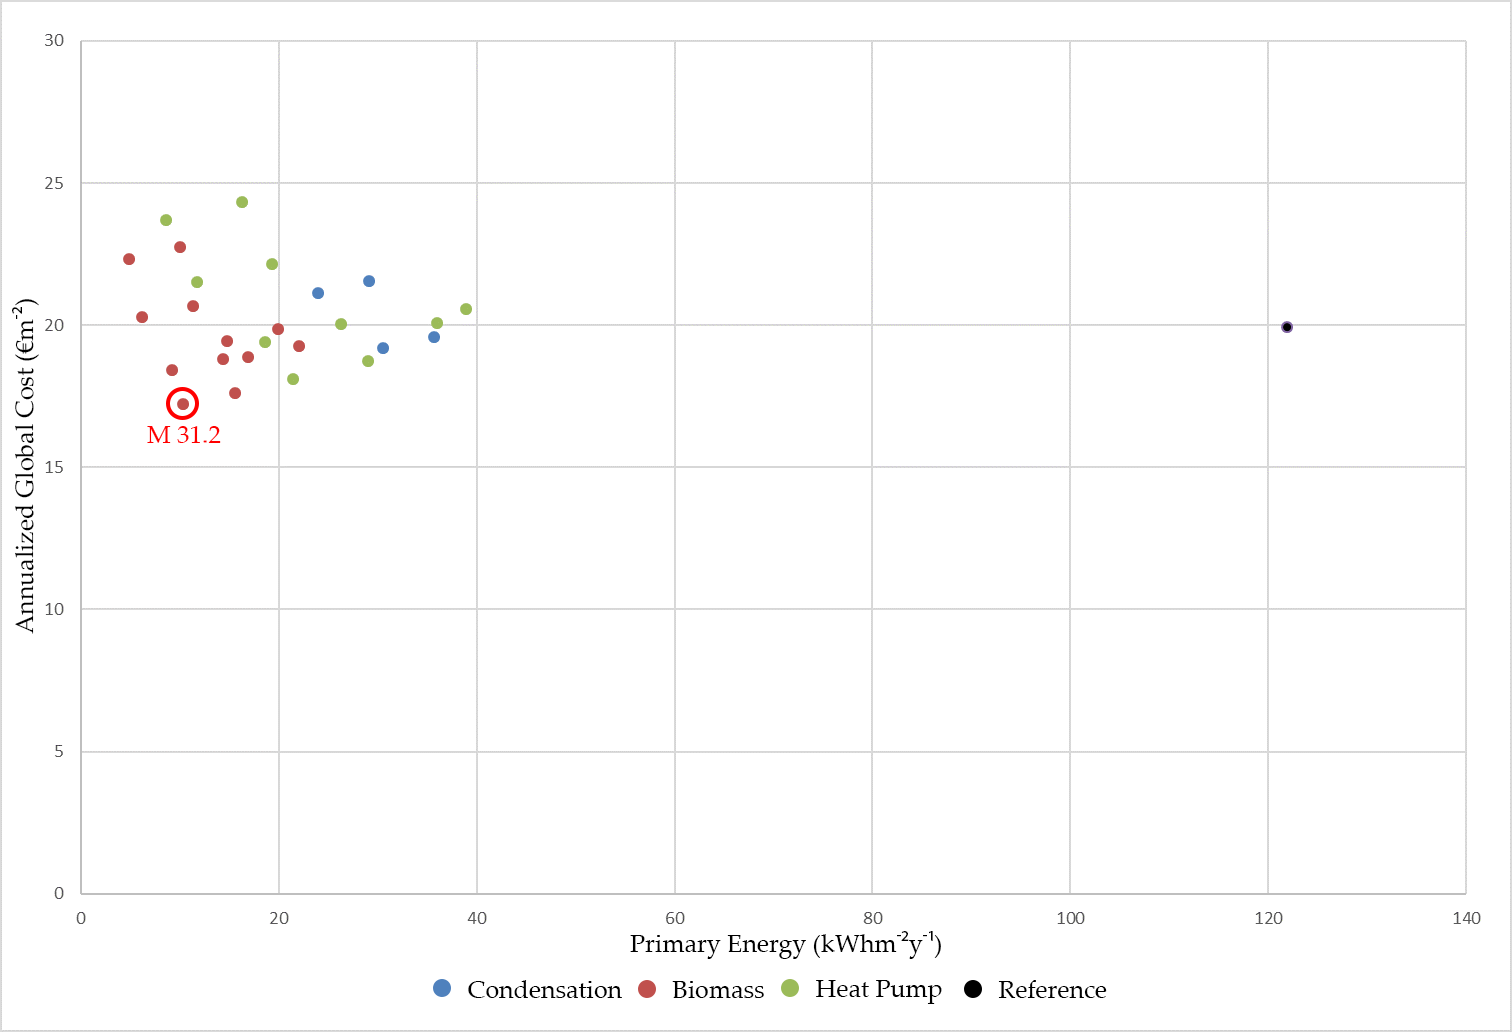
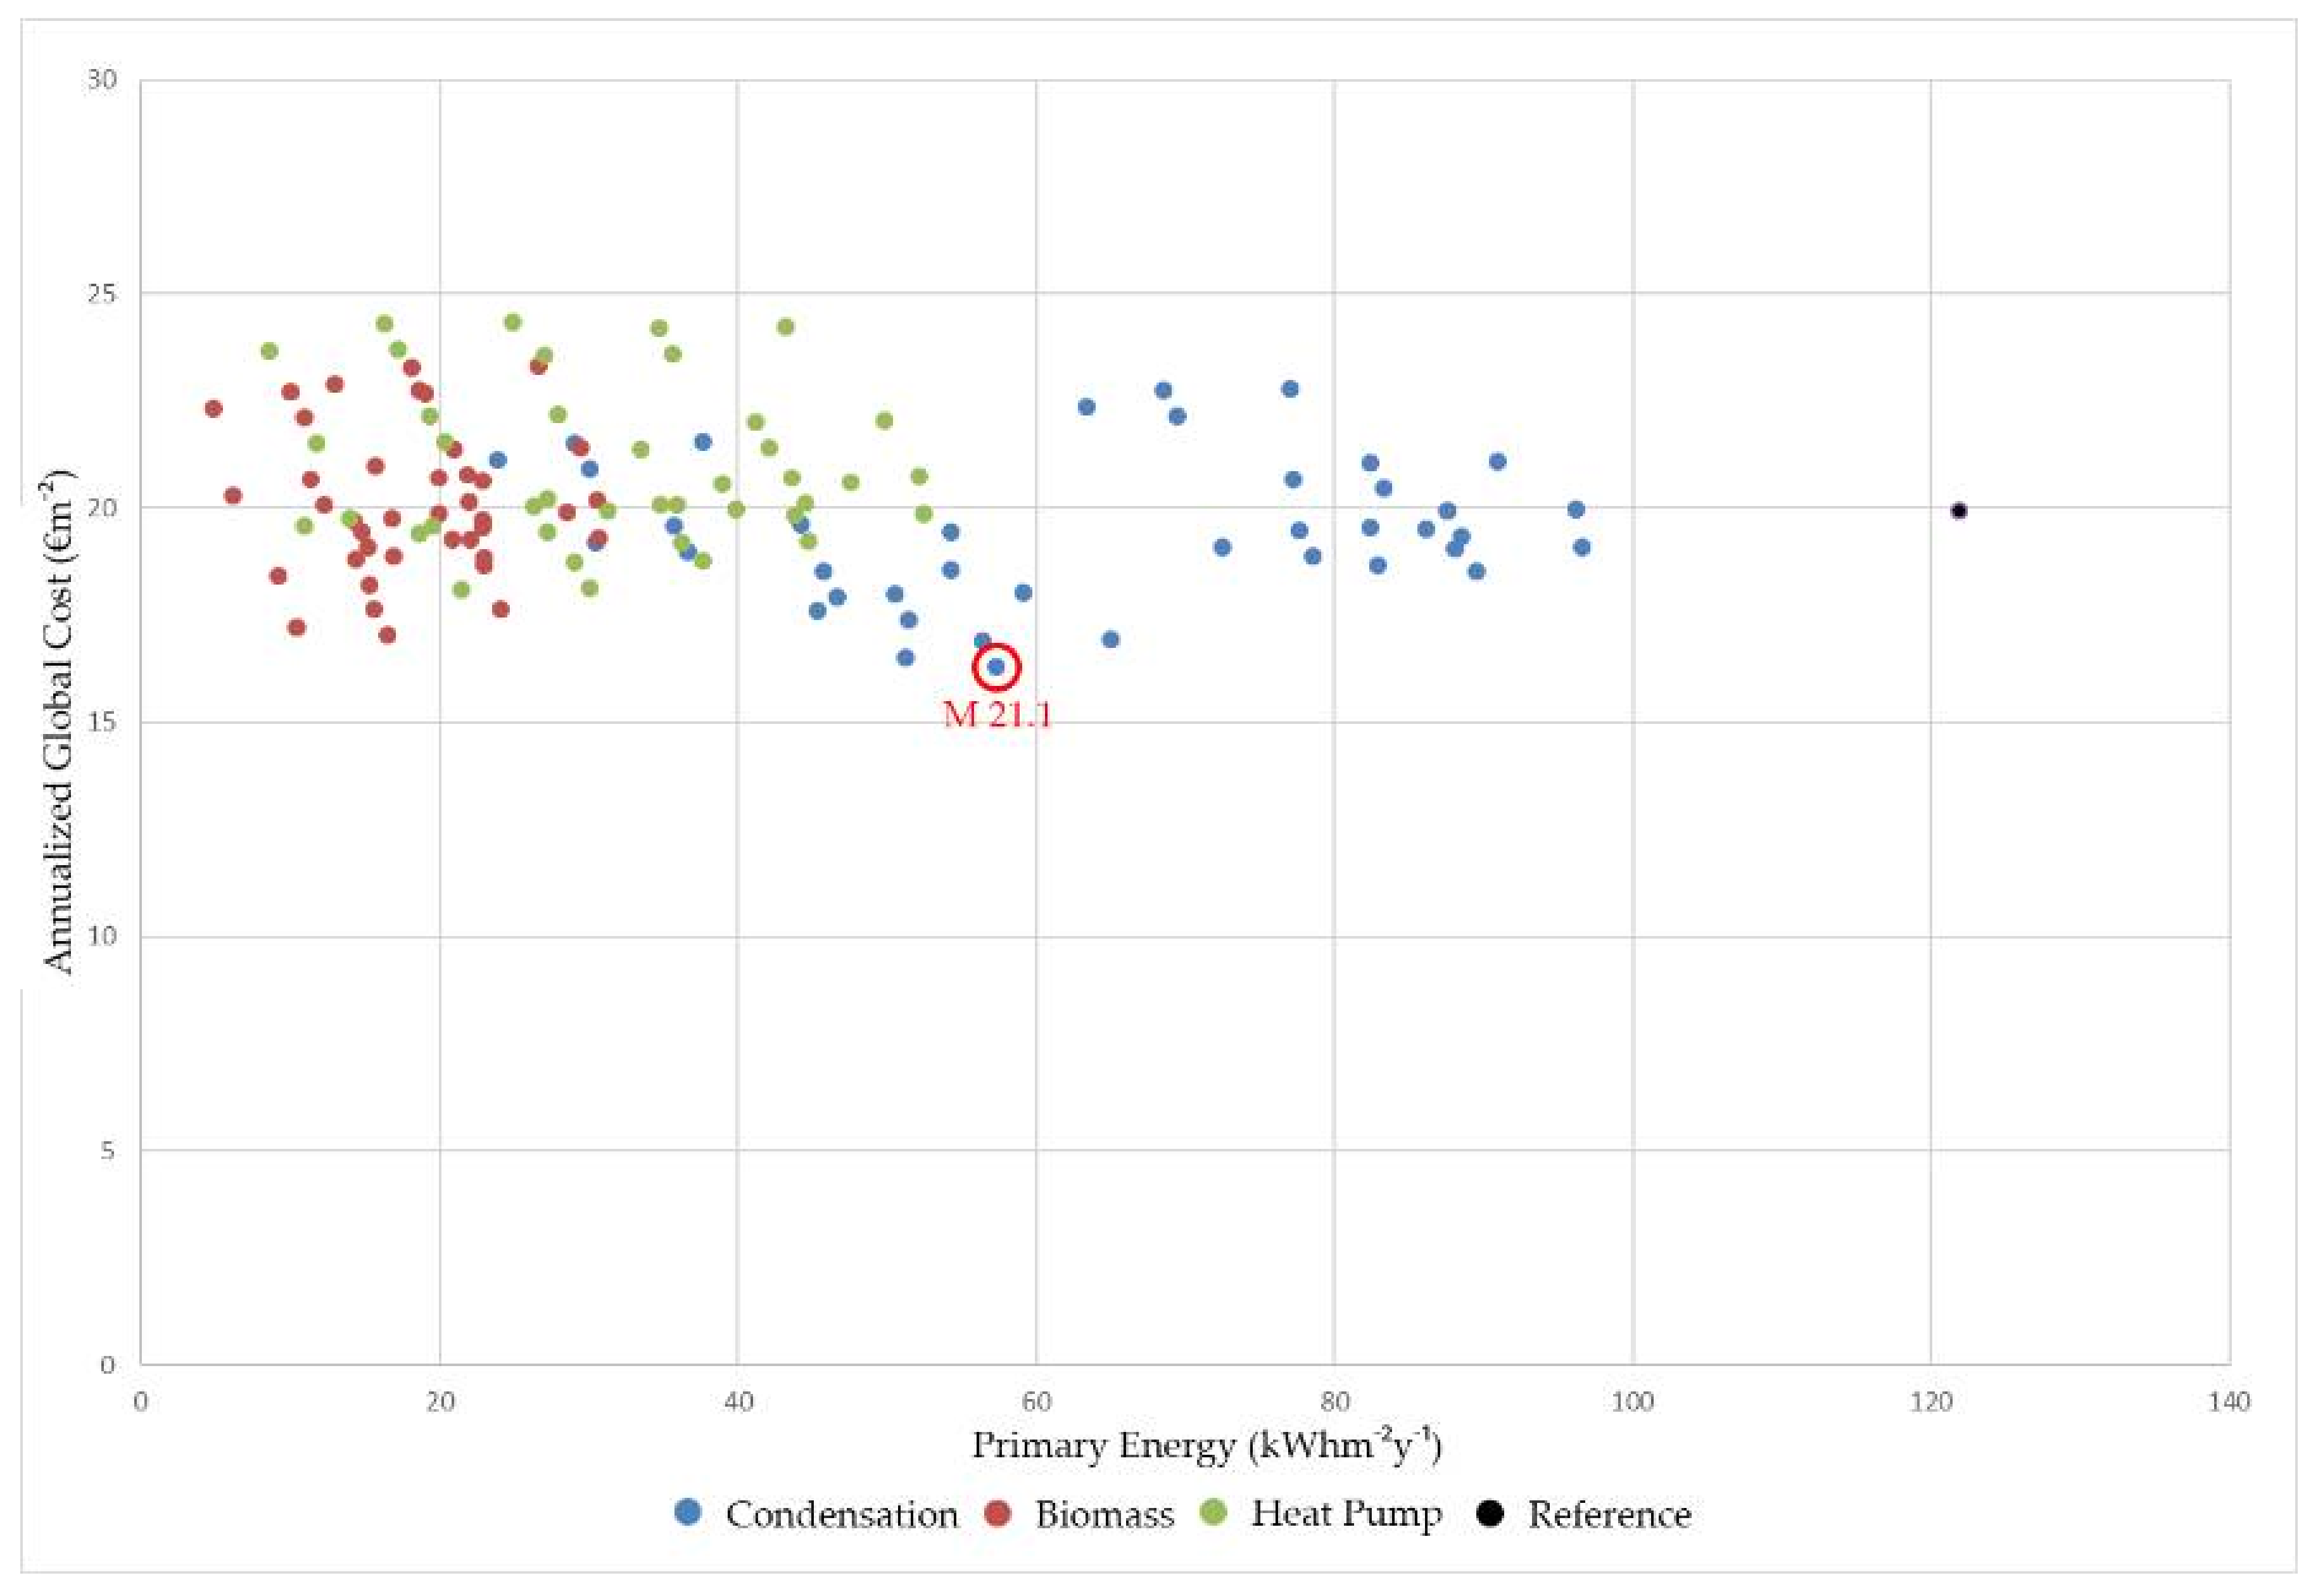
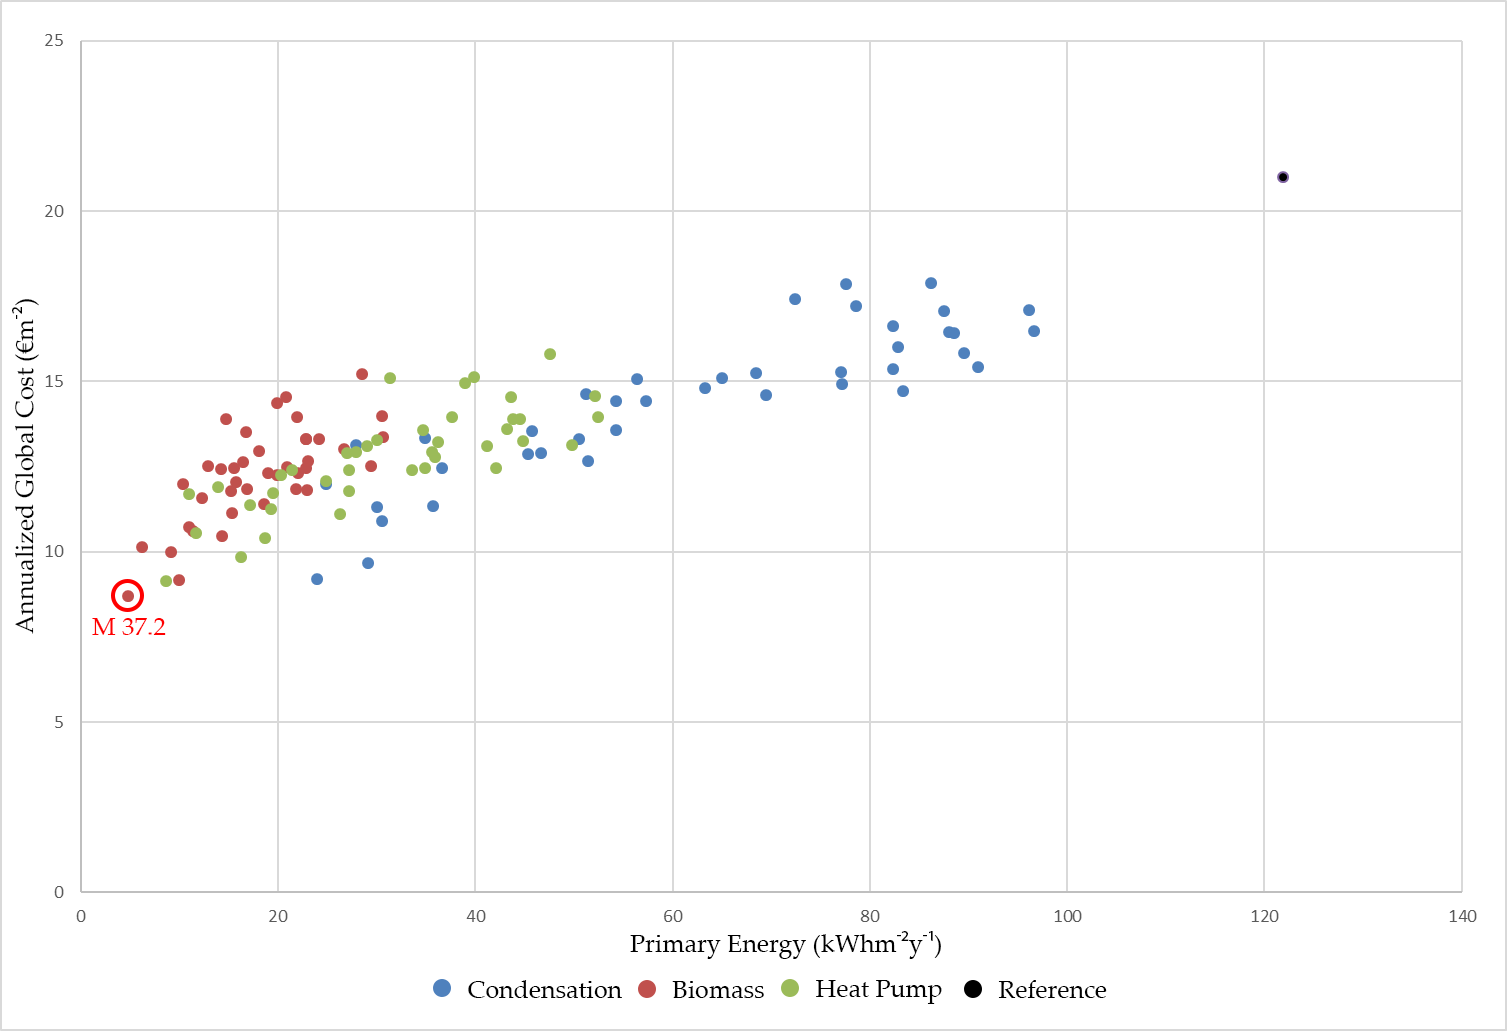
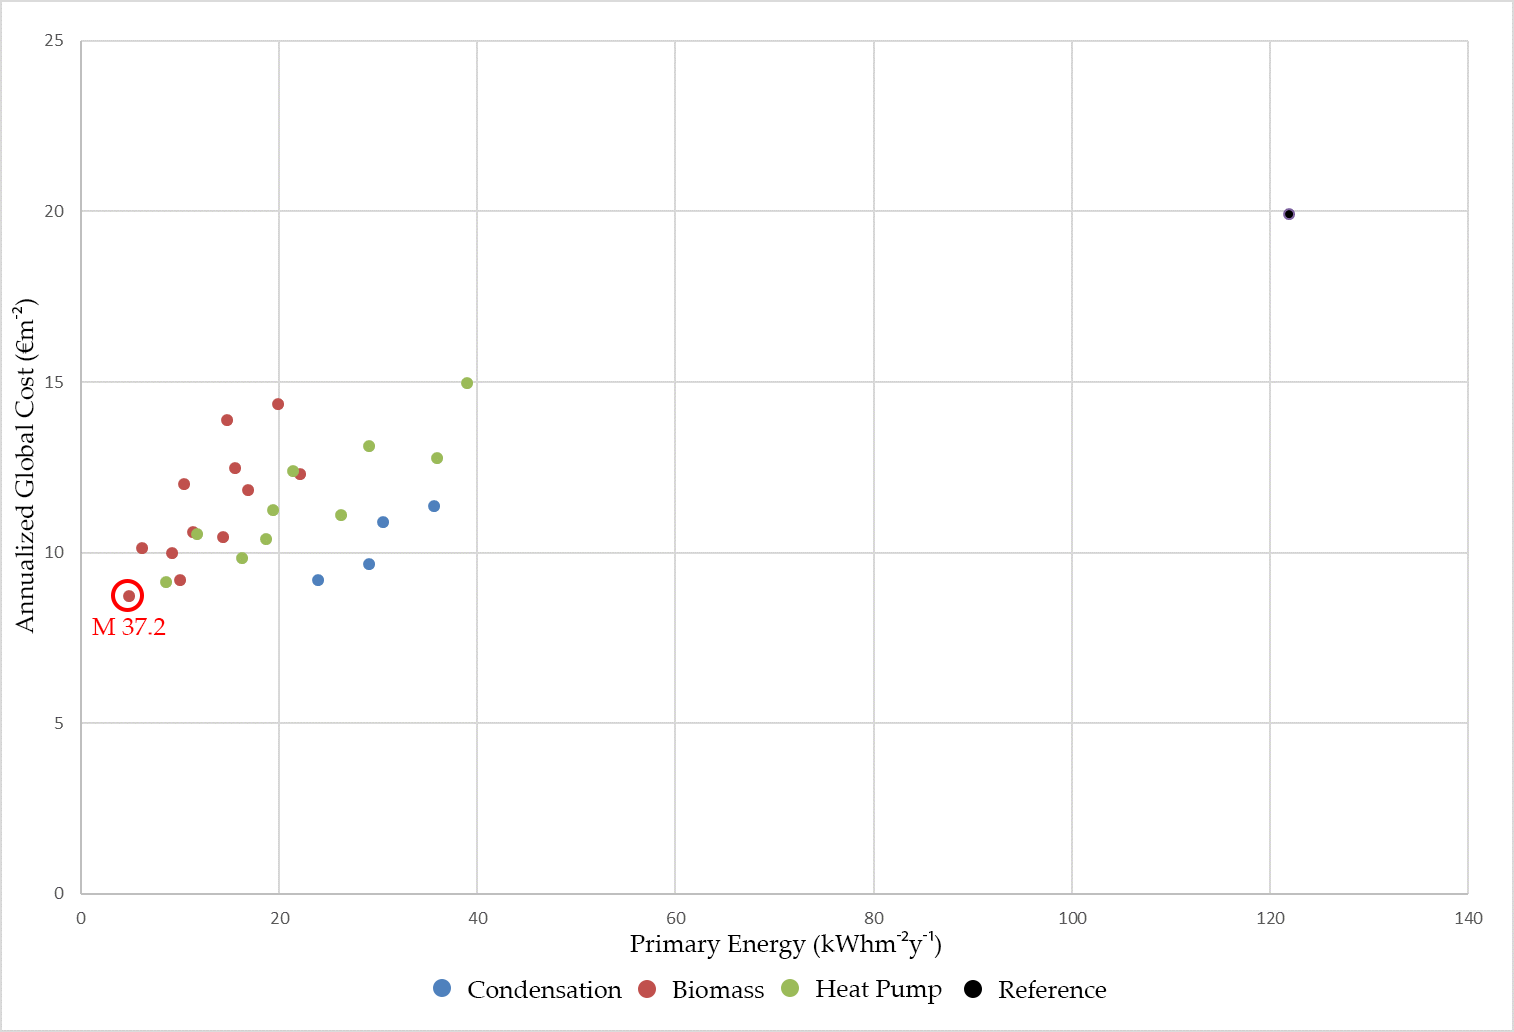
28] of construction alternatives; the aim is to define the cost-optimal level, i.e., to propose the solution presenting the lowest total costs. The solutions found are shown in a graph presenting a comparison between global costs (€ m−2) and primary energy consumption (kWh m−2·y−1).
The required benchmarks concern the achievement of nZEB targets and the calculation of incentives. The study to derive cost-effectiveness from a technical and economic perspective is carried out in accordance with the EPBD recast, the Delegated Regulation n. 244/2012 [29] and its Guidelines [30]. The methodology consists of several steps: definition of reference buildings; definition of energy-efficiency measures (measures based on energy from renewable-energy sources (RES) and/or packages and variants of such measures for each reference building); calculation of primary energy demand resulting from the application of the previously selected measures and/or packages of measures; calculation of global costs in terms of net present value for each reference building; sensitivity analysis related to cost data; and identification of cost-optimal levels in each reference building.
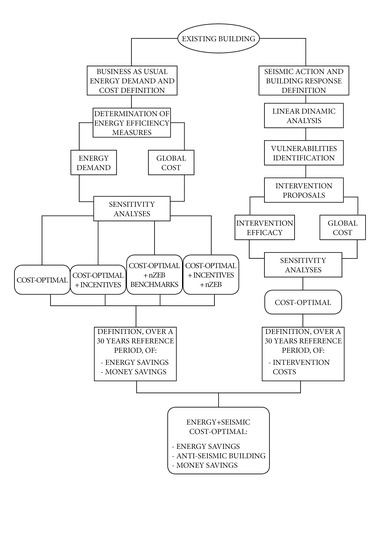
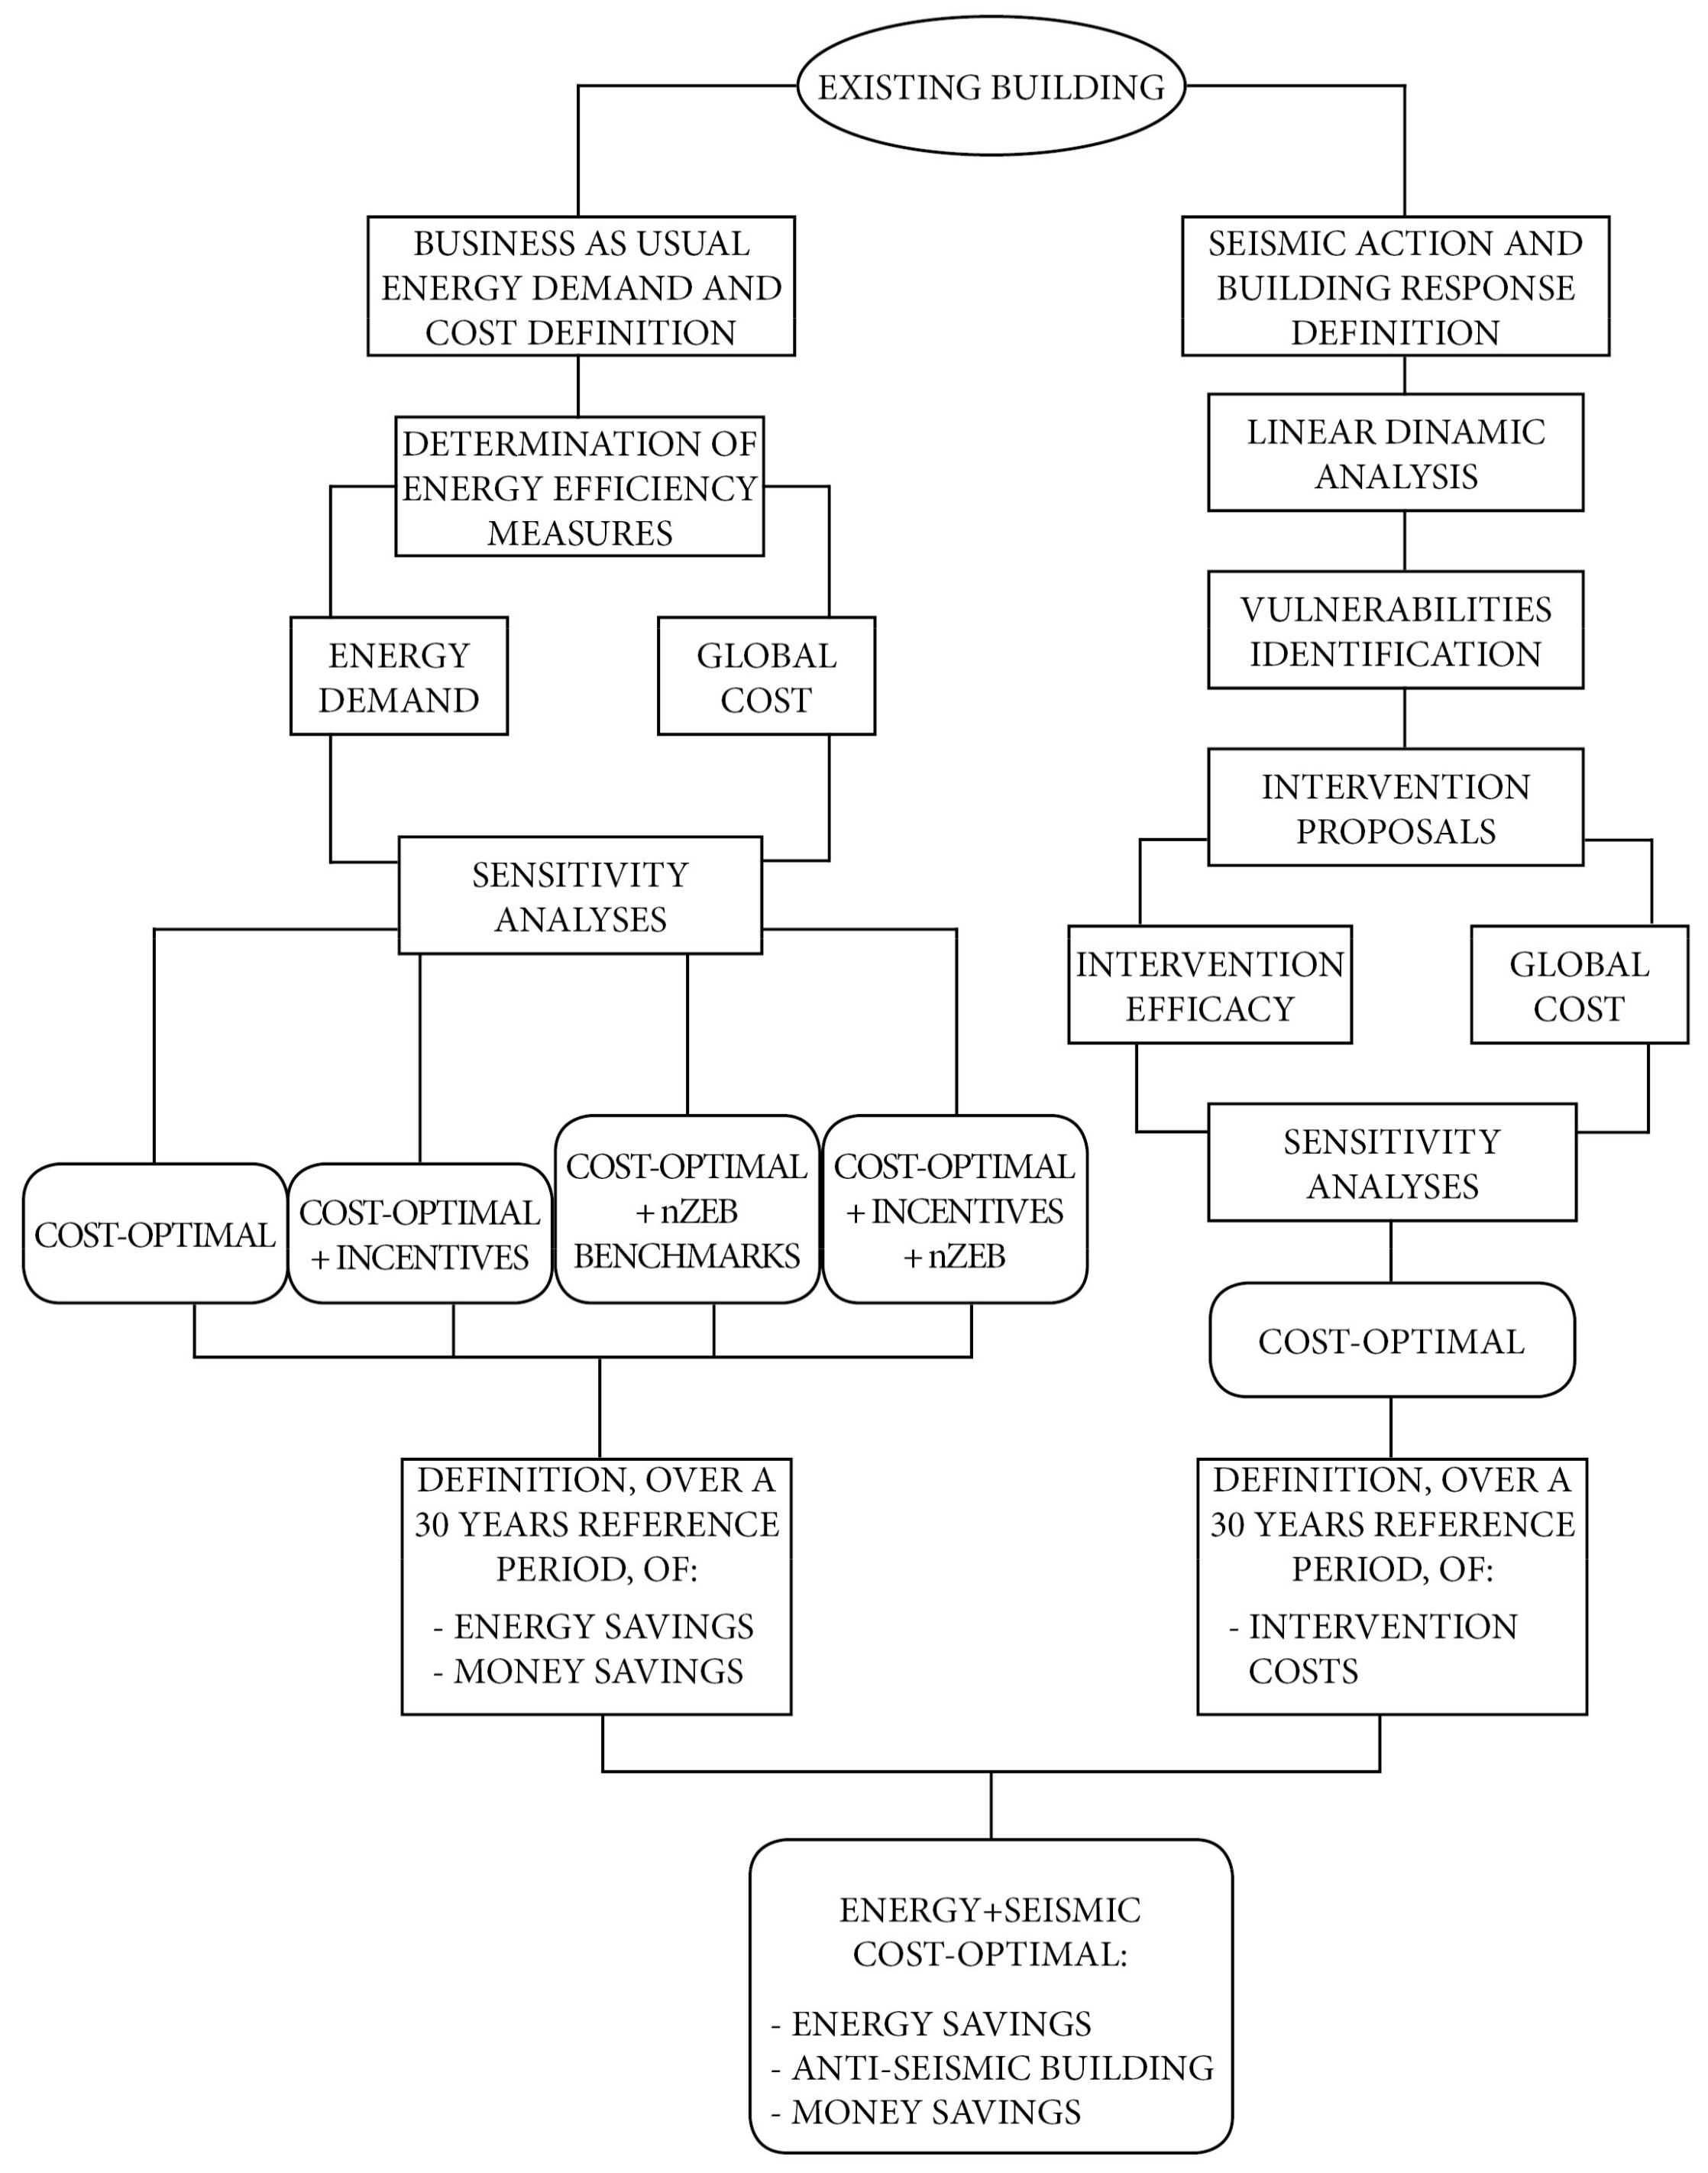
Subsequently, seismic retrofit interventions are based on the identification and analysis of the structural vulnerabilities of the building through modal and spectral analysis carried out with commercial finite element analysis (FEA) software. Required improvements are determined, and the best intervention is identified in terms of the cost–benefit ratio, aiming to find the cost-optimal seismic upgrade. The proposed method is divided into the several phases: definition of seismic action, load analysis, linear dynamic analysis, definition of interventions and cost–benefit calculation.
The methodology (Figure 1) described above is applied to a school building, as a case study, to verify its effectiveness: the school building was built in the 1930s and extended twice in the 1960s and 1970s. Thus, to date it presents non-homogeneous masonry and floors that need an energy retrofit and seismic upgrading.

2.1.1. Energy Retrofitting, Optimization and Nearly Zero-Energy Building (nZEB) Targets

A first step for the optimization process is the definition of a reference building and this study used the definition proposed by the IEA Annex 56 Cost-Effective Energy and CO2 Emissions Optimization in Building Renovation [
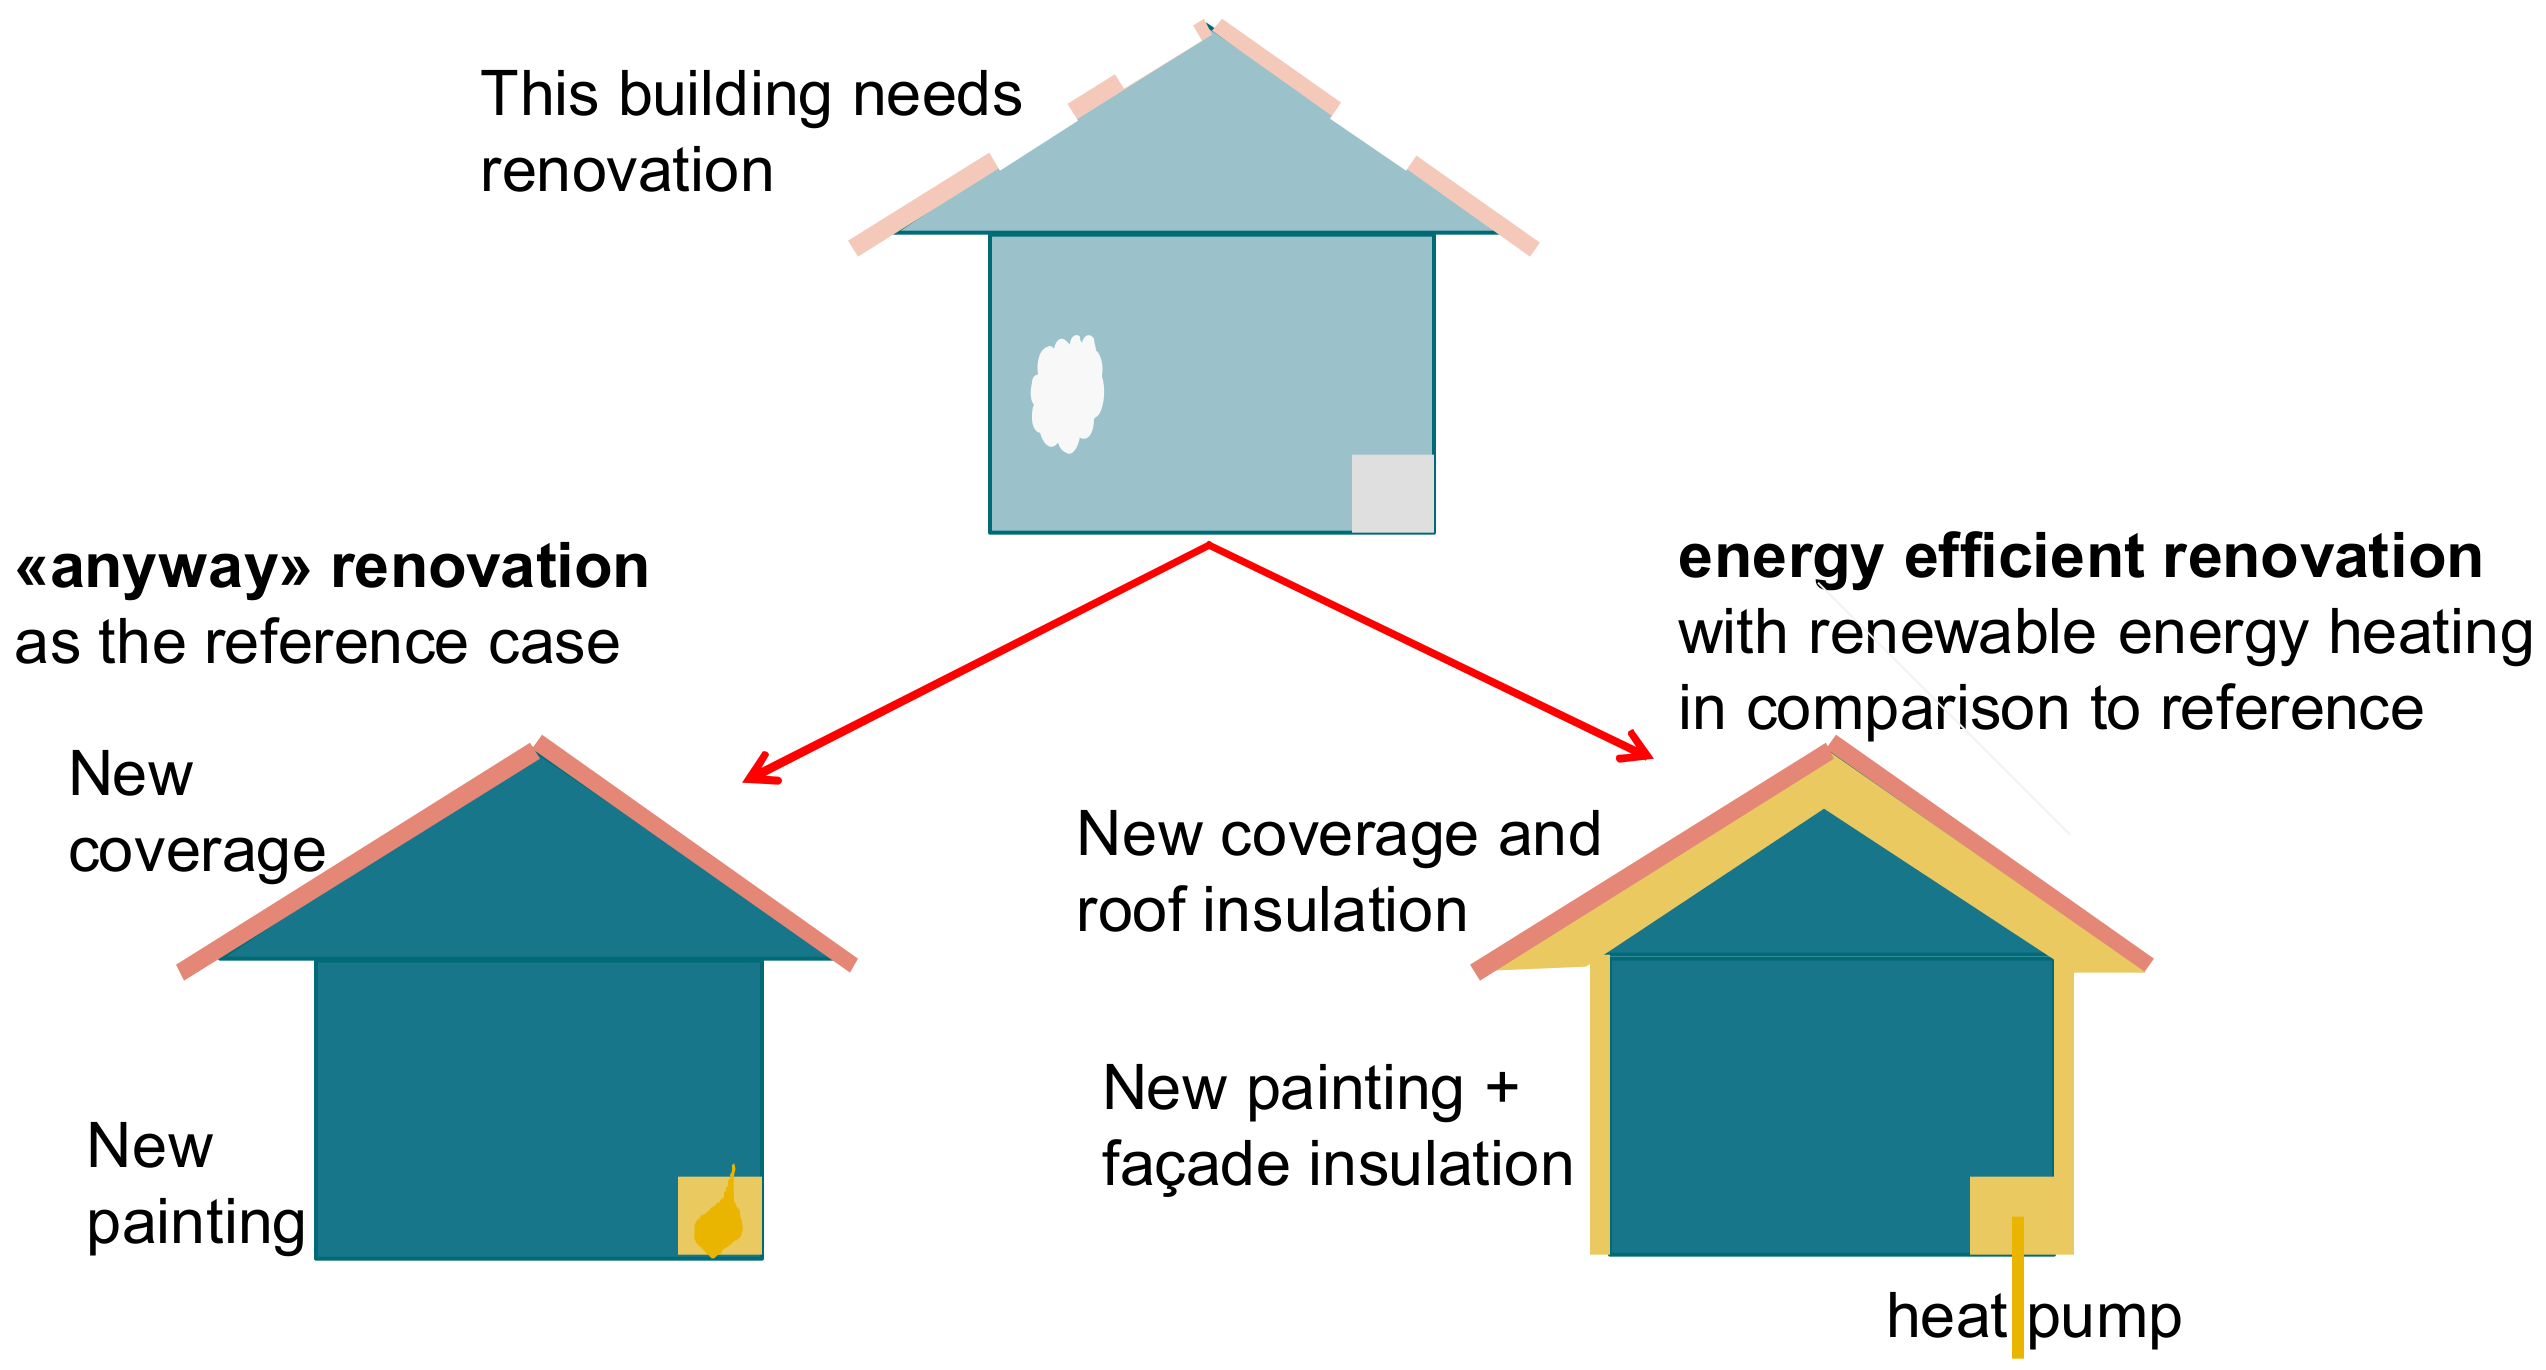
31]. In the reference case (Figure 2), the renovation consists only of measures carried out for maintaining the building and its functionality. In this kind of renovation, so called «anyway» measures strive for the renewal of building elements or building parts which have arrived at the end of their service life, not deliberately endeavoring to attain higher energy performance [32]. This anyway renovation solution, comprising the so-called anyway renovation measures, identifies a reference situation for determining and assessing the impacts of an energy-related renovation solution on energy use, carbon emissions, materials, costs and possible benefits. The energy-related solution comprises, on the one hand, those retrofit measures of the anyway renovation which are not changed by the energy-related measures. On the other hand, it comprises additionally the energy-related measures, which might be additional to the anyway measures or which might substitute some anyway necessary measures by measures which also improve energy performance and do not only restore the original functionality of the particular building element. Building renovation comprising energy-related measures is compared to the anyway reference case to determine the effects of the energy-related measures.
The retrofit solutions are defined through different steps (Table 1). In the first step, the thermal envelope is analyzed: all the elements (external wall, roof, basement, windows) are considered in terms of thermal losses and percentage incidence of surfaces. Then, three groups of energy-efficiency measures (EEMs) are defined according to the standard values of thermal transmittance given by the Conto Termico 2.0 regulation (D.M. 16/02/16) [33,34]: interventions of thermal insulation on each technological element of the envelope; interventions on several technological components in accordance with their percentage incidence of thermal surface, first from higher to lower area and then from lower to higher area. In this way, 10 EEMs on envelope are defined and successively associated with the electrical lighting and wiring system interventions, for a total of 40 combinations: installation of photovoltaic system to cover the 50% of electrical need; and substitution of light bulbs with high-efficiency light-emitting diode (LED) lamps. Finally, all these solutions are combined with the substitution of the existent energy generator with three different boilers: installation of a gas condensing boiler; installation of a biomass boiler; installation of an electrical heat pump.
The EEMs, as they have been defined, number 120 and they will be analyzed in terms of primary energy use and annualized global cost for a lifecycle of 30 years.
After the definition of the reference buildings and the energy-efficiency retrofit measures, primary energy demand is calculated using software for an energy dynamic simulation, such as Energy Plus [35] with Design Builder [36] as a graphic interface. Heating, cooling, ventilation, domestic hot water, lighting and auxiliary demands have been estimated in accordance with the Italian technical specifications UNI 11300 [37], which implement the European standards [38,39]. The characteristics of energy production, distribution, emission and control, as well as the energy carrier, are inserted to derive the final primary energy consumption, according to the conversion factor given by the national normative [40]. The model is calibrated by means of the energy consumption of the last few years.
In this study, the financial level is defined as the global cost: the sum of the initial investment, the sum of the annual costs for each year (energy, maintenance, operation and any additional costs), the replacement of systems and components, the final value, and the costs of disposal, as appropriate. All costs are actualized to the starting year, considering a lifespan of 30 years and the interest rate, through Equation (1):
Annualized global cost = NPV × r × [1 − (1 + r)]n
The equation for the annualized global cost (GC) calculation considers the NPV (net present value) (€), r as an annual real discount rate (%), and n as the lifetime (year).
The financing framework methodology is based on the net present value (global costs) calculation, carried out according to standard EN 15459:2007 [27], which provides a method for considering the economic aspects of the application of heating systems and other technical systems that affect the energy consumption of the building.
A sensitivity analysis is carried out considering the global cost and the primary energy consumption for each EEM compared to the reference scenario, to find out the optimal cost solution [41].
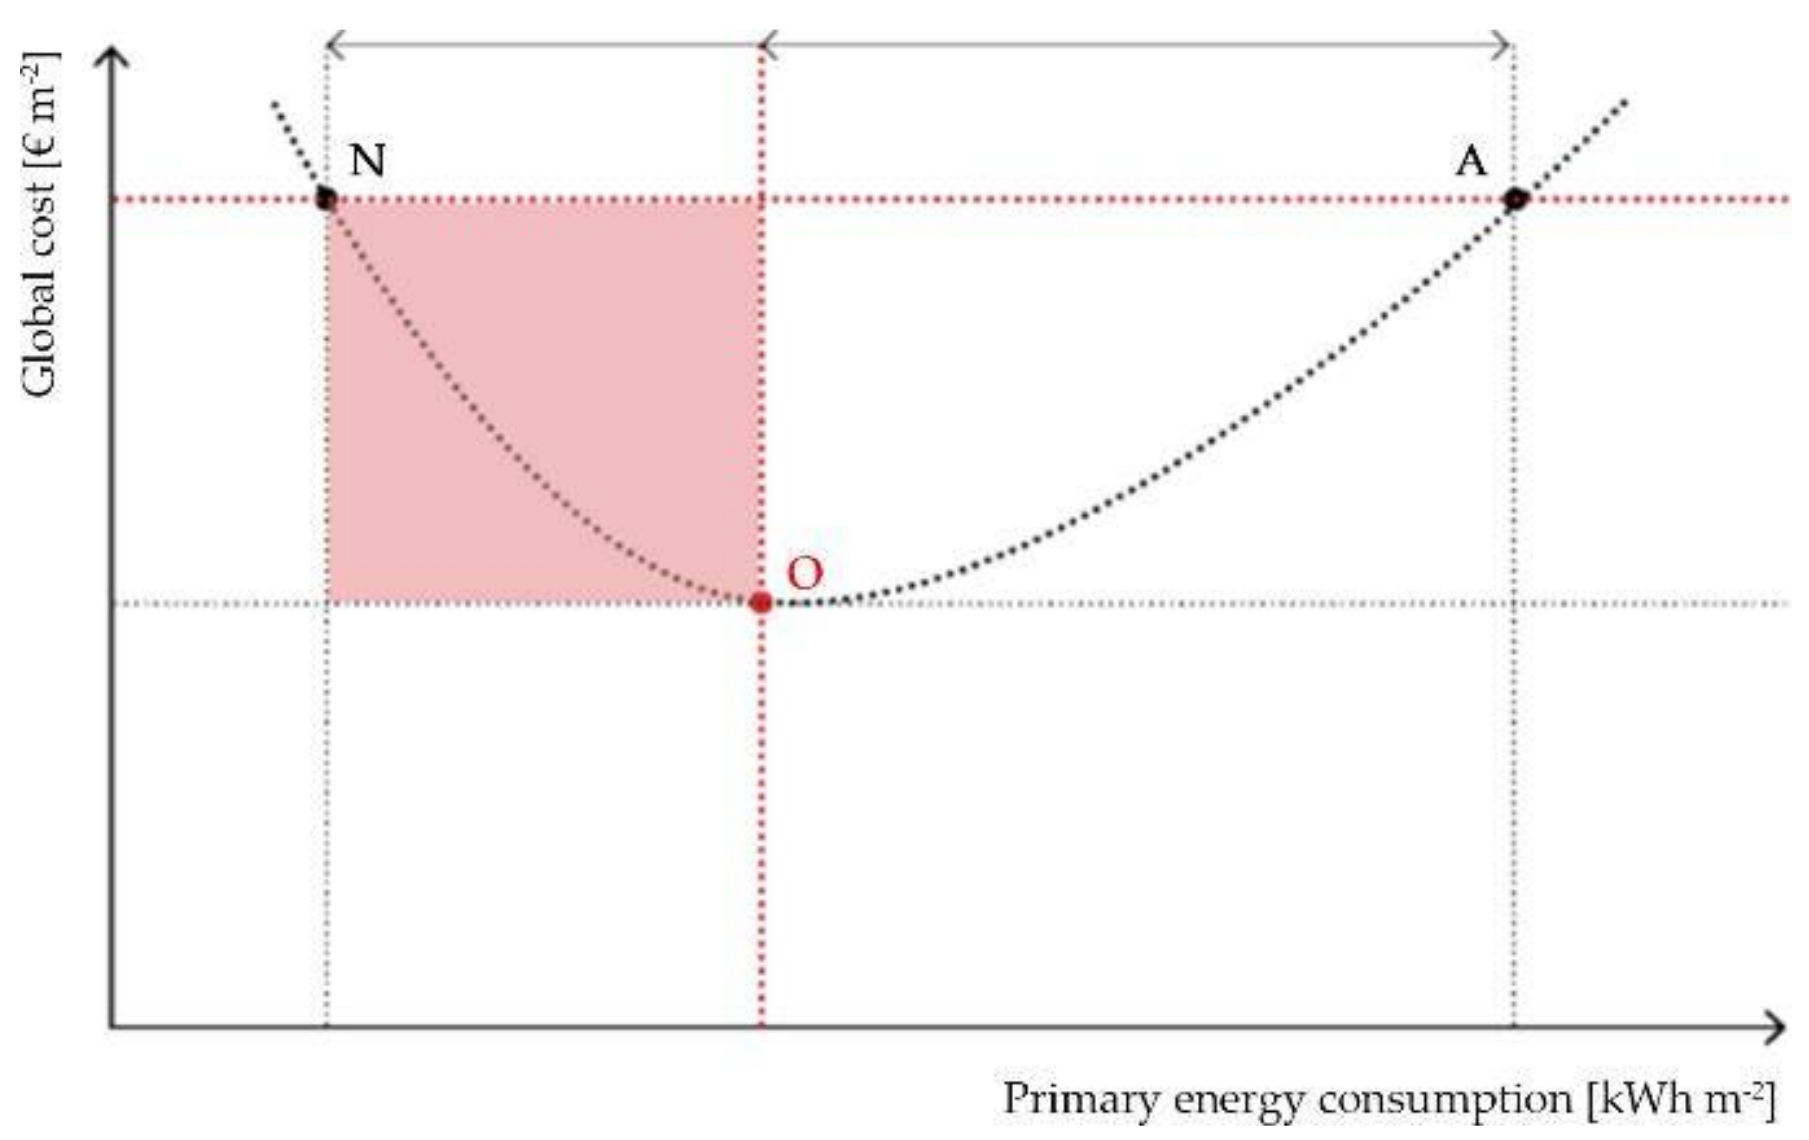
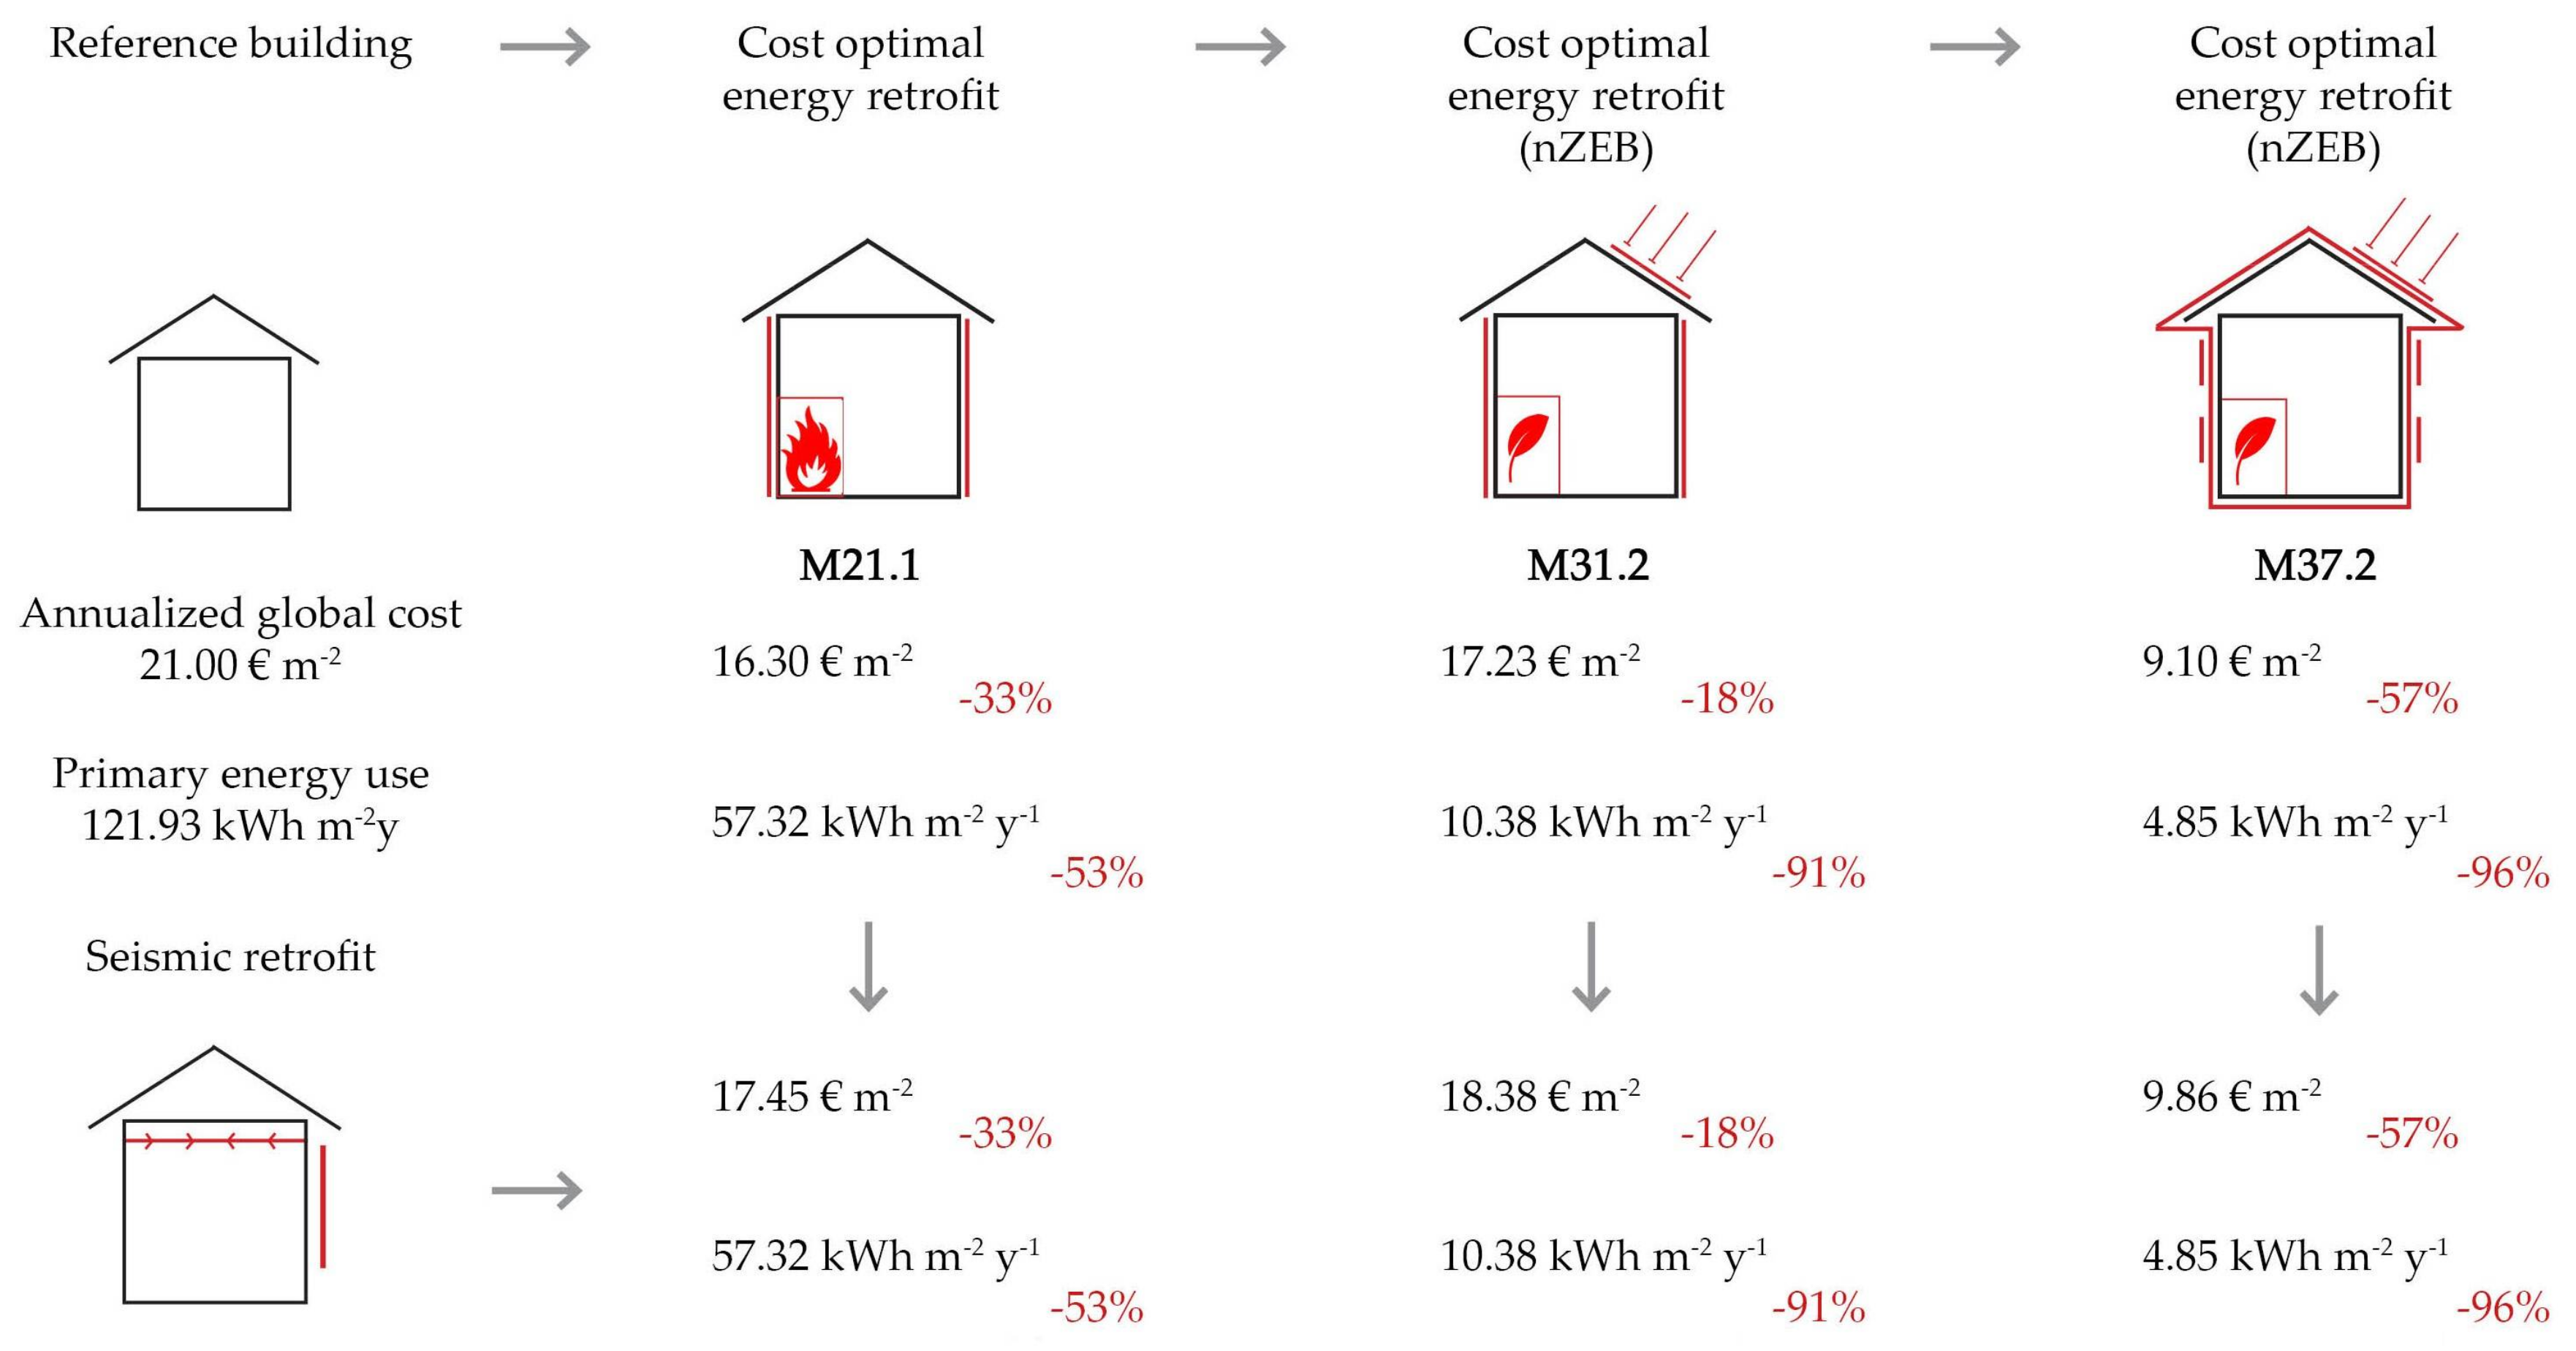
The main goal of the study is the transformation of a school building into nZEB. As defined by the EPBD recast, a nZEB is a building characterized by a very high energy performance; the nearly zero or very low amount of energy required should be largely covered by renewable energy produced on-site or nearby. A building is considered an nZEB when the following requirements are met: the energy performance (EP) is lower than the cost-optimal level, the differential GC with reference to the building before the refurbishment is negative (nZEB is cost effective) and the national minimum energy targets for nZEBs are achieved. Thus, the nZEBs should have a primary energy consumption lower than the cost-optimal range, and the GC in between the cost-optimal cases and the current reference building (Figure 3).
The Italian law D. Leg. 63/2013 [42] and D. M. 26/06/2015 [28] defined minimum values to achieve nZEB targets for the following performance parameters: the overall heat transfer coefficient (H’t), the solar transfer coefficient (Asol,est/Asup utile), the energy performance index (EPH,nd, EPC,nd, EPgl,tot), the efficiency for generating thermal and electrical energy (ηH, ηW, ηC), and the integration of renewable energy sources, according to national minimal requirements [43]. With reference to the aforementioned parameters, this study considers the proposed EEMs which followed nZEB targets, identifying the cost-optimal solutions between them. Even if the EPDB Directive recast does not consider the application of financial incentives, this study considers the calculation of the Conto Termico 2.0 program, developed by GSE (Gestore dei Servizi Energetici, Rome, Italy), that regulates the incentive for interventions of small dimensions for increasing energy efficiency and for the production of thermal energy from renewable sources. Both public administrations and private owners are admitted, and the incentive duration varies from 2 to 5 years depending on the type of intervention. The characteristics of the envelope and system for retrofit measures are based on the benchmarks fixed by the Conto Termico 2.0 to evaluate the possible application of incentives to the different kind of interventions.
For solutions according to nZEB parameters, the bonus is equivalent to 65% of total investment cost of the intervention and conversion into nZEB (Table 2), where Ia tot is the annual subsidy in euros, Ei is the yearly thermal-energy production; Ci is the thermal-energy valorization coefficient as prescribed by Conto Termico 2.0 in Table 7; while Ia tot is the annual subsidy in euros; Pn is the system’s rated power; hr is system’s functioning hours as prescribed by Conto Termico 2.0 in Table 10; Ci is the thermal-energy valorization coefficient as prescribed by Conto Termico 2.0 in Table 9; and Ce is the rewarding coefficient related to particulate emissions as defined by Conto Termico 2.0 in Tables 11 and 12. After defining the costs for each intervention with the calculation of incentives, the optimal cost is selected among all possible interventions and among those which comply with the nZEB parameters.

2.1.2. Definition of Seismic Action and Analysis of Structural Vulnerability

Seismic action is defined by several characteristics of the buildings as: its use, nominal life (VN), reference period (VR), the seismic hazard of the construction site, and other parameters related to the typology of the soil. These values are defined by the Italian Building Code, NTC 2008.
The seismic hazard of the site is defined by referring to the ultimate limit states (ULS) and the serviceability limit states (SLSs), as defined by the NTC 2008. The seismic hazard for ULSs, referring to the case study analyzed in this work, is characterized by the parameters shown in Table 3.
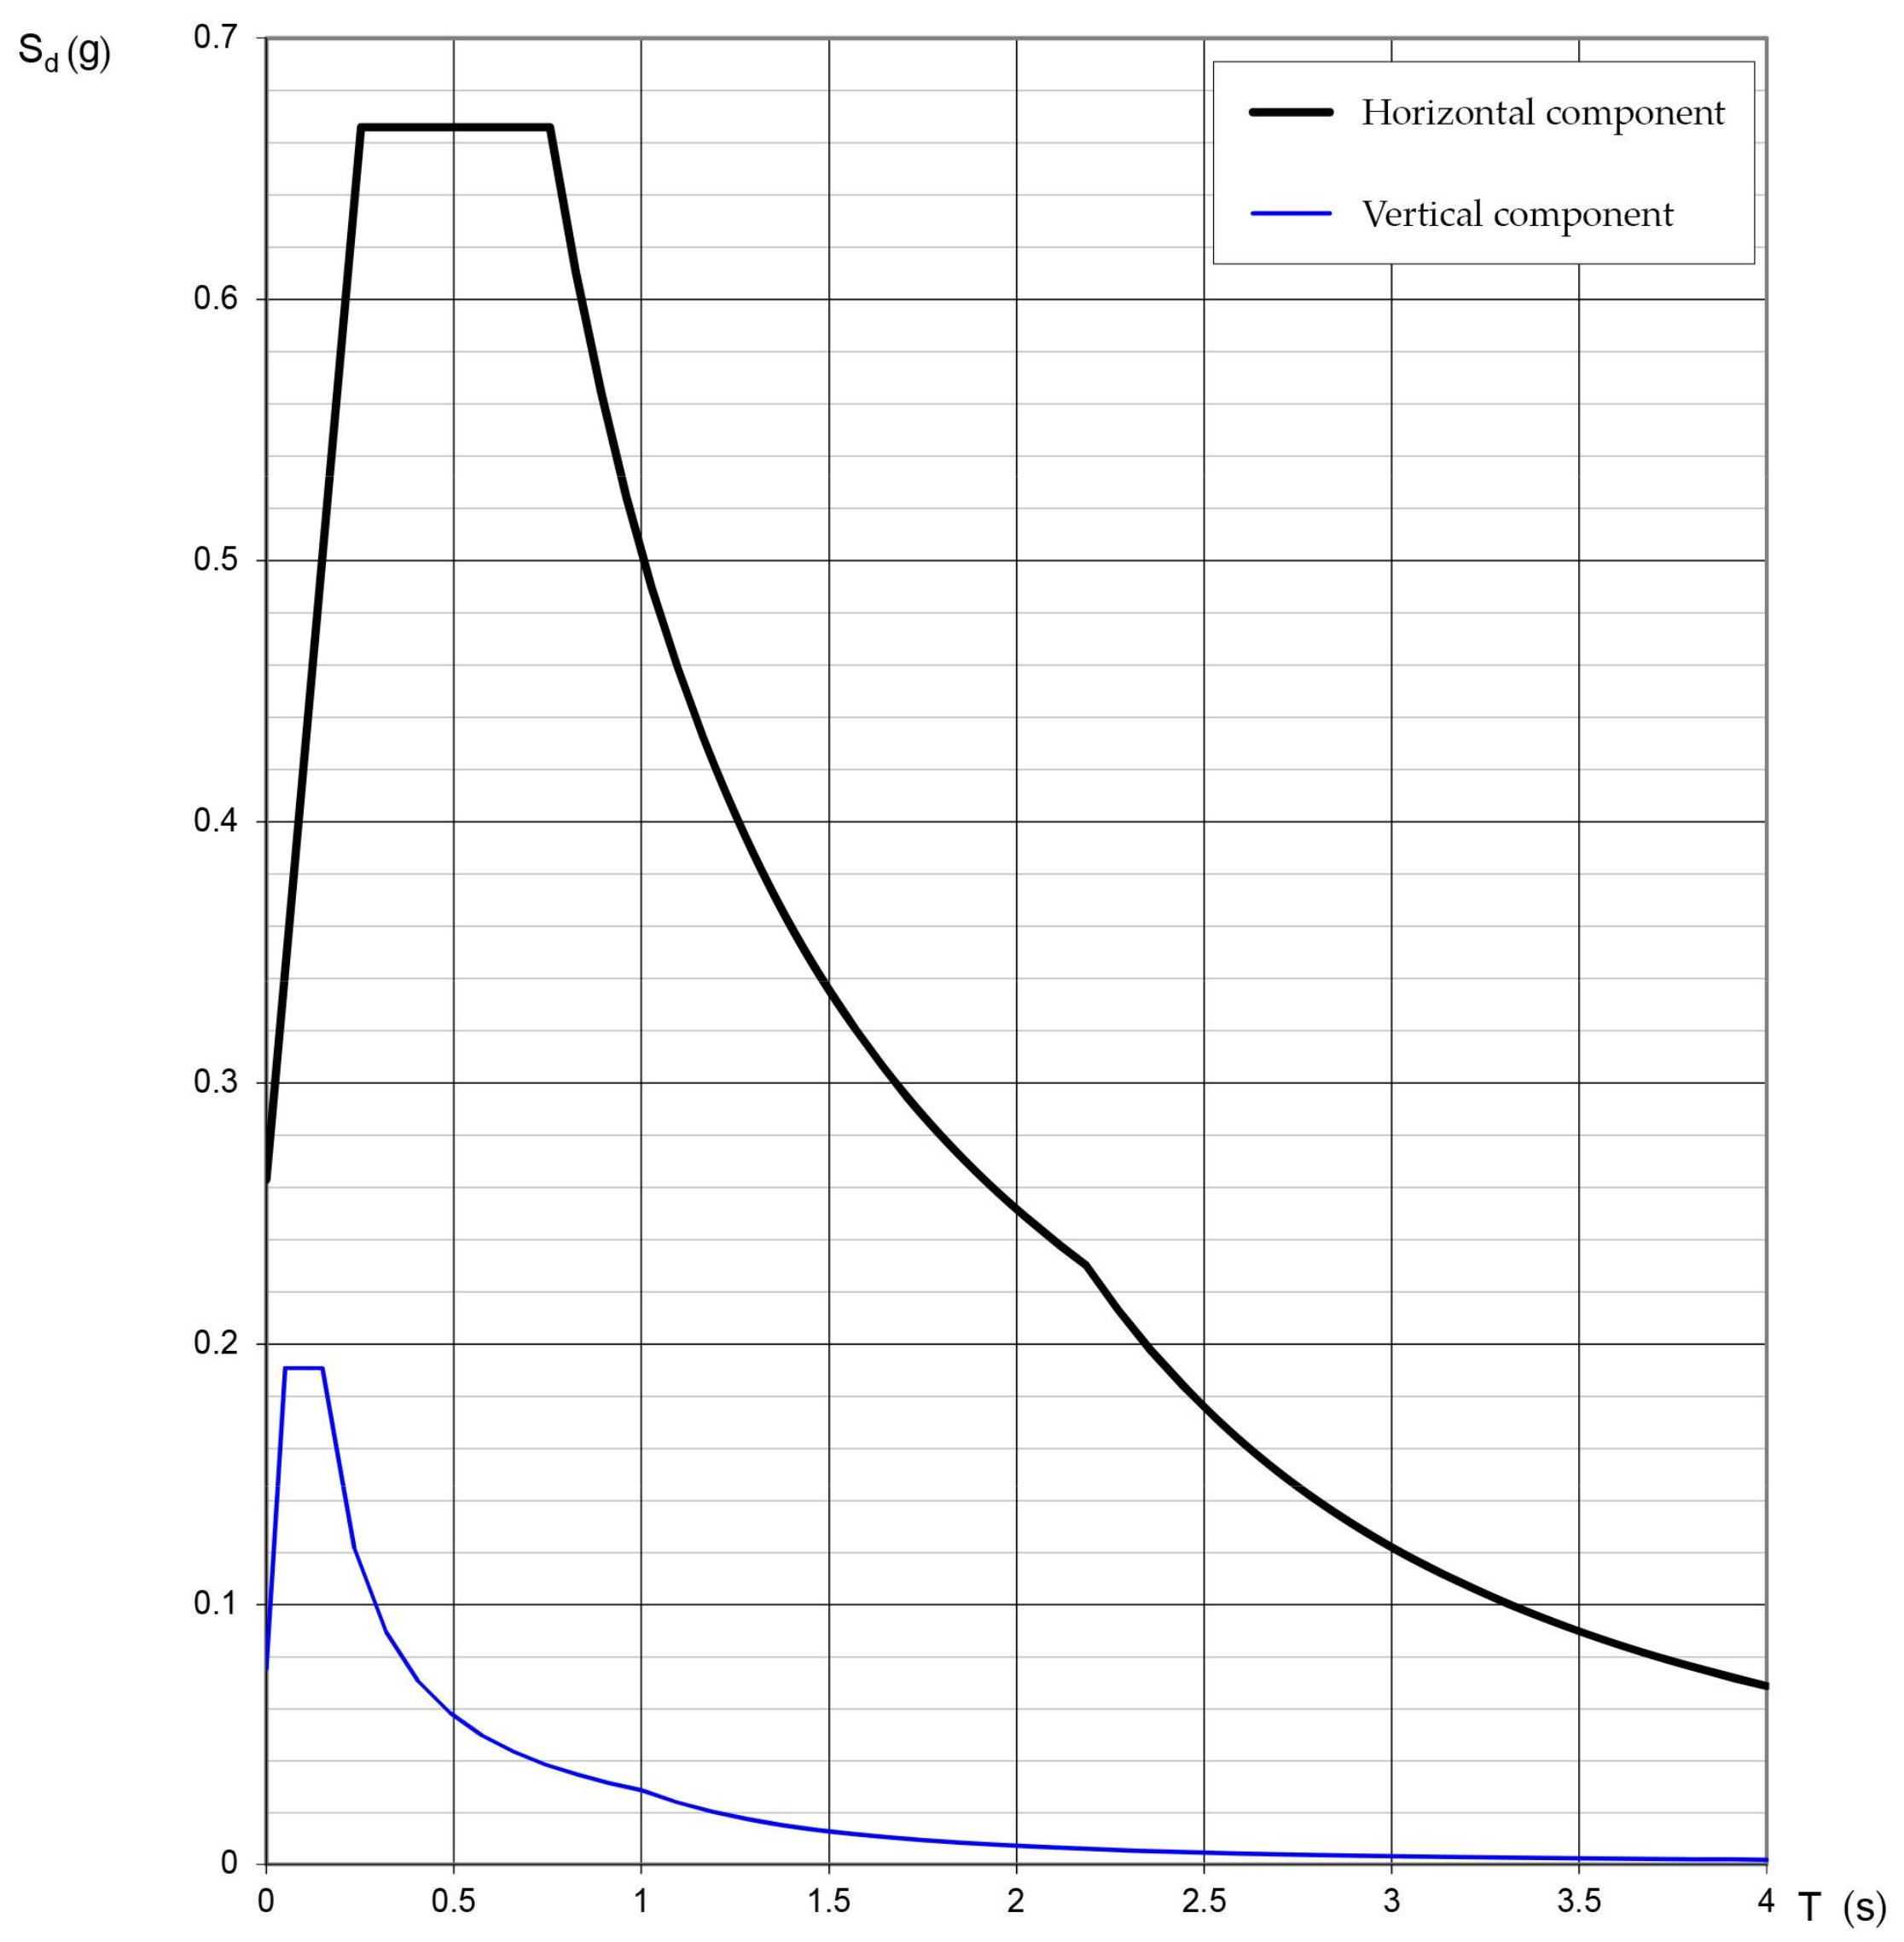
Based on these characteristics, the design response spectra for ULS, for both horizontal components, are calculated by NTC 2008 (Figure 4). For the determination of the spectra, a damping factor of 5% is assumed.
The elastic response spectrum allows identification of the elastic displacement response spectrum. Through the elastic displacement response spectrum, it is possible to compare the “displacement capacity” of the structure with the “displacement demand” required by the site, according to the reference state limit. The response spectrum is used to perform the linear dynamic analysis of the building. This analysis allows maximum displacement values to be obtained and the most stressed point of the structure to be located. Starting from these results, the intervention proposals are defined. The aim of the possible actions is to improve the critical aspects by lightening the horizontal elements, improving the resistance to stress of the vertical elements, and preserving the masonry box-like behavior.
Concerning energy issues, this research has achieved four cost-optimal solutions, selecting them among all proposed measures and among those that achieve nZEB targets, considering or not the calculation of incentives. All the outputs are summarized in charts representing the most efficient measure, considering primary energy use and the annualized global cost.
With regard to seismic assessment, intervention measures are simulated and compared with the behavior of a recent seismic event in the building. The value of performance and cost of intervention are collected to verify the effectiveness and validity of the proposal.

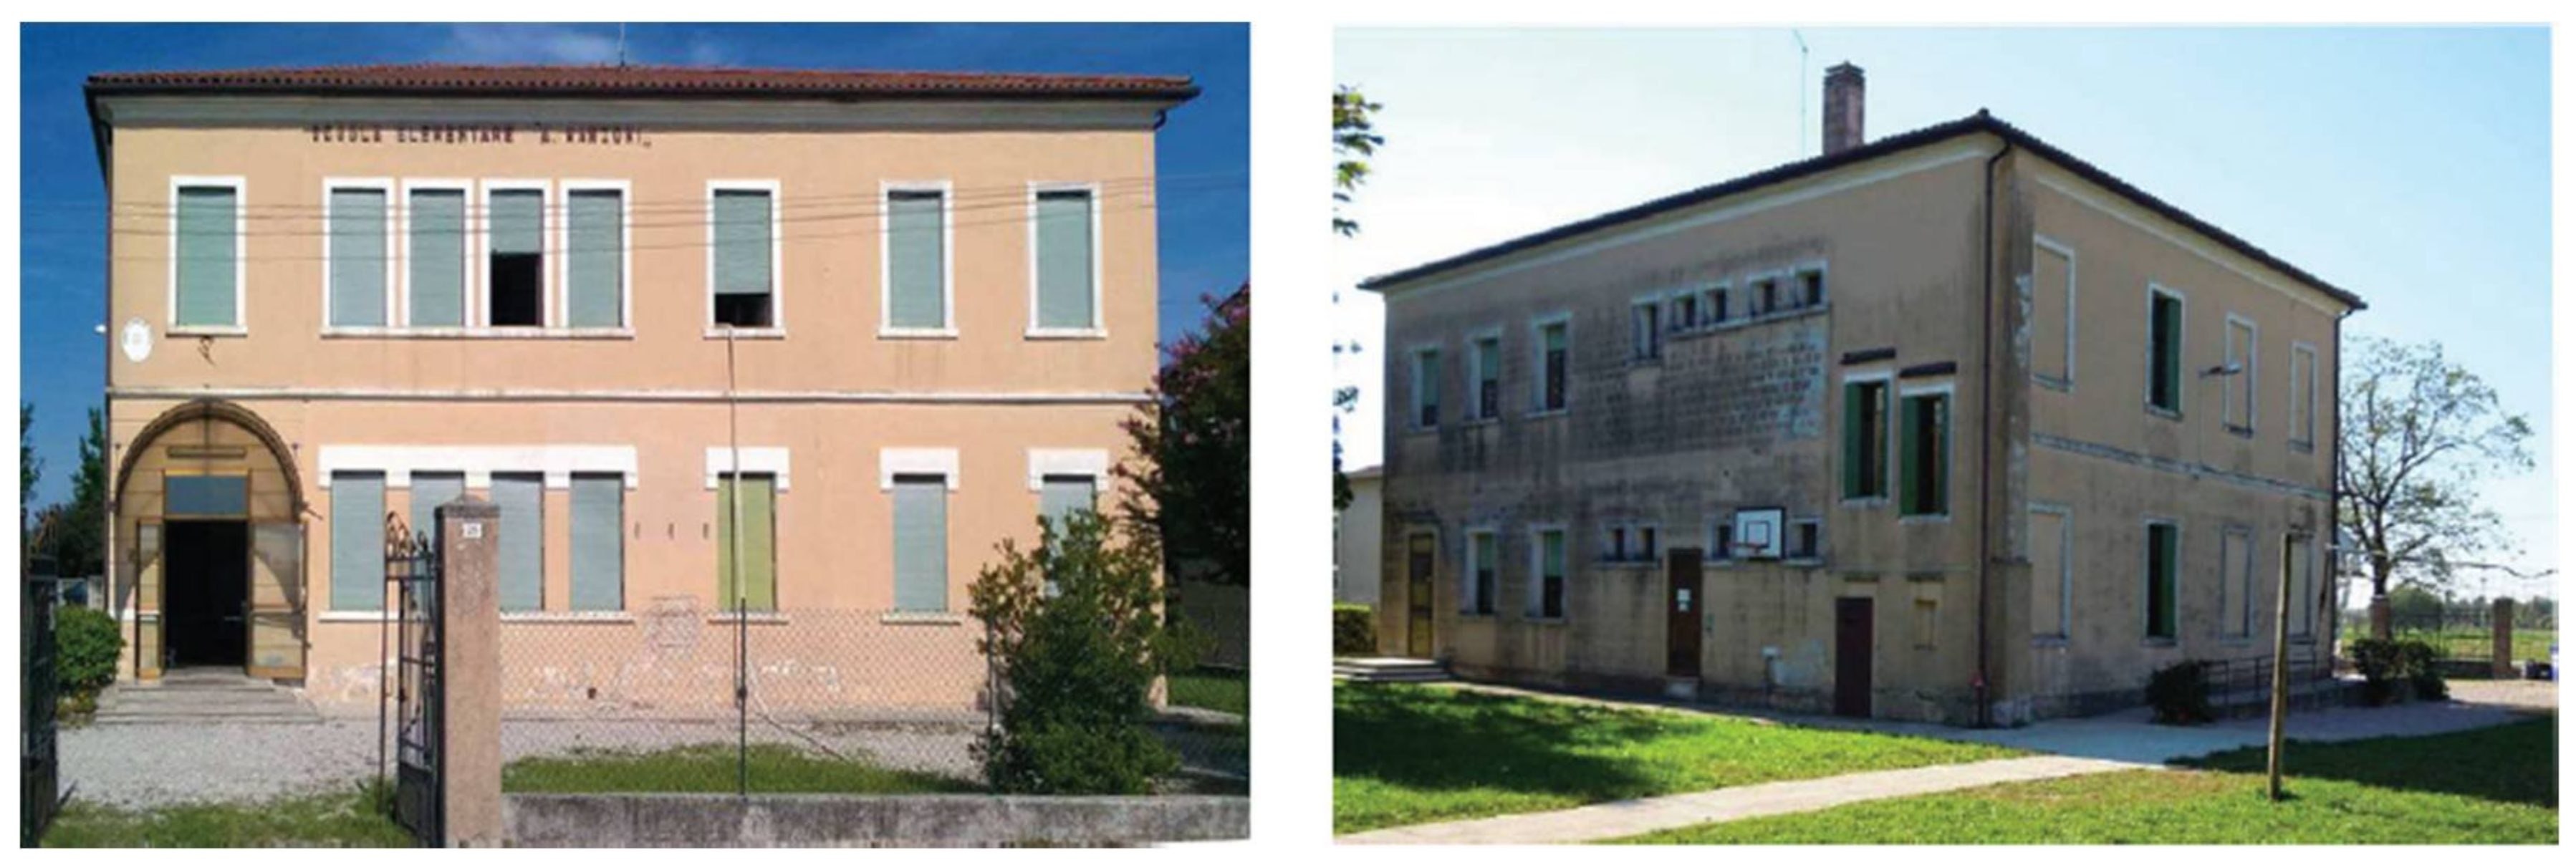
2.2. Applications—Case Study

The methodology is applied on a case study: the primary school A. Manzoni (Figure 5), located in the Italian municipality of Motta di Livenza (TV). The school was built in 1930 and later expanded in the 1960s and 1970s. The floor area of the building is 415.38 m2. The thermal surface is 947.98 m2 and the heated volume is 2070 m3. The geometry is compact and regular, with a compactness surface-area-to-volume ratio (S/V) to 0.46. The building consists of several types of masonry and floor, corresponding to different construction phases; the features of the external envelope are summarized in Table 4 describing the thermal losses behavior and the relative percentage incidence.
The mechanical characteristics of the structural elements are derived from in situ test results [44] and are summarized as follows (Table 5):
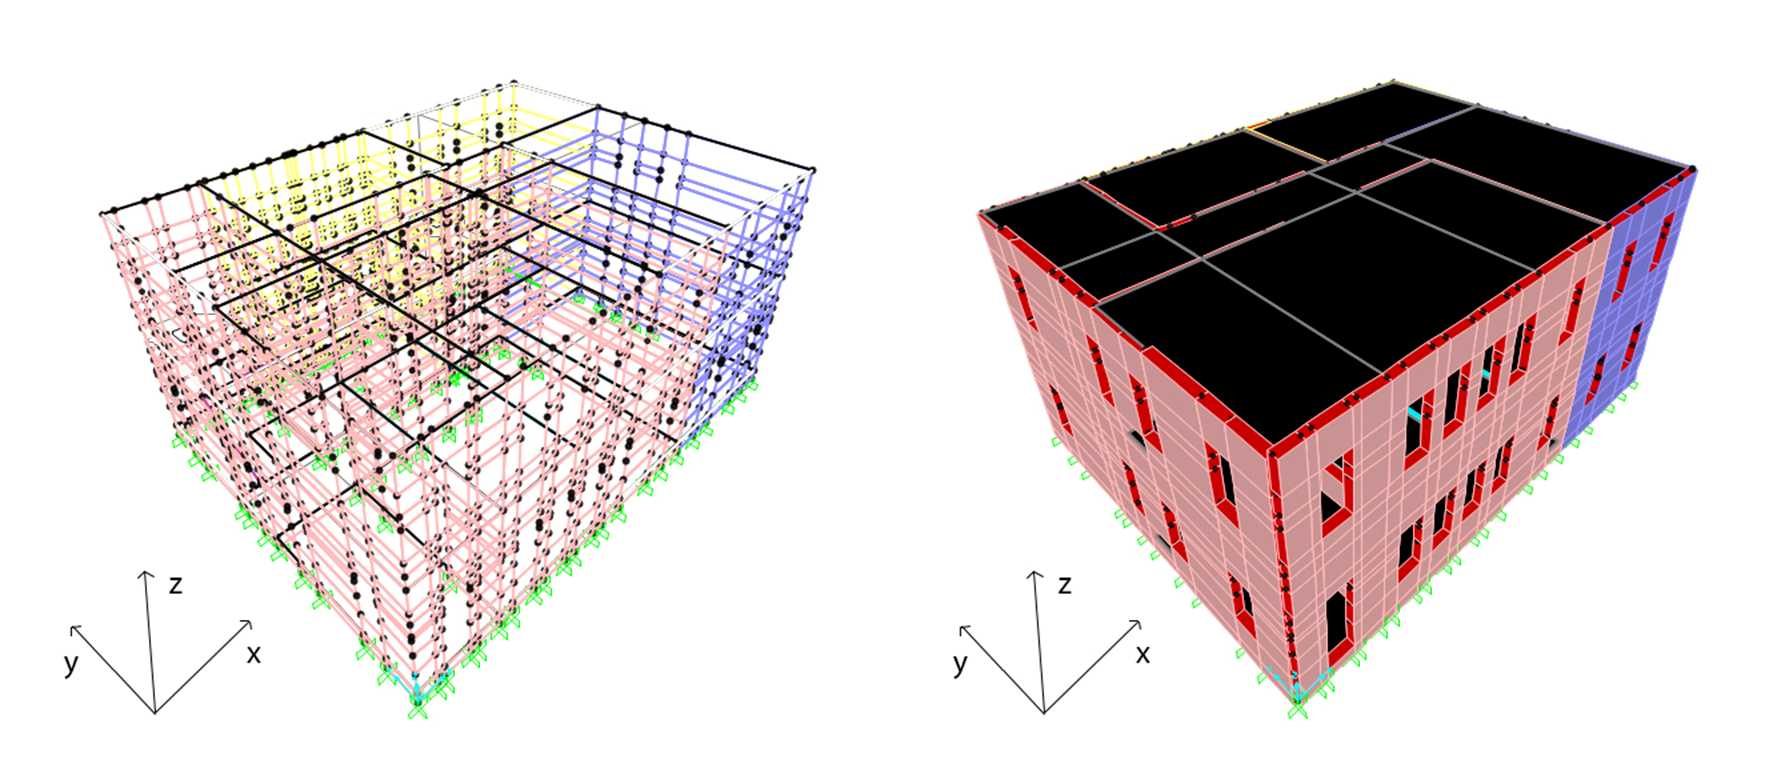
The structure is analyzed by the linear dynamic analysis carried out through the modal analysis to identify the potential failure mechanisms and the spectral analysis to define the maximum displacement values and to locate the most stressed point caused by the seismic action. The finite element calculation software SAP2000 [45] is used to undertake this structural analysis. A 3D model of the school is built in the software, based on the available data regarding the geometry of the structural components and the characteristics of the materials (Figure 6).
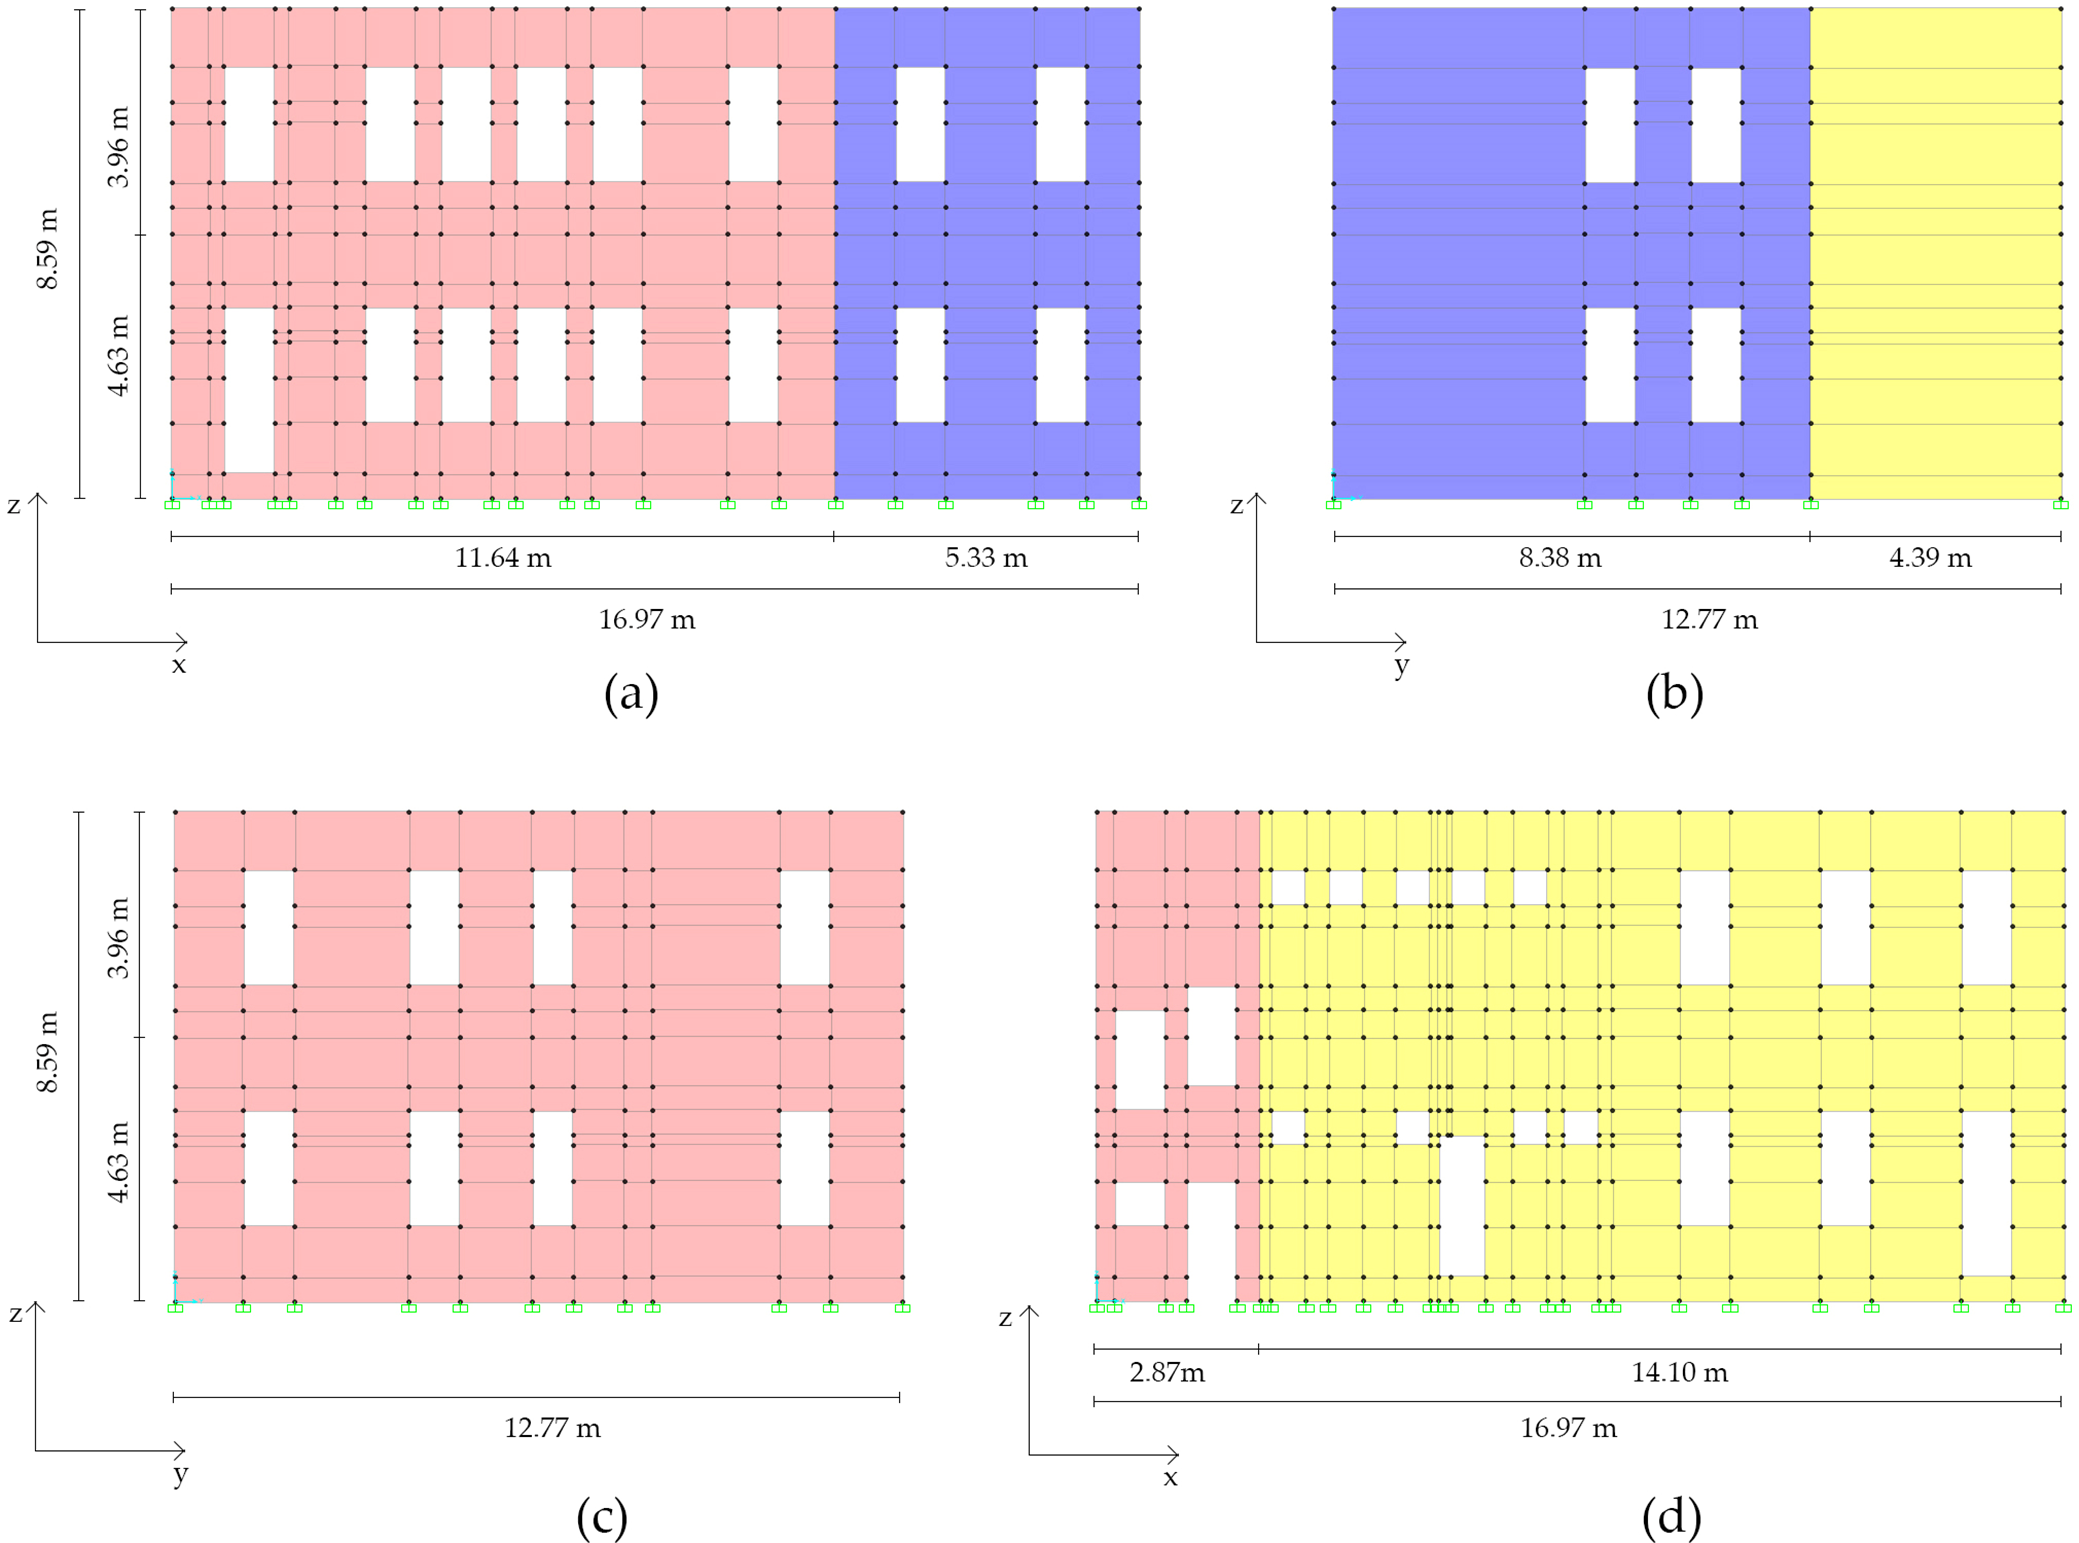
The vertical structural elements are divided into rectangular sub-portions that in the software correspond to two-dimensional shell elements. The shells are connected to each other by nodes in the corners. Three different types of shells are modeled to represents the three masonries of the building, as shown in Figure 7 through the use of different colors. The openings are represented as empty shells. Then, the flooring system is modeled as rigid diaphragms sealed to the masonry with full fixed constraints (black elements in Figure 6). The diaphragms are “thin” elements, without thickness, thus they are subjected only to bending deformations. At the base of the building, the nodes of the shells are tied with rigid constraints, represented in Figure 6 by the green elements, as foundations of the building. Every foundation element is connected to a node blocking its vertical and horizontal translation as well as its rotation. In this way, the whole base of the building is rigid: only the above-ground part is permitted to deform.
The horizontal elements of the model are stressed with the load calculated through the load analysis. The load analysis defines the elementary load conditions of the structure and their combinations, as defined by NTC 2008. These loads are categorized as permanent (G) or variable (Qi) based on the variation of intensity over time.
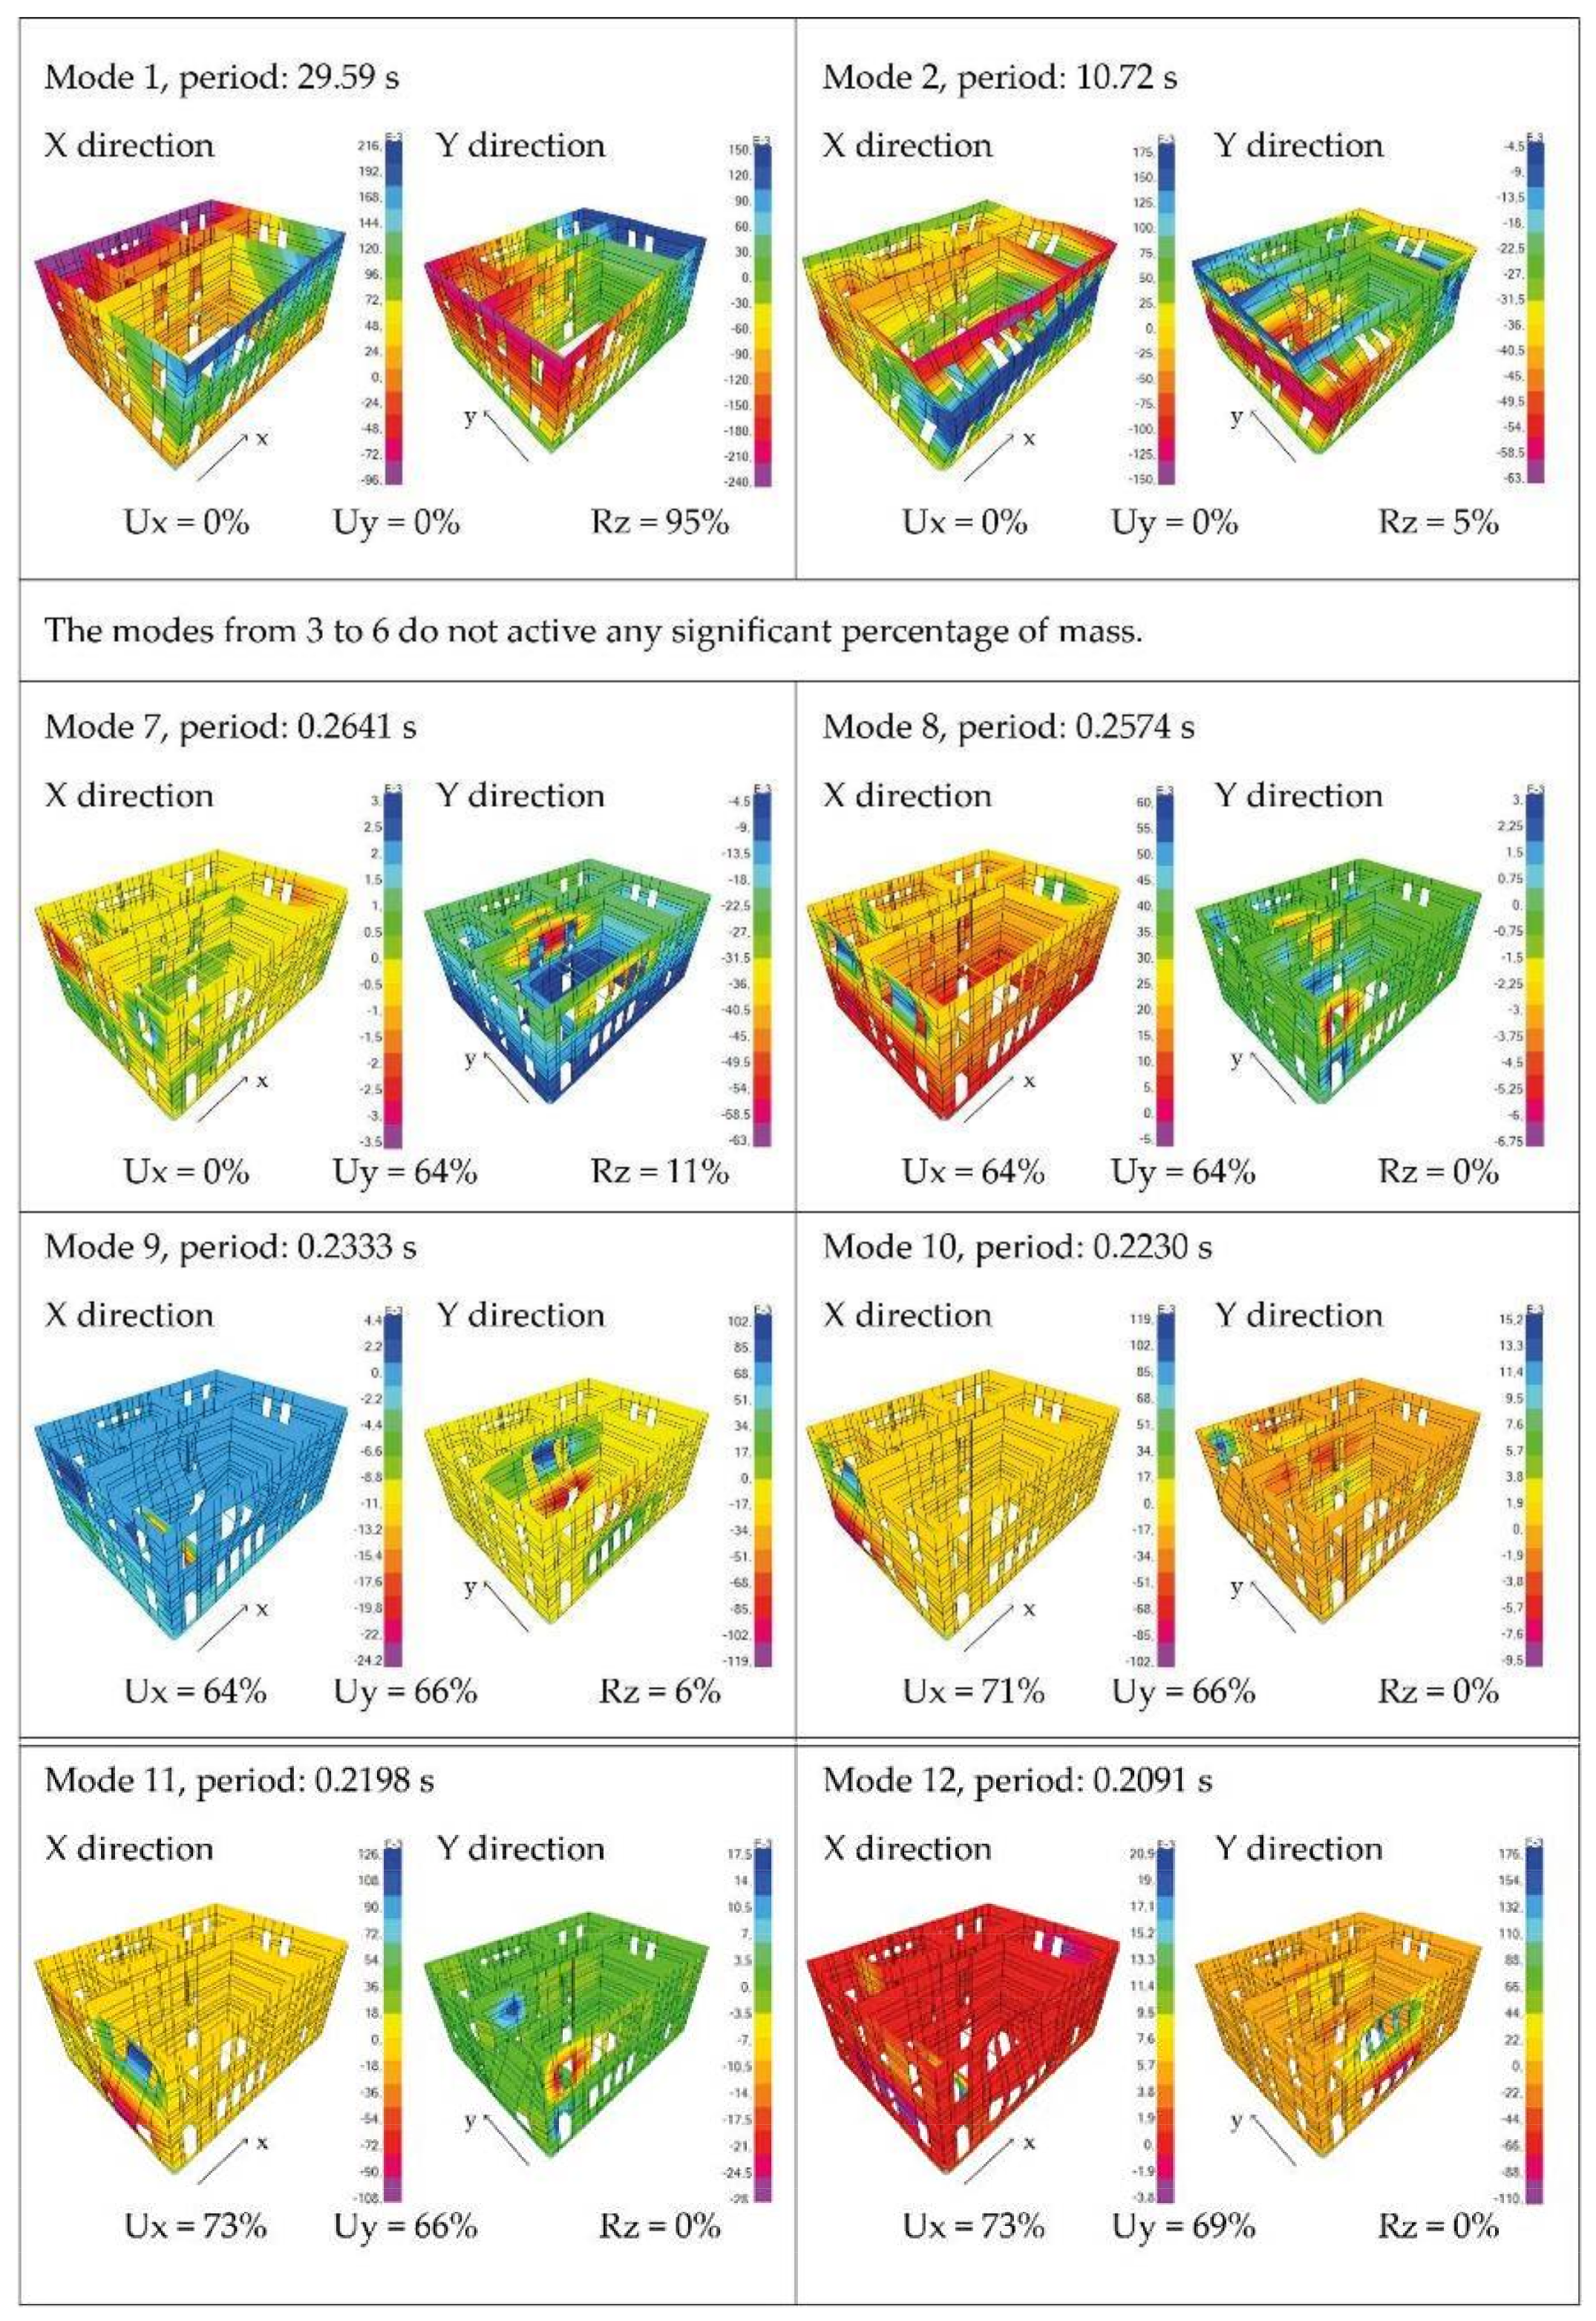
Following the steps of the linear dynamic analysis, the modal analysis is carried out to define the proper vibration modes of the structure. The results of the modal analysis are shown in Figure 8.
Modes 1 and 2 show a torsional behavior of the structure, with a participant mass to the rotation of respectively 95% and 5%. Although the building is symmetrical, the torsion is caused by the asymmetry of the mechanical characteristic of the elements built in different periods. The torsion activates a considerable percentage of mass, even if the frequencies are low. The higher modes until the 7th do not activate a relevant quantity of mass. The 7th mode shows prevalent displacement in the Y direction. The displacement is larger in the oldest portion of the structure. Here, the walls are thinner and not braced because of the absence of internal partitions. The modes from the 8th to the 12th show displacement in both X and Y directions, with an activated mass of 66–72%.
In succession, the seismic analysis is carried out. In the software, the seismic action is applied to the structure as a dynamic load. Two different load cases are defined for the two X and Y directions. The input data for the seismic analysis are the masses of the structure and their barycenter, the proper vibration modes defined by the modal analysis, and the spectral function defined by the acceleration values of the elastic response spectrum. Following the NTC 2008 indications, the acceleration values of the two X and Y directions are associated to scale factors to define the two different load cases, as shown in Equations (2) and (3):
X = Fx + 0.3 Fy
Y = 0.3 Fx + Fy
The Fx and Fy are the seismic component in both directions. For the analysis, the structural factor of 2 and the damping factor of 5% are considered.
The seismic combination in ULS is given, as prescribed by NTC 2008, by Equation (4):
Fd = E + GK + Σ ψ2i Qik
In the equation, G1 and G2 are the dead loads of the structural and non-structural elements respectively; Q is the accidental load; and E is the seismic action. The recommended value of the ψ factor is extracted by Table 2.5.1 of NTC 2008.
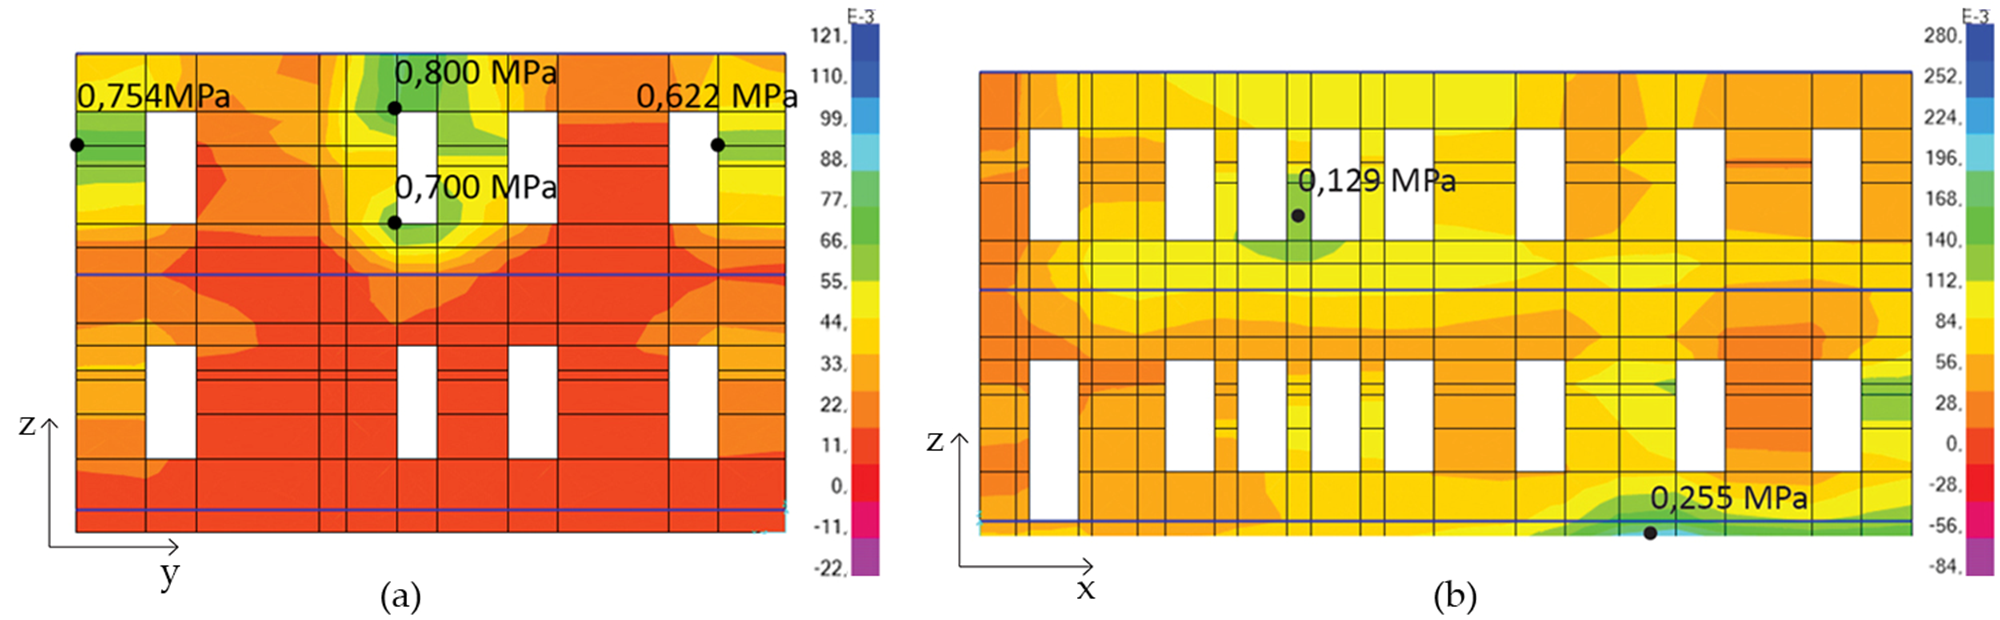
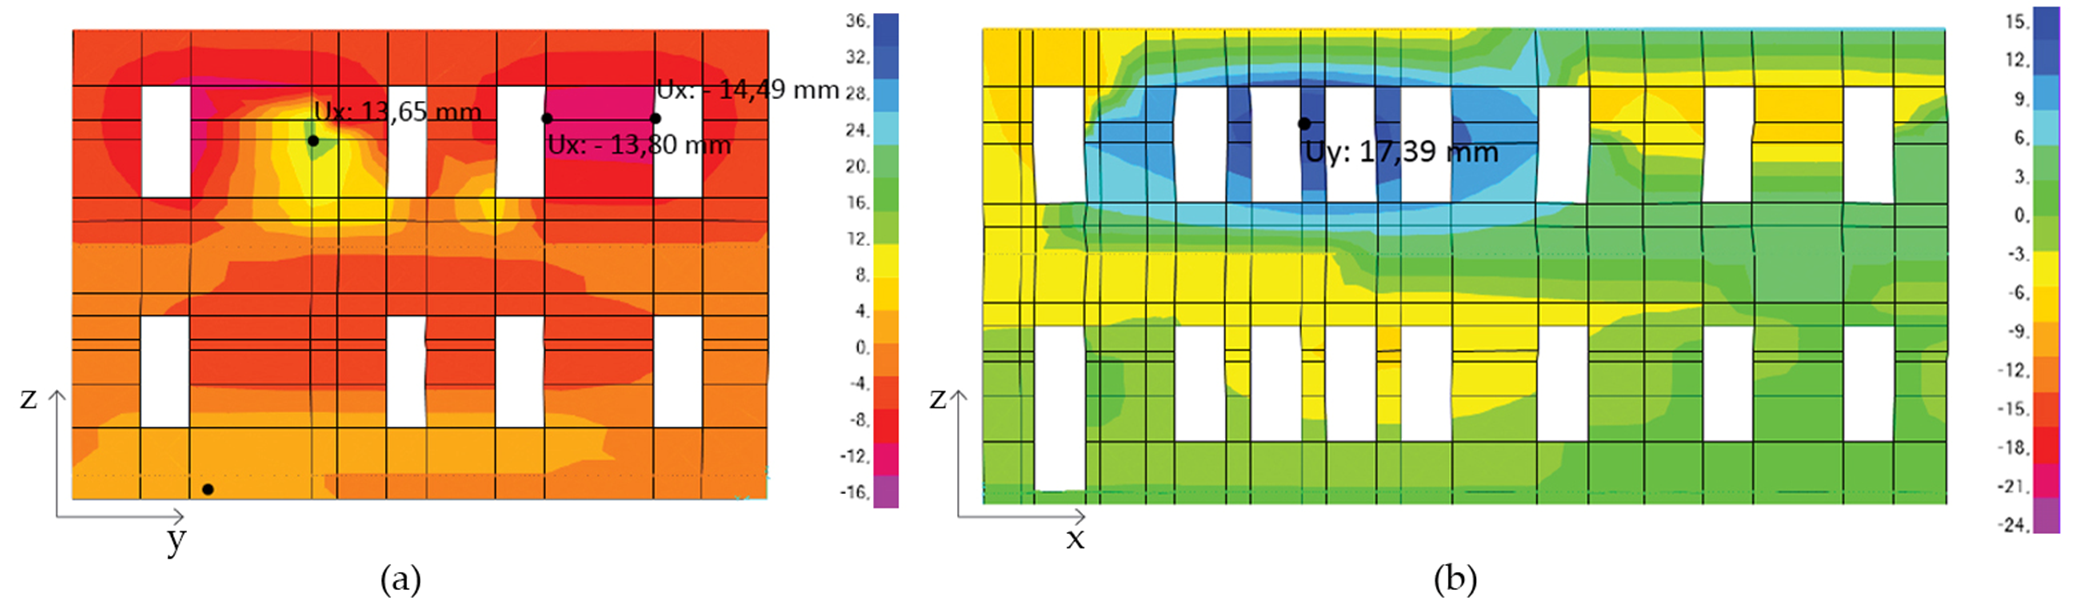
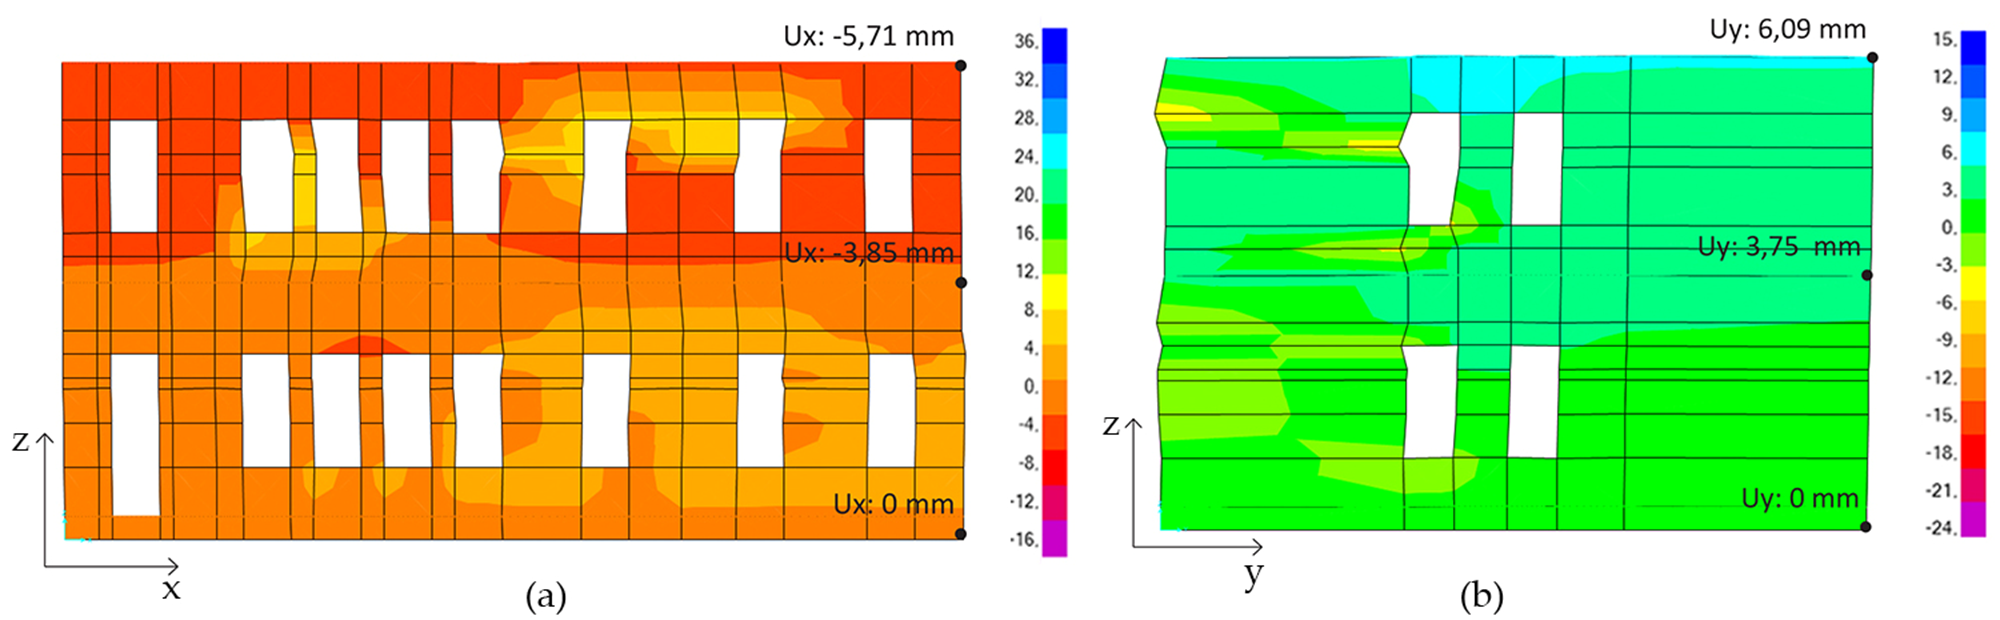
For the two load combinations, the maximum frame displacements (Figure 9), the maximum floor displacements (Figure 10), the intermediate shifts, and the maximum stress (Figure 11) values are defined. These values are then checked following the prescription of NTC 2008 to determine the most vulnerable elements of the building.
Analyzing the results, the element of the structure that is more vulnerable is located on the second floor near the four openings of the south façade. This element is characterized by the maximum values of displacement and stress for the load combination in the Y direction.
To ensure the study is complete, some characteristics of the structure are identified for which a level of uncertainty was found about their mechanical characteristics. The foundation elements and the connection status of the different masonry present no comprehensive information, so different hypothesis of degradation of the elements are defined:
Hypothesis 1.
State of good conditions of the foundation system and a good connection between the different types of masonry;
Hypothesis 2.
State of degradation of foundations and the consequent yielding support of the building on the ground;
Hypothesis 3.
State of degradation of the foundation system as defined in the previous case, assumption of the loss of connection between the different masonry;
Hypothesis 4.
Implementation of energy-retrofit intervention.
In relation to these hypothesis, four different 3D models were built in the software. The linear dynamic analysis, as shown before, is carried out for each them. In this case, only the results of the four analyses are presented (Table 6).
The results of the linear dynamic analysis show the main weakness of the building: the high interpolation movement, the frame movement and the instability of one of the walls on the second floor, which is characterized by significant thinness. In Hypothesis 1, the building has a good response to the seismic action not presenting any particular fragility. The weaknesses are larger in Hypothesis 2. Hypothesis 3 presents slightly better behavior than the second hypothesis because of the loss of connection between the three different types of masonries that cause a better response to seismic action. Hypothesis 4 presents reduced fragilities over Hypotheses 2 and 3 because of the augmented mass of the vertical envelope elements given by the application of the insulating material. For all the hypotheses, the stress values are considered insignificant since those are lower than the minimum value admissible for the compressive strength of a brick wall (fm,min = 2.4 MPa) as prescribed by the instructions for the application of NTC 2008; they will not be examined in the following analyses.
The definition of energy-retrofitting interventions is structured considering the envelope first. Following the methodology proposed in this paper, the interventions on the envelope are defined in this case according to the amount of thermal surfaces of the envelope (Table 7). For each intervention, the percentage of the envelope affected by the retrofit is shown.
The adoption of characteristics for the envelope and heating system considers the benchmarks provided by the Conto Termico 2.0, developed by GSE (Rome, Italy). As previously described, EEM interventions have been combined with the replacement of the three generators and the installation of a photovoltaic system and LED lamps (Table 8).
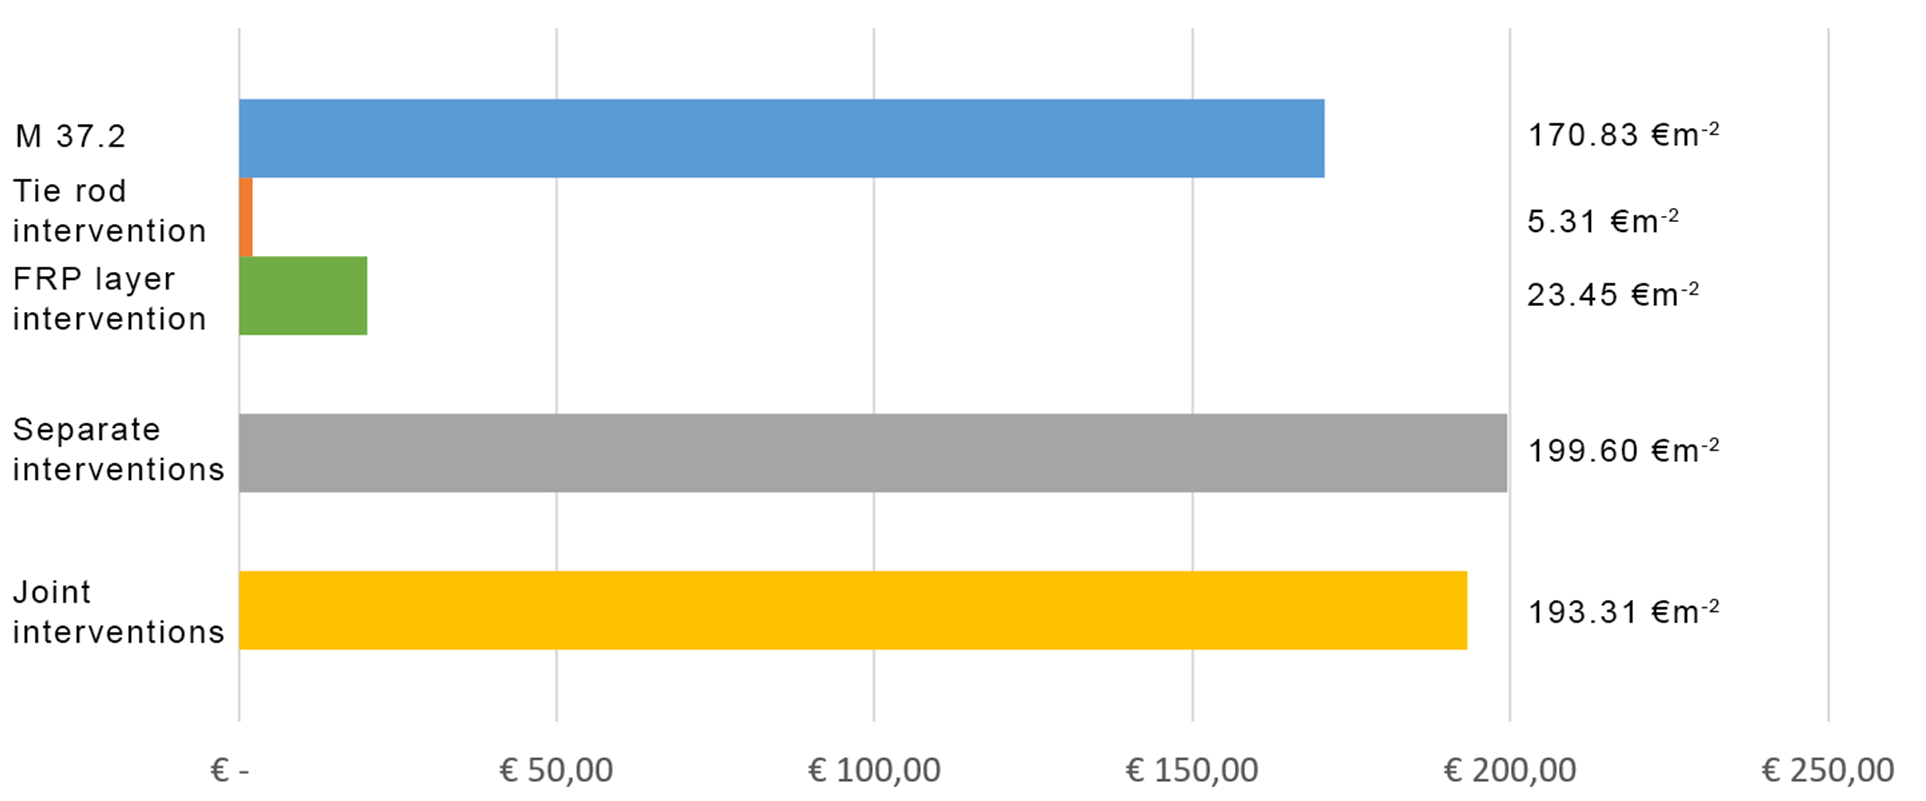
The seismic retrofit consists of four possible interventions (Table 9) and the definition is based on the most vulnerable properties of the building: excessive displacement movements, deformations, and the instability of the sloping wall located on the second floor of the original building structure.
After the analysis of each energy and seismic retrofitting interventions, the assessment for the Manzoni school presents cost-optimal solutions as follow in the next section.

3. Results

With the application of the methodology described in the previous section, three different cost-optimal interventions are presented and it is possible to evaluate the results on energy performance and global costs in comparison to the reference case (Table 10).

3.1. Cost-Optimal Among All the Interventions

The intervention M 21.1, as presented in the description in Table 1, represents the optimal solution among all the interventions (Figure 12). It consists on the realization of the external insulation of mineral wool in the envelope and the installation of a condensing boiler and LED lamps. The outcome results of primary energy use and annualized global cost are, respectively, 57.32 kWh m−2 and 16.30 € m−2 (Table 11).

3.2. Cost-Optimal Among All the Interventions that Achieve the nZEB Targets

According to the nZEB benchmarks, the cost-optimal solution is M 31.2 (Figure 13), including the installation of a biomass boiler and LED lamps, the realization of external insulation, and the installation of a photovoltaic system. The results for M 31.2 show a primary energy use of 10.38 kWh m−2 for years and an annualized global cost of 17.23 € m−2 during the lifecycle (Table 12).

3.3. Cost-Optimal Among All the Interventions with Incentives

The incentive calculation (Table 13) gives evidence of the M 37.2 (Figure 14) as the cost-optimal solution among all the interventions: each envelope element is retrofitted (insulation on external walls, basement, roof, and replacement of windows), a biomass boiler and photovoltaic system are installed and a light system with LED lamps is considered, saving overall energy use and global cost during the lifespan. The measures allow a primary energy use of 4.85 kWh m−2 for a year and an annualized global cost of 9.10 € m−2 during the lifecycle (Table 14).

3.4. Cost-Optimal Among All the Interventions that Achieve the nZEB Targets with Incentives

The same measure of the previous section, M 37.2, complies with the nZEB parameters, resulting as the best proposed solution that allows a primary energy use of 4.85 kWh m−2 per year and an annualized global cost of 9.10 € m−2 during the lifecycle (Figure 15).
In the case study, a single intervention of thermal insulation on the external walls is proposed as the cost-optimal solution, corresponding to the best compromise of energy saving at lower global cost. The conversion to nZEB allows higher energy saving in comparison to the cost-optimal solution (from 53% to 91%), showing a similar annualized global cost; the application of the current national subsidy program allows the global cost to be halved during the 30-year life span (−56%), even if the renovation measures regard all the building elements of the envelope, corresponding to the highest investment cost due to the number of technical elements and intervention areas.

3.5. Seismic Retrofitting Interventions

For the purpose of this study, the evaluation of seismic interventions considers only hypothesis number 4. This hypothesis permits examination of the effects of the combinations of the energy and seismic retrofit. The linear dynamic analysis is carried out for all the interventions described in the previous chapter. The results (Table 15) are expressed as a variation of the values compared to the current situation (Table 6), to show the structural benefits.
All the interventions allow improvement of the structural behavior of the building. The only exception refers to the acceptance criteria of the displacement, related to the load combination in the Y direction; in this case, the interpolation displacement values are referred to the nodes of the north façade, which is not affected by the interventions because it is in a good condition, and the values are the same as in the actual situation. Analyzing the results through a cost–benefit evaluation, the best solutions consider as interventions anchorage with tie rods (n. 2) and reinforcement with fiber-reinforced polymer (FRP) (n. 3). In fact, solution n.1 results in being very expensive and ineffective, and n.4 has the same benefits as n. 3 but with a doubled cost. So, the best solution for the seismic retrofit is the combination of the two interventions n. 2 and n. 3. For this solution, an annualized global cost of 22.48 €·m−2 during the 30-year life span is calculated.

4. Discussion

This paper identifies the interventions to be adopted for the optimal energy and seismic retrofit of the A. Manzoni school in Motta di Livenza. From the energetic point of view, it is convenient to intervene in the envelope by creating an exterior insulation and finishing system, isolating the upper floor and the floor on the ground and replacing the window frames, and on the systems by means of the installation of LED lamps, a photovoltaic system, and the replacement of the existing generator with a biomass boiler.
Regarding the seismic upgrading intervention, it is assumed that the installation of two tie rods to the intrados of the last floor, and the reinforcement of the most vulnerable wall by installing FRP on the outer side of the masonry, will be undertaken.
The costs of intervention for the energy retrofit, and for the seismic renovation have been calculated (Figure 16). For the energy refurbishment of the building, the determined cost of intervention is 170.83 €·m−2, the costs of intervention for the seismic retrofit is 5.31 €·m−2 for the tie rod intervention and 23.45 €·m−2 for the FRP intervention. To perform the interventions in a separate way, the expected cost is 199.60 €·m−2.
Finally, the cost of intervention was calculated in the case of a joint energetic and seismic retrofit renovation, and the expected cost is 193.31 €·m−2. The expected cost is slightly lower than that of separate interventions, thanks to the possibility of reducing site labor and construction costs.
The annualized global costs for the energy retrofit interventions, considering a lifecycle of 30 years, and the intervention costs for the seismic renovation have been calculated. After that, the cost of intervention was assessed in the event that the two redevelopment interventions were carried out jointly.
For the energy retrofit intervention, in the 30-year life span considered, the economic gain is 56%, and the energy saving 96%, compared to maintaining the current situation. For the seismic retrofit intervention, the annualized global costs, always referred to over 30 years, increase by 7% and the primary energy consumption remains unchanged.
Combining the two interventions, we obtain a reduction in the total annualized cost of 3%, thus passing from 56% to 53% of economic gain (the annualized global cost increases from 9.10 €·m−2 to 9.86 €·m−2) with 96% of primary energy saved.
Eventually, the same considerations are made for the other two cost-optimal cases previously examined: with and without transforming the school into a nZEB building, both without considering any kind of subsidies.
Starting from the first energy retrofit identified, M 21.2, the cost for the seismic intervention is added to the annualized global cost. The results show that in this case the annualized global cost changes from 16.30 €·m−2 to 17.45 €·m−2 with 53% of primary energy saved. For the second energy retrofit, M 31.2, that which concerns the nZEB parameters, the annualized global cost changes with the addition of the seismic part from 17.23 €·m−2 to 18.38 €·m−2, and the energy saving, instead, remains 91% (Figure 17).
It can be noted that even in those cases where the use of incentives is not foreseen, it is possible to aim at an economic saving in a 30-year life span even combining the energy and seismic retrofit action. It can be assumed that the realization of an energy refurbishment can also provide the possibility to adapt the building from the seismic point of view, aiming at acceptable periods of return for the investment. Moreover, if a building needs a seismic retrofit it is possible to carry out an energy requalification that makes the investment economically viable, thanks to the reduction of energy consumption and operating costs.
The data collected define the possibility of combining energy and seismic retrofit interventions in an effective and convenient way for investors, also referring to other buildings than the case study.
Considering the Italian building stock, it can be assumed that most of the artefacts still have high energy consumption or are not in compliance with the new seismic standards defined in recent years. It is, therefore, considered reasonable, both in one case or another, to evaluate the hypothesis of a joint intervention that can bring the buildings back to a suitable condition, aiming, in a brief time, for a total economic return on the investment.
In future renovation works, the designer of the building refurbishment should consider joining the retrofit works at the beginning of the project. In particular, the best choice should be retrofitting a single envelope element, from both seismic and energetic aspects, thus reducing the cost of interventions, materials and building-site impacts.
The seismic retrofit intervention that does not generate an economic saving and, therefore, a return on investment can be more economically sustainable if combined with an energy requalification.

5. Conclusions

The paper presents optimal measures of intervention in the cases of both energy and seismic retrofit for a public school building. The study is developed according to the application of the last European Union norm that concerns the achievement of nZEB targets for cost-effective energy-reduction measures, considering also seismic procedures.
The energy cost-optimal measure with subsidies allow an energy saving of 56% and an energy-use reduction of 96% in comparison to the reference situation during the 30-year life span. Analyzing the seismic intervention during the same period, the annualized global cost is calculated with an increase of 7% in comparison to the reference case while the energy consumption is unchanged. With the combination of energy and seismic retrofit, the cost saving is 53% and energy consumption is reduced by about 96%.
The methodology described in this paper points to several results. First of all, a cost-optimal measure for the energy retrofit of the case study could be found in different ways in relation to the conversion to a nZEB scenario and the application of subsidies. Considering these cases, the cost-optimal solution consists of a deeper upgrade with higher energy savings. The methodology could be applied to different building typologies in order to evaluate the different kinds of intervention in relation to the financial and economic availability and feasibility.
The cost-optimal measure for the seismic retrofit is based on the evaluation of several interventions on the building envelope; the paper compared structural benefits and costs for each intervention in order to define the best measure for a global seismic upgrade.
At last the two cost-optimal measures (energy and seismic) were combined. In this case, the results show that the economic saving in 30 years is far lower in respect to an intervention that considers only an energy retrofit. In fact, generally seismic retrofit measures do not create a money saving and a favorable payback time. In this case, the energy saving permits the seismic intervention to be paid back in 12 years (Figure 18).
The global cost of a combined intervention is lower than the costs of two different interventions. A single intervention reduces the period of the works and the consequent troubles for the school activities. When a single retrofit is needed, the possibility of a combined intervention should be analyzed.

Acknowledgments

The authors would like to thank the Municipal Administration of Motta di Livenza (TV), for the availability of documents about the building.

Author Contributions

All authors have seen and approved the manuscript and have contributed significantly for the paper in all phase and section.

Conflicts of Interest

The authors declare no conflict of interest.

Abbreviations

EEMsEnergy-efficiency measures
EPBDEnergy performance of building directive
EUEuropean Union
FEAFinite element analysis
FRPFiber-reinforced polymer
GCGlobal cost
GSEGestore Dei Servizi Energetici
IEA-EBCInternational Energy Agency–Energy In Buildings and Communities Program
MSMember state
NTCNorme Tecniche per le Costruzioni
nZEBNearly zero-energy building
RESRenewable energy source
SLSServiceability limit states
TEPTonne of oil equivalent
TVTreviso province
ULSUltimate limit states
VNNominal life
VRReference period

References

  1. European Union. Directive 2010/31/EU of the European Parliament and of the Council on the Energy Performance of Buildings (EPBD Recast). 19 May 2010. Available online: https://eur-lex.europa.eu/legalcontent/EN/TXT/?uri=celex%3A32010L0031 (accessed on 10 October 2017).
  2. European Union. Directive 2002/91/EC of the European Parliament and of the Council on the Energy Performance of Buildings (EPDB). 16 December 2002. Available online: https://eur-lex.europa.eu/legalcontent /EN/TXT-/?uri=celex%3A32002L0091 (accessed on 10 October 2017).
  3. Eurostat. Final Energy Consumption by Sector. 2014. Available online: http://ec.europa.eu/eurostat/web/products-datasets/-/tsdpc320 (accessed on 10 October 2017).
  4. JRC Science and Policy Report, Energy Renovation: The Trump Card for the New Start for Europe. 2015. Available online: http://publications.jrc.ec.europa.eu/repository/bitstream/JRC92284/eur26888_buildingreport_online_2015-03-25.pdf (accessed on 10 October 2017).
  5. CRESME. Guida per Il Contenimento del Consumo Energetico Nelle Scuole; ENEA-Fire: Rome, Italy, 2011. [Google Scholar]
  6. De Santoli, L.; Fraticelli, F.; Fornari, F.; Calice, C. Energy performance assessment and retrofit strategies in public school buildings in Rome. Energy Build. 2014, 68, 196–202. [Google Scholar] [CrossRef]
  7. School of the Future. Available online: http://www.school-of-the-future.eu/ (accessed on 10 October 2017).
  8. VERYSchool. Available online: http://www.veryschool.eu/ (accessed on 10 October 2017).
  9. ENTRANZE Project. Available online: http://www.entranze.eu/ (accessed on 10 October 2017).
  10. Renew School. Available online: https://www.renew-school.eu/ (accessed on 10 October 2017).
  11. ZEMeds. Available online: http://www.zemeds.eu/ (accessed on 10 October 2017).
  12. Gaitani, N.; Cases, L.; Mastrapostoli, E.; Eliopoulou, E. Paving the way to nearly zero energy schools in Mediterranean region-ZEMedS project. Energy Procedia 2015, 78, 3348–3353. [Google Scholar] [CrossRef]
  13. D’Agostino, N.; Mantenuto, S.; D’Anastasio, E.; Avallone, A.; Barchi, M.; Collettini, C.; Radicioni, F.; Stoppini, A.; Fastellini, G. Contemporary crustal extension in the Umbria–Marche Apennines from regional CGPS networks and comparison between geodetic and seismic deformation. Tectonophysics 2009, 476, 3–12. [Google Scholar] [CrossRef]
  14. Michele, M.; Di Stefano, R.; Chiaraluce, L.; Cattaneo, M.; De Gori, P.; Monachesi, G.; Latorre, D.; Marzorati, S.; Valoroso, L.; Ladina, C.; et al. The Amatrice 2016 seismic sequence: A preliminary look the mainshock and aftershocks distribution. Ann. Geophys. 2016, 59. [Google Scholar] [CrossRef]
  15. Ministry of Infrastructures and Transports. Ministerial Decree “Norme Tecniche per le Costruzioni”, 14 January 2008. Gazzetta Ufficiale n. 29, 4 February 2008. Available online: http://www.gazzettaufficiale.it/eli/id/2017/04 /4/17G00055/sg (accessed on 10 October 2017).
  16. Ministry of Infrastructures and Transports. Ministerial Circular n. 617 “Istruzioni per l’Applicazione delle Nuove Norme Tecniche per le Costruzioni”, 2 February 2008. Gazzetta Ufficiale n. 47, 26 February 2008. Available online: http://cslp.mit.gov.it/-index.php?option=com_content&task=view&id=79&Itemid=1 (accessed on 10 October 2017).
  17. Cecchi, R.; Calvi, M. Guidelines for Evaluation and Mitigation of Seismic Risk to Cultural Heritage with Reference to Technical Standard for Construction; Gangemi, G., Ed.; Ministry for Cultural Heritage and Activities, Department of Civil Protection Agency: Rome, Italy, 2010. (In Italian) [Google Scholar]
  18. Priestley, M.J.N.; Seible, F. Design of seismic retrofit measures for concrete and masonry structures. Constr. Build. Mater. 1995, 9, 365–377. [Google Scholar] [CrossRef]
  19. Shrive, N.G. The use of fibre reinforced polymers to improve seismic resistance of masonry. Constr. Build. Mater. 2006, 20, 269–277. [Google Scholar] [CrossRef]
  20. Lourenço, P.; Poças Martins, J.P. Strengthening of the Architectural Heritage with Composite Materials. In Proceedings of the 1st International Conference on Composites in Construction—CCC2001, Porto, Portugal, 10–12 October 2001. [Google Scholar]
  21. Burdette, J.Q.; Hamid, A.A.; Larralde, J. Development of plastic-reinforced wall ties. Masonry Soc. J. 1996, 4, 37–44. [Google Scholar]
  22. Sayed-Ahmed, E.Y.; Lissel, S.L.; Tadros, G.N.G. ShriveCarbon fibre reinforced polymers (CFRP) post-tensioned masonry diaphragm walls: Prestressing, behaviour and design recommendations. Can. J. Civ. Eng. 1999, 26, 324–344. [Google Scholar] [CrossRef]
  23. Nanni, J.G. Tumialan, Fibre-reinforced composites for the strengthening of masonry structures. Struct. Eng. Int. IABSE 2003, 13, 271–278. [Google Scholar] [CrossRef]
  24. Chopra, A.K. Dynamics of Structures, 3rd ed.; Pearson Prentice Hall: Upper Saddle River, NJ, USA, 2007. [Google Scholar]
  25. Fajfar, P. Approximate Methods for Nonlinear Seismic Analysis of Building Structures. In Proceedings of the 2rd International Conference on Seismology and Earthquake Engineering, Lisboa, Portugal, 21–25 June 1999; Seco e Pinto, P., Ed.; IISEE: Ibaraki, Japan, 1999; pp. 649–658. [Google Scholar]
  26. Tso, W.K.; Moghadam, A.S. Pushover procedure for seismic analysis of buildings. Prog. Struct. Eng. Mater. 1998, 1, 337–344. [Google Scholar] [CrossRef]
  27. European Committee for Standardization, CEN. EN 15459, Energy Performance of Buildings. Economic Evaluation Procedure for Energy Systems in Buildings; European Committee for Standardization: Brussels, Belgium, 2007. [Google Scholar]
  28. Ente Italiano di Normazione, UNI. UNI/TS 11300-3, Energy Performance of Buildings; Ente Italiano di Normazione: Milano, Italy, 2010. [Google Scholar]
  29. European Parliament. Commission Delegated Regulation (EU) No 244/2012 of 16/01/2012 Supplementing Directive 2010/31/EU of the European/Parliament and of the Council on the Energy Performance of Buildings by Establishing a Comparative Methodology Framework for Calculating Cost-Optimal Levels of Minimum Energy Performance Requirements for Buildings and Building Elements. Off. J. Eur. Union 2012, 55. Available online: http://eur-lex.europa.eu/legal-content/EN/ALL/?uri=CELEX:32012R0244 (accessed on 10 October 2017).
  30. European Parliament. Guidelines Accompanying Commission Delegated Regulation (EU) No 244/2012 of 16 January 2012 supplementing Directive 2010/31/EU of the European Parliament and of the Council on the energy performance of buildings by establishing a comparative methodology framework for calculating cost-optimal levels of minimum energy performance requirements for buildings and building elements. Off. J. Eur. Union 2012, 55. Available online: https://eur-lex.europa.eu/legal-content/EN/ALL /?uri=CELEX%3A52012XC0419%2802%29 (accessed on 10 October 2017).
  31. Ott, W.; Bolliger, R.; Ritter, V.; Citherlet, S.; Favre, D.; Perriset, B.; Almeida, M.; Ferreira, M. Methodology for Cost-Effective Energy and Carbon Emissions Optimization in Building Renovation (Annex 56)—Methodology and Assessment of Renovation Measures by Parametric Calculations; EBCP—IEA, University of Minho: Guimarães, Portugal, 2014. [Google Scholar]
  32. EBC Energy in Buildings and Communities Programme, International Energy Agency. Annex 56. Cost Effective Energy and Carbon Emissions Optimization in Building Renovation. Available online: http://www.iea-annex56.org/ (accessed on 10 October 2017).
  33. Ministry of Economic Development. Decree “Aggiornamento Conto Termico”, 16 February 2016. Gazzetta Ufficiale n. 51, 2 March 2016. Available online: http://www.gse.it/it/Conto%20Termico/Conto%20Termico%202.0/-Pagine/default.aspx (accessed on 10 October 2017).
  34. Ministry of Economic Development. Annex I-II “Conto Termico 2,0”, 16 February 2016. Gazzetta Ufficiale n. 51, 2 March 2016. Available online: https://www.gse.it/documenti_site/documenti%20gse/servizi%20per%20te/conto%20termico/normativa/allegato%20decreto%20interministeriale%2016%20febbraio%202016.pdf (accessed on 10 October 2017).
  35. U.S. Department of Energy, DOE. EnergyPlus Documentation—Getting Started; U.S. Department of Energy: Washington, DC, USA, 2017. Available online: https://energyplus.net/ (accessed on 10 October 2017).
  36. Design Builder Software Ltd. DesignBuilder SBEM v5.0.3 Manual (SBEM v5.3a); Design Builder Software Ltd: Gloucester, UK, 2016; Available online: https://www.designbuilder.co.uk/download/documents (accessed on 10 October 2017).
  37. Ente Italiano di Normazione, UNI. UNI/TS 11300-1, Energy Performance of Buildings; Ente Italiano di Normazione: Milano, Italy, 2014. [Google Scholar]
  38. European Committee for Standardization, CEN. EN 15316-4-1, Heating Systems in Buildings—Method for Calculation of System Energy Requirements and System Efficiencies; European Committee for Standardization: Brussels, Belgium, 2008. [Google Scholar]
  39. European Committee for Standardization, CEN. EN 15243, Ventilation for Buildings—Calculation of Room Temperatures and of Load and Energy for Buildings with Room Conditioning Systems; European Committee for Standardization: Brussels, Belgium, 2007. [Google Scholar]
  40. Ministry of Economic Development. Decree “Applicazione Delle Metodologie di Calcolo delle Prestazioni Energetiche e Definizione delle Prescrizioni e dei Requisiti Minimi Degli Edifici”, 26 June 2015. Gazzetta Ufficiale n. 162, 15 July 2015. Available online: http://www.gazzettaufficiale.it/ eli/id/2013/08/03/ 13A06688/sg (accessed on 10 October 2017).
  41. Buildings Performance Institute Europe, BPIE. Cost Optimality—Discussing Methodology and Challenges within the Recast Energy Performance of Buildings Directive; BPIE: Brussels, Belgium, 2010. [Google Scholar]
  42. President of Italian Republic. Decree n. 63/13 “Disposizioni Urgenti per il Recepimento della Direttiva 2010/31/UE”, 4 June 2013. Gazzetta Ufficiale n. 130, 5 June 2013. Available online: http://www.gazzettaufficiale.it/eli/id/2013/08/03/13A06688/sg (accessed on 10 October 2017).
  43. President of Italian Republic. Decree n. 28/11 “Attuazione della Direttiva 2009/28/CE sulla Promozione dell’Uso dell’Energia da Fonti Rinnovabili, Recante Modifica e Successiva Abrogazione delle Direttive 2001/77/CE e 2003/30/CE”, 3 March 2011. Gazzetta Ufficiale n. 71, 29 March 2011. 2011. Available online: http://www.gazzettaufficiale.it-/eli/id/2011/03/28/011G0067/sg (accessed on 10 October 2017).
  44. Bisetto, M.; (Motta di Livenza, Treviso, Italy). Verifica Statica dei Solai, Comprensiva di Indagine Diagnostica delle Strutture Orizzontali della Scuola Primaria A. Manzoni di S. Giovanni. Personal comunications, 2016. [Google Scholar]
  45. Computer and Structures Inc., CSI. Analysis Reference Manual SAP2000. Structural Software for Analysis and Design; Computer and Structures Inc.: Berkeley, USA, 2016; Available online: http://docs.csiamerica.com/manuals/etabs/Analysis% 20Reference.pdf (accessed on 10 October 2017).
Figure 1. Flow chart showing the adopted methodology for the study.
Sustainability 10 00969 g001
Figure 2. “Anyway renovation” vs. “Energy-related renovation” in the case of an anyway necessary building renovation due to functional reasons or building elements at the end of their service life, as defined by the International Energy Agency–Energy in Buildings and Communities Programme (IEA–EBC) Annex 56 Program.
Sustainability 10 00969 g002
Figure 3. Global cost (GC) curve after renovation with energy-efficiency measures (EEMs) in comparison with reference situation; Identification of nearly zero-energy building (nZEB) solutions (red area) in sensitivity analysis of global cost and primary energy consumption. The graph shows the global cost curve after renovation (yearly costs for energy, operation and maintenance): the curve starts from the reference situation A (anyway renovation). Point O represents the cost-optimal renovation option and point N represents the cost-neutral renovation option with the highest reduction of primary energy.
Sustainability 10 00969 g003
Figure 4. The design response spectra for ultimate limit states (ULS) along the horizontal and vertical components. The spectrum is defined related to the site and the characteristics of the case study in Motta di Livenza. Sd(g) is equal to the design seismic acceleration, while T (s) is the vibration period.
Sustainability 10 00969 g004
Figure 5. Front and back view of the A. Manzoni school.
Sustainability 10 00969 g005
Figure 6. Finite element 3D model of the A. Manzoni school in the software SAP 2000; (a) wireframe view; (b) solid view.
Sustainability 10 00969 g006
Figure 7. View of the model façades in the software SAP2000: (a) south façade; (b) west façade; (c) east façade; (d) north façade. The different colors represent the different kind of masonries: brick wall with 2 heads in pink, double brick wall according to the UNI specifications in yellow, and alveolar block wall in blue.
Sustainability 10 00969 g007
Figure 8. Results obtained by the modal analysis, for the most significant modes. Ux are the masses participating in the X direction. Uy are the masses participating in the Y direction. Rz are the masses participating in the rotation around the Z axis. The color scale shows the zone of greater reaction, and its values are expressed in mm.
Sustainability 10 00969 g008
Figure 9. The maximum frame displacements for the load combination in the X direction (a) and in the Y direction (b). The displacement values are defined by referring to the quiet state of the structure.
Sustainability 10 00969 g009
Figure 10. The maximum floor displacements for the load combination in the X direction (a) and in the Y direction (b). The maximum interpolation displacements are calculated through the difference between the floor displacements.
Sustainability 10 00969 g010
Figure 11. The maximum stress values for the load combination in the X direction (a) and in the Y direction (b).
Sustainability 10 00969 g011
Figure 12. Cost-optimal solutions concerning primary energy consumption and global cost for the proposed EEMs, among all the interventions.
Sustainability 10 00969 g012
Figure 13. Cost-optimal solutions concerning primary energy consumption and global cost for the proposed EEMs, among the interventions that achieve the nZEB targets.
Sustainability 10 00969 g013
Figure 14. Cost-optimal solutions concerning primary energy consumption and global cost for the proposed EEMs applying incentives calculation.
Sustainability 10 00969 g014
Figure 15. Cost-optimal solutions concerning primary energy consumption and global cost for the proposed EEMs applying the incentives calculation, among all the interventions that achieve the nZEB targets with incentives.
Sustainability 10 00969 g015
Figure 16. Cost of interventions graph. The blue bar represents the cost for the energy retrofit M 37.2; the orange bar is the cost for the seismic retrofit (tie rod); the green bar represents the cost for the seismic retrofit (one FRP layer); the grey bar is the cost for three separated interventions (M 37.2, tie rod, FRP layer); and the yellow bar represents the cost for three joint interventions (M 37.2 + tie rod + FRP layer).
Sustainability 10 00969 g016
Figure 17. Cost-optimal and nZEB solutions compared with the reference case.
Sustainability 10 00969 g017
Figure 18. Return time graph for the investment cost of the energy and seismic retrofit. As prescribed in the Conto Termico 2.0, the subsidies are calculated to be provided during the first 6 years. Red line represents the payback flow M 37.2 investment cost in respect to the blue line of the Reference case.
Sustainability 10 00969 g018
Table 1. List of energy retrofit interventions and their organization on different combined measures.
Measure CodeEnvelope InterventionsMeasure CodeSystem InterventionMeasure CodeThermal Generator Substitution
M 1First technological component (higher percentage incidence of thermal surface)M 11 to M 20Photovoltaic (PV) system installationM 1.1 to M 40.1Installation of condensing boiler
M 2Second technological component
M 3Third technological component
M 4Last technological componentM 21 to M 30Light-emitting diode (LED) installationM 1.2 to M 40.2Installation of biomass boiler
M 5M1 + M2
M 6M1 + M2 + M3
M 7M1 + M2 + M3 + M4
M 8M4 + M3M 31 to M 40PV + LEDM 1.3 to M 40.3Installation of electrical heat pump
M 9M4 + M3 + M2
M 10M4 + M1
Table 2. Incentives regulation for small-scale energy-retrofit interventions.
Intervention TypologySubsidies Related to Investment (%)Maximum Investment (€·m−2)Maximum Subsidy (€)
I-Horizontal opaque structures:
roof insulation from outside
55%200.00
II-Horizontal opaque structures:
flooring insulation from inside
55%100.00(I + II + III) ≤ 400,000.00
III-Vertical opaque structures:
wall insulation from outside
55%100.00
Windows substitution with installation of thermoregulation systems55%450.00100,000.00
Substitution of existing lamps with LED lamps40%35.0070,000.00
Building modification in nZEB building65%500.001,750,000.00
Condensing boiler installation55%160.003000.00
Electrical heat pump installationTo be determined with the formula:
Ia tot = Ei × Ci
Biomass boiler installationTo be determined with the formula:
Ia tot = Pn × hr × Ci × Ce
Table 3. Parameters used to define the elastic response spectrum of the case study of this work: TR represents the period return; Ag is the maximum horizontal acceleration; F0 is the horizontal acceleration spectrum amplification coefficient; and TC* represents the period of the stroke at constant speed of the horizontal components.
Limit StateTR (Year)Ag (g)F0TC* (s)
SLSs7120.1462.5310.366
ULSs14620.1862.6020.377
Table 4. Area, thermal transmittance, thermal dispersion and percentage distribution of the envelope elements % by surface and % by thermal losses.
ElementArea (m2)Thermal Transmittance (W·m−2·K−1)Thermal Dispersion (W·K−1)% By Surface% By Thermal Losses
Brick wall with 2 heads213.791.76376.2722%26%
Double brick wall UNI143.340.90129.0015%9%
Alveolar block wall107.170.9095.4512%6%
Total wall464.30-601.7249%40%
Windows68.303.19217.887%15%
Roof207.691.75363.4622%25%
Basement207.691.93288.6922%20%
Total947.98-1471.75100%100%
Table 5. Mechanical characteristics of the structural elements: d represents the thickness of the element; γ the specific weight; E the elastic module; and G1, G2 and Qk the permanent and variable loads.
Construction YearDescriptionMechanical Characteristics
1930Brick wall with 2 headsd = 0.29 mγ = 18.00 kN·m−3E = 2227 Nm·m−1
Concrete slabG1 = 3.00 kN·m−2G2 = 1.25 kN·m−2Qk = 3.00 kN·m−2
1960Double brick wall UNId = 0.29 mγ = 12.00 kN·m−3E = 3600 Nm·m−1
Concrete and masonry flooring systemG1 = 2.95 kN·m−2G2 = 1.50 kN·m−2Qk = 3.00 kN·m−2
1970Alveolar block walld = 0.29 mγ = 15.00 kN·m−3E = 3500 Nm·m−1
Concrete and masonry flooring systemG1 = 1.30 kN·m−2G2 = 3.40 kN·m−2Qk = 1.20 kN·m−2
Table 6. Results of the linear dynamic analysis of the different cases.
HypothesisT1Maximum Interpolation Displacement (mm)Interpolation Displacement Test 1Maximum Frame Displacement (mm)Maximum Stress (MPa)
129.593.85Verified17.390.80
238.7716.07Not Verified23.690.44
338.7715.98Not Verified23.690.44
433.9419.67Not Verified23.010.44
1 The admissible interpolation displacement is calculated through the formula Δx max = 0.003 h floor, as prescribed by NTC 2008. For the case study, the admissible interpolation displacement values for the ground and first floors are 11.88 mm and 12.63 mm.
Table 7. Definition of EEMs for energy retrofitting on building envelope.
Intervention CodeDescriptionPercentage of Envelope Considered for the Intervention
M 1External wall49%
M 2Roof22%
M 3Basement22%
M 4Windows7%
M 5M 1 + M 271%
M 6M 1 + M 2 + M 393%
M 7M 1 + M 2 + M 3 + M 4100%
M 8M 4 + M 229%
M 9M 4 + M 2 + M 351%
M 10M 4 + M 156%
Table 8. Description of proposed EEMs for the case study, with the characteristics for the envelope and heating system after the intervention according to what is prescribed by the Conto Termico 2.0.
InterventionDescriptionCurrent State ValueAfter Intervention
External wallExternal insulation of the wall of mineral wool 14 cmU = 1.76 W·m−2·K−1
U = 0.90 W·m−2·K−1
U = 0.22 W·m−2·K−1
U = 0.22 W·m−2·K−1
RoofExternal insulation of the second slab of mineral wool 16 cmU = 1.75 W·m−2·K−1U = 0.21 W·m−2·K−1
BasementInsertion of insulating layer of mineral wool 14 cm below the floor levelU = 1.93 W·m−2·K−1U = 0.20 W·m−2·K−1
WindowsInstallation of double glazing with argon cavity and low-emissivity coating, polyvinyl chloride (PVC) frame with thermal breakU = 3.19 W·m−2·K−1U = 1.21 W·m−2·K−1
Heating systemCondensing boiler with buffer storage tankη = 0.62η = 0.98
Biomass boilerη = 0.92
Electric water-heating pumpCOP = 3.9
Lighting systemLighting substitution with 16 W LED lampsUse = 7.05 kWh·m−2Use = 3.13 kWh·m−2
RES productionInstallation of photovoltaic panels with 2.4 kW peak power-Prod. = 1828 kWh·y−1
Table 9. Definition of the proposed seismic retrofit strategies of interventions for the case study.
CodeInterventionDescriptionCharacteristic
1Roof reliefReplacing the existing soleplates with new elements composed of armored plates in autoclaved aerated concreteOwn weight= 1.44 kN/m2, Thermal transmittance = 0.67 W m−2 K−1
2Anchorage with tie rodsInserting a tie system to prevent the most vulnerable wall collapse mechanismsBar type: FeB32K, Tie diameter: 20 mm, Plate type: FeB32K, Plate dimension: 0.5 × 0.5 × 0.5 m, Installation height: 8.5 m
3Reinforcement with fiber-reinforced polymer (FRP)Stiffening of the slim wall at the openings with FRP bands with bonded carbon fibers in perfect adherence to the masonryTensile modulus= 240–640 MPa, Tensile strength= 4200–4800 MPa
4Reinforcement with double layer of FRPStiffening of slim wall with double layer of FRP bandsTensile modulus = 240–640 MPa, Tensile strength = 4200–4800 MPa
Table 10. Energy use and cost for the business-as-usual building.
Heating Primary Energy UseTotal Primary Energy UseInvestment CostAnnualized Global Cost
Reference50.66 kWh m−2121.93 kWh m−2200.42 € m−221.00 € m−2
Table 11. Energy use and cost for the identified cost-optimal measure.
MeasureHeating Primary Energy UseTotal Primary Energy UseInvestment CostAnnualized Global Cost
M 21.150.66 kWh m−257.32 kWh m−2200.42 € m−216.30 € m−2
Table 12. Energy use and cost for the identified cost-optimal measure.
MeasureHeating Primary Energy UseTotal Primary Energy UseInvestment CostAnnualized Global Cost
M 31.210.27 kWh m−210.38 kWh m−2247.57 € m−217.23 € m−2
Table 13. Intervention price and incentive amount for every foreseen renovation action.
Intervention TypologyIntervention Price (€)Subsidies Related to Investment (%)Subsidies (€)Maximum Subsidy (€)
I-Horizontal opaque structures:
roof insulation from outside
41,146.0655%22,630.33
II-Horizontal opaque structures:
flooring insulation from inside
24,669.2555%13,568.09(I + II + III) ≤ 400,000.00
III-Vertical opaque structures:
wall insulation from outside
24,892.2655%13,690.74
Window substitution with installation of thermoregulation systems44,754.0055%24,614.70100,000.00
Substitution of existing lamps with LED lamps919.2540%367.7070,000.00
Building modification in nZEB building 65% 1,750,000.00
Condensing boiler installation9870.5655%5428.813000.00
Electrical heat pump installation39,274.63-25,528.51-
Biomass boiler installation23,001.58-14,951.03-
Table 14. Energy use and cost for the identified cost-optimal measure.
MeasureHeating Primary Energy UseTotal Primary Energy UseInvestment CostAnnualized Global Cost
M 37.24.74 kWh m−24.85 kWh m−2139.74 € m−29.10 € m−2
Table 15. Results of the seismic analyses of the proposed interventions for hypothesis no. 4. The results are expressed in terms of variation from the values of the current situation. 1−2: values referred to the load combinations in the X and Y directions.
InterventionInterpolation Displacement Value VariationInterpolation Displacement Test (Dir. X 1)Interpolation Displacement Test (Dir. Y 2)Maximum Frame Displacement Value VariationInvestment Cost
1. Roof relief−0.08 mmVerifiedNot verified−0.15 mm70,464.80 €
2. Anchorage with tie rods−0.00 mmVerifiedNot verified−33.62 mm2205.58 €
3. Reinforcement with FRP−0.43 mmVerifiedNot verified−2.42 mm9741.54 €
4. Reinforcement with double layer of FRP−0.37 mmVerifiedNot verified−2.44 mm14,547.66 €

