Moving to a Low-Carbon Economy in China: Decoupling and Decomposition Analysis of Emission and Economy from a Sector Perspective

1
School of Economic and Management, China University of Petroleum (East China), Qingdao 266580, China
2
School of Management & Economics, Beijing Institute of Technology, Haidian District, Beijing 100081, China
*
Author to whom correspondence should be addressed.
Sustainability 2018, 10(4), 978; https://doi.org/10.3390/su10040978
Submission received: 10 February 2018
/
Revised: 9 March 2018
/
Accepted: 9 March 2018
/
Published: 27 March 2018
(This article belongs to the Section Energy Sustainability)
Abstract
:Understanding decoupling China’s emissions from the economy and identifying the drivers of emissions at a sector perspective can facilitate China’s move to a low-carbon economy that makes economic growth compatible with carbon reduction. This study combined decoupling and decomposition econometric techniques to quantify both the decoupling effects and the driving elements of carbon emissions in China’s six major sectors. The study found that the leading source of all carbon emissions in China come from the industrial sector, followed by the ‘Other’ sectors and the Transport sector. Further, the decoupling status in those sectors differed: Construction (weak decoupling), other (weak decoupling), Trade (weak decoupling), Industry (weak decoupling), Transport (expansive coupling) and Agriculture (expansive negative decoupling). Finally, the economic output effect becomes the major contributor for carbon emissions among these six sectors, followed by the energy intensity effect. However, the energy structure effect and carbon coefficient effect are both weak.
1. Introduction
China currently faces dual problems of reducing carbon emissions and economic development. On the one hand, as the largest carbon emitter all over the world, China is under much pressure to address its carbon emissions. On the other hand, China, the world’s largest developing country, has a great responsibility to alleviate poverty by developing its economy. In the 2015 Paris Climate conference, China specifically committed to decreasing its carbon intensity (carbon emission per unit gross domestic product (GDP)) by 60–65% from 2005 levels by 2030 [1]. At the 23rd UN Climate Change Conference in 2017, China actively promoted the process of negotiation on the implementation of the Paris Agreement and introduced a series of policy measures and actions that China has taken in response to climate change, showing China’s determination to achieve its carbon reduction target. In addition, the Chinese government has committed to lifting more than 70 million people out of poverty by 2020—this is more people than in the total population of the United Kingdom or France [2].
The best strategy to address these dual needs is to transition to a low-carbon economy, which makes economic growth compatible with carbon reduction. This type of transition requires a better understanding of the decoupling status and effects of China’s carbon emissions, at a sector level. To build this understanding, this paper calculates carbon emissions from every sector, quantifies decoupling status of carbon emissions from economic growth in each sector and investigates the key effects of carbon emissions.
This paper is organized as follows: Section 2 presents the literature review while Section 3 describes data collection and the method, including the Tapio decoupling model and the decomposition method of Logarithmic Mean Divisia Index (LMDI). Section 4 discusses the decoupling and decomposition results in different sectors. Finally, we present conclusions in Section 5.
2. Literature Review
The relationship between economic growth and carbon dioxide emissions has caused widespread concern among scholars [3,4,5,6,7,8]. Many studies have been completed, which focused on two aspects—the decoupling analysis of economic growth and CO2 emissions—aimed at exploring driving factors of emissions.
In the “low carbon era,” the ideal goal of economic development is to have the economy grow, while also reducing carbon emissions. In this state, no interdependence exists between economy growth and carbon emissions [9]. In 1989, Von [10] presented the concept of ‘decoupling’ to reflect the non-synchronous changes between economic growth and CO2 emissions. In 2002, the Organization for Economic Co-operation and Development (OECD) [11] applied the concept to develop a decoupling model. In 2005, Tapio [12] proposed a second model—the “Tapio decoupling model”—to study the decoupling between the two sides above.
Over time, international research on the decoupling problem has mainly adopted the above two models [4,13,14,15]. A lack of uniformity in decoupling indicators prevents us from determining the best method [16]. However, the “Tapio decoupling model” has been more widely adopted by many investigators because its decoupling index is complete, it is not subject to the impact of statistical dimensions and it does not require the selection of a base period [8,17,18,19,20,21,22,23,24].
For example, in order to study the decoupling of carbon dioxide emissions and economic growth of Brazil from 2004 to 2009, Freitas and Kaneko [25] constructed the Tapio decoupling model. Zhang et al. [26] made research on the decoupling relationship of economic growth and coal consumption. Zhou et al. [27] made an exploration on the extent of decoupling between economic growth and carbon emissions in eight primary areas in China between 1996 and 2012. Andreoni at al. [28] analyzed the degree of decoupling in Italy from 1998 to 2006 and concluded that the country did not achieve absolute decoupling between carbon dioxide emissions and the economy. Caneghem et al. [29] analyzed the decoupling relationship between economic growth and environmental impacts upon industrial sectors of the Flemish region from 1995 to 2006.
The rapid growth of China’s economy has brought about the continuous growth of carbon emissions. Many academics have adopted the Tapio decoupling method with the purpose of studying the decoupling relationship between economic growth and China’s CO2 emissions at a national level [13,30] and a provincial-level [20,31]. Other academics have refined their studies to focus on a specific industry in China, such as Construction [17], Industry [14,32], or Transportation [33].
When exploring the factors that drive CO2 emissions, the Logarithmic Mean Divisia Index (LMDI) approach is popular with academics because this approach uses the log mean weight function and there are no residual terms in the results of decomposition [3,7,31,34,35]. Lu et al. utilized the LMDI method and the Tapio decoupling model to evaluate CO2 emissions from the industry in Jiangsu Province, China [36]. Lin and Moubarak [37] combined the LMDI framework to decompose CO2 emissions from industry in Jiangsu Province, China into industrial activity, carbon intensity, energy intensity, and fossil fuel share on an industrial scale. Wang at al. [38] used the LMDI method to make a decomposition of industrial carbon emissions in Taiwan, finding that the energy intensity effect plays a leading role of facilitating decoupling; the effect of energy and industrial structure has a negative role and impact on decoupling. S. Ren et al. [39] used LMDI to analyze the degree of decoupling of carbon emissions in the manufacturing industries of China. Their results showed that the growth in output value had the greatest effect on CO2 emissions growth. On the basis of a time series decomposition of LMDI, Liu et al. [40] analyzed differences in industrial carbon emissions in China from 1998 to 2005. With LMDI, Zhao et al. [41] decomposed the factors that drive industrial carbon emissions in Shanghai, China.
Some scholars divide the LMDI method into the additive decomposition form and the multiplicative decomposition form [4,7,8,42]. The additive decomposition is more popular than the multiplicative decomposition form, because it is easier to utilize and interpret. Because of it, in this paper we use the additive decomposition form.
China is the largest carbon emitter in the world, thus many studies have investigated decoupling and the factors influencing CO2 emissions and economic growth in China. However, research has been mostly at the national level, regional level, or the entire industrial sector. This provides opportunities to further refine research within industrial structures. This study refined three basic industries into six types of industries, based on type of energy consumption. Based on carbon emission measurements, we explored the decoupling relation of carbon emissions and economic growth of each sector. Finally, the study applied the LMDI decomposition method to analyze the influence elements of carbon emissions among different sectors. We then propose policy recommendations to support future action.
3. Research Method and Data Collection
3.1. The Model of Calculating Sector’s CO2 Emission
Using the CO2 emission calculation method proposed by IPCC, the CO2 emissions related to energy consumption by different sectors is expressed as Equation (1):
In this expression, is the total CO2 emissions of the ith sector; is the consumption of the final energy type j in the i-th sector; and denotes the CO2 emissions factor of energy type j in the i-th sector. The variable i denotes sector type; the sectors include: Agriculture (including Farming, Forestry, Animal Husbandry, Fishery and Water Conservancy), Industry, Construction, Transport (including Transport, Storage, Postal and Telecommunications Services), Trade (including Wholesale, Retail Trade and Catering Service) and Other (including Residential Consumption and other consumption). The variable j indicates energy type, including raw coal, cleaned coal, other washed coal, coke, crude oil, gasoline, kerosene, diesel oil, fuel oil, Liquefied Petroleum Gas (LPG), refinery gas, natural gas and electricity.
3.2. Decoupling Model
According to the Tapio decoupling model [12], which helps explore the relationship of CO2 emissions () and gross domestic product () for the ith sector, the decoupling index can be expressed as follows:
In this formula, is the decoupling index of the i-th sector between CO2 emissions and the gross domestic product; represents the rate of change of total carbon emissions in the i-th sector; represents the rate of change in the gross domestic product of the i-th sector.
Decoupling appears when the emission intensity declines while negative decoupling occurs when the emissions intensity increases. On the basis of the values of the decoupling index (e), we get eight logical possibilities [43]: strong decoupling, weak decoupling, expansive coupling, expansive negative decoupling, strong negative decoupling, weak negative decoupling, recessive coupling and recessive decoupling (Table 1).
3.3. Decomposition Technique
The total CO2 emissions can be decomposed into several elements. The total CO2 emissions can be expressed as the Kaya Identity, which is the most classical decomposition form when using the LMDI. The formula is as follows:
In this expression, is the total CO2 emissions of the ith sector; is the CO2 emissions of the jth energy type in the i-th sector; is the final consumption of the j-th energy type in the i-th sector; is the total energy consumption of the ith sector; is the gross domestic product of the i-th sector; illustrates the carbon coefficient of j-th energy type in the ith sector; illustrates the energy structure of j-th energy type in the i-th sector; illustrates the energy intensity in the i-th sector.
Using the LMDI approach described by Ang [42,44], the divergence in CO2 emissions from period a in base year 0 to period a in target year t, for the i-th sector (), can be decomposed into the following four driving factors. This study uses the additive form for the decomposition as denoted in Equation (4):
In this expression [17], is the total variation in carbon emissions of the i-th sector. Variables illustrate the CO2 emission changes caused by carbon coefficient changes, energy structure changes, energy intensity changes and economic changes, respectively.
With the LMDI method, each effect on the right side of Equation (4) can be computed as:
3.4. Data Collection
The time span of the study is from 2000 to 2014. Data about energy consumption in different sectors originated from China’s Energy Statistical Yearbook for the researched years. Economic output data for different sectors was derived from the China Statistical Yearbook. In order to eliminate influences of inflation, we converted the GDP in every year into constant prices, regarding the GDP in 2000 as a standard. Table 2 shows the default carbon coefficient values for different energy types; these are from the GHG Protocol Tool for Energy Consumption in China [18].
4. Results and Discussion
4.1. The Output Values and CO2 Emissions in Different Sectors
Figure 1 and Figure 2 show the economic output values and CO2 emissions from the different sectors from 2000 to 2014. Figure 1 shows that the economic output from all six sectors all grew from 2000 to 2014. The output from the Industry sector was much higher than in the other five sectors. In terms of the average annual growth rate, the top 3 sectors were Construction (11.78%), Trade (11.62%) and Industry (10.54%). With the rapid growth of output, CO2 emissions across the six sectors also significantly increased.
Figure 2 shows that across the six sectors, the Industry sector produces the most CO2 emissions, accounting for the total ones of approximately 70%. Emissions from the Industry sector grew rapidly, from 1321.25 million tons in 2000 to 3873.59 million tons in 2014, which reveals an annual increase rate of 7.99%. CO2 emissions of the Industry sector increased more slowly from 2011 to 2014 and even slightly declined in 2014.
The second largest source of total CO2 emissions was from the other sector, which includes Residential Consumption and other sectors. These emissions account for the total emissions of about 12%. The third largest source is the Transport sector, which experienced a CO2 emissions increase of 443.28 million tons. The Transport sector also experienced the largest annual CO2 emission growth rate, at 8.37%. Data shows that the output value from the Transport sector increased slowly, however, the CO2 emissions increased rapidly. The remaining three sectors include Agriculture, Trade and Construction, which accounts for the whole CO2 emissions of a small percentage, at 2.1%, 2.0% and 0.9%, respectively.
4.2. Analysis on the Decoupling Effect in Different Sectors
According to the Tapio decoupling model and former studies [4,7,8,45,46,47] and using Equation (2), we calculated the value of the decoupling elasticity between CO2 emissions and GDP from different sectors from 2000 to 2014 (see Table 3).
Table 3 shows that, overall, the CO2 emissions and the economic output of all six sectors markedly increased from 2000 to 2014. The decoupling elasticity differs across sectors, with a wide range of numerical distribution. The decoupling elasticity of Construction is the smallest, at 0.361; the decoupling elasticity of Agriculture is the largest, which is 1.512.
Across the six sectors, the decoupling states of the Industry, Construction, Trade and Other sectors are the same; all are examples of weak decoupling. In these cases, the growth rate of GDP is higher than that of CO2 emissions. The Transport sector shows an expansive coupling state, which means CO2 emissions growth has risen at approximately the same rate as GDP growth. The Agriculture sector experienced expansive negative decoupling from 2000 to 2014, which means GDP grows with accelerating environment damage.
Therefore, the GDP growth, to some extent, reduced the pressure of environment in the Industry, Construction, Trade and Other sectors; however, these sectors did not achieve a real decoupling. The largest concern is with the Agriculture sector, because its carbon emissions increased with GDP growing but the CO2 emission growth rate was higher than the that of economic growth. As a result, economic growth accelerates environment damage.
4.3. Decomposition Analysis of the Different Sectors
4.3.1. Cumulative Effect of Carbon Emission Factors in Different Sectors
Using carbon emission calculations for different industries and earlier studies [4,7,8,42,48,49], Equations (3)–(8) were used to decompose the carbon emission factors into the carbon coefficient effect (), energy structure effect (), energy intensity effect () and economic effect ().
Figure 3 gives us information of the cumulative effect of carbon emission factors in different sectors. In terms of the figure, the cumulative economic effect () is the primary factor contributing to growing carbon emissions for these 6 sectors, accounting for all of about 83%, 149%, 179%, 103%, 158% and 156% for the Agriculture, Industry, Construction, Transport, Trade and Other sector, respectively. The cumulative energy intensity effect () turns out to be the second largest contributor for changes of carbon emissions among six sectors. This cumulative energy intensity effect has promoted a lot in improving carbon emissions for Agriculture. In contrast, the effect has had a smaller role in carbon emission for the other sectors.
The contribution from the cumulative energy structure effect () is not always positive for the six sectors. This has supported increased carbon emissions for the Agriculture and Transport sectors and has inhibited emissions for Industry, Construction, Trade and Other sectors. The cumulative carbon coefficient effect () is very small for the six sectors.
4.3.2. Analysis of Effects upon Different Sectors
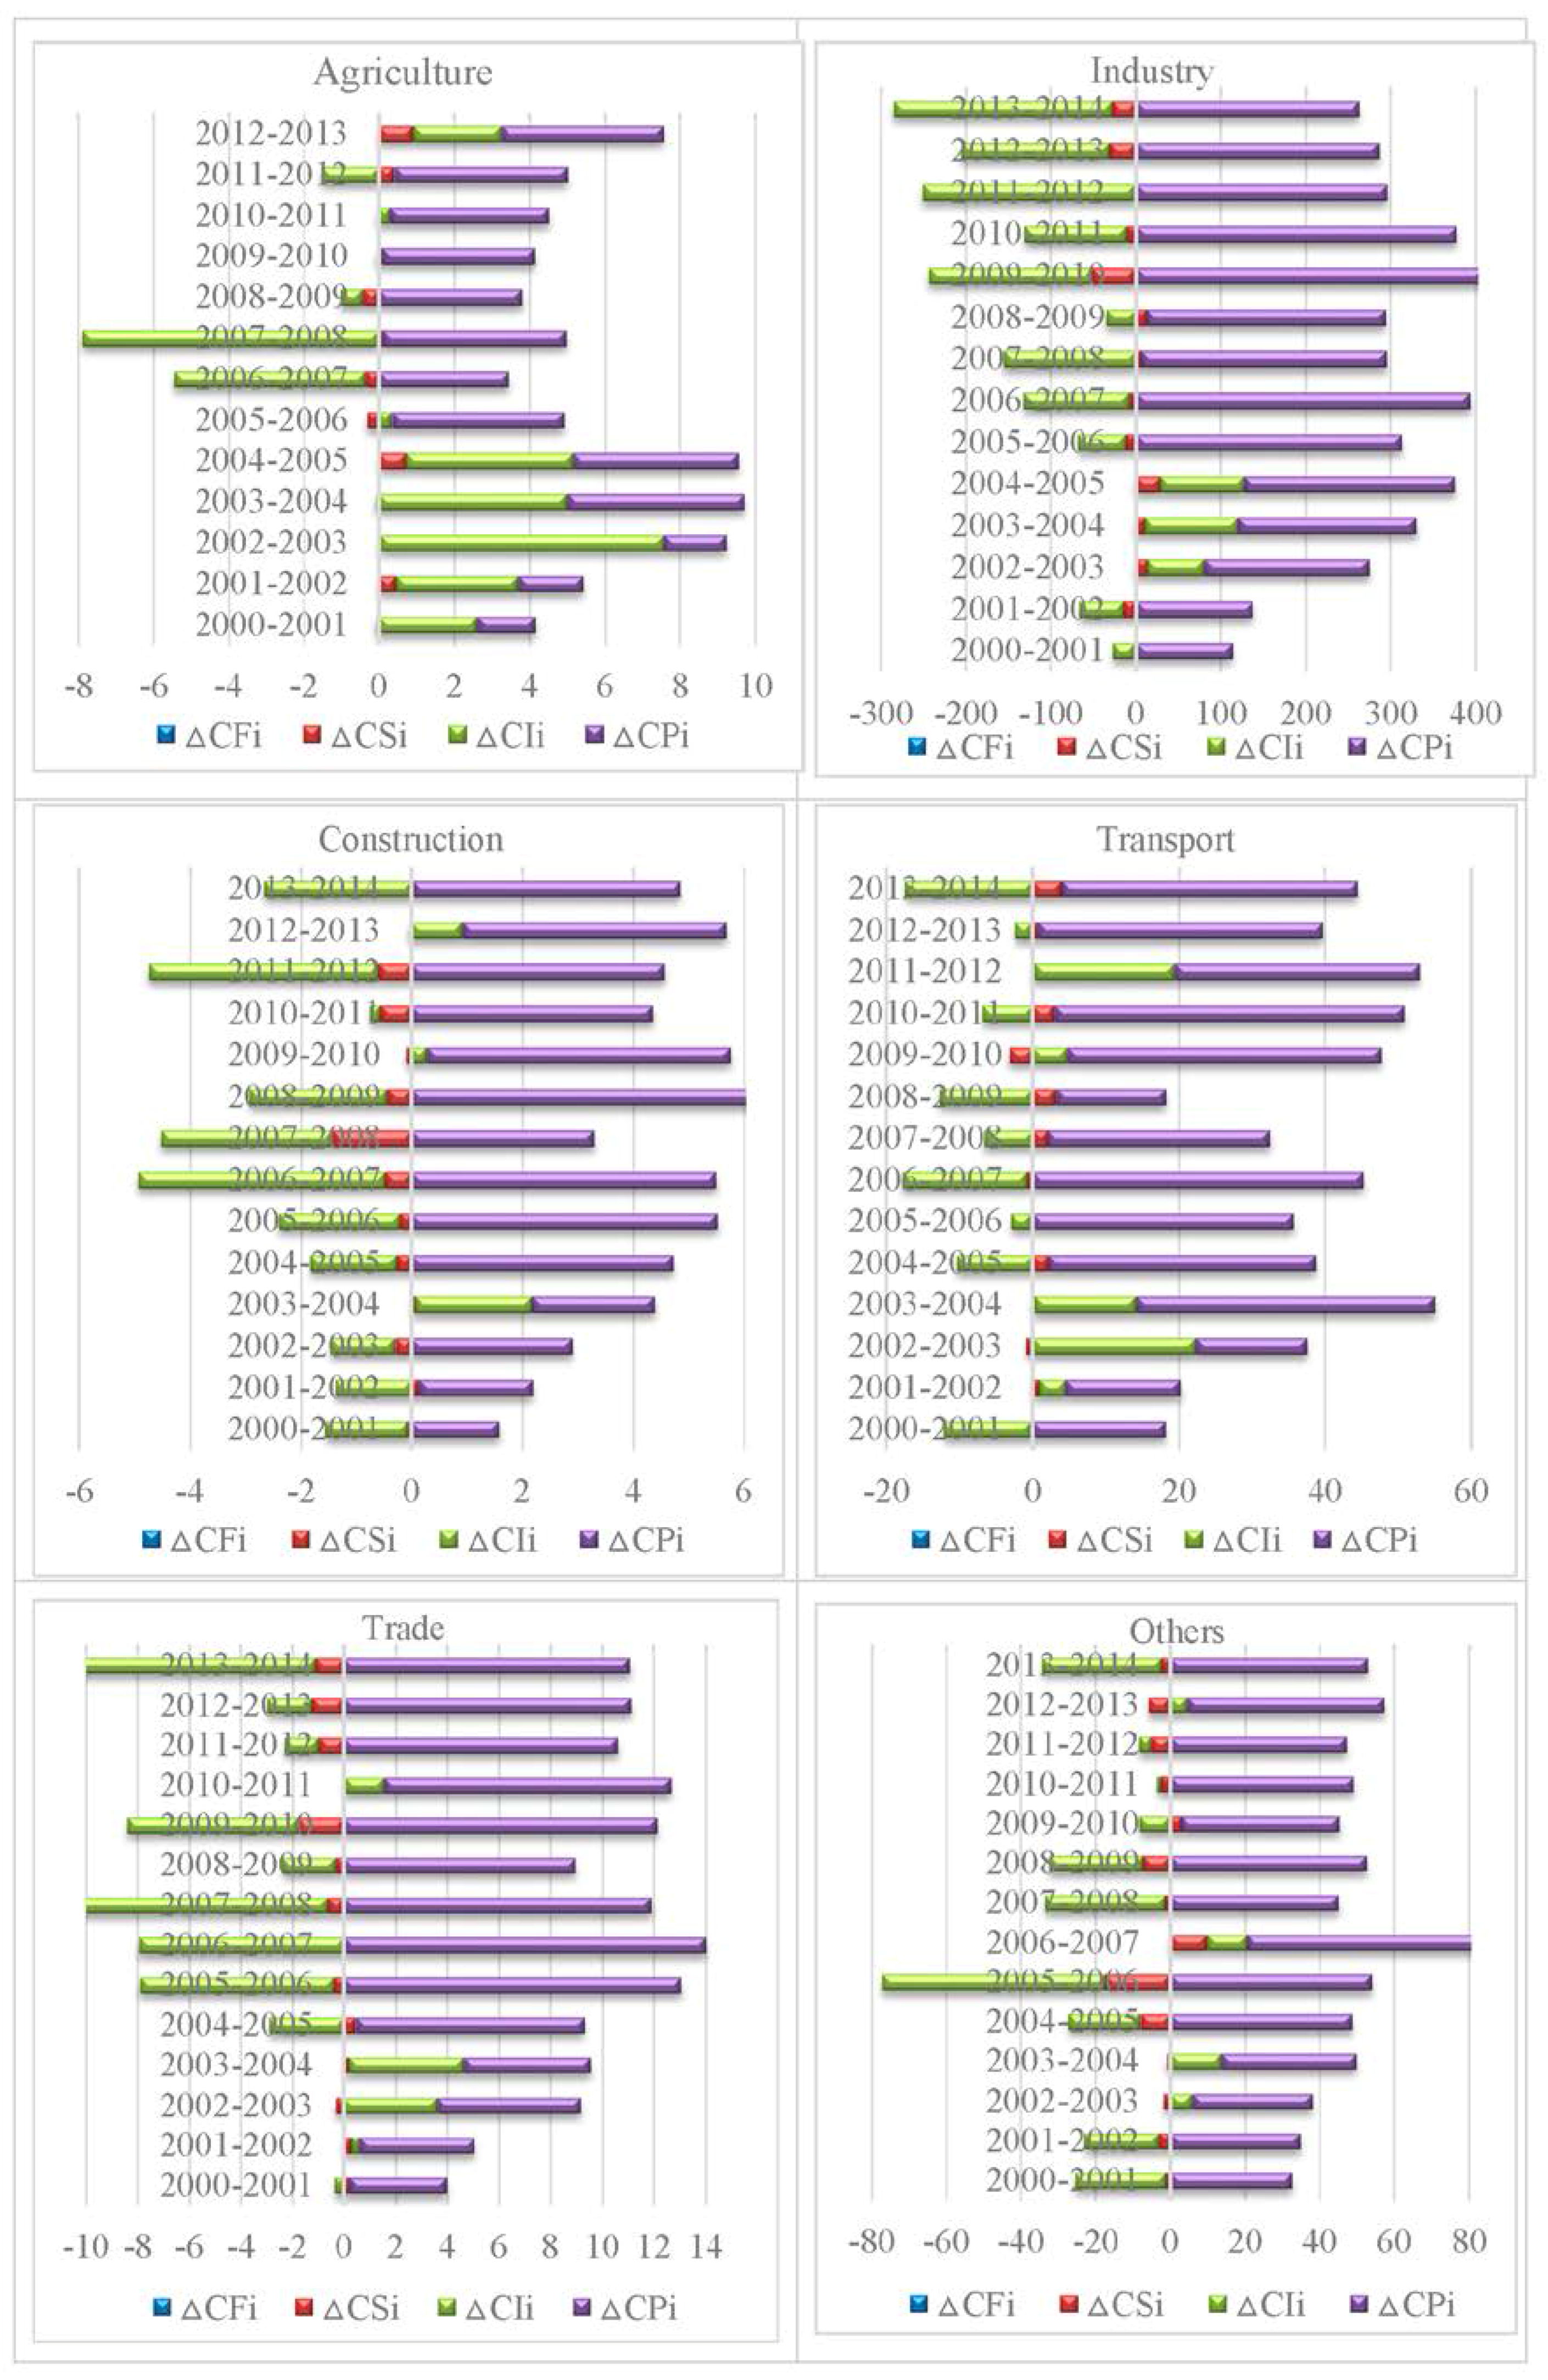
This section analyzes directions and the extent of effects on different sectors (see Figure 4).
Economic output from the Agriculture sector increased from 1494.36 billion Yuan in 2000 to 2669.31 billion Yuan in 2014. Such growth was associated with the accumulation of 63.63 million tons of carbon emissions from 2000 to 2014. Figure 4 shows that the economic effect is the major factor that drives changing CO2 emissions from 2005 to 2006 and from 2008 to 2014; the energy intensity effect was the second highest driver. During other years, the energy intensity effect turned out to be the main reason of increased emissions, followed by the economic effect. The economic growth effect was always positive while the energy intensity effect varied more. From 2006 to 2008, the CO2 emissions declined because the energy intensity effect played a negative role. This means that the energy intensity effect contributes by cancelling the growth in CO2 emissions created by the economic effect.
The Industry sector experienced an increase in economic output of 12,351.88 billion Yuan during the study period; this was associated with 2552.34 million tons of CO2 emissions growth from 2000 to 2014. The economic effect consistently promoted in increasing CO2 emissions, which was also the largest factor that drive emissions from 2000 to 2013. In 2013–2014, the total CO2 emissions declined by 226.79 million tons. This occurred because the inhibitory effect of energy intensity exceeded the positive industrial scale effect. The energy structure effect became the third greatest driving factor impacting the emissions.
Emissions from the Construction sector increased by 32.57 million tons with a GDP increase of 2078.34 billion Yuan. Figure 4 shows that the economic effect and the energy intensity effect were determinants of the CO2 emission growth while the next element was energy structure effect. The carbon coefficient effect was marginal. The CO2 emissions decreased during 2007–2008 and 2011–2012. This is because the energy intensity effect, the biggest driver of CO2 emissions, played a negative role.
In the Transport sector, the number of CO2 emissions in 2014, which was 656.17 million tons, was as 3.08 times as that in 2000. The economic output increased by 3.10 times, reaching 1914.94 billion Yuan. The total carbon emissions consistently remained in a state of growth, with no declines during the study period. This demonstrates that the inhibitory factor effects did not cancel the CO2 emissions growth facilitated by the positive factors. The economic effect was the strongest driver of CO2 emissions over this period, with an exception of 2002–2003. The energy intensity effect, which did not get that stable, was the second strongest element driving carbon emissions. The energy structure effect and carbon coefficient effect exerted a comparatively low positive effect.
In the Trade sector, the economic output and CO2 emissions both significantly increased during the study period, increasing 3772.33 billion Yuan and 83.25 million tons, respectively. Figure 4 shows that the economic effect was a large driver of growing CO2 emissions; the energy intensity effect was the most significant in decreasing CO2 emissions, inhibiting emissions in most years. The impact of the energy structure effect on CO2 emissions was unstable; it had a positive effect from 2001 to 2004, 2007–2008, 2010–2011 and 2013–2014 and a negative effect during the other years.
The economic output of the “Other” sector showed a significant increase, rising from 2307.61 billion Yuan in 2000 to 9298.81 billion Yuan in 2014. With the rapid increase in output, the CO2 emissions significantly increased by 414.33 million tons. The economic effect had the largest active and most dominant effect on CO2 emissions growth. However, CO2 emissions declined by 230.95 million tons from 2005 to 2006. This decrease resulted from the influence of the energy intensity effect, making it a dominant factor cancelling the growth of the economic effect of CO2 emissions. The energy structure effect and carbon coefficient effect only influenced CO2 emissions a little.
5. Conclusions and Policy Implications
5.1. Conclusions
In this paper, we calculated CO2 emissions produced by different sectors with data on final energy consumption and economic output from six different sectors from 2000 to 2014. Based on CO2 emission measurements, we assessed the decoupling relation between CO2 emissions and economic growth and applied the LMDI decomposition method to decompose the factors that drive emissions from each sector. This study’s key results are:
- (1)
- The economic output and carbon emissions of the six sectors all grew from 2000 to 2014. The Industry sector was the main source of total CO2 emissions, accounting for the whole CO2 emissions of around 70%. The Other and Transport sectors had the second and third highest emission levels. The other three sectors (Agriculture, Trade and Construction) accounted for the total number of emissions of a lower proportion.
- (2)
- From 2000 to 2014, the decoupling status of CO2 emissions differed across different sectors in China. In terms of the ideal degree of low-carbon development, the six sectors were ranked as follows, from best to worst: Construction (weak decoupling), other (weak decoupling), Trade (weak decoupling), Industry (weak decoupling), Transport (expansive coupling) and Agriculture (expansive negative decoupling).
- (3)
- Different factors drive emissions across the six sectors differently, both in degree and direction. The economic effect is the primary driver of CO2 emissions across the six sectors and plays a positive role of improving CO2 emissions. According to contributions these factors provided, the next element was energy intensity effect, which advanced increasing CO2 emissions for Agriculture but play a negative role in the other sectors. The energy structure effect contributes to emissions of the Agriculture and Transport sectors and inhibited the effect on the CO2 emissions in other four sectors. Because single types of energy are used for each sector, the cumulative carbon coefficient effect was weak.
5.2. Policy Implications
This study found that as China’s economy rapidly grows, the CO2 emissions from the six analyzed sectors also increase. Therefore, China should adopt additional policies to curb these emissions. Three policy recommendations follow here.
- (1)
- Based on the total value of CO2 emissions and decoupling states in different sectors, the Industry sector turns out to be the main origin of total carbon emissions, the annual growth rate of CO2 emissions is largest for the Transport sector and the decoupling state of the Agriculture sector is expansive negative decoupling. These results indicate that the relevant departments should develop practical and feasible emission reduction targets and adopt differentiated industrial development policies.
- (2)
- For the Industry sector with the highest economic output and the most CO2 emissions, it is necessary to develop technological innovations in green low-carbon industries and realize industrial production modes that achieve greater economic output through low CO2 emissions.
- (3)
- The economic effect and energy intensity effect are determinants of CO2 emissions from different sectors, followed by the energy structure effect. Increases in industrial scale will result in an increase in carbon emissions. As such, reducing energy intensity and optimizing energy structure are critical measures for the sake of achieving low carbon development goals of different sectors. Energy efficiency should improve in the future by promoting low-carbon technologies and promoting and applying energy efficient equipment. In addition, improving the usage frequency and scope of clean energy (natural gas, hydropower, solar energy and wind energy) could effectively inhibit the economic growth effect on CO2 emissions.
Acknowledgments
The current work is supported by “the Fundamental Research Funds for the Central Universities (17CX05015B)” and the Recruitment Talent Fund of China University of Petroleum (East China) (YJ2016002). We have received the grants in support of our research work.
Author Contributions
Rui Jiang conceived and designed the experiments and wrote the paper; Rongrong Li performed the experiments, and analyzed the data; Yulin Zhou contributed reagents/materials/analysis tools. All authors read and approved the final manuscript.
Conflicts of Interest
The authors declare no conflict of interest.
References
- Wang, Q.; Li, R. Decline in China’s coal consumption: An evidence of peak coal or a temporary blip? Energy Policy 2017, 108, 696–701. [Google Scholar] [CrossRef]
- Xinhua Ten Specific Measures to Help 70 Million People Out of Poverty. Available online: http://news.xinhuanet.com/politics/2015-12/10/c_128514139.htm. (accessed on 1 December 2015).
- Wang, W.; Li, M.; Zhang, M. Study on the changes of the decoupling indicator between energy-related CO2 emission and GDP in China. Energy 2017, 128, 11–18. [Google Scholar] [CrossRef]
- Wang, Q.; Chen, X. Energy policies for managing China’s carbon emission. Renew. Sustain. Energy Rev. 2015, 50, 470–479. [Google Scholar] [CrossRef]
- Mcmichael, A.J.; Powles, J.W.; Butler, C.D.; Uauy, R. Food, livestock production, energy, climate change, and health. Lancet 2007, 370, 1253. [Google Scholar] [CrossRef]
- Heggelund, G. China’s climate change policy: Domestic and international developments. Asian Perspect. 2007, 31, 155–191. [Google Scholar]
- Wang, Q.; Li, R. Journey to burning half of global coal: Trajectory and drivers of China’s coal use. Renew. Sustain. Energy Rev. 2016, 58, 341–346. [Google Scholar] [CrossRef]
- Wang, Q.; Chen, X. China’s electricity market-oriented reform: From an absolute to a relative monopoly. Energy Policy 2012, 51, 143–148. [Google Scholar] [CrossRef]
- Zhang, S.X.; Tang, X.W.; Management, S.O. The Decoupling Relationship between Carbon Emissions and Economic Growth of Construction Industry in Shaanxi Province. Ind. Eng. J. 2014, 17, 68–72. [Google Scholar] [CrossRef]
- Weizsäcker, E.U.V. Erdpolitik: Ökologische Realpolitik an der Schwelle zum Jahrhundert der Umwelt; Wissenschaftliche Buchgesellschaft: Darmstadt, Germany, 1990. [Google Scholar]
- The Organisation for Economic Co-operation and Development. Sustainable Development: Indicators to Measure Decoupling of Environmental Pressure From Economic Growth; OECD: Paris, France, 2002. [Google Scholar]
- Tapio, P. Towards a theory of decoupling: Degrees of decoupling in the EU and the case of road traffic in Finland between 1970 and 2001. Transp. Policy 2005, 12, 137–151. [Google Scholar] [CrossRef]
- Climent, F.; Pardo, A. Decoupling factors on the energy–output linkage: The Spanish case. Energy Policy 2007, 35, 522–528. [Google Scholar] [CrossRef]
- Wang, Q.; Li, R.; Jiang, R. Decoupling and Decomposition Analysis of Carbon Emissions from Industry: A Case Study from China. Sustainability 2016, 8, 1059. [Google Scholar] [CrossRef]
- Wang, Q.; Jiang, X.-T.; Li, R. Comparative decoupling analysis of energy-related carbon emission from electric output of electricity sector in Shandong Province, China. Energy 2017, 127, 78–88. [Google Scholar] [CrossRef]
- Zhong, T.Y.; Huang, X.J.; Han, L.; Wang, B.Y. Review on the Research of Decoupling Analysis in the Field of Environments and Resource. J. Nat. Resour. 2010, 25, 1400–1412. [Google Scholar]
- Jiang, R.; Li, R. Decomposition and Decoupling Analysis of Life-Cycle Carbon Emission in China’s Building Sector. Sustainability 2017, 9, 793. [Google Scholar] [CrossRef]
- Li, R.; Jiang, R. Moving Low-Carbon Construction Industry in Jiangsu Province: Evidence from Decomposition and Decoupling Models. Sustainability 2017, 9, 1013. [Google Scholar] [CrossRef]
- Li, Z.; Han, C.; Yao, Y. A Study on the Influent Factors of Decoupling of Industrial Low-carbonization. Econ. Manag. 2010, 24, 41–44. [Google Scholar]
- Zhang, M.; Wang, W. Decouple indicators on the CO2 emission-economic growth linkage: The Jiangsu Province case. Ecol. Indic. 2013, 32, 239–244. [Google Scholar] [CrossRef]
- Zhongwu, L.U.; Wang, H.; Qiang, Y. Decoupling Indicators: Quantitative Relationships between Resource Use, Waste Emission and Economic Growth. Resour. Sci. 2011, 33, 2–9. [Google Scholar]
- Wang, Q.; Li, R. Research status of shale gas: A review. Renew. Sustain. Energy Rev. 2017, 74, 715–720. [Google Scholar] [CrossRef]
- Wang, Q.; Li, R. Natural gas from shale formation: A research profile. Renew. Sustain. Energy Rev. 2016, 57, 1–6. [Google Scholar] [CrossRef]
- Wang, Q.; Li, R. Impact of cheaper oil on economic system and climate change: A SWOT analysis. Renew. Sustain. Energy Rev. 2016, 54, 925–931. [Google Scholar] [CrossRef]
- Freitas, L.C.D.; Kaneko, S. Decomposing the decoupling of CO2 emissions and economic growth in Brazil. Ecol. Econ. 2011, 70, 1459–1469. [Google Scholar] [CrossRef]
- Zhang, M.; Bai, C.; Zhou, M. Decomposition analysis for assessing the progress in decoupling relationship between coal consumption and economic growth in China. Resour. Conserv. Recycl. 2016, 129, 454–462. [Google Scholar] [CrossRef]
- Zhou, X.; Zhang, M.; Zhou, M.; Zhou, M. A comparative study on decoupling relationship and influence factors between China’s regional economic development and industrial energy-related carbon emissions. J. Clean. Prod. 2016, 142, 783–800. [Google Scholar] [CrossRef]
- Andreoni, V.; Galmarini, S. Decoupling economic growth from carbon dioxide emissions: A decomposition analysis of Italian energy consumption. Energy 2012, 44, 682–691. [Google Scholar] [CrossRef]
- Caneghem, J.V.; Block, C.; Hooste, H.V.; Vandecasteele, C. Eco-efficiency trends of the Flemish industry: Decoupling of environmental impact from economic growth. J. Clean. Prod. 2010, 18, 1349–1357. [Google Scholar] [CrossRef]
- Zhao, X.; Zhang, X.; Li, N.; Shao, S.; Geng, Y. Decoupling economic growth from carbon dioxide emissions in China: A sectoral factor decomposition analysis. J. Clean. Prod. 2016, 142, 3500–3516. [Google Scholar] [CrossRef]
- Luo, Y.; Long, X.; Wu, C.; Zhang, J. Decoupling CO2 emissions from economic growth in agricultural sector across 30 Chinese provinces from 1997 to 2014. J. Clean. Prod. 2017, 159, 220–228. [Google Scholar] [CrossRef]
- Zhao, X.; Zhang, X.; Shao, S. Decoupling CO2 Emissions and Industrial Growth in China over 1993–2013: The Role of Investment. Energy Econ. 2016, 60, 275–292. [Google Scholar] [CrossRef]
- Wang, Y.; Xie, T.; Yang, S. Carbon emission and its decoupling research of transportation in Jiangsu Province. J. Clean. Prod. 2017, 142, 907–914. [Google Scholar] [CrossRef]
- Sheinbaum, C.; Ozawa, L.; Castillo, D. Using logarithmic mean Divisia index to analyze changes in energy use and carbon dioxide emissions in Mexico’s iron and steel industry. Energy Econ. 2010, 32, 1337–1344. [Google Scholar] [CrossRef]
- Wang, Q.; Li, R. Drivers for energy consumption: A comparative analysis of China and India. Renew. Sustain. Energy Rev. 2016, 62, 954–962. [Google Scholar] [CrossRef]
- Lu, Q.; Yang, H.; Huang, X.; Chuai, X.; Wu, C. Multi-sectoral decomposition in decoupling industrial growth from carbon emissions in the developed Jiangsu Province, China. Energy 2015, 82, 414–425. [Google Scholar] [CrossRef]
- Lin, B.; Moubarak, M. Decomposition analysis: Change of carbon dioxide emissions in the Chinese textile industry. Renew. Sustain. Energy Rev. 2013, 26, 389–396. [Google Scholar] [CrossRef]
- Wang, Q.; Hang, Y.; Zhou, P.; Wang, Y. Decoupling and attribution analysis of industrial carbon emissions in Taiwan. Energy 2016, 113, 728–738. [Google Scholar] [CrossRef]
- Ren, S.; Yin, H.; Chen, X.H. Using LMDI to analyze the decoupling of carbon dioxide emissions by China’s manufacturing industry. Environ. Dev. 2014, 9, 61–75. [Google Scholar] [CrossRef]
- Liu, L.C.; Fan, Y.; Wu, G.; Wei, Y.M. Using LMDI method to analyze the change of China’s industrial CO2 emissions from final fuel use: An empirical analysis. Energy Policy 2007, 35, 5892–5900. [Google Scholar] [CrossRef]
- Zhao, M.; Tan, L.; Zhang, W.; Ji, M.; Liu, Y.; Yu, L. Decomposing the influencing factors of industrial carbon emissions in Shanghai using the LMDI method. Energy 2010, 35, 2505–2510. [Google Scholar] [CrossRef]
- Ang, B.W. LMDI decomposition approach: A guide for implementation. Energy Policy 2015, 86, 233–238. [Google Scholar] [CrossRef]
- Costanza, R. Economic growth, carrying capacity, and the environment. Science 1995, 268, 520. [Google Scholar] [CrossRef]
- Ang, B.W. Decomposition analysis for policymaking in energy: Which is the preferred method? Energy Policy 2004, 32, 1131–1139. [Google Scholar] [CrossRef]
- Diakoulaki, D.; Mandaraka, M. Decomposition analysis for assessing the progress in decoupling industrial growth from CO2 emissions in the EU manufacturing sector. Energy Econ. 2007, 29, 636–664. [Google Scholar] [CrossRef]
- Rikkonen, P.; Tapio, P. Future prospects of alternative agro-based bioenergy use in Finland—Constructing scenarios with quantitative and qualitative Delphi data. Technol. Forecast. Soc. Chang. 2009, 76, 978–990. [Google Scholar] [CrossRef]
- Tapio, P.; Banister, D.; Luukkanen, J.; Vehmas, J.; Willamo, R. Energy and transport in comparison: Immaterialisation, dematerialisation and decarbonisation in the EU15 between 1970 and 2000. Energy Policy 2007, 35, 433–451. [Google Scholar] [CrossRef]
- Xu, S.C.; He, Z.X.; Long, R.Y. Factors that influence carbon emissions due to energy consumption in China: Decomposition analysis using LMDI. Appl. Energy 2014, 127, 182–193. [Google Scholar] [CrossRef]
- Raupach, M.R.; Marland, G.; Ciais, P.; Le, Q.C.; Canadell, J.G.; Klepper, G.; Field, C.B. Global and regional drivers of accelerating CO2 emissions. Proc. Natl. Acad. Sci. USA 2007, 104, 10288–10293. [Google Scholar] [CrossRef] [PubMed]
Figure 1.
The economic output value of the different sectors.
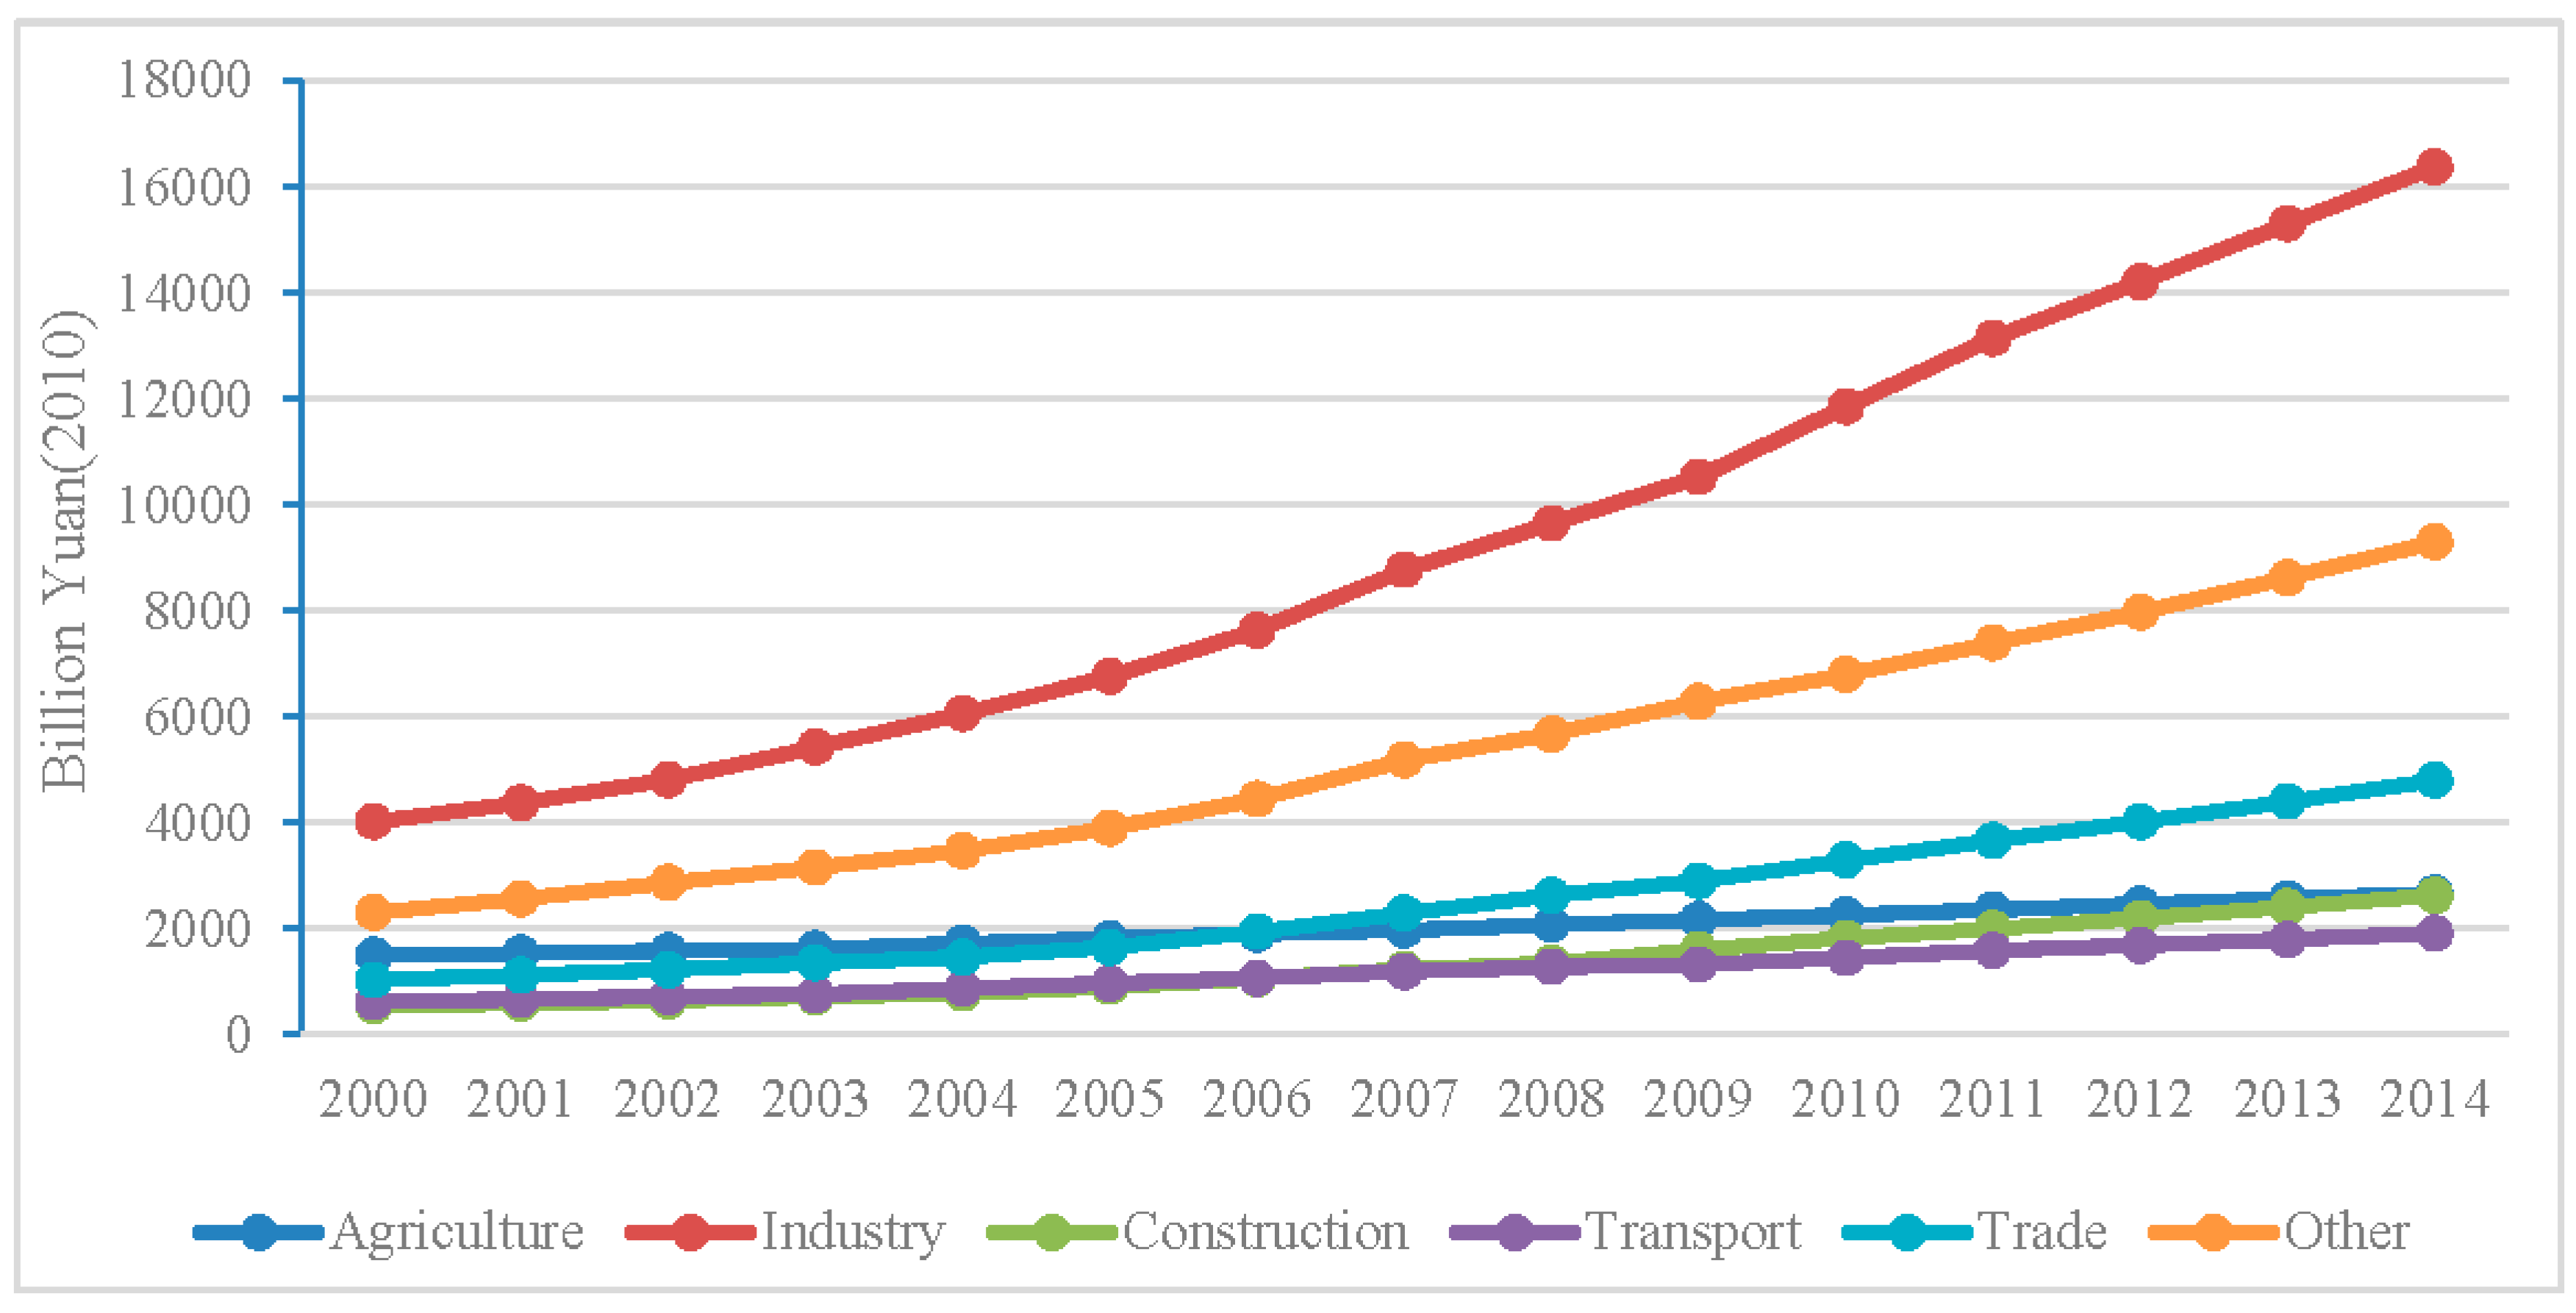
Figure 2.
The CO2 emissions from the different sectors.
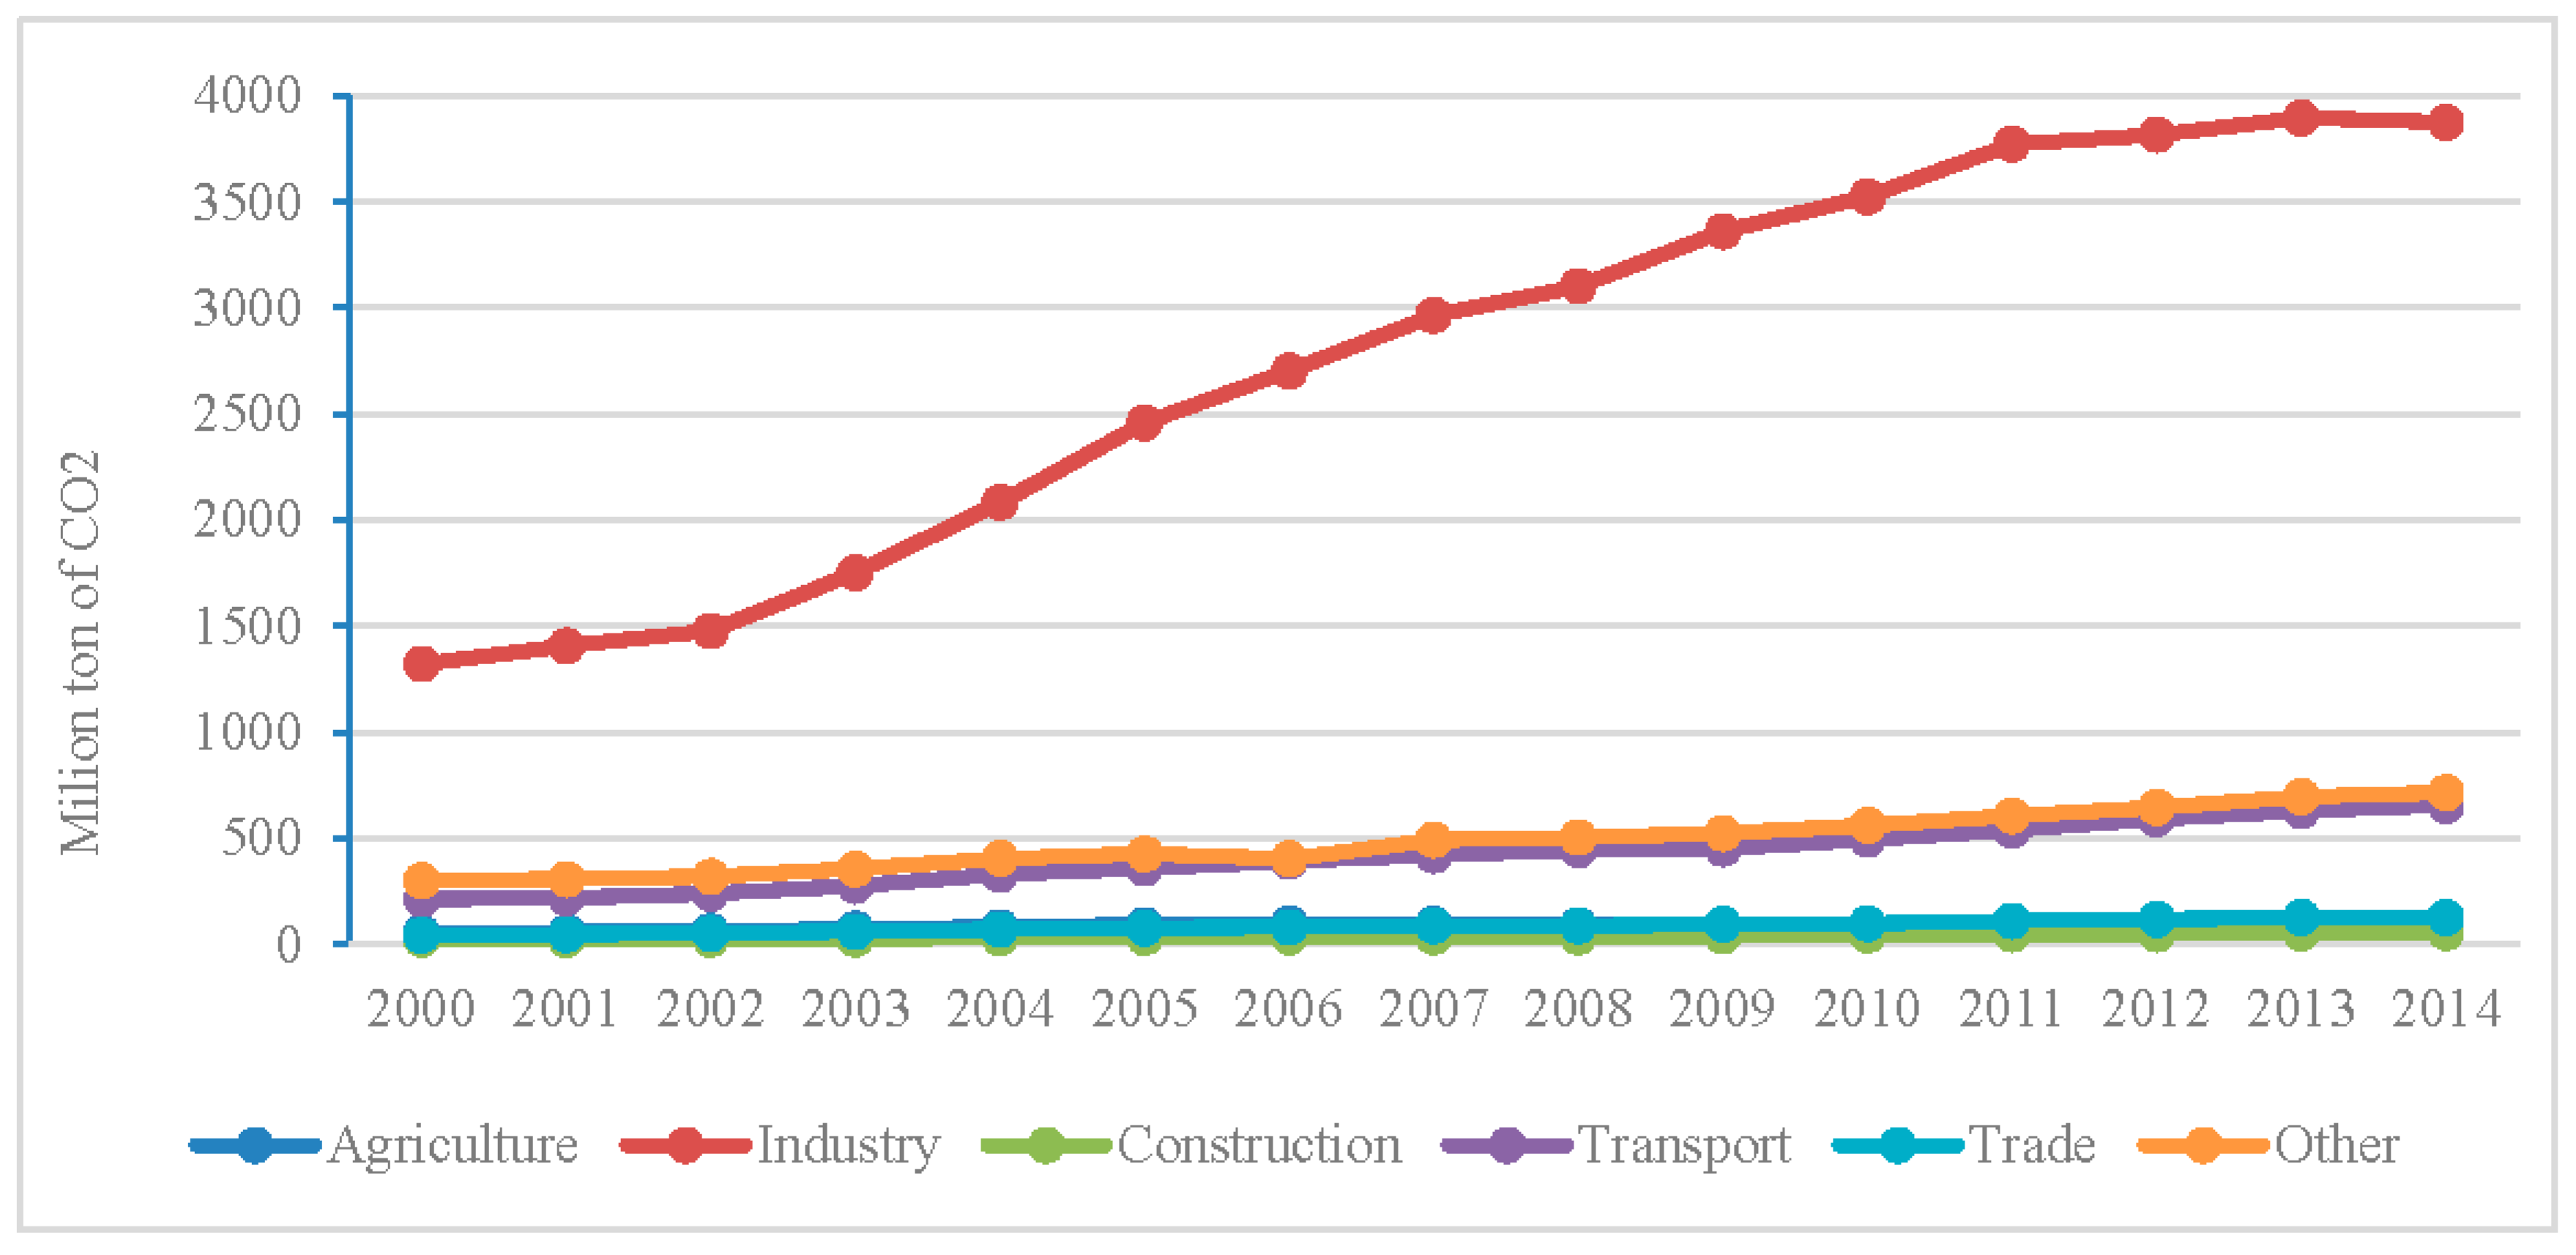
Figure 3.
Cumulative effect of CO2 emission factors in different sectors (unit: %).

Figure 4.
Decomposition of carbon emission in six sectors (unit: Million tons of CO2).

Table 1.
The framework for decoupling judgments.
| Degree of Decoupling | |||
|---|---|---|---|
| Strong decoupling | <0 | >0 | <0 |
| Weak decoupling | >0 | >0 | 0.8 > > 0 |
| Expansive coupling | >0 | >0 | 1.2 > > 0.8 |
| Expansive negative decoupling | >0 | >0 | >1.2 |
| Strong negative decoupling | >0 | <0 | <0 |
| Weak negative decoupling | <0 | <0 | 0.8 > > 0 |
| Recessive coupling | <0 | <0 | 1.2 > > 0.8 |
| Recessive decoupling | <0 | <0 | >1.2 |
Table 2.
The carbon coefficients of different kinds of fuels.
| Fuel Source | Carbon Coefficient | |
|---|---|---|
| 1 | raw coal | 1.981 |
| 2 | cleaned coal | 2.405 |
| 3 | other washed coal | 0.955 |
| 4 | coke | 2.86 |
| 5 | crude oil | 3.02 |
| 6 | gasoline | 2.925 |
| 7 | kerosene | 3.033 |
| 8 | diesel oil | 3.096 |
| 9 | fuel oil | 3.17 |
| 10 | LPG | 3.101 |
| 11 | refinery gas | 3.012 |
| 12 | natural gas | 21.622 |
| 13 | electricity | 1.239 |
Notes: 1 t CO2/1 t fuel, 1 t CO2/104 m3 natural gas or 1 t CO2/104 kw·h electricity.
Table 3.
Decoupling state between the CO2 emission and the economic output in different sectors from 2000–2014.
Table 3.
Decoupling state between the CO2 emission and the economic output in different sectors from 2000–2014.
| ΔC/C | ΔGDP/GDP | e | Decoupling State | |
|---|---|---|---|---|
| Agriculture | 1.189 | 0.786 | 1.512 | Expansive negative decoupling |
| Industry | 1.932 | 3.068 | 0.630 | Weak decoupling |
| Construction | 1.358 | 3.756 | 0.361 | Weak decoupling |
| Transport | 2.082 | 2.108 | 0.988 | Expansive coupling |
| Trade | 1.927 | 3.661 | 0.526 | Weak decoupling |
| Other | 1.377 | 3.030 | 0.455 | Weak decoupling |
© 2018 by the authors. Licensee MDPI, Basel, Switzerland. This article is an open access article distributed under the terms and conditions of the Creative Commons Attribution (CC BY) license (http://creativecommons.org/licenses/by/4.0/).
Share and Cite
MDPI and ACS Style
Jiang, R.; Zhou, Y.; Li, R. Moving to a Low-Carbon Economy in China: Decoupling and Decomposition Analysis of Emission and Economy from a Sector Perspective. Sustainability 2018, 10, 978. https://doi.org/10.3390/su10040978
AMA Style
Jiang R, Zhou Y, Li R. Moving to a Low-Carbon Economy in China: Decoupling and Decomposition Analysis of Emission and Economy from a Sector Perspective. Sustainability. 2018; 10(4):978. https://doi.org/10.3390/su10040978
Chicago/Turabian StyleJiang, Rui, Yulin Zhou, and Rongrong Li. 2018. "Moving to a Low-Carbon Economy in China: Decoupling and Decomposition Analysis of Emission and Economy from a Sector Perspective" Sustainability 10, no. 4: 978. https://doi.org/10.3390/su10040978
Note that from the first issue of 2016, this journal uses article numbers instead of page numbers. See further details here.