Two-Stage Coordinate Optimal Scheduling of Seawater Pumped Storage in Active Distribution Networks
by
 , ,
, ,
Ning Liang
1 ,
,
Changhong Deng
1,*,
Yahong Chen
1,
Weiwei Yao
1,
Dinglin Li
2,
Man Chen
2 and
Peng Peng
2 1
School of Electrical Engineering, Wuhan University, Wuhan 430072, China
2
Power Generation Company of China Southern Power Grid, Guangzhou 510630, China
*
Author to whom correspondence should be addressed.
Sustainability 2018, 10(6), 2014; https://doi.org/10.3390/su10062014
Submission received: 19 May 2018
/
Revised: 8 June 2018
/
Accepted: 10 June 2018
/
Published: 14 June 2018
(This article belongs to the Special Issue Smart Energy Management for Smart Grids)
Abstract
:The percentage of penetration in renewable energy generation (REG) in distribution networks has dramatically increased. Variable speed seawater pumped storage, which has a large power controllable range and flexible modes of operation, is an important tool to be applied in distribution networks to realize peak shaving and valley filling, and to mitigate the negative effects of REG. This paper presents a two-stage coordinated optimal scheduling model for the day-ahead and real-time operation of active distribution networks containing seawater pumped storage, REG, and flexible loads. In the model, seawater pumped storage and flexible loads are dispatched in the first day-ahead stage based on short-term forecast information of REG and load demands to minimize total operational costs. Then in the second real-time stage, the operation schedule of seawater pumped storage is adjusted to mitigate the negative effects of forecast errors of REG on the operation of active distribution networks. Network nodes power quality is improved and power loss is reduced. Applying the model, disadvantages of low accuracy short-term forecast are minimized whereas advantages of high accuracy ultra-short term forecast are fully taken. This model is tested using a modified Institute of Electrical and Electronics Engineers 33-bus system. Numerical results demonstrate the effectiveness of the proposed approach.
1. Introduction
There are rich renewable energy resources in China offshore. In recent years, the percentage of penetration in renewable energy in distribution networks has increased dramatically [1,2,3]. Power output of renewable energy generation (REG) like wind turbine (WT) generators and photo voltaic (PV) arrays have high randomness and fluctuation attributes. The controllability of WT and PV output is low [4,5], which rese new challenges to the operation of distribution networks. To increase its operation reliability and economy, energy storage provides an attractive solution because it has fast power response speed and strong energy shifting capabilities [6,7,8]. Compared with traditional energy storage technologies such as lead acid battery banks, hydrogen energy storage, and flywheel energy storage, etc., variable speed seawater pumped storage has many advantages, such as larger storage capacity, higher energy storage efficiency, lower per kilowatt capital and maintenance costs, longer service life, and it also can provide additional inertia energy for networks [9,10]. Meanwhile, compared with traditional pumped storage, offshore ocean is used as the lower reservoir for variable speed seawater pumped storage. The amount of water resources are inexhaustible and total construction costs can be reduced. But how to dispatch the distribution networks that contain variable speed seawater pumped storage and REG, reaching a high operation performance and having high economic benefits, is still a problem for the network operators.
Current distribution networks were operated in a passive fashion. The traditional operating method is no longer applicable to new distribution networks which contain REG, energy storage, and flexible loads, etc. In recent years, the concept of active distribution networks was proposed [11,12,13]. Compared with traditional distribution networks, this network is able to manage the power of REG, energy storage, and flexible loads actively, having the advantages of increasing the operation reliability and minimizing the total operation cost and power losses of the distribution networks [14,15]. Besides, the active distribution networks can provide additional spinning reserve capacities to alleviate the negative impacts of the stochastic fluctuations of REG and load demands on itself at the distribution network level. Problems of declining power quality are induced by stochastic, uncertain fluctuations of power of REG and load demands. These problems are solved locally by appropriate dispatch of distributed generators and energy storage [16]. In the dispatch of active distribution networks, an optimization model that can both achieve a global optimal solution and provide good performance is demanded [17]. Dynamic economic dispatch method [18] and consensus based dispatch method [19] can be applied to generate a dispatch schedule. However, the performance cannot meet this demand. The power flexibility and energy storability characteristics of energy storage in active distribution networks are not fully utilized in the present market management systems (MMS) and energy management systems (EMS) [20]. Operation schedules are generally determined at day-ahead time stages, ignoring the effect of real-time adjustment which can compensate for uncertainties and forecast errors of REG [21,22]. Day-ahead scheduling is performed, which is based on short-term forecasts of REG and load demands. However, because of the stochastic fluctuation attributes in wind strength, illumination intensity, etc., it is difficult to make accurate short-term predictions for PV and WT power and load demands.
For reducing the impact of renewable energy sources which are connected to power systems, the two-stage optimal scheduling method has been presented by some scholars in recent years. For example, there is the disturbance of power systems caused by the randomness and volatility of wind power, which can be reduced by a two-stage dynamic scheduling method, as noted in Reference [23]. In addition, a two-stage optimal scheduling method for micro-grid economy is presented in Reference [24]. In the first stage, based on the real-time forecast data for future power, optimal management for power source in a micro-grid is able to be calculated. In the second stage, according to the limitation of diesel generator output which can be figured out before, the output of diesel generators is adjusted for improving the robustness of the system. The dispatch schedule is made in day-ahead for seawater pumped storage and renewable energy has not yet utilized their potential capabilities to increase the performances and economics of active distribution networks adequately. Compared to short-term forecasts, ultra-short forecasts for PV and WT power is quite accurate. Based on the ultra-short forecasts information, real-time scheduling for seawater pumped storage can solve or mitigate the negative impacts caused by forecast errors effectively. In this paper, a two-stage scheduling method is proposed, because it has high computation efficiency and takes advantages of the flexibility of seawater pumped storage and flexible loads to dispatch the active distribution networks. In a day-ahead scheduling stage, optimal dispatch schedule of active distribution networks is determined. In a real-time scheduling stage, negative impacts of forecast errors of REG on the operation of active distribution networks is compensated and mitigated.
Main contributions are as follows.
- Variable speed seawater pumped storage is first utilized for dispatch in offshore local active distribution networks in China;
- A two-stage scheduling method considering variable speed seawater pumped storage, flexible loads, and REG in active distribution networks is presented. Both advantages of day-ahead and real-time scheduling are fully utilized and exploited.
Remaining sections are organized as follows: Section 2 introduces the dispatch model for variable speed seawater pumped storage. Section 3 presents the problem formulation of the two-stage scheduling in active distribution networks and the solving algorithm. Section 4 gives the test results of the proposed approach on a modified Institute of Electrical and Electronics Engineers (IEEE) 33-bus distribution system. Finally, conclusions are drawn in Section 5.
2. Variable Speed Seawater Pumped Storage Model
The structure of a traditional pumped storage station consists of a generator unit, pumping station, and upper and lower reservoirs. Capacities of the upper and lower reservoirs are mainly determined by the conditions of natural water resources. However, for a variable speed seawater pumped storage station, one of the prominent features is that the lower reservoir is the sea. Its water resources are unlimited and its capacity can be considered infinitely large. Only the water amount of the upper reservoir should be considered in the optimal scheduling. Another prominent feature is that the speed of the motor rotor in generating or pumping mode can vary within a large range. Therefore, the efficiency of the overall system can be improved in the generating mode. In the pumping mode, the range of input power is expanded. From the point of view of scheduling, the above features can gain great benefits for the operation of the power system. Operation models of a variable speed seawater pumped storage station in generating and pumping modes are expressed as follows.
2.1. Generating and Pumping Modes
In the generating mode, output power is formulated by:
In the pumping mode, energy for the pump is directly input from local active distribution networks. The flow rate of seawater sucked from the sea is stated as follows.
2.2. Operation and Maintenance Cost of Seawater Pumped Storage
Seawater contains high salinity and corrosiveness to pipelines, which increases the maintenance cost of pipelines. Therefore, the cost of seawater pumped storage contains the installation fee, start-up cost, pipelines, and generator maintenance cost. Equation (3) is the operation and maintenance cost of seawater pumped storage; Equations (4) and (5) are the start-up cost of a turbine generator and pump-motor unit in period t, respectively; Equation (6) is the maintenance cost of turbine generator and pump-motor unit in period t; Equation (7) is the piping maintenance cost of the seawater pumped storage.
2.3. Operation Constraints of Variable Speed Seawater Pumped Storage Station
The proposed coordinate optimal scheduling models for active distribution networks containing seawater pumped storage have two stages. The first stage is the day-ahead, and the second stage is the real-time.
2.3.1. Day-Ahead Operation Constraints
In period t, the quantity of seawater stored in upper reservoir is given as follows.
Seawater pumped storage stations can operate only in one mode in a given time interval, on-off operation mode constraint:
Power range constraint in generating mode:
Power range constraint in pumping mode:
Water amount constraint for upper reservoir:
2.3.2. Real-Time Operation Constraints
The quantity of seawater stored in upper reservoir:
On-off operation mode constraint:
Power range constraint in generating mode:
Power range constraint in pumping mode:
Water amount constraint for upper reservoir:
Restricted by technical conditions, the frequency of switching between generating and pumping modes must be limited. Minimum switching time is 30 min, (i.e., a time of 2∆t is required). Formulation below must be satisfied in real-time scheduling.
2.3.3. Problem Formulation
Due to the stochastic fluctuation attributes in wind strength and illumination intensity, people’s ability to predict REG power output accurately has yet to be improved. Ultra-short forecasting of REG are far more accurate than short-term’s. Day-ahead scheduling of variable speed seawater pumped storage is performed based on the short-term forecast information of REG power and load demands. The objective of this stage is to minimize total system operation cost. Then real-time scheduling of variable speed seawater pumped storage is carried out based on ultra-short forecast information to mitigate the negative effects of the forecast errors on the operation of active distribution networks [25].
3. Optimal Scheduling Model
3.1. Day-Ahead Scheduling
3.1.1. Objective Function
The objective of day-ahead scheduling is to make the most cost-effective operation schedule for active distribution networks. Costs of power obtained from main grid, penalty for the transition between generating and pumping modes of seawater pump storage, interruption, and incentive to the flexible loads are all taken into consideration. We assume that all renewable energy sources are absorbed. Therefore the costs of wind and solar energy power generation are neglected. These costs are induced by operation, maintenance, and depreciation.
Objective function is as follows.
3.1.2. Constraints
Power balance constraint is formulated by:
Reserve constraints are given below.
Constraint of power obtained from main grid is:
3.2. Real-Time Scheduling
3.2.1. Objective Function
The day-ahead scheduling is seen as the foundation for real-time scheduling. However, the forecast data is gotten in day-ahead, which cause a large forecast error. As a result, the reliability of distribution network operation could be influenced if the forecast error cannot be compensated in the real-time stage. So we assume that the forecast error of renewable energy is suppressed by seawater pumped storage in priority at real-time stage. The detail objective function for real-time optimal scheduling is shown as Equation (30).
3.2.2. Operation Constraints
Power balance constraint is as below.
Constraint of power obtained from main grid is:
3.3. Approach to Solve This Model
A flowchart of the two-stage optimal scheduling of the seawater pumped storage and flexible loads in active distribution networks is shown in Figure 1. ILOG Cplex 12.7 was called by MATLAB and is used to solve the proposed model, and case studies were carried out on a 3.5 GHz ASUS PC. Day-ahead scheduling was updated each day. Real-time scheduling was carried out every 15 min according to the rolling update ultra-short forecasting data of REG.
4. Case Study
4.1. System Description
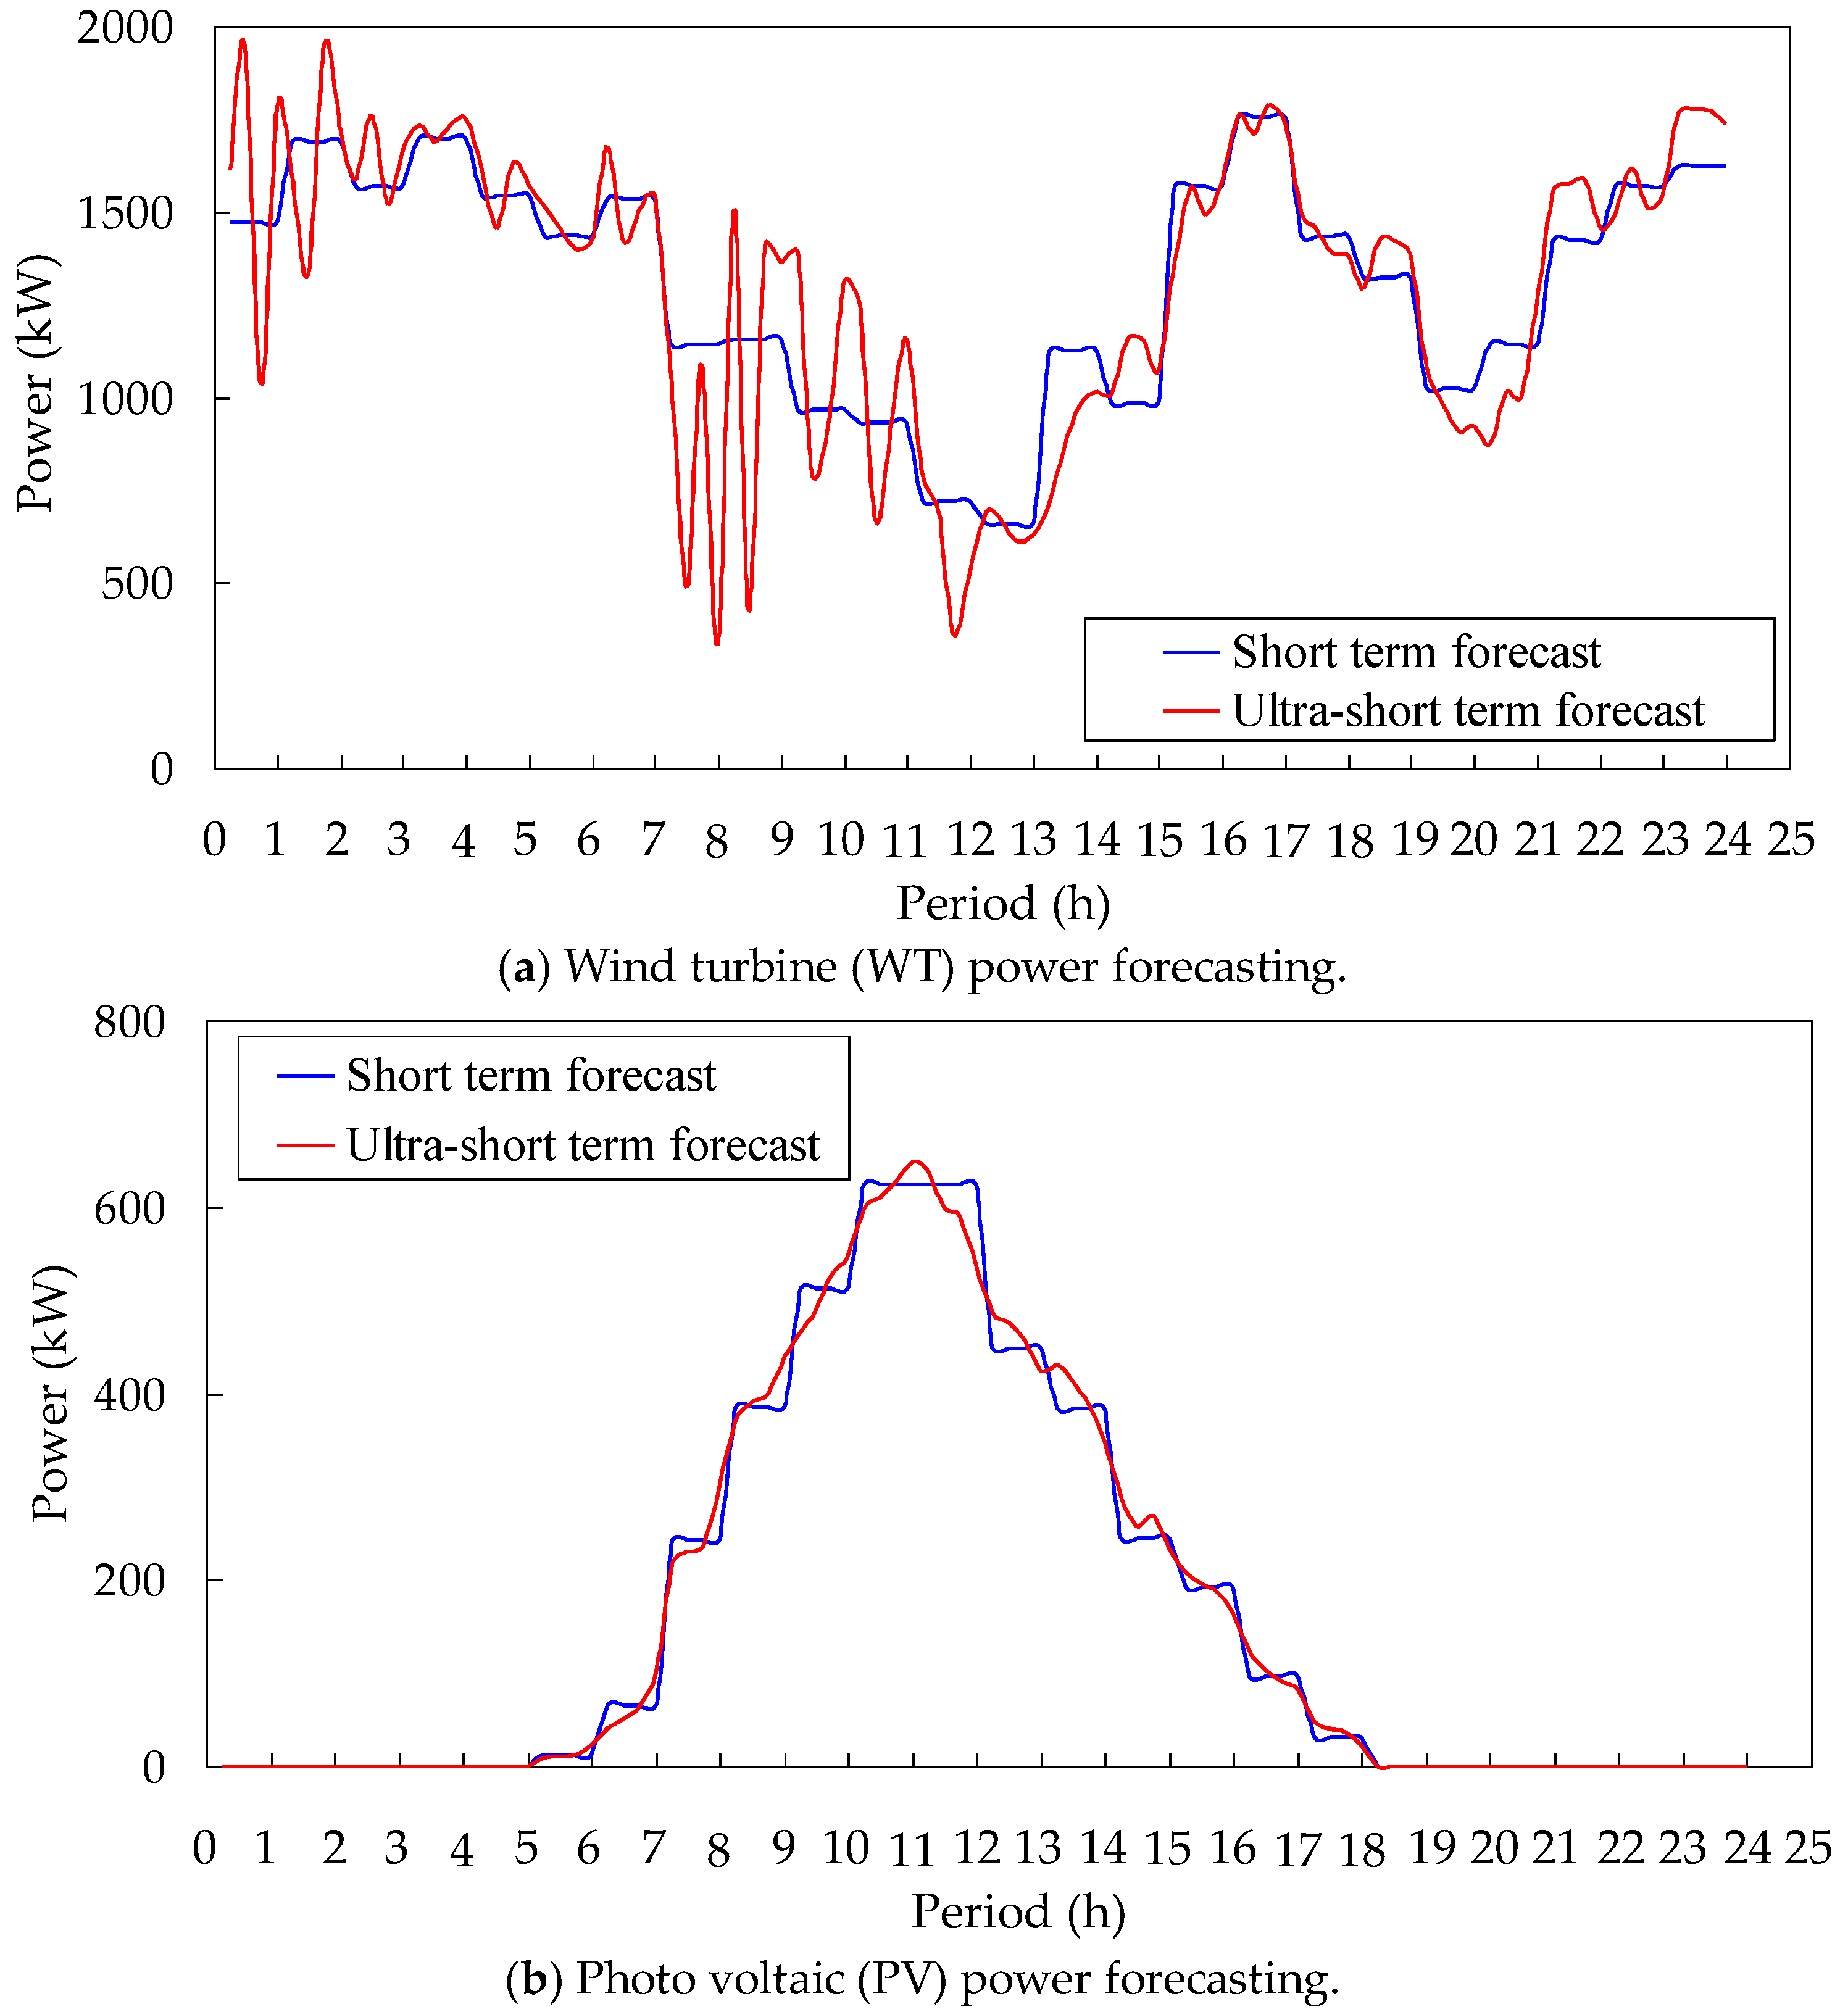
A modified IEEE 33-bus distribution system was used to validate the proposed approach, which is shown in Figure 2. Node 1 was connected to the main grid. The seawater pumped storage station, PV, WT, and flexible loads were connected to bus 6, bus 8, bus 13, and bus 17, respectively. Forecasted power outputs of REG were based on the information collected on the spot in the south of China. Typical forecast data is shown in Figure 3. Operation parameters of the seawater pumped storage and flexible loads are given in Table 1 and Table 2, respectively. In Table 2, Pf is the rated power of flexible load. Time-of-use price of general industry is given in Table 3, and these data were taken from a distribution network in China.
4.2. Day-Ahead Scheduling Results and Analysis
In order to prove the algorithm applicability of the proposed model, improved particle swarm optimizer (IPSO) [26], genetic algorithms (GA), and Cplex are used to solve the proposed model. As can be seen in Table 4, by the achievement of a better total operation cost, the ILOG Cplex over the other approaches is substantiated.
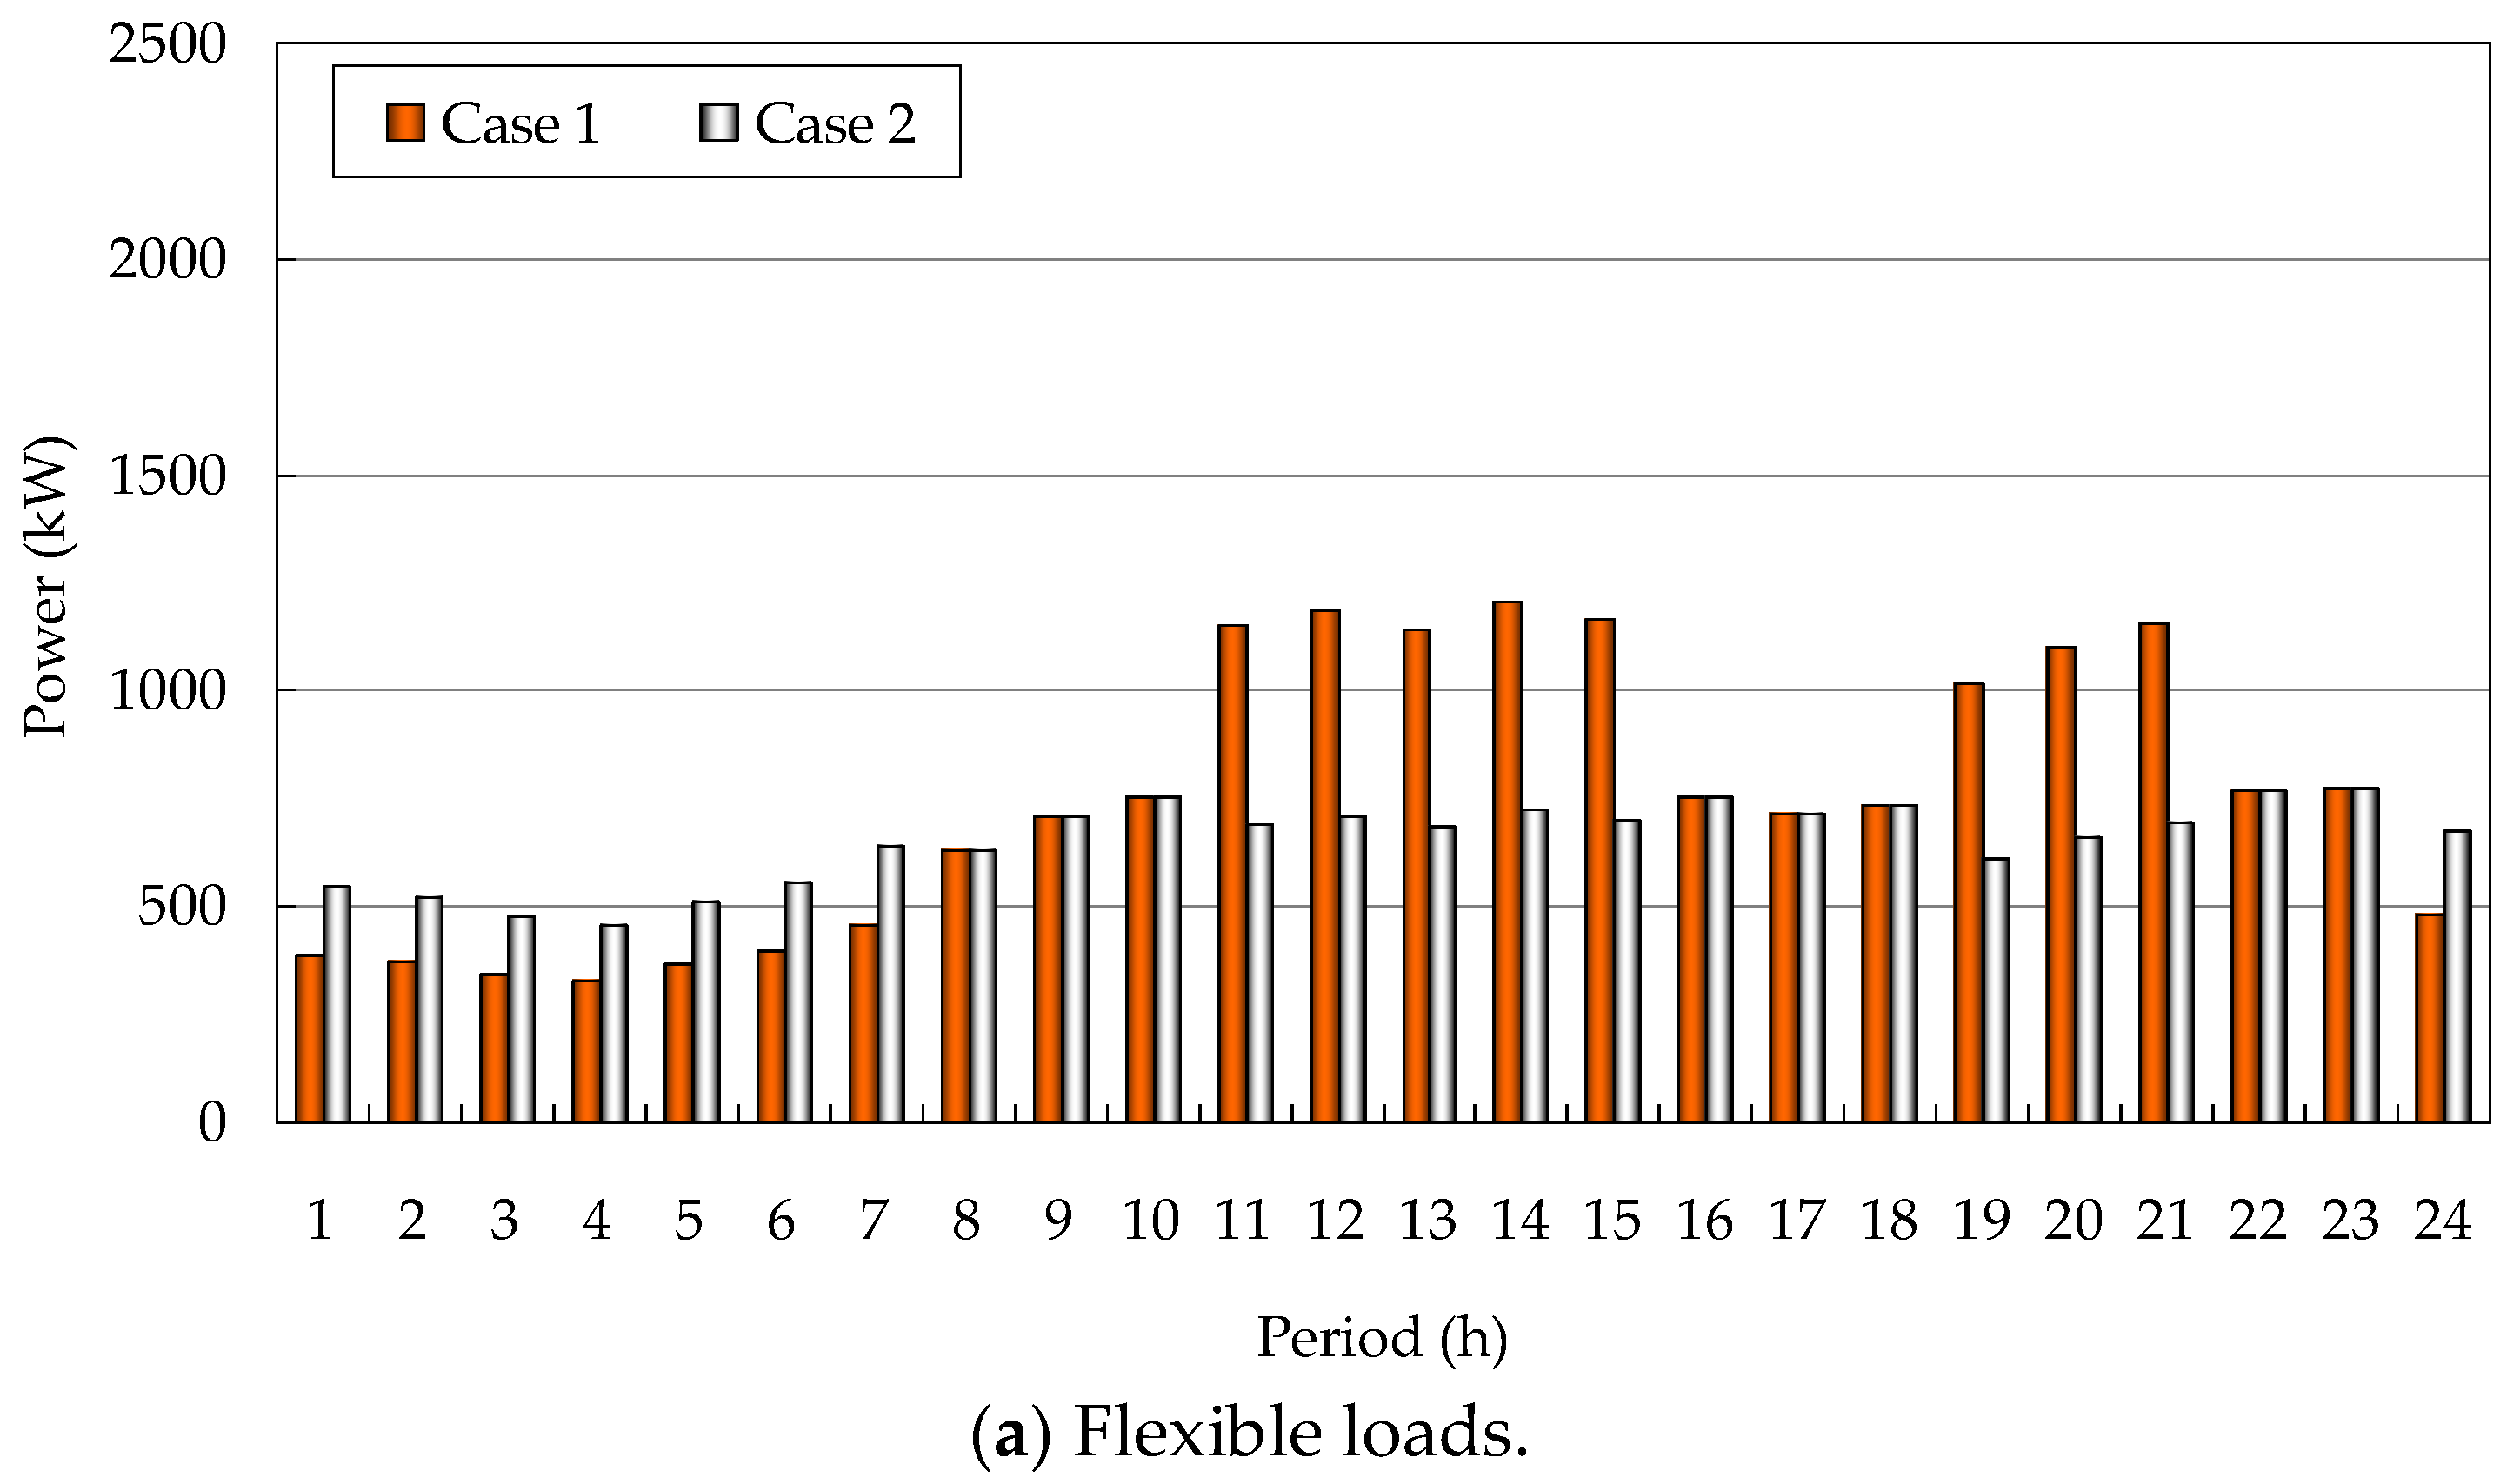
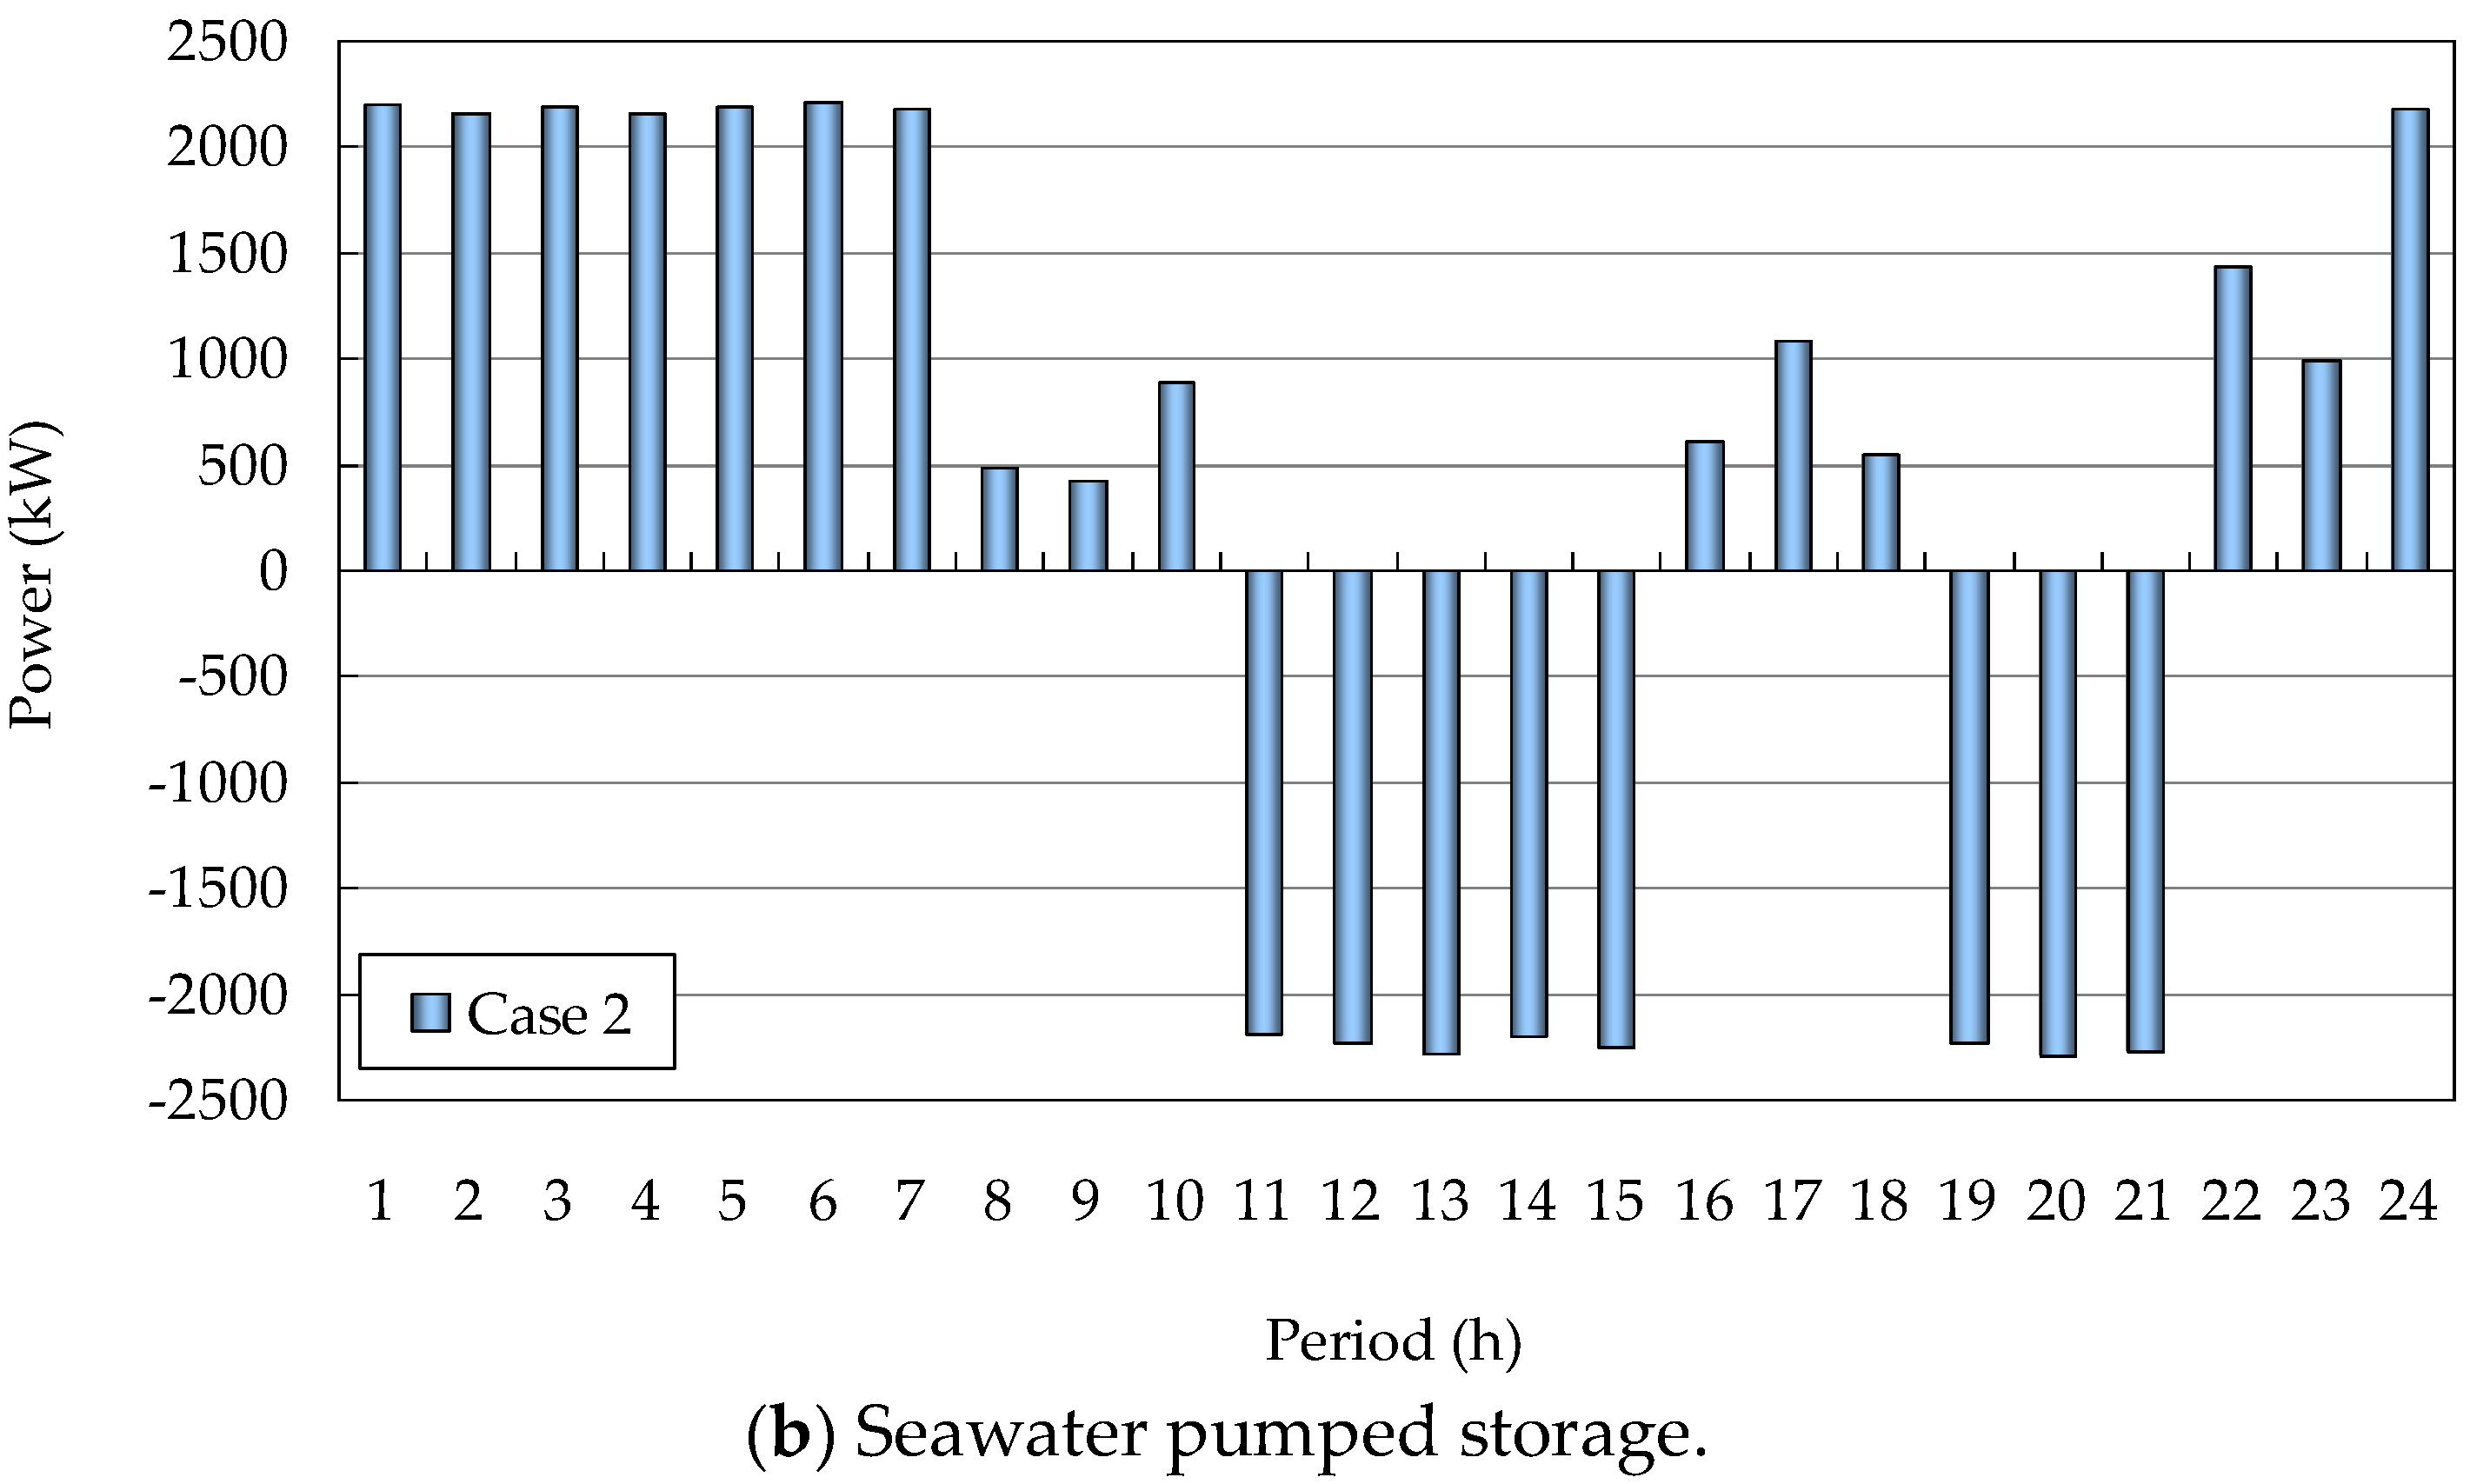
Day-ahead scheduling was performed based on short-term forecast data of WT, PV, and loads. Two cases were simulated and compared to analyze the proposed methodology. Case 1 did not contain seawater pumped storage and flexible loads. Case 2 contained seawater pumped storage and flexible loads, and the proposed methodology was applied in it. Base reserve capacities of and were 500 kW. Optimization results are shown in Figure 4, Figure 5 and Figure 6.
As shown in Figure 4, results showed that by applying the proposed model, not only did the maximum exchange power between local active distribution networks and main grid decrease about 25%, but also the maximum rate of power change was effectively reduced. Peak loads from 11:00 to 15:00 and from 19:00 to 21:00 were successfully shifted and maximum power was reduced. Valley loads from 1:00 to 8:00 were effectively filled, and minimum valley loads increased by about eight times. In Table 3, the electricity price on the open market was high from 11:00 to 15:00 and from 19:00 to 21:00, and was low from 24:00 to 7:00. As shown in Figure 5, flexible loads and seawater pumped storage could respond to the price and coordinate their power to reduce total operation cost. Power demands of flexible loads increased about 30% at low electricity price from 24:00 to 7:00, and decreased about 40% at high electricity price from 11:00 to 15:00 and from 19:00 to 21:00.
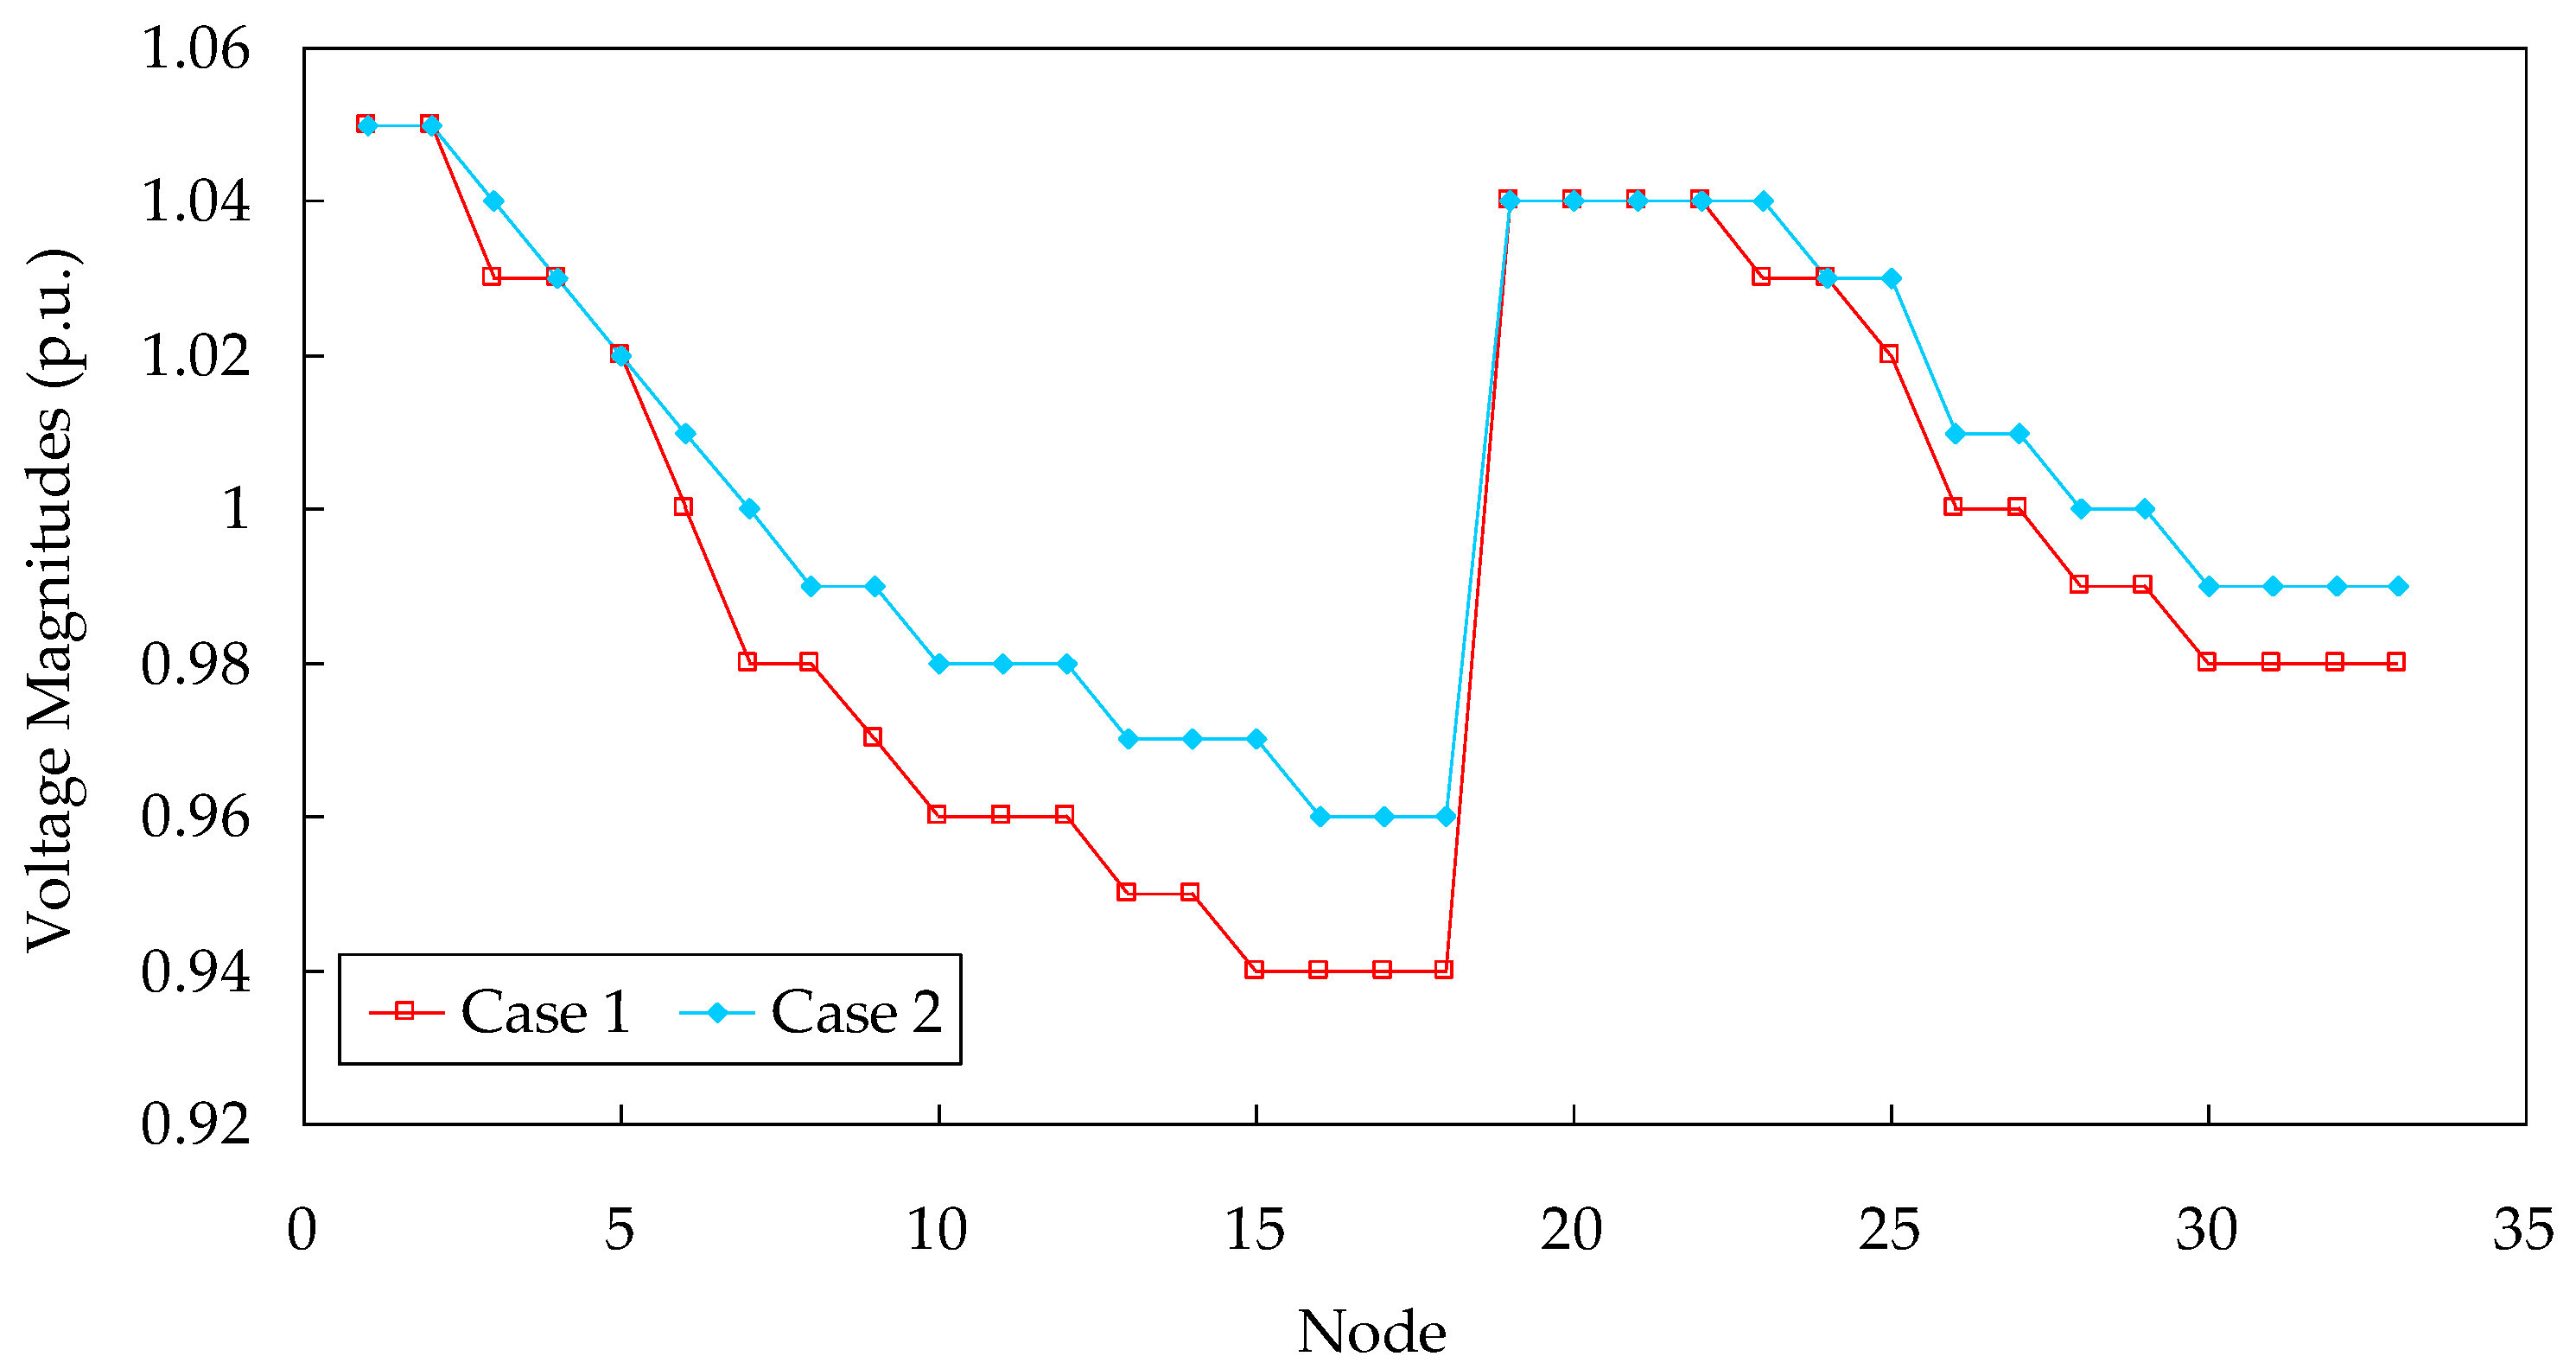
Based on the specific power system structure, power flow calculation was implemented. Periods during peak loads were taken as an example. As shown in Figure 6, utilizing the proposed methods, except for voltage magnitudes at nodes 1 to 2 and 19 to 22 which did not increase, voltage magnitudes at nodes 3 to 18 and 23 to 33 increased. This proves that the power quality of the active distribution networks were effectively improved by using the proposed method. In Table 5, cost of purchase power from the main grid and network energy loss are compared. Cost of purchase power from the main grid decreased from ¥146,915 to ¥131,886 by 10.2%. Network loss decreased from 4481 kW·h to 3862 kW·h by 13.8%.
4.3. Real-Time Scheduling Results and Analysis
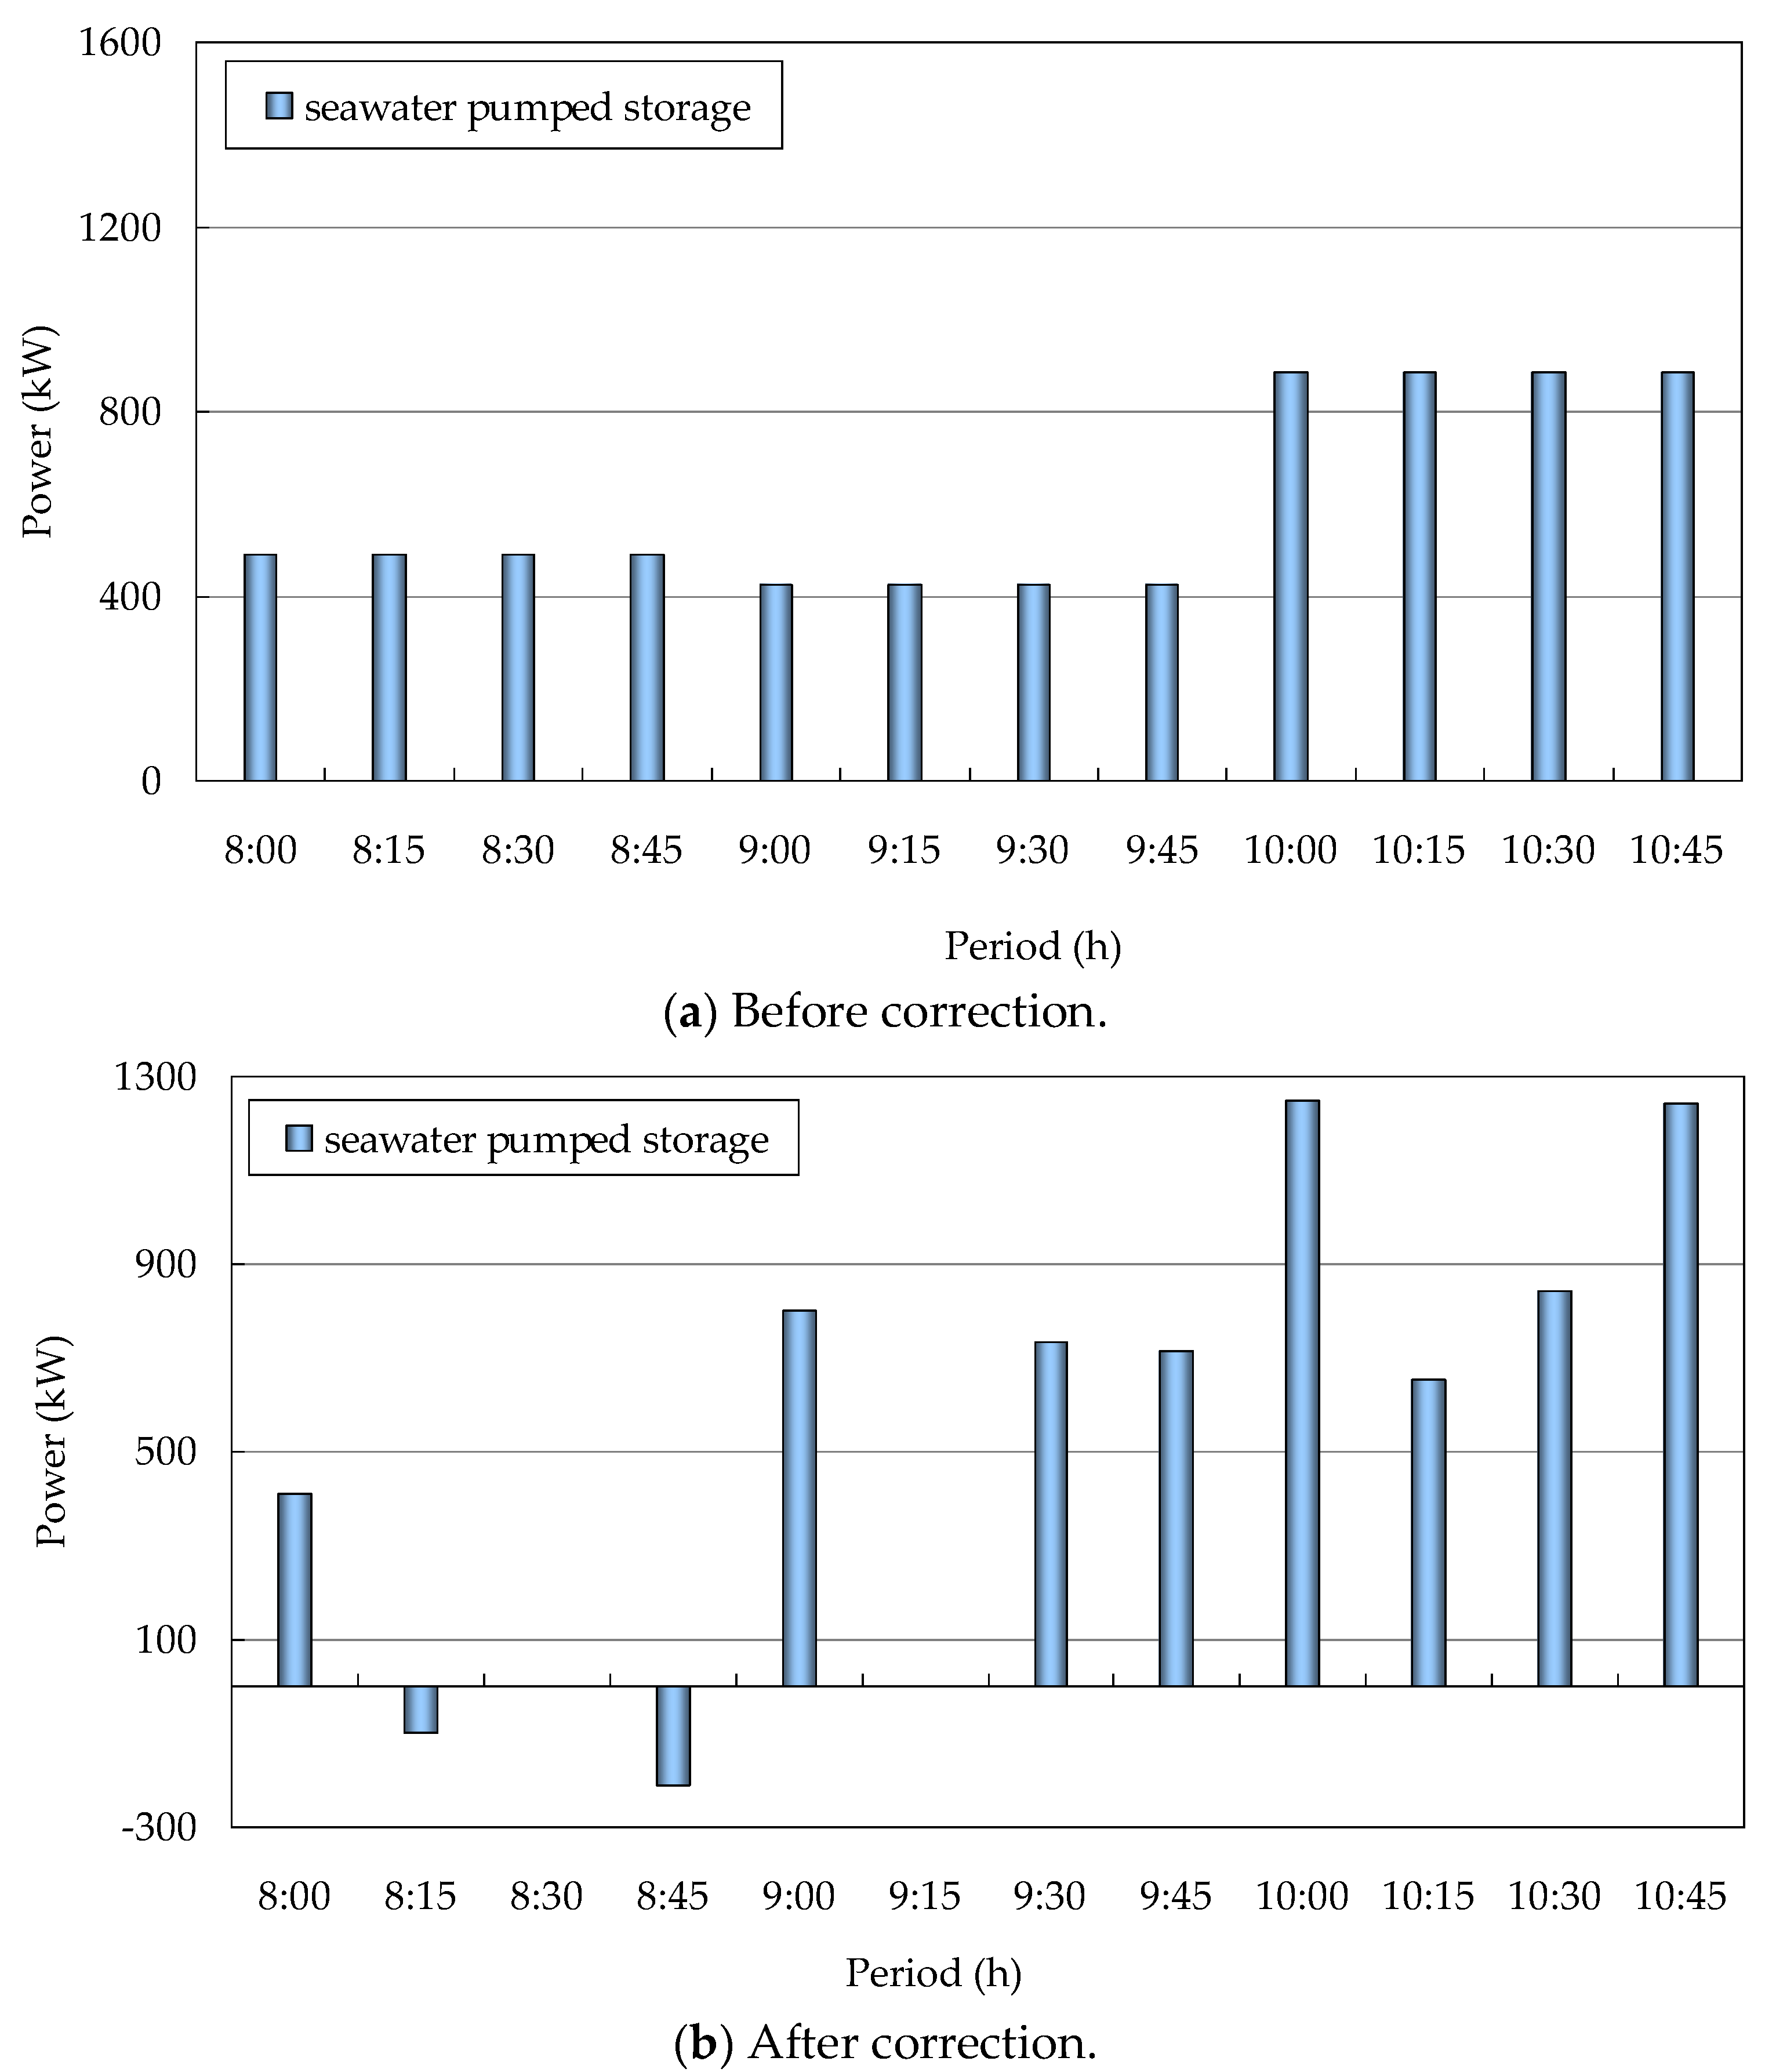
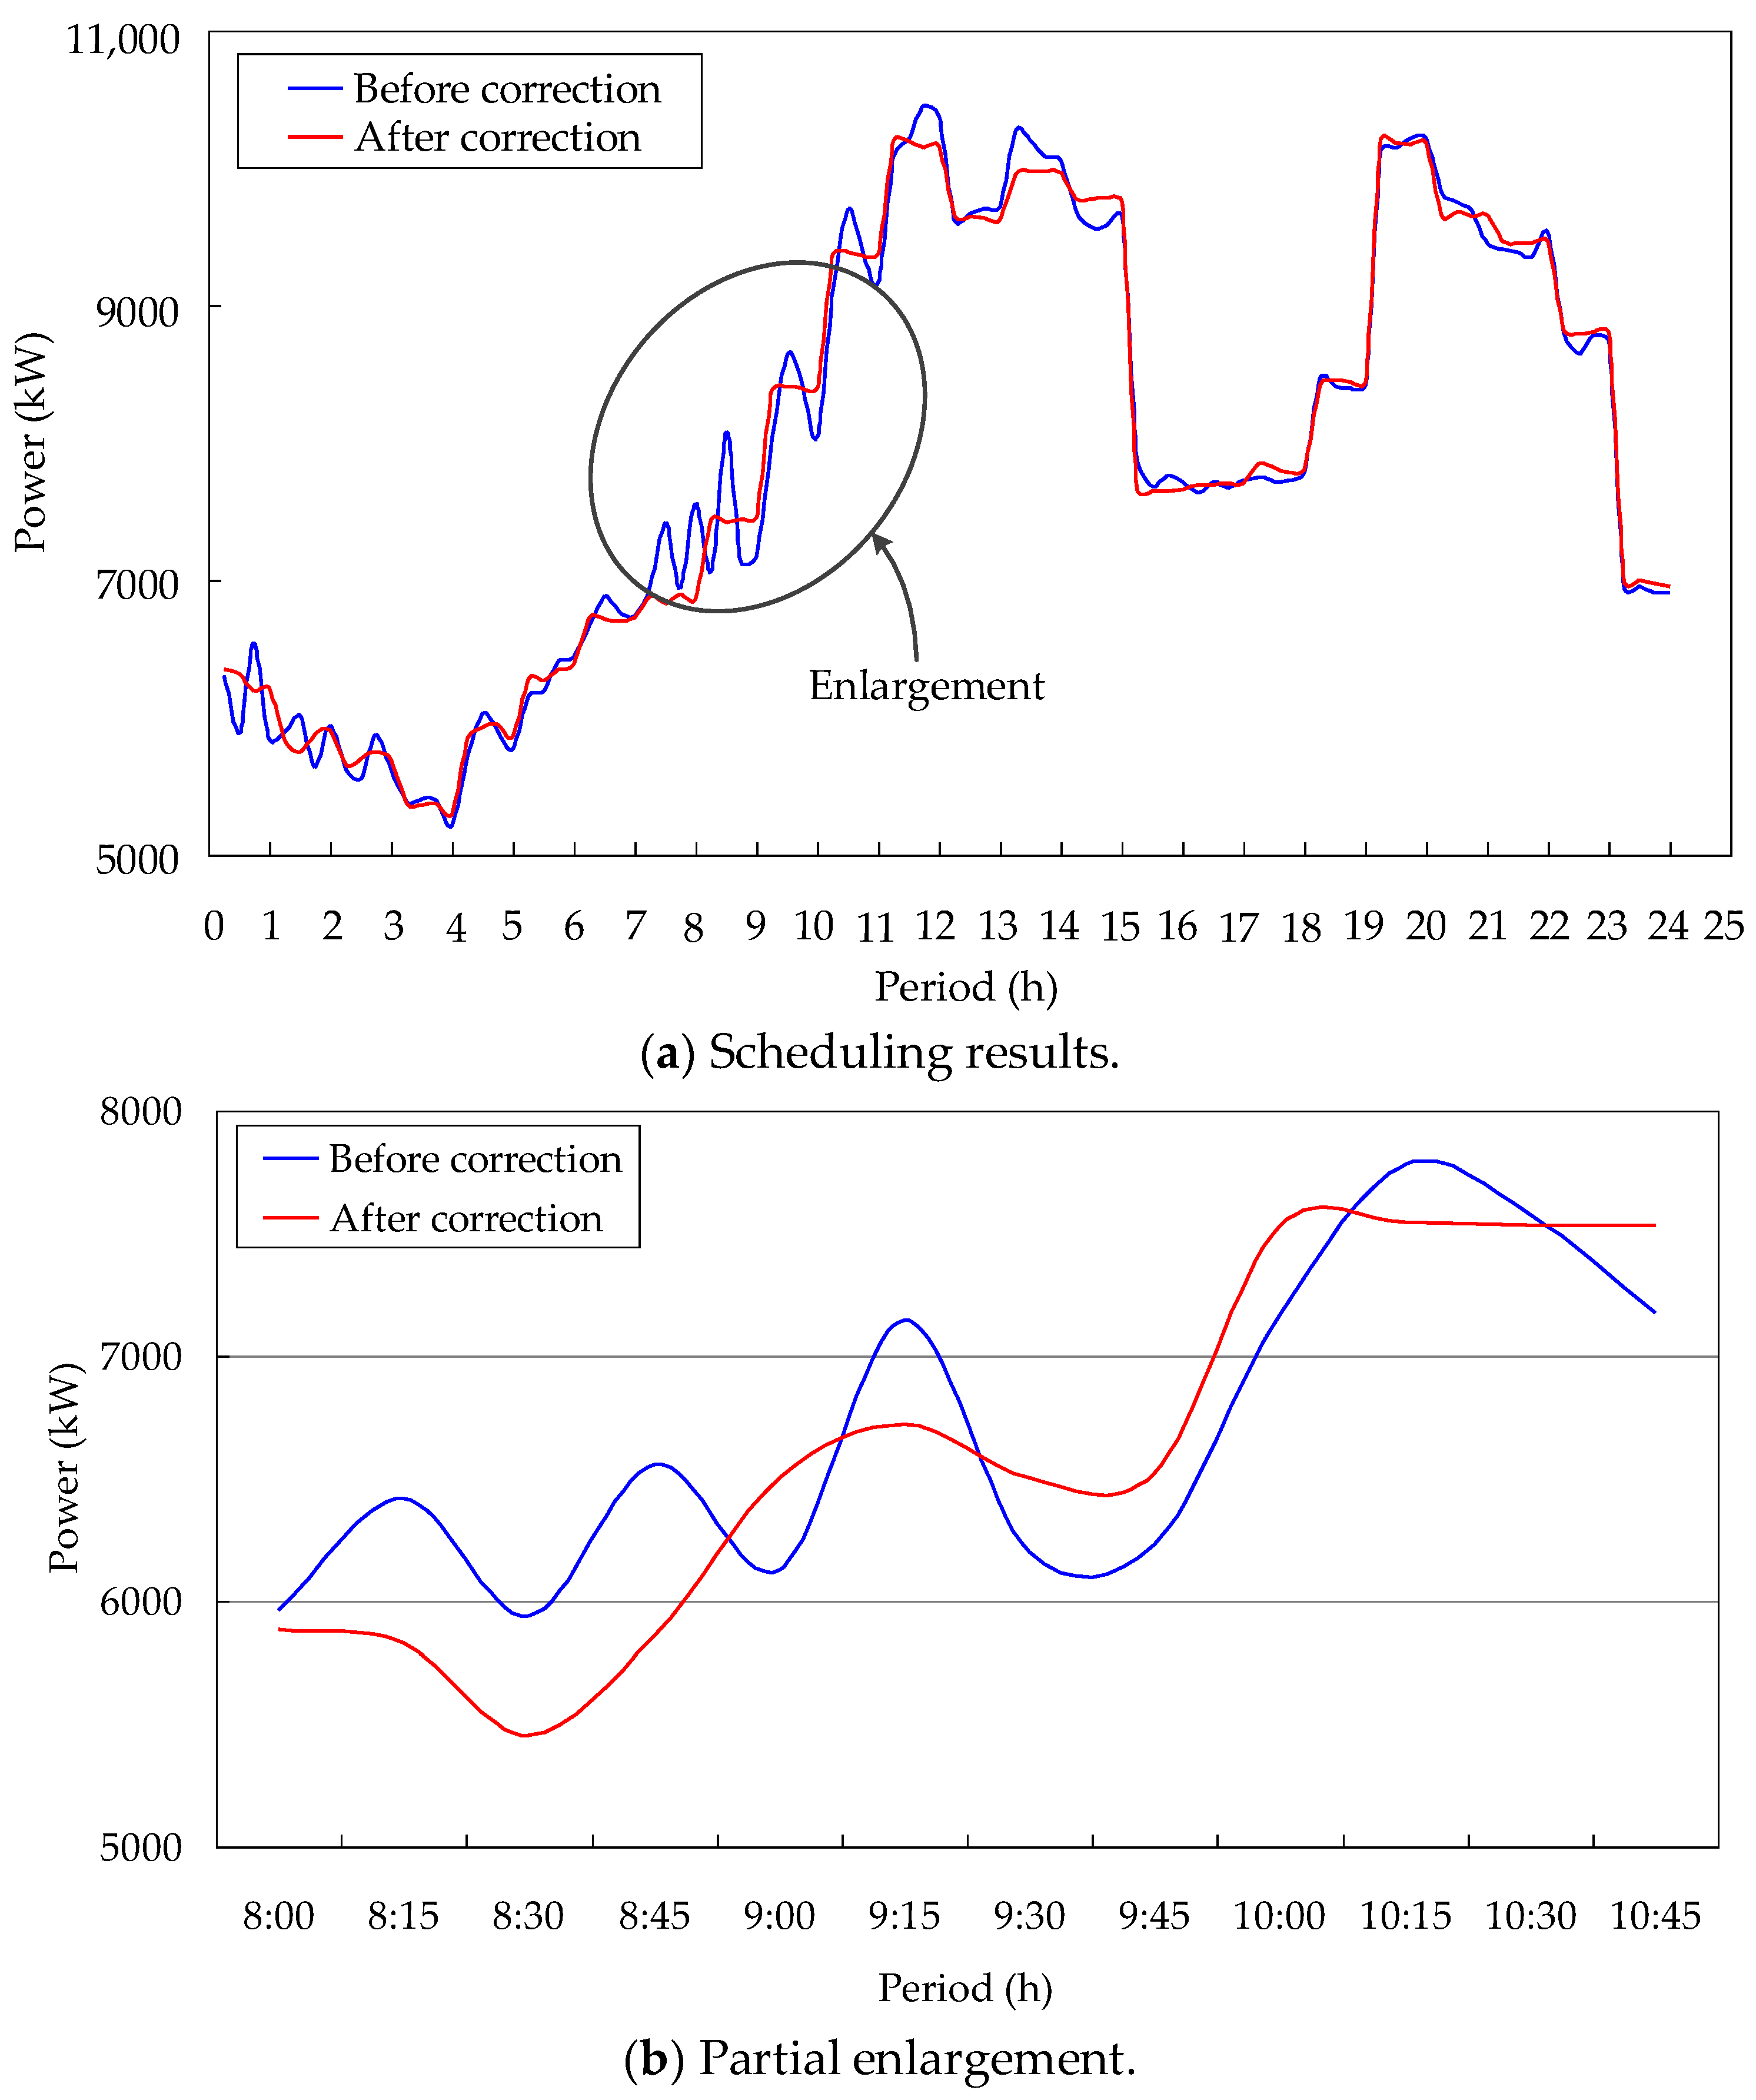
Real-time scheduling was carried out every 15 min based on ultra-short forecast data of WT and PV. Power exchange results between active distribution networks and the main grid are shown in Figure 7. Optimization results of the seawater pumped storage is shown in Figure 8. After correction, the power exchange curve is much more flat and smooth, especially in the periods with large forecast errors. Higher forecast errors needed greater correction amounts. The results demonstrated that real-time scheduling can effectively compensate for the forecast errors of REG and reduce its negative effects on the operation of local active distribution networks.
In the simulation, average execution time for day-ahead scheduling was 3.6 min and for real-time scheduling it was 19.6 s. As a result, the proposed model can be applied online for active distribution networks. Applying the proposed strategy, the overall economic benefits for active distribution networks can be promoted in the day-ahead scheduling stage. Negative influence of the forecast errors on the operation of active distribution networks can be minimized in the real-time scheduling stage. As a consequence, reserve capacity for synchronous generators in the main grid and regulation burden for automatic generation control (AGC) can be reduced.
5. Conclusions
This paper has presented a two-stage optimal scheduling model for active distribution network integration of seawater pumped storage stations, flexible loads, and renewable energy. ILOG Cplex 12.7 was called to solve the proposed model. In addition, the model was successfully tested in a modified IEEE 33-bus. Numerical results demonstrated that by applying the proposed methods in the day-ahead scheduling stage, total operation cost and the network power loss of active distribution networks could be reduced. At the same time, peak loads were shifted. In a real-time scheduling stage, the negative effects of forecast errors of renewable energy on the operation of active distribution networks were compensated and alleviated by proper coordination of a seawater pumped storage station. Utilizing the two-stage scheduling model, the performances and power quality of active distribution networks were improved. In addition, reserve capacity and regulation burden for the main grid were also effectively reduced.
Author Contributions
Conceptualization, N.L. and C.D.; Formal analysis, N.L., C.D., Y.C., W.Y., D.L., M.C., and P.P.; Funding acquisition, C.D., D.L., M.C., and P.P. All of the authors revised the manuscript.
Funding
This work was supported by National Key Research and Development Program of China (No. 2017YFB0903700, 2017YFB0903705).
Conflicts of Interest
The authors declare no conflict of interest.
Nomenclature
| Abbreviations | |
| REG | renewable energy generation |
| WT | wind turbine |
| PV | photo voltaic |
| MMS | market management systems |
| EMS | energy management systems |
| IPSO | improved particle swarm optimizer |
| GA | genetic algorithms |
| Sets, parameters and constants | |
| T, T′, t | set of indexes of the dispatch time periods |
| kg | efficiency of the turbine generator |
| ρ | density of seawater (1050 kg/m3) |
| g | gravity acceleration (9.8 m/s2) |
| h | water head height |
| qg(τ) | flow rate of water volumetric input into the turbine at the time of τ |
| qp(τ) | flow rate of water volumetric pumped from the sea at the time of τ |
| kp | efficiency of the pump-motor unit |
| Cg, Cp | start-up cost coefficient of turbine generator and pump-motor unit |
| average annual installation fee of the seawater pumped storage | |
| rsea | depreciation rate of the seawater pumped storage |
| nsea | life time of the seawater pumped storage |
| coefficient of pipelines corrosiveness cost | |
| , | piping maintenance cost coefficient of turbine generator and pump-motor unit |
| l | leakage loss and evaporation |
| , | maximum output in generating and pumping modes |
| minimum power of seawater pumped storage in pumping modes | |
| , | bottom and top limit of water amount in upper reservoir |
| , | maximum output in generating and pumping modes |
| minimum output in pumping modes | |
| Ω(t) | price of purchase electricity |
| M, N | number of interruptible loads and incentive loads |
| α, β | coefficients of interruptible loads and incentive loads |
| kc(t), ke(t) | willingness factors of interruptible loads and incentive loads |
| NWT, NPV, NL | number of WT, PV and nodes |
| PWT(m,t) | output of m th WT |
| PPV(n,t) | output of n th PV |
| PL(i,t) | rigid loads at node i |
| minimum reserve constraints in generating modes | |
| minimum reserve constraints in pumping modes | |
| , | base reserve capacities in generating and pumping modes |
| η, λ | proportional coefficient, values of both were taken as 0.2 |
| maximum purchase power from main grid in day-ahead | |
| ∆PWT(t) | prediction errors of WT |
| ∆PPV(t) | prediction errors of PV |
| PWT’(m,t) | output of m th WT |
| PPV’(n,t) | output of n th PV |
| maximum power purchase from the main grid | |
| Variables | |
| , | start-up cost of turbine generator and pump-motor unit |
| maintenance cost of the seawater pumped storage | |
| piping maintenance cost of the seawater pumped storage | |
| μg(t), μp(t) | binary variables of turbine generator and pump-motor unit |
| Pg(t), Pp(t) | output in generating and pumping modes |
| μg′(t), μp′(t) | binary variables of turbine generator and pump-motor unit |
| Pg′(t), Pp′(t) | output in generating and input in pumping modes |
| Csea(t), Cload(t) | seawater pumped storage and the response of flexible loads cost |
| Qup(t), Qup′(t) | seawater quantity of upper reservoir in day-ahead and real-time |
| fc(t), fe(t) | interruptible loads and incentive loads cost |
| uc(i,t), ue(i,t) | status of i th interruptible loads and i th incentive loads |
| Pf(t) | flexible loads |
| PGrid(t) | purchase power from main grid |
| Pc(t), Pe(t) | input of interruptible loads and incentive loads |
| PL(i,t), Pf(t) | rigid loads at node i and flexible loads |
| ∆Pg(t), ∆Pp(t) | power adjustment in generating and pumping modes |
| Pg′(t), Pgrid’(t) | power from seawater pumped storage and main grid |
References
- Bogdanov, D.; Breyer, C. North-East Asian Super Grid for 100% renewable energy supply: Optimal mix of energy technologies for electricity, gas and heat supply options. Energy Convers. Manag. 2016, 112, 176–190. [Google Scholar] [CrossRef]
- Liu, W.; Wang, S.; Chen, Y.; Chen, X.; Niu, S.; Liu, Z. Coordinate optimization of the distribution network electricity price, energy storage operation strategy, and capacity under a shared mechanism. Sustainability 2017, 9, 1080. [Google Scholar] [CrossRef]
- Zhao, H.; Guo, S. External benefit evaluation of renewable energy power in China for sustainability. Sustainability 2015, 7, 4783–4805. [Google Scholar] [CrossRef]
- Sirjani, R. Optimal Capacitor Placement in Wind Farms by Considering Harmonics Using Discrete Lightning Search Algorithm. Sustainability 2017, 9, 1669. [Google Scholar] [CrossRef]
- Zhang, G.; Jiang, C.; Wang, X.; Li, B.; Zhu, H. Bidding strategy analysis of virtual power plant considering demand response and uncertainty of renewable energy. IET Gener. Trans. Distrib. 2017, 11, 3268–3277. [Google Scholar] [CrossRef]
- Harsha, P.; Dahleh, M. Optimal management and sizing of energy storage under dynamic pricing for the efficient integration of renewable energy. IEEE Trans. Power Syst. 2015, 30, 1164–1181. [Google Scholar] [CrossRef]
- Shi, N.; Luo, Y. Energy Storage System Sizing Based on a Reliability Assessment of Power Systems Integrated with Wind Power. Sustainability 2017, 9, 395. [Google Scholar] [CrossRef]
- Ho, W.S.; Macchietto, S.; Lim, J.S.; Hashim, H.; Muis, Z.A.; Liu, W.H. Optimal scheduling of energy storage for renewable energy distributed energy generation system. Renew. Sust. Energy Rev. 2016, 58, 1100–1107. [Google Scholar] [CrossRef]
- Katsaprakakis, D.A.; Christakis, D.G. Seawater pumped storage systems and offshore wind parks in islands with low onshore wind potential. A fundamental case study. Energy 2014, 66, 470–486. [Google Scholar] [CrossRef]
- Pannatier, Y.; Kawkabani, B.; Nicolet, C.; Simond, J.J.; Schwery, A.; Allenbach, P. Investigation of control strategies for variable-speed pump-turbine units by using a simplified model of the converters. IEEE Trans. Ind. Electron. 2010, 57, 3039–3049. [Google Scholar] [CrossRef]
- Liu, H.; Tang, C.; Han, J.; Li, T.; Li, J.; Zhang, K. Probabilistic load flow analysis of active distribution network adopting improved sequence operation methodology. IET Gener. Trans. Distrib. 2017, 11, 2147–2153. [Google Scholar] [CrossRef]
- Zheng, W.; Wu, W.; Zhang, B.; Wang, Y. Robust reactive power optimisation and voltage control method for active distribution networks via dual time-scale coordination. IET Gener. Trans. Distrib. 2017, 11, 1461–1471. [Google Scholar] [CrossRef] [Green Version]
- Ahmadian, A.; Sedghi, M.; Elkamel, A.; Aliakbar-Golkar, M.; Fowler, M. Optimal WDG planning in active distribution networks based on possibilistic–probabilistic PEVs load modelling. IET Gener. Trans. Distrib. 2017, 11, 865–875. [Google Scholar] [CrossRef]
- Ochoa, L.F.; Dent, C.J.; Harrison, G.P. Distribution network capacity assessment: Variable DG and active networks. IEEE Trans. Power Syst. 2010, 25, 87–95. [Google Scholar] [CrossRef]
- Cecati, C.; Buccella, C.; Siano, P.; Piccolo, A. Optimal operation of Smart Grids with demand side management. In Proceedings of the IEEE International Conference on Industrial Technology, Cape Town, South Africa, 25–28 February 2013; pp. 2010–2015. [Google Scholar]
- Tan, J.; Wang, L. Enabling reliability-differentiated service in residential distribution networks with PHEVs: A hierarchical game approach. IEEE Trans. Smart Grid 2016, 7, 684–694. [Google Scholar] [CrossRef]
- Gill, S.; Kockar, I.; Ault, G.W. Dynamic optimal power flow for active distribution networks. IEEE Trans. Power Syst. 2014, 29, 121–131. [Google Scholar] [CrossRef] [Green Version]
- Lin, C.; Wu, W.; Chen, X.; Zheng, W. Decentralized dynamic economic dispatch for integrated transmission and active distribution networks using multi-parametric programming. IEEE Trans. Smart Grid 2017, 1. [Google Scholar] [CrossRef]
- Wang, D.; Meng, K.; Luo, F.; Coates, C.; Gao, X.; Dong, Z.Y. Coordinated dispatch of networked energy storage systems for loading management in active distribution networks. IET Renew. Power Gener. 2016, 10, 1374–1381. [Google Scholar] [CrossRef]
- Westermann, D.; Nicolai, S.; Bretschneider, P. Energy management for distribution networks with storage systems—A hierarchical approach. In Proceedings of the IEEE PES General Meeting, Conversion and Delivery of Electric Energy in the 21st Century, Pittsburgh, PA, USA, 20–24 July 2008. [Google Scholar]
- Doostizadeh, M.; Ghasemi, H. Day-ahead scheduling of an active distribution network considering energy and reserve markets. Int. Trans. Electr. Energy Syst. 2013, 23, 930–945. [Google Scholar] [CrossRef]
- Zhang, L.; Tang, W.; Liang, J.; Cong, P.; Cai, Y. Coordinated day-ahead reactive power dispatch in distribution network based on real power forecast errors. IEEE Trans. Power Syst. 2016, 31, 2472–2480. [Google Scholar] [CrossRef]
- Liu, Y.; Nair, N.K.C. A Two-stage Stochastic dynamic economic dispatch model considering wind uncertainty. IEEE Trans. Sustain. Energy 2016, 7, 819–829. [Google Scholar] [CrossRef]
- Sachs, J.; Sawodny, O. A two-stage model predictive control strategy for economic diesel-PV-battery island microgrid operation in rural areas. IEEE Trans. Sustain. Energy 2016, 7, 903–913. [Google Scholar] [CrossRef]
- Tan, Y.; Cao, Y.; Li, C.; Li, Y.; Zhou, J.; Song, Y. A two-stage stochastic programming approach considering risk level for distribution networks operation with wind power. IEEE Syst. J. 2016, 10, 117–126. [Google Scholar] [CrossRef]
- Zhao, J.; Wen, F.; Dong, Z.Y.; Xue, Y.; Wong, K.P. Optimal dispatch of electric vehicles and wind power using enhanced particle swarm optimization. IEEE Trans. Ind. Inform. 2012, 8, 889–899. [Google Scholar] [CrossRef]
Figure 1.
Flowchart of the proposed approach.

Figure 2.
Modified IEEE 33-bus distribution system.
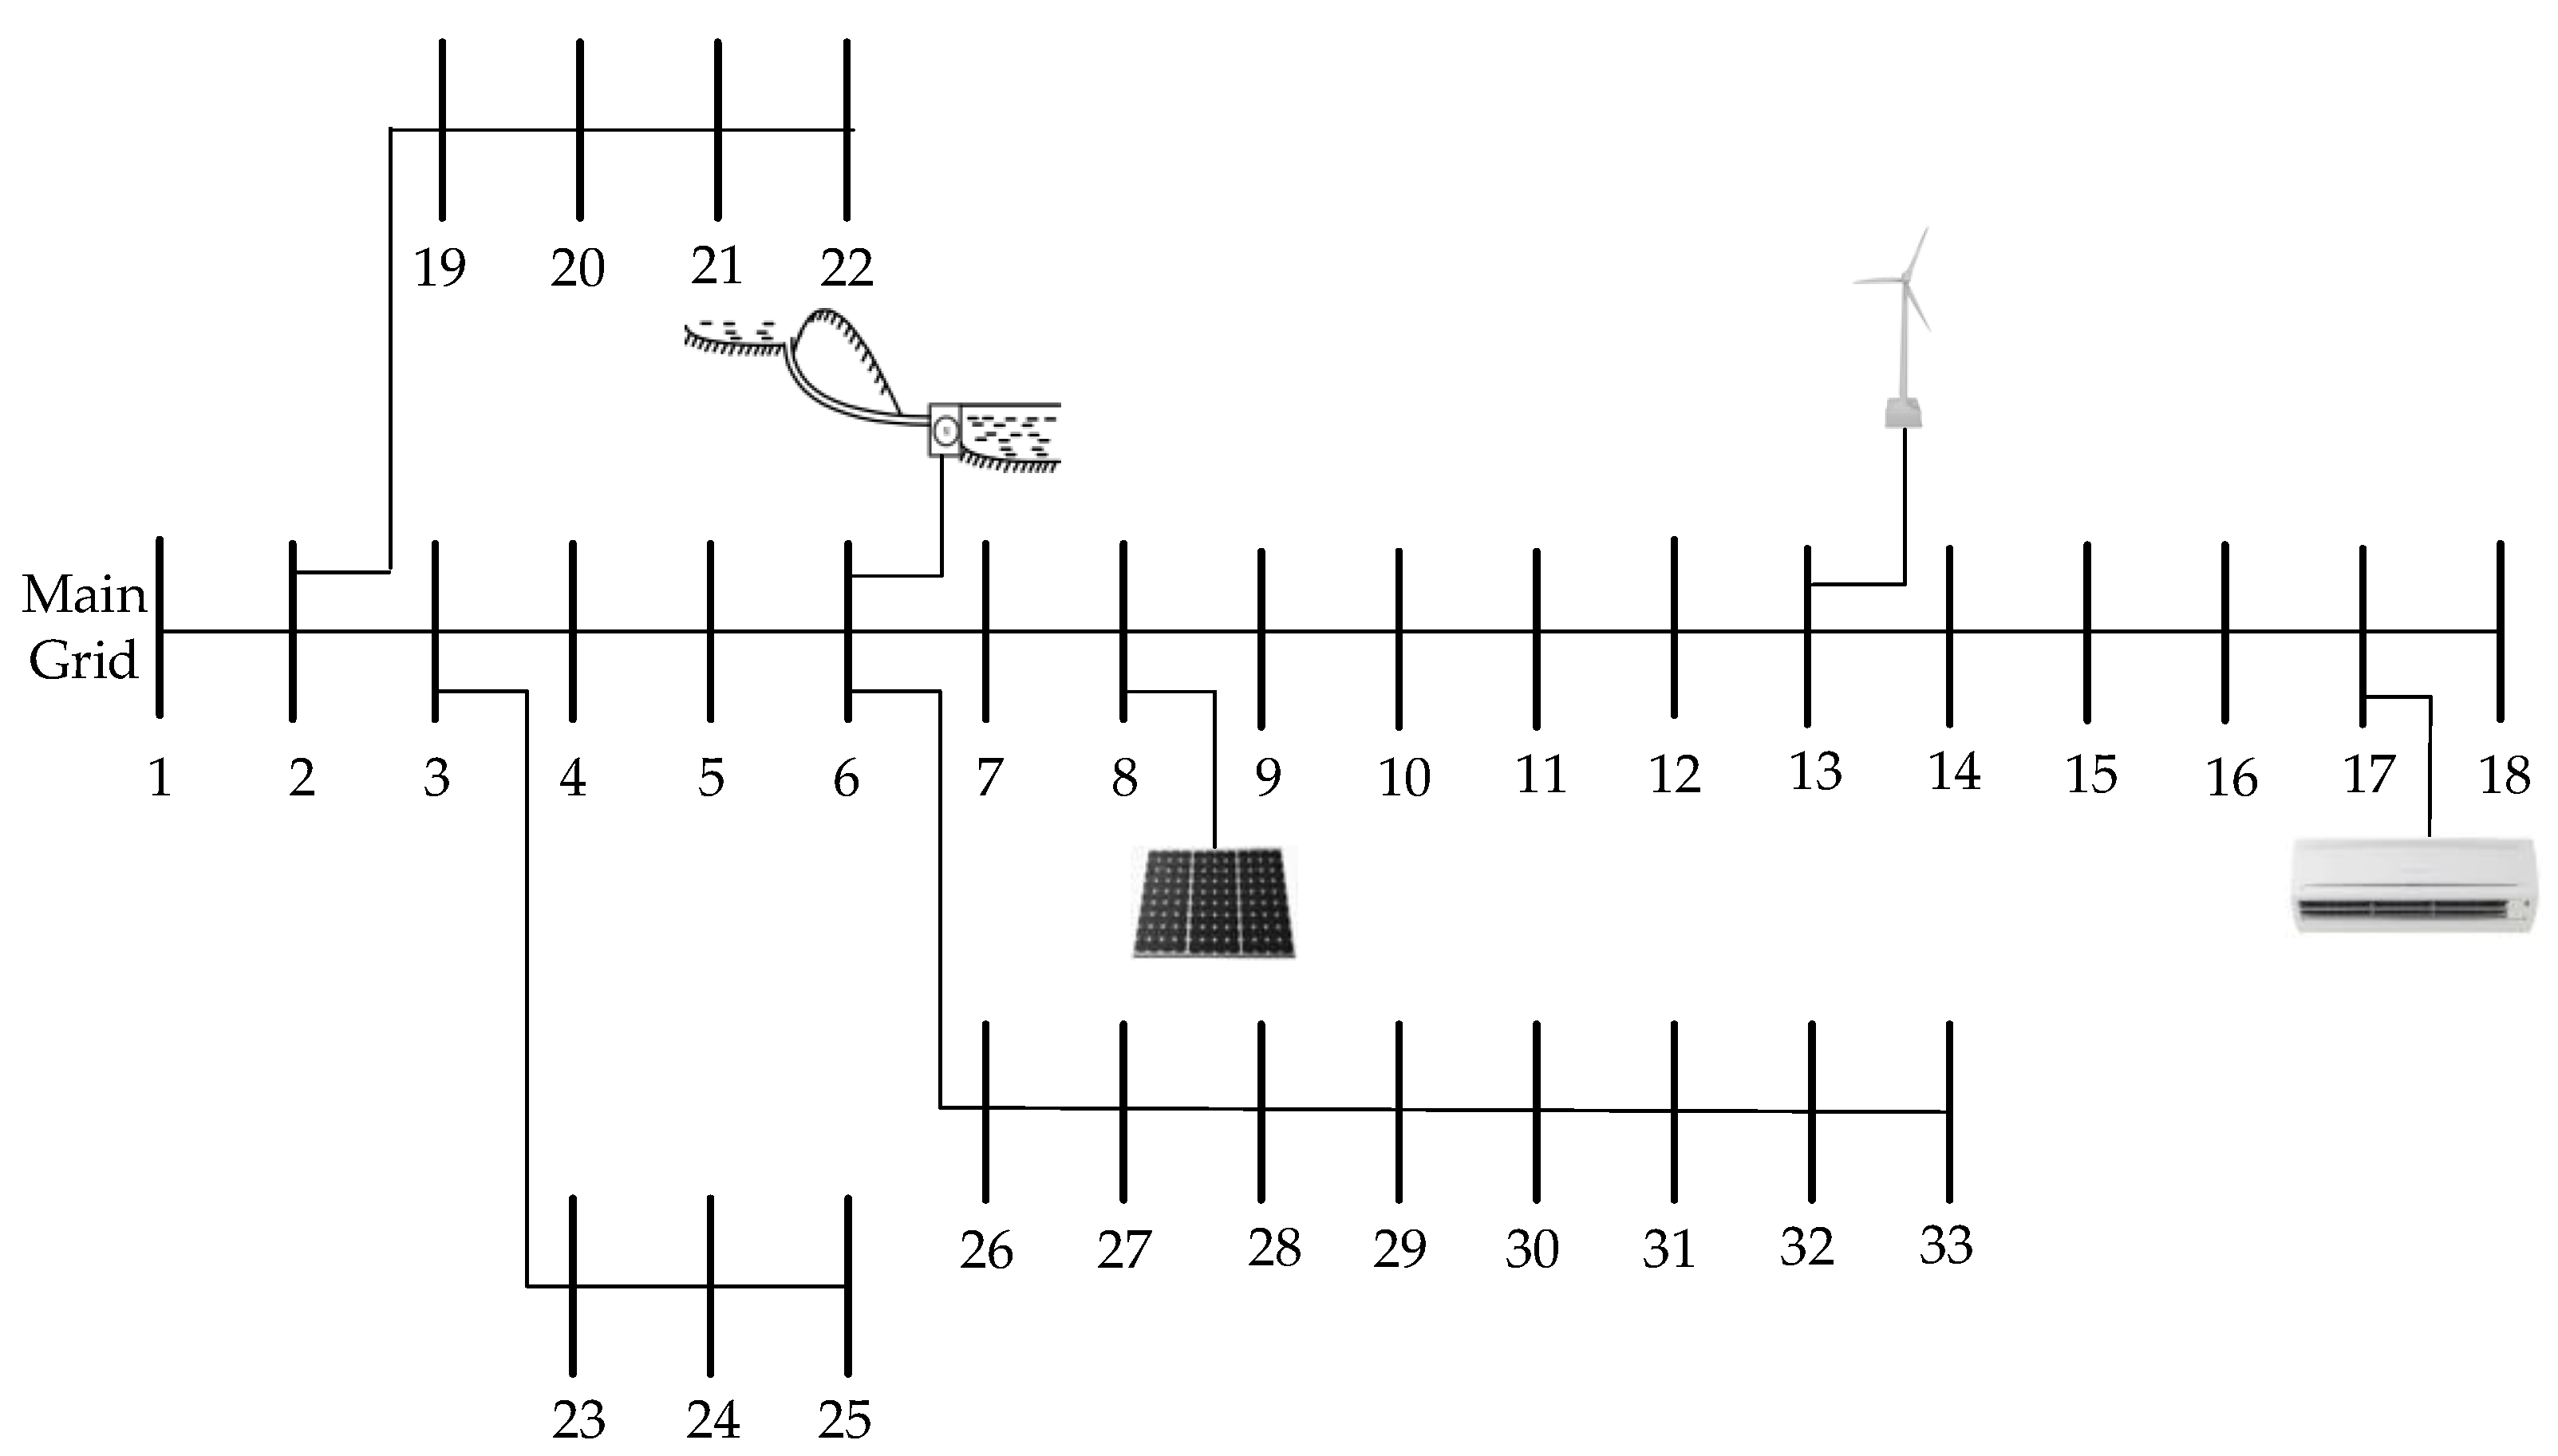
Figure 3.
Renewable energy forecasting data.

Figure 4.
Power exchange with main grid of two cases in day-ahead scheduling.
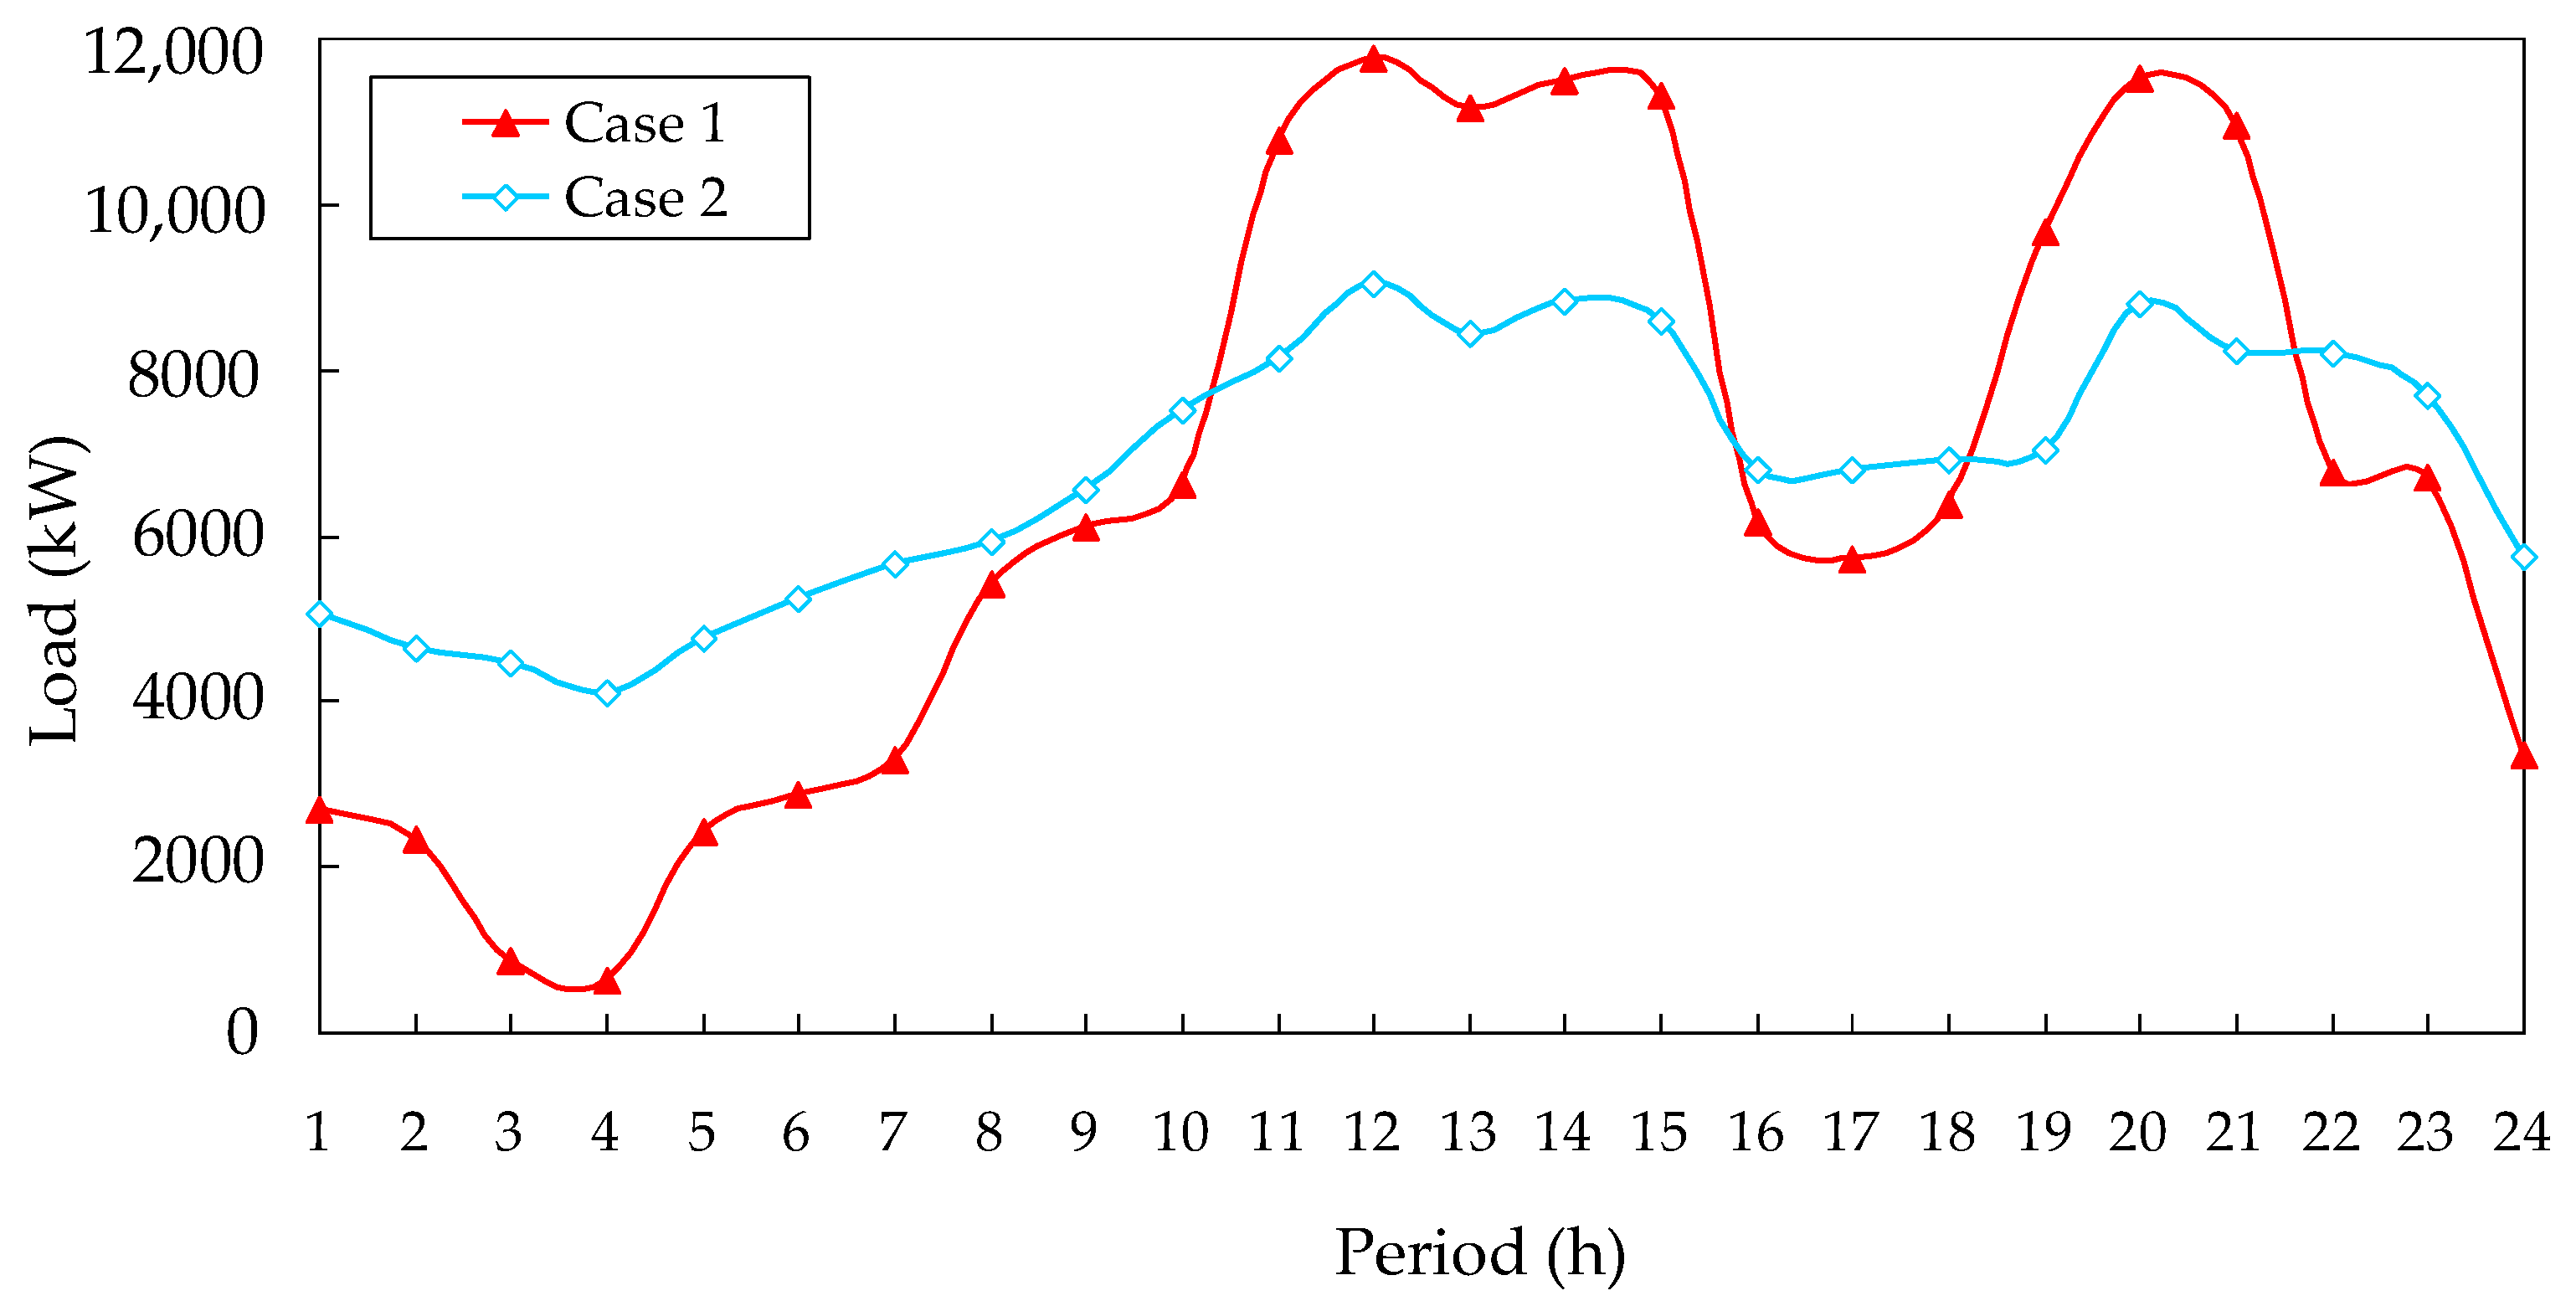
Figure 5.
Optimization results of flexible loads and seawater pumped storage.


Figure 6.
Power flow results of voltage magnitudes in peak load period.

Figure 7.
Power exchange with main grid in real-time scheduling.

Figure 8.
Real-time optimization results of seawater pumped storage.

Table 1.
Parameters of seawater pumped storage.
| Maximum Power (kW) | Life Time (y) | kg/kp | |
|---|---|---|---|
| Generating mode | 3000 | 40 | 0.91 |
| Pumping mode | 3000 | 40 | 0.82 |
Table 2.
Parameters of flexible loads.
| Variation Range | α1 ¥/h | α2 ¥/kW·h | β1 ¥/(kW·h) | β2 ¥/(kW·h) |
|---|---|---|---|---|
| [0.6Pf, 1.4Pf] | 0.0002 | 0.25 | 0.00025 | 0.1 |
Table 3.
Time-of-use price of general industry.
| Period (h) | Price ¥/kW∙h | |
|---|---|---|
| Peak | [11:00, 16:00); [19:00, 22:00) | 1.2 |
| Off-peak | [08:00, 11:00); [16:00, 19:00); [22:00, 24:00) | 0.7 |
| Valley | [24:00, 08:00) | 0.3 |
Table 4.
Comparison of total operation.
| Method | Total Operation Cost (¥) | Running Time (min) |
|---|---|---|
| IPSO | 136,247 | 6.4 |
| GA | 135,774 | 8.8 |
| Cplex | 131,886 | 3.6 |
IPSO = improved particle swarm optimizer; GA = genetic algorithms.
Table 5.
Cost of purchase power and network loss.
| The Cost of Purchase Power from Main Grid (¥) | Network Loss (kW·h) | |
|---|---|---|
| Case 1 | 146,915 | 4481 |
| Case 2 | 131,886 | 3862 |
© 2018 by the authors. Licensee MDPI, Basel, Switzerland. This article is an open access article distributed under the terms and conditions of the Creative Commons Attribution (CC BY) license (http://creativecommons.org/licenses/by/4.0/).
Share and Cite
MDPI and ACS Style
Liang, N.; Deng, C.; Chen, Y.; Yao, W.; Li, D.; Chen, M.; Peng, P. Two-Stage Coordinate Optimal Scheduling of Seawater Pumped Storage in Active Distribution Networks. Sustainability 2018, 10, 2014. https://doi.org/10.3390/su10062014
AMA Style
Liang N, Deng C, Chen Y, Yao W, Li D, Chen M, Peng P. Two-Stage Coordinate Optimal Scheduling of Seawater Pumped Storage in Active Distribution Networks. Sustainability. 2018; 10(6):2014. https://doi.org/10.3390/su10062014
Chicago/Turabian StyleLiang, Ning, Changhong Deng, Yahong Chen, Weiwei Yao, Dinglin Li, Man Chen, and Peng Peng. 2018. "Two-Stage Coordinate Optimal Scheduling of Seawater Pumped Storage in Active Distribution Networks" Sustainability 10, no. 6: 2014. https://doi.org/10.3390/su10062014
Note that from the first issue of 2016, this journal uses article numbers instead of page numbers. See further details here.