Material Transitions and Associated Embodied Energy Input of Rural Buildings: Case Study of Qinyong Village in Ningbo China


Department of Architecture and Built Environment, University of Nottingham Ningbo China, 199 Taikang East Road, Ningbo 315000, China
*
Author to whom correspondence should be addressed.
Sustainability 2018, 10(6), 2016; https://doi.org/10.3390/su10062016
Submission received: 10 April 2018
/
Revised: 10 June 2018
/
Accepted: 11 June 2018
/
Published: 14 June 2018
(This article belongs to the Section Sustainable Urban and Rural Development)
Abstract
:From the early 1980s onward, construction practice in rural China has shown a gradual transformation from using locally available materials to urban-like and highly processed modern building materials. This transition may have a significant impact on a building’s environmental performance, such as its indoor thermal comfort and embodied energy intensity. This paper examines three types of houses built in a village in China in the 1970s, the 1980s, and the 1990s. The research indicates that replacing traditional materials with modern ones has not improved the indoor thermal comfort equally with the increase of embodied energy input. Dismantling traditional houses to give way to new houses with modern materials is not the way to improve indoor thermal comfort. The buildings completed in the 1980s and the 1990s in rural China require special attention in future thermal retrofitting plans.
1. Introduction
China’s rural villages have been experiencing radical transitions since the early 1980s, when the People’s Republic shifted its political focus towards modernization and economic development. Since then, Chinese cities have embraced a rapid process of urbanization, while villages have been left far behind in socio-economic development. In general, the development of most Chinese villages often falls into two directions: to be gradually abandoned and then demolished for new urban-like development, or to undertake a similar modernization process and become small towns. Both directions have led to an irreversible loss of the local or vernacular characteristics that have naturally evolved over time. Along with the fading away of traditional village patterns and architecture forms, it is sobering that there is a clear shift from natural and vernacular construction materials to modern manufactured ones. Such a transition, as observed by Mani and Reddy [1] and Shastry et al. [2], may have an impact on a building’s environmental performance (e.g., thermal comfort, energy consumption) especially for rural houses. For example, using modern materials, which are usually far from their natural state and require longer transportation distances, will increase the energy intensity of the house.
Archaeological findings indicate that building materials significantly affect architectural form, which further has a certain degree of influence in shaping the space and communication patterns [3]. In earlier times, the types of materials used in architecture were a direct result of the local environment [3,4,5]. People used to seek construction materials that were available locally, and as a result they were both economic and appropriate. Apart from this, the choice of materials is also linked to the social and ideological spheres [3]. As Vellinga pointed out [6], it is impossible to study the house and its cultural meaning without looking at its material aspect.
The use of vernacular construction materials has a long history in different ancient cultures; for example, limestone, granite, and basalt were used to build the Great Pyramid of Giza in Egypt, and limestone and clay were the main materials for the Great Wall in China. The Chinese traditional buildings have illustrated a variety of examples for vernacular construction materials in different climatic regions across the country; for example, houses with rammed earth walls in the cold and dry climate, houses with timber roofing and rubble stone walls in the hot summer and cold winter regions, and bamboo often used in the tropic climate. These materials are locally available and processed. The traditional construction practices were responsive to the climate context, combining with specific passive building design.
From the early 1980s onward, the traditional construction practices in the Chinese rural areas have shown a gradual transformation from locally available materials to modern materials such as concrete, steel, prefabricated roofing sheets, etc. These materials and elements are usually manufactured in factories and sold in a commercialized construction materials market. This may have a significant adverse impact on energy consumption in Chinese rural areas. Given the huge volume of the rural building stock in China, the transition from vernacular materials to modern materials is thus worth of examining in depth.
The phenomenon of rural transitions in less developed countries and economies is yet to be recognized for its potentially significant impact on the environment [1]. Little research has been undertaken to model life cycle material and energy flows for rural buildings in China, let alone that of tracking the transitions between construction materials that have been used at different times. Studies have been typically focused on either the national total building stock [7,8] or highly developed urban settlements [9,10,11]. There is no retrospective research found in the published literature that elaborates the correlations between indoor thermal comfort and embodied energy input over a transitional period in rural areas in China. This paper explores a case study village in China and discusses how material transitions would affect indoor thermal comfort and embodied energy consumption in rural houses.
2. Transitions of Construction Materials in Rural Areas in China
The 2009 Annual Report of China Building Energy Efficiency [12] estimated that the rural building area was around 22.1 billion square meters (sq.m), accounting for 56% of the national total building stock. The energy consumption of rural buildings had increased between 1999–2008 at an annual growth rate of 5.6% and reached 924.6 billion kWh in 2011, which was more than twice the urban residential energy use, and it represented approximately 40% of the total consumed energy [13]. Such a remarkable increase can be mainly attributed to two factors: the increase of housing area per capita, and the increase of living standards. According to the China National Bureau of Statistics (CNBS), from 1980 to 2010, per capita floor space of the residential building in the rural area has been increased from 9.4 sq.m to 34.1 sq.m [14], which is nearly four times higher. Furthermore, more household electric appliances have become affordable for rural families; for example, 25.36% of rural households owned an air-conditioning system in 2012, which had increased from only 1.32% in 2000 [14]. It should be noted that the embodied energy was not involved in the estimate, which was used for manufacturing construction materials. As synthesized by Yang and Kohler [8], the ratio of the building operational energy to the national total energy consumption varied between 17.7% and 27.0%. If the embodied energy in the building material is taken into account, the percentage would be over 45% [15].
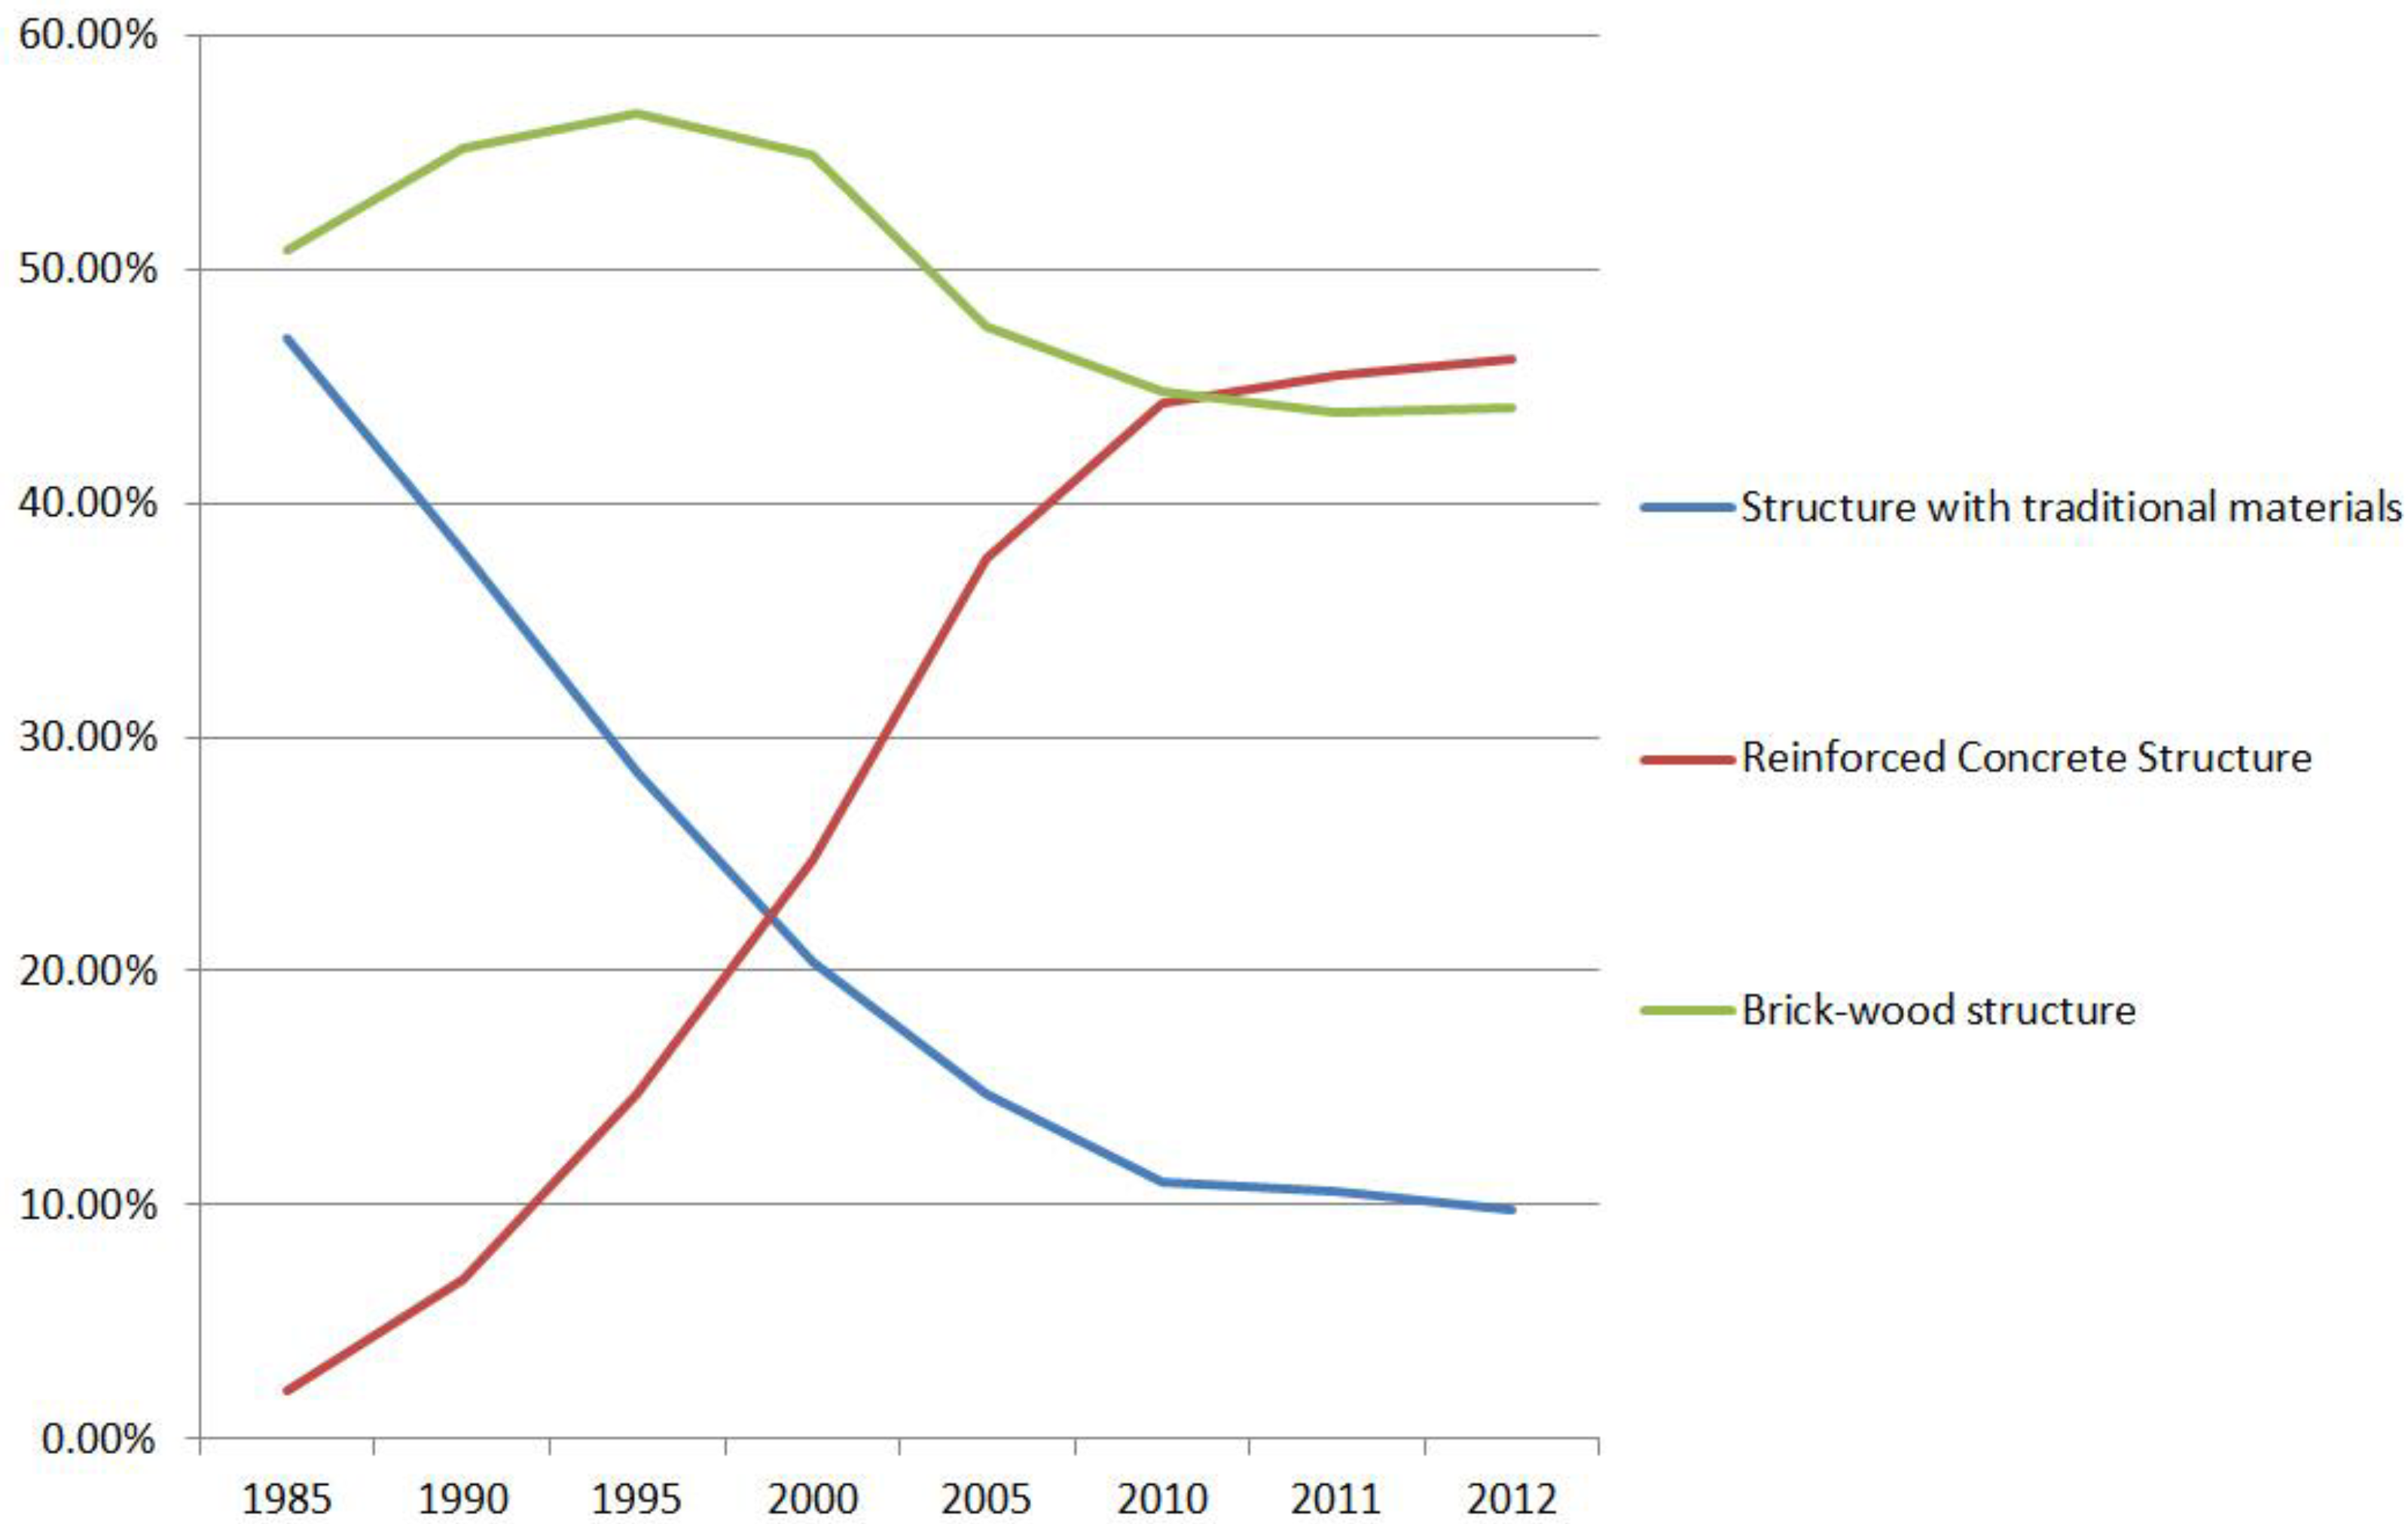
The housing conditions of rural households are recorded in the Chinese Statistical Yearbooks. Information about the per capita floor area of reinforced concrete structured and brick–timber structured rural housing has been released since 1985. As indicated in Figure 1, there was a clear shift away from vernacular building materials from 1985 to 2012, that is, from stone, timber, and mud to modern materials (e.g., concrete and brick) for structure construction. In 1985, around 47% of rural housing was built with traditional materials, and this ratio was reduced to 10% in 2012 [14]. The ratio of the concrete structure was increased from 2% to 46% in the same period. The ratio of the brick–timber structure was around 51% in 1985, and then gradually went up to 55% in 1990. The attractiveness of the brick–timber structure has faded since then, and around 44% of the rural housing was built with the brick–timber structure in 2012. Figure 2 shows the different materials used for structure in terms of newly built rural housing in each year. In 1985, 27% of the new rural buildings were constructed with traditional materials, 8% were constructed with concrete, and 65% were constructed with brick–timber. The ratio of concrete structure for new rural buildings in 2012 was increased to 73%, and 25% for brick–timber structures. Only 2% of the new rural housing in 2012 still adopted traditional materials.
It can be seen that the rural housing in China has been presenting a strong transition over the past three decades, towards adopting urban-like and highly processed modern building materials. Such a transition is particularly characterized by the adoption of the concrete structure. However, indoor thermal comfort, which is closely related to the adopted building materials, has not improved equally [12], even though the operational energy consumption of rural buildings has steadily risen. Mani and Reddy [1] examined several villages in India, and found that the transition toward modern materials, which primarily featured the adoption of standardized cement and steel construction, is not necessarily climatically responsive, and has not improved the indoor thermal comfort accordingly.
3. Embodied Energy (EE) of Buildings
An important measure of evaluating the environmental performance of construction materials is provided by the concept of ‘embodied energy’ (EE), which describes the amount of energy used to produce a material or a building element. We can refer to the embodied energy of a brick, a window, or of a whole building. Embodied energy can be further divided into two types: initial embodied energy, and recurring embodied energy [16]. Initial embodied energy is the energy incurred for the first installation of a building. In addition, there is a large variety of materials being used in a building, while some of them may have a lifespan that is less than that of the building. Hence, they need to be replaced during the lifetime of the building. The energy embodied in the materials for such replacement and maintenance refers to recurring embodied energy.
The embodied energy input is generally affected by several factors. First, the greater the number of processes that a material or set of components have to go through, the higher their embodied energy and the number of associated waste products will be. Thus, we prefer to choose materials and components that are as close to their natural state as possible. Second, transportation can significantly affect embodied energy input. The further that a material has to travel, the greater the energy that is used in its transport. For example, BedZED, the world’s first zero energy development, required that all of its materials ideally be sourced from within a 35-mile radius of the site where possible [17]. Third, the longer the service lifetime of a building, the lower the embodied energy impact annualized over its lifespan will be. Lastly, the less periodic replacement and maintenance of a material or a component during the life of a building, the lower the recurring embodied energy input will be.
From the perspective of building lifespan, a building can be generally classified into three phases: pre-occupation, post-occupation, and demolishment. Pre-occupation often refers to embodied energy, which involves the energy used for material extracting, manufacturing and assembling, the conveyance of materials from plants to construction sites, and energy used for the construction process. The post-occupancy phase involves the operation of the building, i.e., heating, cooling, and maintaining it. The demolishment phase involves the demolishment of a building and the rate of material recycling. A full life cycle analysis (LCA) involves the above three phases, addressing building environmental performance from upstream (extraction, production, transportation) to downstream (decommissioning and disposal), and usually performs at two spatial levels: individual materials, and whole buildings. Past studies indicated that EE was around 20% of the total life cycle energy consumption in modern buildings [7,18]. In China, the building life cycle analysis study usually focuses on urban buildings. For example, Deng et al. [9] estimated that the embodied energy used for the manufacturing of initial construction materials constitutes 20% in a Chinese urban small residential district with 462 households. Gu et al. [19] also gave a similar percentage; he estimated that the embodied energy consumption constitutes 20% of the lifespan consumption in a study of a single residential building in Beijing.
4. Material Transitions in the Case Study Village
Qinyong village is located in southeast Ningbo China, which is about 20 km away from the city center. It has 595 households, with a total population of 1287. The total area of the village is 6.6 km2, including 5.5 km2 of mountain area and 0.54 km2 of farmland. The village is surrounded by the mountains.
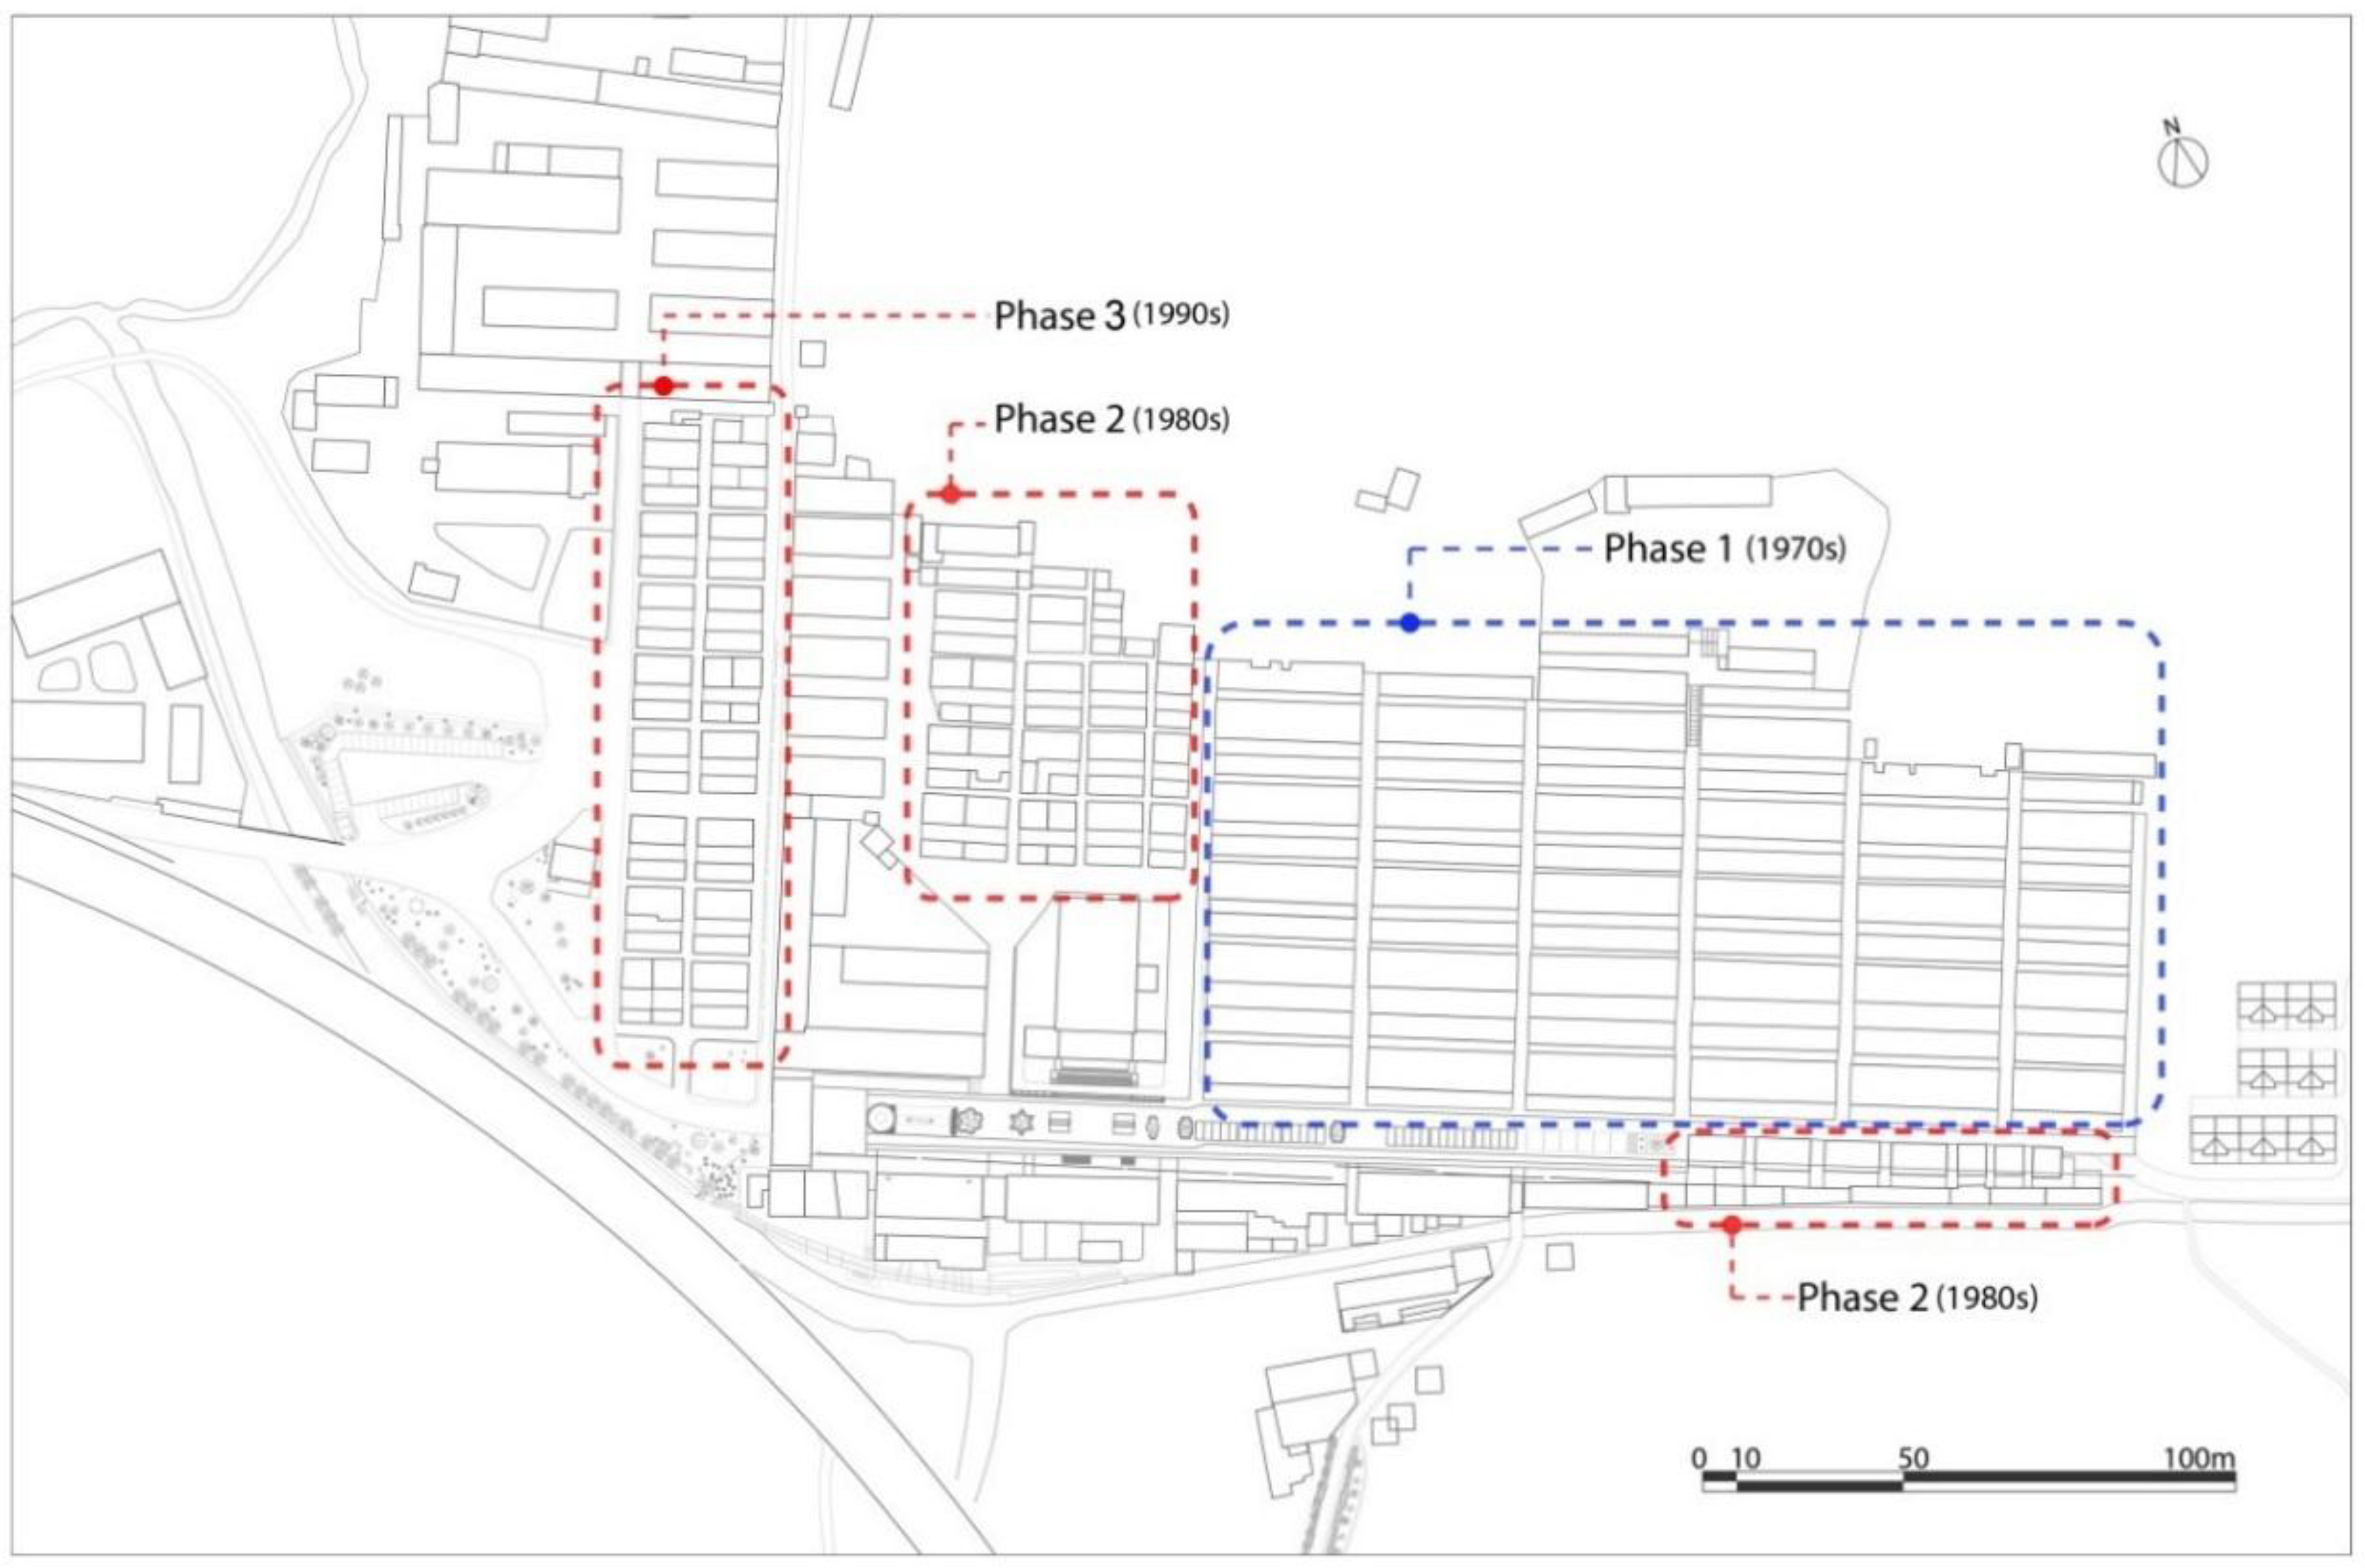
The existing building stock in Qinyong village can be generally categorized into three phases. Figure 3 shows the configuration of the village, which is clearly defined by internal roads. On the left of the village main road are three rows of terraced housing units, which were built in the 1970s (Phase 1 house). On the right is a long row houses with a duplex setting that were completed in the 1980s (Phase 2 houses). To satisfy the growing demand for housing, the third phase of the village housing development was developed in the 1990s just outside the western boundary of the village.
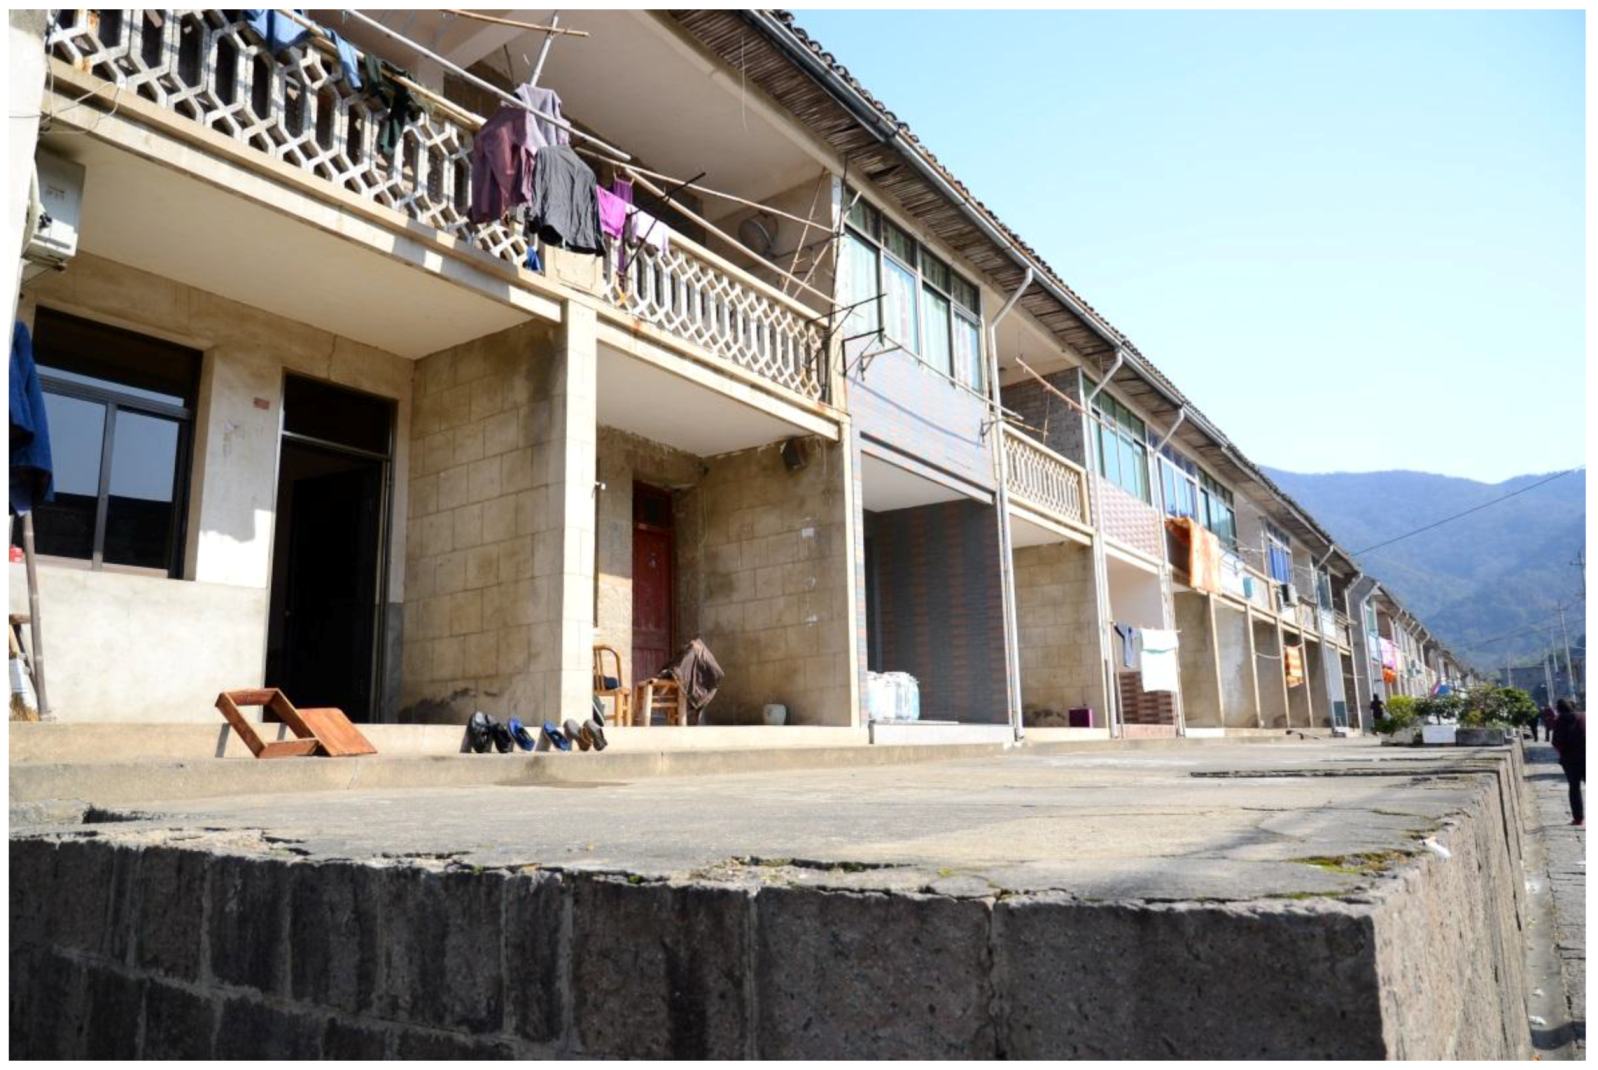
The Phase 1 housing development started in 1975, with support from the higher-level government, to forge a model of a ‘new socialist rural village’. All of the houses were identical in terms of area, layout, and materials used for construction in order to reflect equalitarianism, collectivism, and self-reliance. These houses are terraced and lined up in a row that was 43 m in length and 11 m in width. Each row has 12 units defined by the structural interval of column bays. Each household would occupy one unit, with a total area of 96 m2, including a two-storey main living component and a one-storey auxiliary space (Figure 4). The houses comprise four main materials: natural stone is used to build the wall, timber purlin and rafter are used to support the roof, clay tile is used for roofing, and exposed concrete is used for flooring. The reason for choosing stone as the main structural material is straightforward. A stone quarry is located 3 km southwest from the village. Stone was used not only for buildings, but also for bridges in this village, representing a unique local practice attributed to its position within the landscape. Using local resources is an indication of self-reliance and collectiveness. Except for a small portion of cement and glass, all of the materials were sourced locally and were processed by local villagers. For example, all of the timber doors and structures were made by a local carpentry team, and the transportation of stone was done by the villagers themselves, sometimes with shoulder poles.
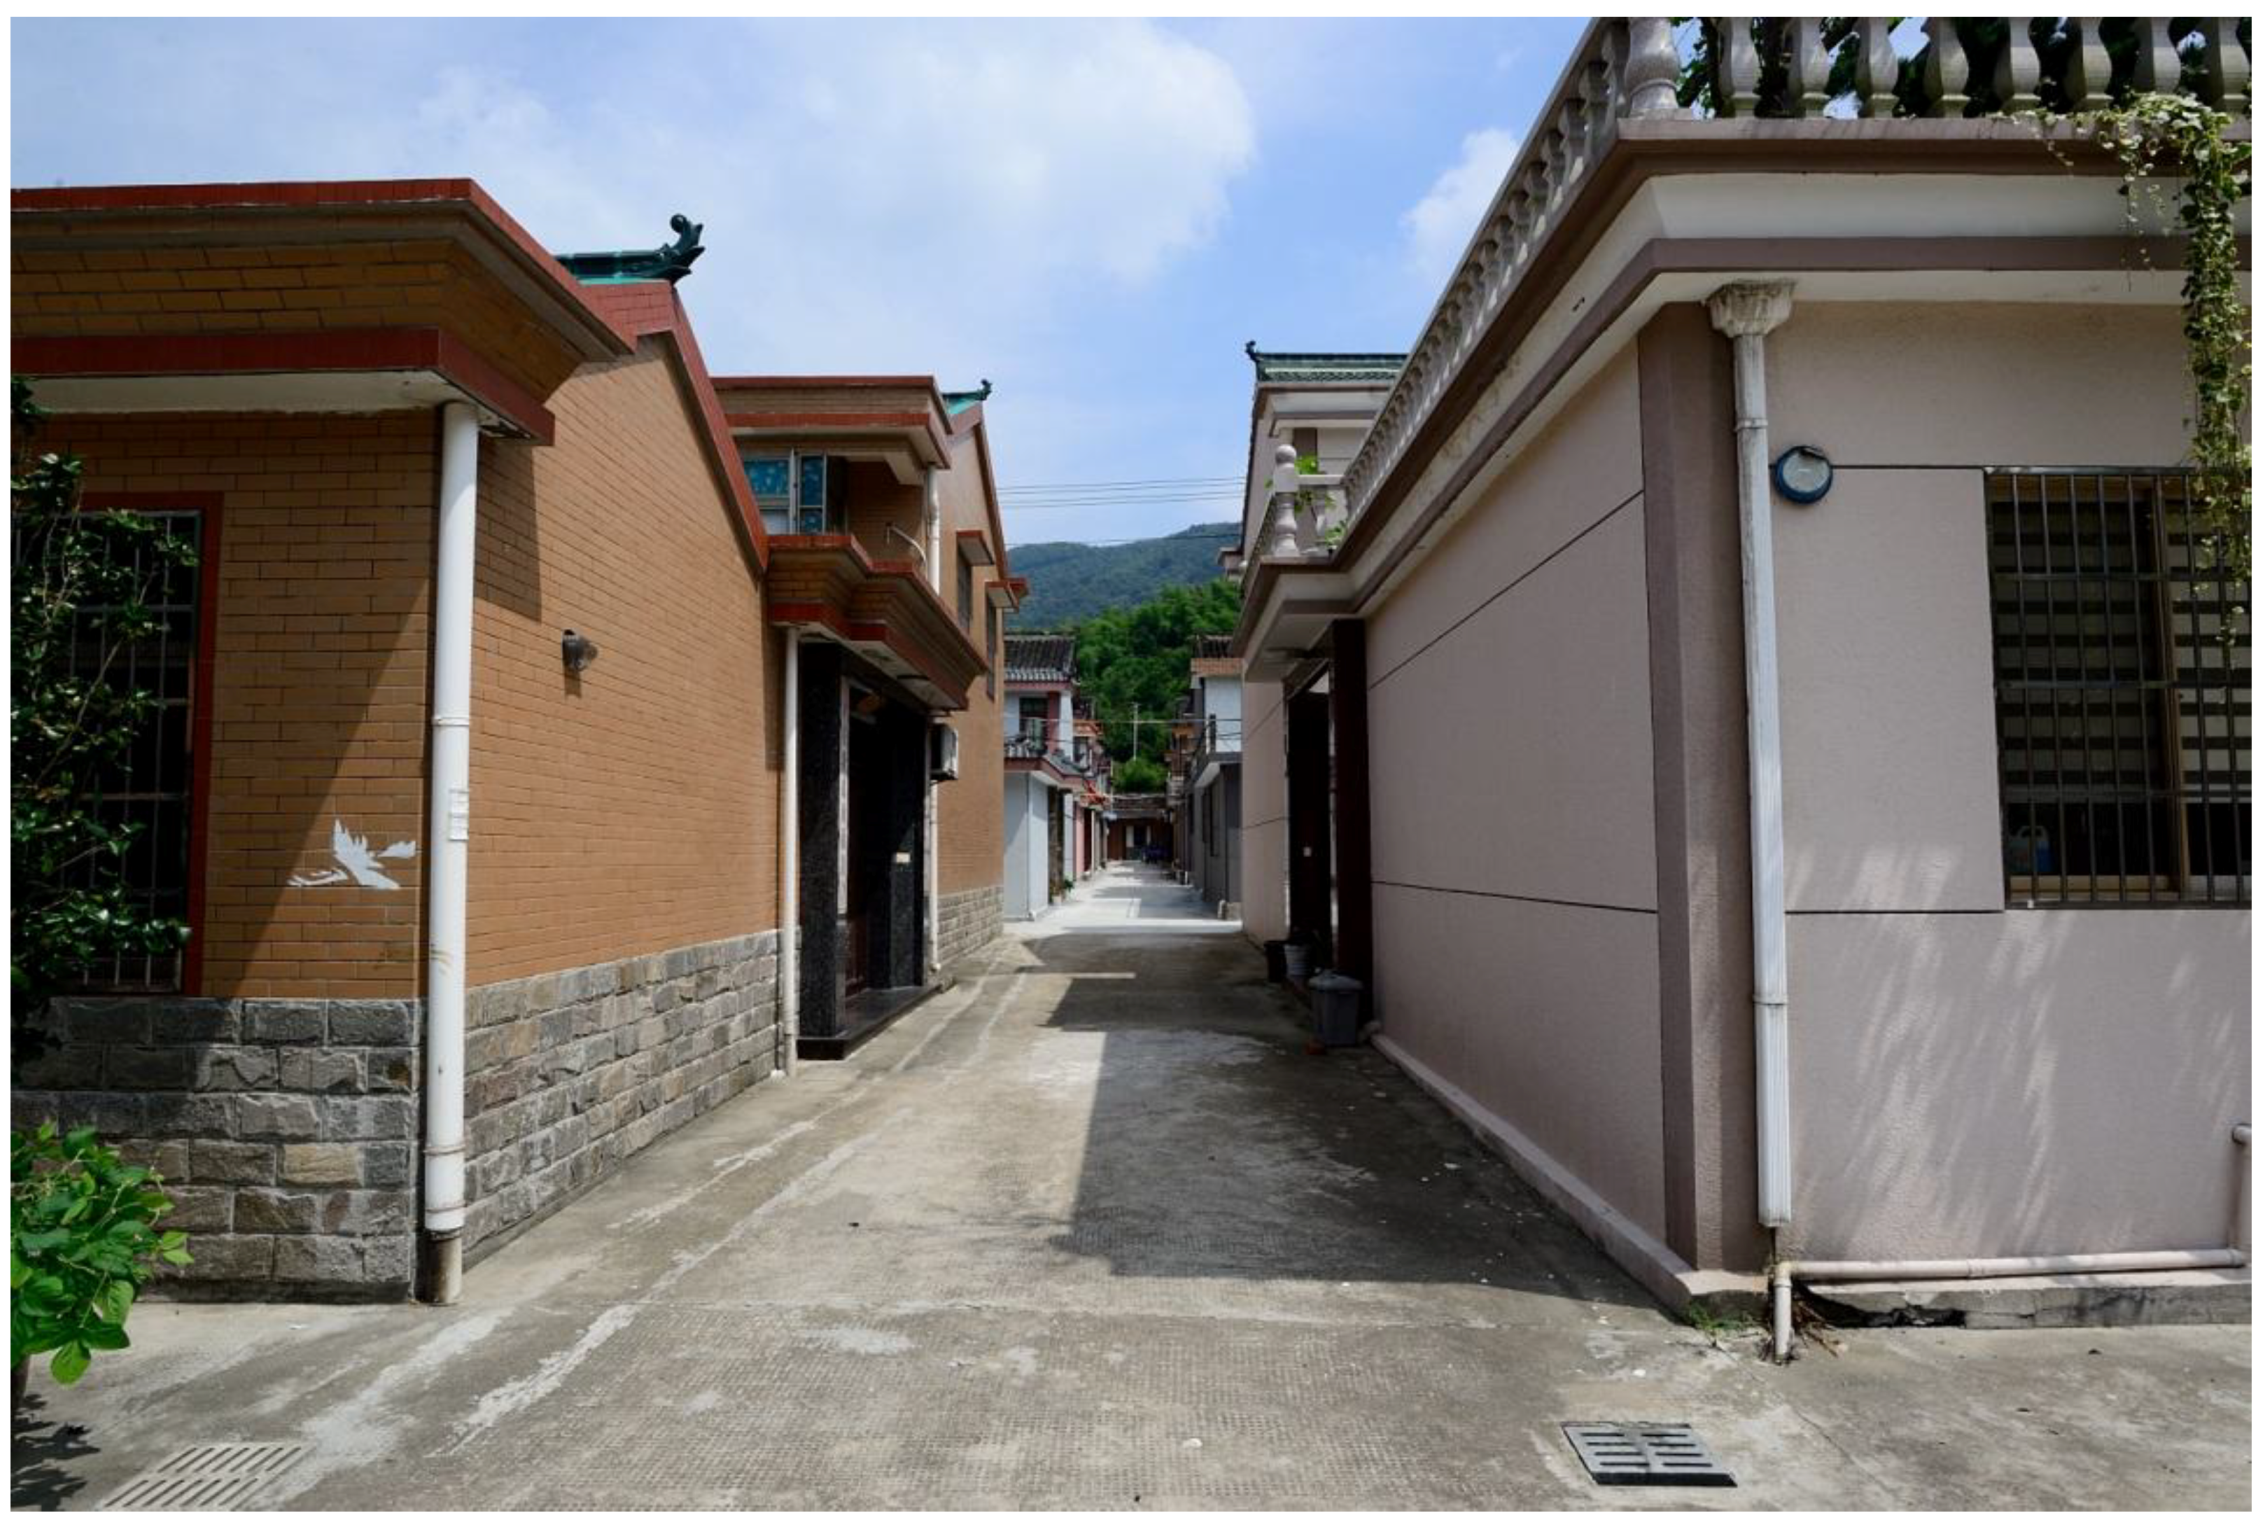
The Phase 2 housing project was built in the 1980s, when China has entered a new era. The country has been gradually liberated from Marxist doctrinarism, and market elements have been introduced. As the collective agriculture came to an end in the late 1970s and early 1980s, a household-based farming system was introduced to replace team production in rural China. This shift not only restructured the political and economic system of the village, but also led to the further transformation of the housing development from the 1980s onwards [20]. The change is evident in the housing projects built in the 1980s and the 1990s. Rather than providing a long rectangular block that equally divides each housing unit, the layout of the Phase 2 houses adopted a duplex setting (Figure 5). The latter is characterized by each two households equally share one plot of land, with a common wall in the middle. Traditional materials started to give way to modern materials; for example, baked bricks and cement plasters were used for the wall, and aluminum was substituted for timber. However, it is noticed that natural stone was still used for the foundation, and the roofing materials were still unchanged.
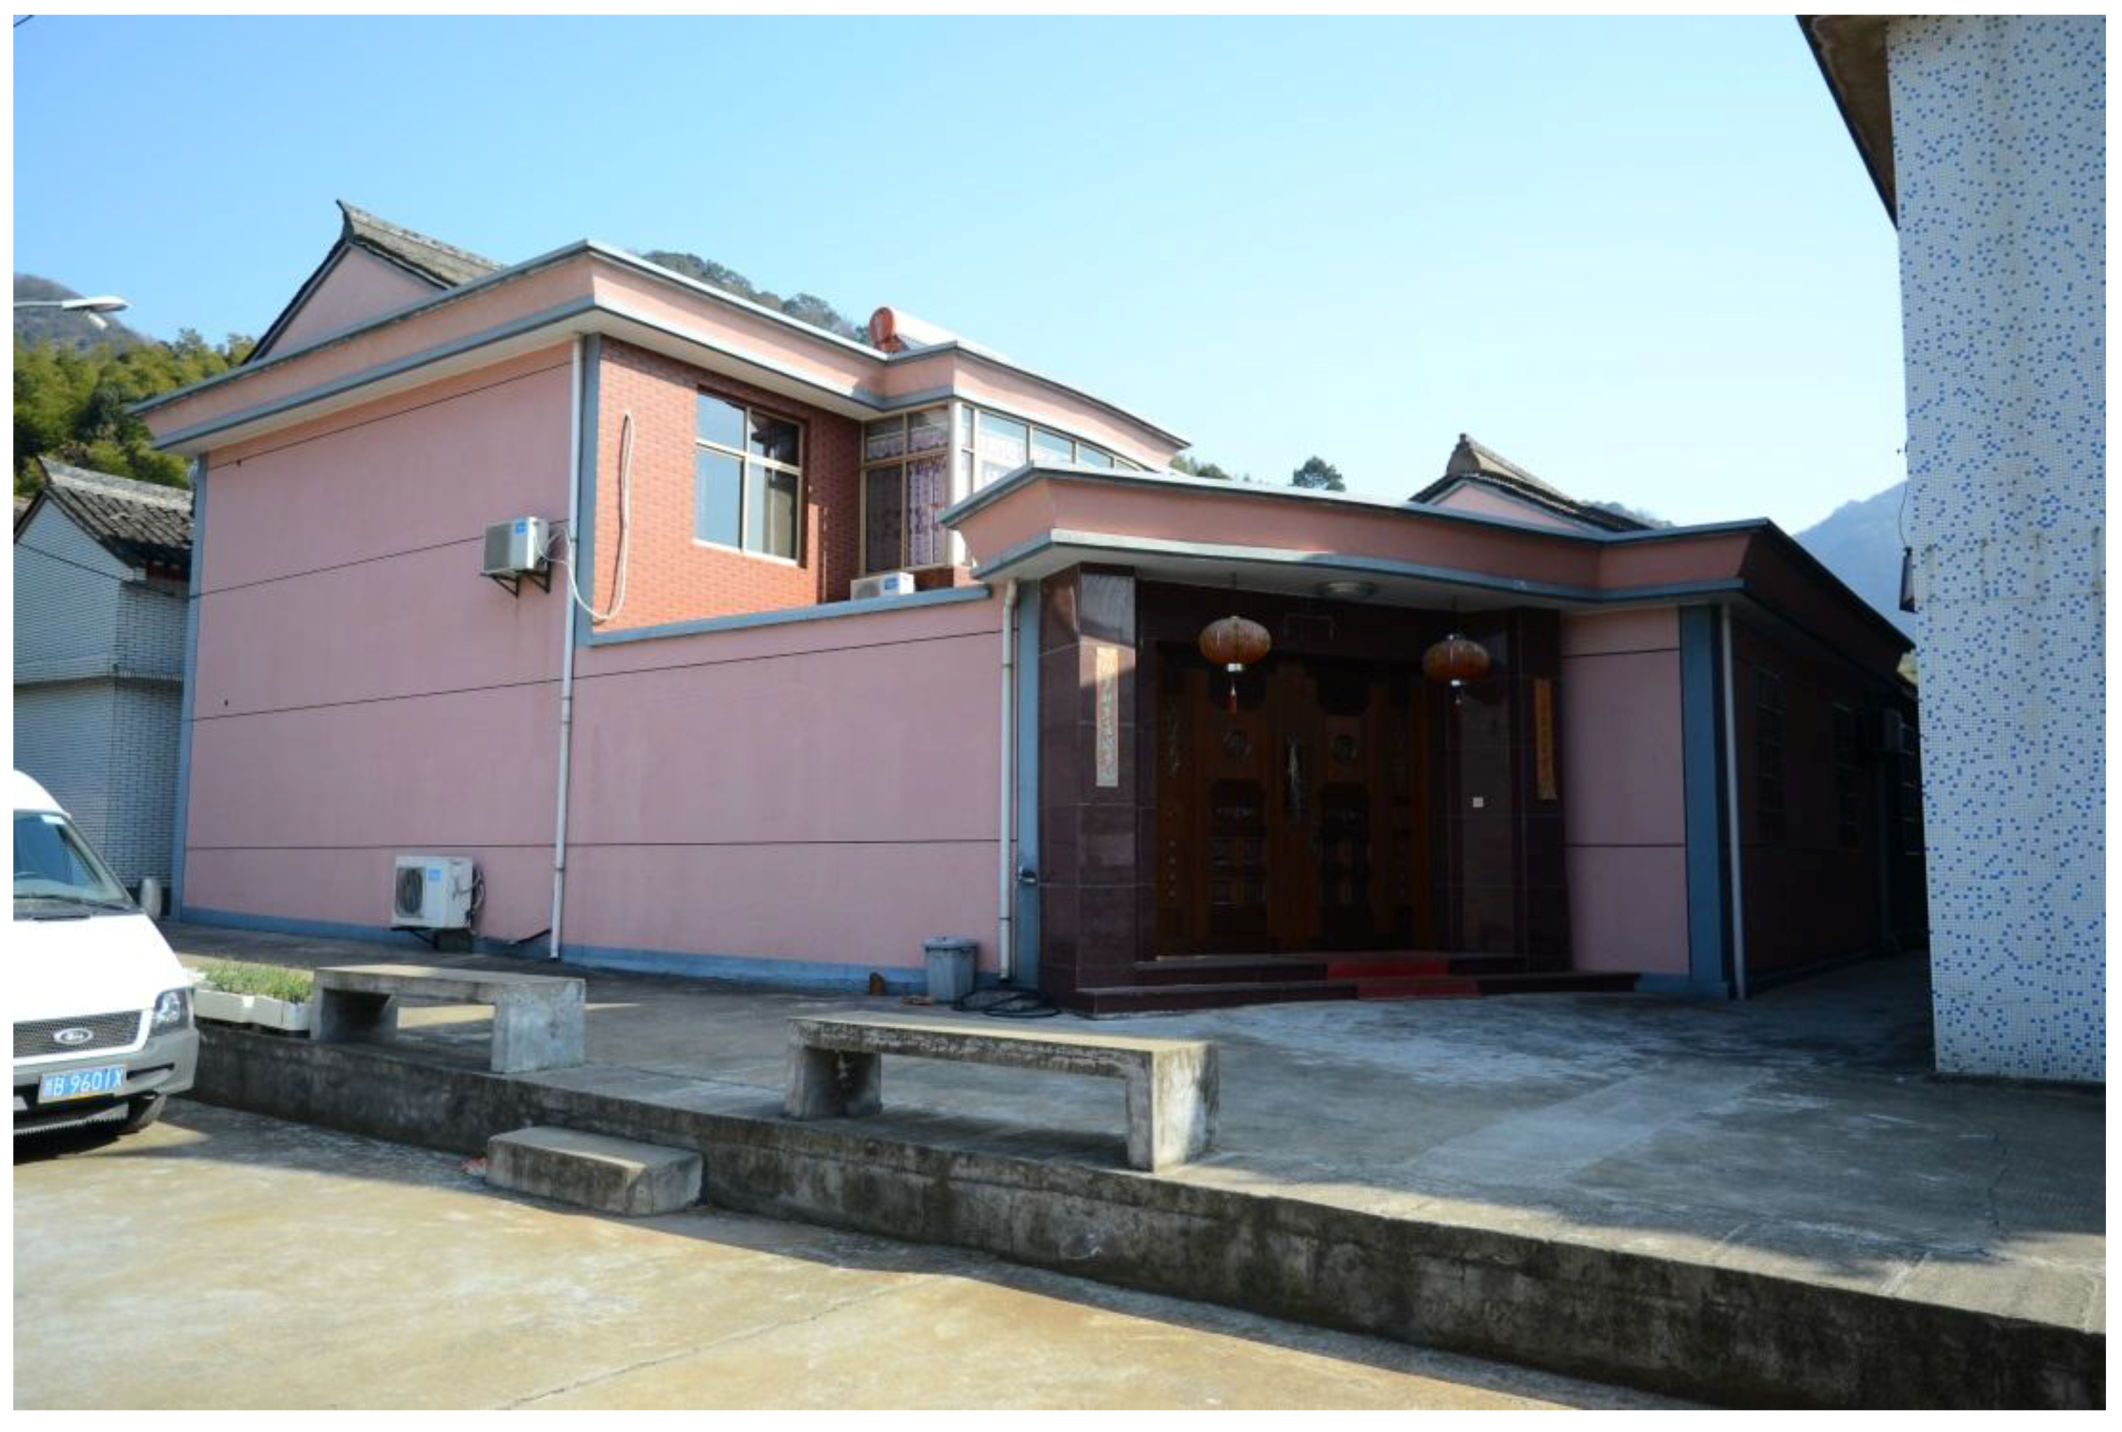
To house the growing population, the Phase 3 development was completed in the 1990s, and was located outside the western boundary of the village. The third phase of the village housing development generally kept a similar layout and composition to that of the Phase 2 houses (Figure 6). Yet, the stone foundation was removed and replaced with concrete blocks. Glass was widely used to improve transparency: larger windows, and even the courtyard, were often covered by a glass roof. The traditional roofing materials of timber rafters and clay tiles were replaced with cast in situ concrete slabs. The materials used in the Phase 3 houses were identical to those of urban dwellings.
Obviously, there are transitions with regard to the construction materials that were used in housing in Qinyong at different times. Table 1 indicates the materials used in the three phases of housing development in the case study village.
It is seen that there is a significant transition of the materials adopted from the 1970s to the 1990s in the case study village, which can be depicted as a shift away from ‘locally obtained and made’ construction materials, such as timber and stones, to ‘commercialized and machinery-manufactured’ products, e.g., baked bricks, concrete slabs, glass, aluminum frames, and ceramic tiles. Self-reliance has gradually faded, and the village is now more dependent on a commercialized construction market to obtain building materials and techniques. It has become clear that it is impossible to use local resources in the post-collectivism era. For example, it is no longer economically feasible for a family to extract and transport stones from the quarry to the construction site, nor is it practical for the members of a family to possess the required techniques to chop the stones and lay them properly. The massive use of local materials is a phenomenon that can only take place in a collective effort.
5. Indoor Thermal Comfort
ASHRAE (American Society of Heating, Refrigerating and Air-Conditioning Engineers) Standard 55 (2010) stated there are six primary factors affecting thermal comfort: metabolic rate, clothing level, air temperature, radiant temperature, airspeed, and humidity. Fanger’s model, predicted mean votes (PMV), is the main tool to evaluate indoor thermal comfort today. PMV combines four physical variables (air temperature, mean radiant temperature, humidity, and air movement) with a certain level of clothing and activity level on a thermal sensation scale (Table 2). ASHRAE Standard 55 (2004) recommended the design thermal environmental for comfort to have PMV values between −0.5 and 0.5. In reality, PMV values between −1 and +1 is also acceptable.
The Integrated Environment Solutions (IES) program is used to evaluate the PMV values of the selected houses from each of the three development phases in Qinyong. Revit models are created and imported into IES (Figure 7: example model of a selected house in Phase 1). Construction materials used for simulations are kept the same as indicated in Table 1. The U-values of the building fabrics derived from IES simulation are shown in Table 3.
The simulation conditions and settings are kept the same so that comparisons can be undertaken among the three example houses. For example, the same number of occupants and a light power intensity are set for internal heat gains, and there are no active systems to provide cooling and heating.
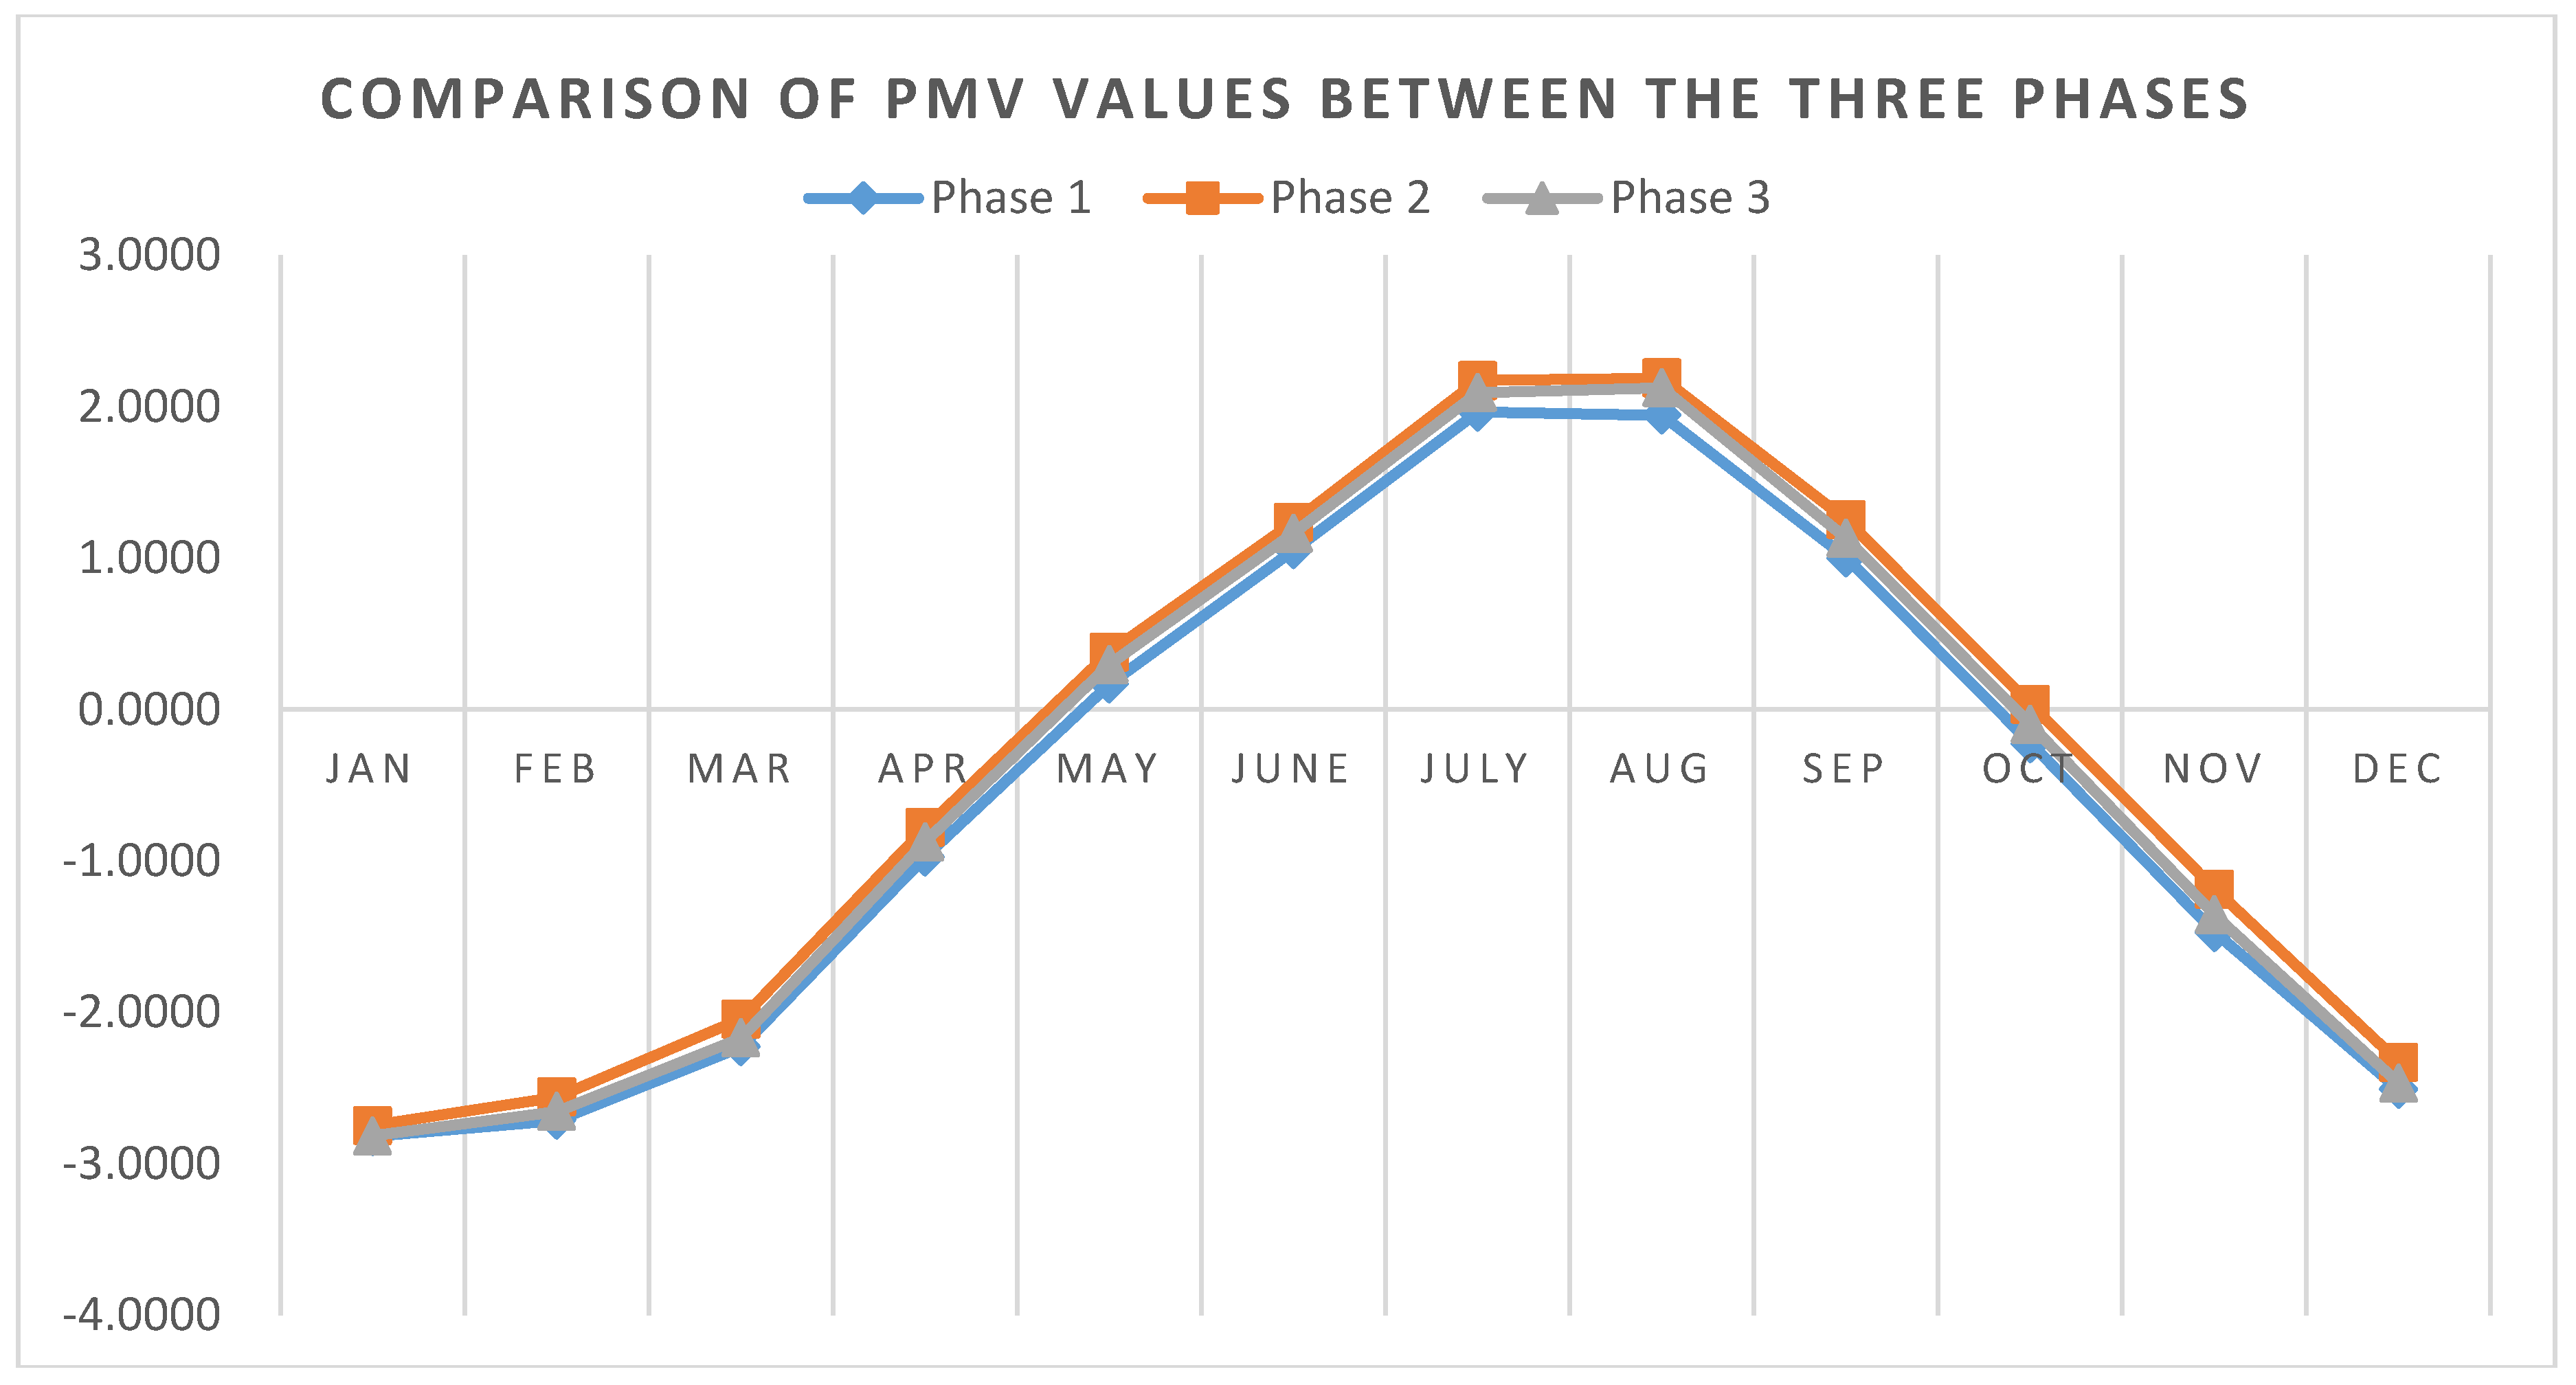
The PMV evaluation indicates that all of the houses are significantly uncomfortable in the winter time without assisting from active systems such as air conditioning and heaters. The average PMV values of the upper floor at 12 p.m. on the 22th of every month are shown in Figure 8 and Table 4. The upper floor of the houses was used to accommodate two bedrooms. It is indicated that without active systems, thermal discomfort exists from November to March in all of the houses examined. In this period, the PMV values are all out of the range of the thermal satisfaction scale, particularly the coldest months from December to February with records of PMV values lower than −2. The Phase 1 house has slightly lower PMV values than the other two phases. The main reason is the higher U-values of the walls and windows, and more significantly, the house is not air-tightened due to the stone structure; thus, more heat is lost by infiltration through small cracks and gaps in the envelope. The Phase 2 house performs the best in cold months, since it has a better insulating performance in the walls and roof (See Table 3). Overall, all three houses are away from the thermal comfort range without active heating in the winter. Thermal comfort in the summertime is a bit better; however, in July and August, the values are still out of the comfort range. It should be noticed that the Phase 1 house performs the best in the summertime. This is again due to the properties of stone structure, which has a higher infiltration and is not a ‘heat sink’ as concrete is.
Overall, there is no significant difference in indoor thermal comfort among the three phases. Efforts to improve winter thermal comfort in the Phase 1 house are observed; for example, concrete plasters were used to clad the external wall surfaces in some houses (Figure 9), thereby improving the airtightness of the construction. A survey is conducted to explore users’ perception toward thermal comfort in the Phase 1 house. Most grumble about the cold winter and the energy costs for using air-conditioning and heaters. By contrast, they are less dissatisfied with the summer conditions. One issue that is not seen from the PMV evaluation is humidity. In Ningbo, there is a plum rain season from early June to the middle of July. During this period, the value of relative humidity may reach 90%. The stone surface is moist and might cause mold. Although thermal comfort is similar among the three phases (Phase 1 is even better in the summertime), most of the occupants are willing to move out of the Phase 1 house. They believe that modern materials that can improve the comfort level, in their perception.
6. Estimates of Embodied Energy Consumption
One house is selected from each of the three development phases to conduct the analysis of the EE consumption. The estimate of EE consumption is limited to the envelope elements, including walls, floors, and roofs. Material consumption related to internal decoration such as timber flooring and ceramic flooring is excluded. Data related to the types of materials and building parameters are observed and measured on site. Revit models are created to generate material take-off sheets. These sheets show the quantity of each material in volume (), which can be then converted to materials weight ().
A literature review revealed very little information associated with the energy intensities of Chinese construction materials [9,21]. The University of Bath’s Inventory of Carbon and Energy (ICE) database [22] is adopted as a proxy to analyze the embodied energy of the envelope materials.
Table 5 shows the EE consumptions of each house, and the average embodied energy per floor area. Given a lifespan of 50 years, it can be seen that the annualized EEs consumed for the houses are 21.88 kWh/m2, 28.04 kWh/m2, and 32.03 kWh/m2, respectively. The Phase 1 house has the lowest EE input as its main structural materials are stones, which require little processing and transportation. The Phase 3 house has the highest EE input, which was almost 1.5 times more than the Phase 1 house, and 1.1 times more than the Phase 2 house, since more concrete is used in the envelope.
7. Discussion
The use of construction materials from the 1970s to the 1990s in Qinyong village shows a gradual trend of moving away from traditional construction practice. Such transitions have not necessarily led to the improvement of indoor thermal comfort. The existence of thermal discomfort throughout a year has been identified, according to the PMV simulation results. Without active systems, the average PMV values of the three houses are all out of the range of indoor comfort in both summer and winter. The average PMV values in summer range from 1.0619 to 1.2620, showing a better thermal indoor environment than winter, in which the PMV values range from −2.0883 to −2.2667. In summer, the phase 1 house performs the best, with the lowest PMV value of 1.0619, due to the higher infiltration and the low solar heat absorption of the stone structure. In winter, the Phase 2 house has the best thermal performance, with an average PMV value of −2.0883 due to its better insulating performance in the walls and roof. In the transition periods, i.e., April, May, and October, all the three phases have an acceptable indoor thermal environment, as the average PMV values are within the range between −1 and +1, and in particular, the comfort level in May and October fully satisfies the ASHRAE requirement, with the PMV values between −0.5 and 0.5. Generally, the material transition from a stone to a concrete structure has not significantly improved the indoor thermal comfort. On the other hand, the transitions have significantly increased the EE input, from 21.88 kWh/m2 to 28.02 kWh/m2, and then to 32.03 kWh/m2, or in percentage ratios, increases of 30% and 50%, respectively. The Phase 1 house has the lowest EE consumption, since the main construction materials used are natural stones and timber rafters. The baked brick structure was used in the Phase 2 house. However, it still keeps some natural materials; for example, natural stones were used for the ground floor foundation, and timber rafters were used to support the roof. The Phase 3 house fully replaced these natural materials with reinforced concrete. It is not a surprise that the Phase 3 house has the highest EE consumption. Linking back to the indoor thermal comfort of the three phases, the examination of the associated embodied energy indicates that the indoor comfort has not been improved equally, with a significant increase of EE consumption in the case study village.
Table 6 provides several case studies of traditional houses with respect to EE consumption. The EE consumption of a wood house in Sweden had a similar EE value to the Phase 2 house. The Phase 1 house and the clay house in Indonesia had relatively low EE values, since rubble stone and clay are extracted manually from nature, which requires little processing. The adobe house in India and the Phase 3 house had relatively high EE consumption, since adobe (made of cement, sand, and soil) and concrete are produced in manufactories, and thus are relatively energy intensive.
The survey shows that the residents of the Phase 1 house preferred to move into the houses built at the later stages. However, the thermal comfort had not been increased equally with the increase of embodied energy in Phase 2 and Phase 3 houses. From the 1980s onward, a strong trend appears of adopting a concrete construction in rural China. However, this transition of changing local materials to modern ones, and the related environmental impact, have not been well regulated in the past three decades. The energy efficiency in rural buildings is still largely overlooked in building codes. Not until 2013 was the first national building energy code for rural buildings—the Design Standard for Energy Efficiency of Rural Buildings—issued by the Ministry of Housing and Urban–Rural Development (MoHURD). The MoHRUD has set up an annual inspection system to check the compliance rate of building energy codes. However, the inspection has been focused on new medium and large building construction projects, which are located exclusively in urban areas [26]. A comprehensive policy package of incentivizing energy conservation to regulate rural buildings is still lacking.
The majority of rural building stock was completed before 2013. Rural buildings consume more energy than urban buildings to achieve a similar level of comfort [27], most of which were built without insulation, and thus provide little resistance to heat loss and cause thermal discomfort. Many of them were built on the same land plot by simply dismantling the original constructions. Traditional constructions have entirely disappeared in many villages. In this regard, Qinyong is lucky, as the rubble stone houses have been well preserved and are still being used, offering an opportunity for observing the transitions of buildings in the village over the past three decades. The Phase 2 and Phase 3 houses, representing the common construction practice in the 1980s and the 1990s in the Chinese rural area, are not thermally comfortable largely for two reasons: the absence of insulation, and the lack of active heating and cooling systems. This is also observed by a few other studies [28,29,30]. Moreover, these buildings have passed half of their designated lifespan (50 years); some of them need regular maintenance. Opportunities exist to increase the indoor thermal comfort in these buildings, such as for example, adding insulation and optimizing solar entry.
8. Conclusions
This study investigates the correlations between the thermal comfort and the embodied energy input of the houses built in different periods of time in the case study village. The study has found that:
- In summer, the Phase 1 house has a better thermal performance than the Phase 2 house, as the PMV values have increased from 1.0619 to 1.2620, although the EE input has an increase of 28%. The Phase 3 house is 14% higher with EE input than the Phase 2 house; however, the thermal comfort has been only improved slightly, with the average PMV values increased from 1.260 to 1.1849.
- In winter, all three houses are away from the thermal comfort range without active heating in winter. It should be noted that the EE input of the Phase 2 house is 14% lower than the Phase 3 house, which was fully built with modern materials. However, the thermal comfort of the Phase 2 house still was better than the Phase 3 house.
Overall, the key finding from this research is that the buildings completed in the 1980s and the 1990s in Chinese rural areas are not thermally comfortable and may need to be given special attention in future thermal retrofitting plans. Furthermore, dismantling traditional houses to give way to new houses with modern materials is not the way to improve indoor thermal comfort. Retrofitting them with suitable active and passive design strategies will benefit the environment as well as reduce construction costs. In the Phase 1 house, adding insulation on the external roof and wall, increasing airtightness, optimizing window sizes, and installing solar thermal collectors are all measures that increase the indoor comfort.
Author Contributions
W.D. designed the research and finished the writing of the paper; Z.P. performed the IES-VE simulations and provided suggestions in the writing of the paper. J.X. provided the plan of the village, the photos, and suggestions for the manuscript writing. All authors read and approved the final manuscript.
Acknowledgments
This research did not receive any specific grant from funding agencies.
Conflicts of Interest
The authors declare no conflict of interest.
References
- Mani, M.; Reddy, B.V. Sustainability in human settlements: imminent material and energy challenges for buildings in India. J. Indian Inst. Sci. 2012, 92, 145–162. [Google Scholar]
- Shastry, V.; Mani, M.; Tenorio, R. Evaluating thermal comfort and building climatic response in warm-humid climates for vernacular dwellings in Suggenhalli (India). Archit. Sci. Rev. 2016, 59, 12–26. [Google Scholar] [CrossRef]
- Love, S. Architecture as material culture: Building form and materiality in the Pre-Pottery Neolithic of Anatolia and Levant. J. Anthropol. Archaeol. 2013, 32, 746–758. [Google Scholar] [CrossRef]
- Bridgwood, B.; Lennie, L. History, Performance and Conservation; Taylor & Francis: London, UK; New York, NY, USA, 2009. [Google Scholar]
- Cowan, H.J. An Historical Outline of Architectural Science; Applied Science Publishers: London, UK, 1977. [Google Scholar]
- Vellinga, M. Review essay: Anthropology and the materiality of architecture. Am. Ethnol. 2007, 34, 756–766. [Google Scholar] [CrossRef]
- Fernandez, J. Resource consumption of new urban construction in China. J. Ind. Ecol. 2007, 11, 99–115. [Google Scholar] [CrossRef]
- Yang, W.; Kohler, N. Simulation of the evolution of the Chinese building and infrastructure stock. Build. Res. Inf. 2008, 36, 1–19. [Google Scholar] [CrossRef]
- Deng, W.; Prasad, D.; Osmond, P.; Li, F.T. Quantifying life cycle energy and carbon footprints of China's residential small district. J. Green Build. 2011, 6, 96–111. [Google Scholar] [CrossRef]
- You, F.; Hu, D.; Zhang, H.; Guo, Z.; Zhao, Y.; Wang, B.; Yuan, Y. Carbon emissions in the life cycle of urban building system in China’A case study of residential buildings. Ecol. Complex. 2011, 8, 201–212. [Google Scholar] [CrossRef]
- Aden, N.; Qin, Y.; Fridley, D. Lifecycle Assessment of Beijing-Area Building Energy Use and Emissions: Summary Findings and Policy Applications (LBNL-3939E); China Energy Group, Lawrence Berkeley National Laboratory: Berkeley, CA, USA, 2010. [Google Scholar]
- Tsinghua University. Annual Report on China Building Energy Efficiency; China Architecture &Building Press: Beijing, China, 2009. (In Chinese) [Google Scholar]
- He, B.J.; Yang, L.; Ye, M. Building energy efficiency in China rural areas: Situation, drawbacks, challenges, corresponding measures and policies. Sustain. Cities Soc. 2014, 11, 7–15. [Google Scholar] [CrossRef]
- China National Bureau of Statistics (CNBS). China Statistical Yearbook 2013; Chinese Statistic Press: Beijing, China, 2013. (In Chinese)
- Li, Z.; Jiang, Y. Pondering over the situation of domestic generalized building energy consumption. Architect. J. 2006, 7, 30–33. [Google Scholar]
- Fay, R.; Treloar, G.; Iyer-Raniga, U. Life-cycle energy analysis of buildings: A case study. Build. Res. Inf. 2000, 28, 31–41. [Google Scholar] [CrossRef]
- Bioregional. Beddington Zero Energy Development Case Study Report—Bioregional. 2018. Available online: https://www.bioregional.com/beddington-zero-energy-development-case-study-report/ (accessed on 7 April 2018).
- Troy, P.; Holloway, D.; Pullen, S.; Bunker, R. Embodied and operational energy consumption in the city. Urban Policy Res. 2003, 21, 9–44. [Google Scholar] [CrossRef]
- Gu, D.J.; Zhu, Y.X.; Gu, L.J. Life cycle assessment for China building environment impacts. J. Tsinghua Univ. 2006, 46, 1953–1956. (In Chinese) [Google Scholar]
- Xie, J.; Deng, W. Socialist architecture in Mao’s model village: A case study of Qinyong Village in Ningbo. J. Archit. 2017, 22, 293–327. [Google Scholar] [CrossRef]
- Fridley, D.G.; Zheng, N.; Zhou, N. Estimating Total Energy Consumption and Emissions of China’s Commercial and Office Buildings; Lawrence Berkeley National Laboratory: Berkeley, CA, USA, 2008. [Google Scholar]
- Hammond, G.; Jones, C. Inventory of Carbon and Energy (ICE), version 2.0; Sustainable Energy Research Team, Department of Mechanical Engineering, University of Bath: Bath, UK, 2011; Available online: http://www.organicexplorer.co.nz/site/organicexplore/files/ICE%20Version%201.6a.pdf (accessed on 7 April 2018).
- Adalberth, K. Energy use during the life cycle of single-unit dwellings: Examples. Build. Environ. 1997, 32, 321–329. [Google Scholar] [CrossRef]
- Shukla, A.; Tiwari, G.N.; Sodha, M.S. Embodied energy analysis of adobe house. Renew. Energy 2009, 34, 755–761. [Google Scholar] [CrossRef]
- Utama, A.; Gheewala, S.H. Life cycle energy of single landed houses in Indonesia. Energy Build. 2008, 40, 1911–1916. [Google Scholar] [CrossRef]
- Bin, S.; Lin, H.; Nadel, S.; Song, B. How does china achieve a 95% compliance rate for building energy codes? The role of government in the development of effective energy efficiency policies. In Proceedings of the 2012 ACEEE Summer Study on Energy-Efficiency in Buildings, Pacific Grove, CA, USA, 12–17 August 2012. [Google Scholar]
- Meng, X.; Liang, W.; Ding, P.; Wang, S.; Li, Y.; Long, E. Survey research on living environment and energy consumption in the West Rural Areas of China. Procedia Eng. 2015, 121, 1044–1050. [Google Scholar] [CrossRef]
- Li, H. Field survey of indoor thermal comfort in rural housing of northern china in heating season. J. Southeast Univ. 2010, 26, 169–172. [Google Scholar]
- Zhu, Y.; Zhao, J.; Sang, G.; Zhao, Q. Test analysis of winter indoor thermal environment of the rural houses in southern Shannxi. J. Xian Univ. Technol. 2015, 3, 306–309. [Google Scholar]
- Ding, S.; Xiong, Y. An application of architectural research method—An investigation of the rural houses’ thermal comfort. Archit. Cult. 2016, 2, 84–85. [Google Scholar]
Figure 1.
Types of structures for China’s rural housing. Source: based on Tables 11–32, China National Bureau of Statistics (CNBS), 2013.
Figure 1.
Types of structures for China’s rural housing. Source: based on Tables 11–32, China National Bureau of Statistics (CNBS), 2013.

Figure 2.
Types of structures of newly built rural housing in each year. Source: based on Tables 11–32, CNBS, 2013.
Figure 2.
Types of structures of newly built rural housing in each year. Source: based on Tables 11–32, CNBS, 2013.
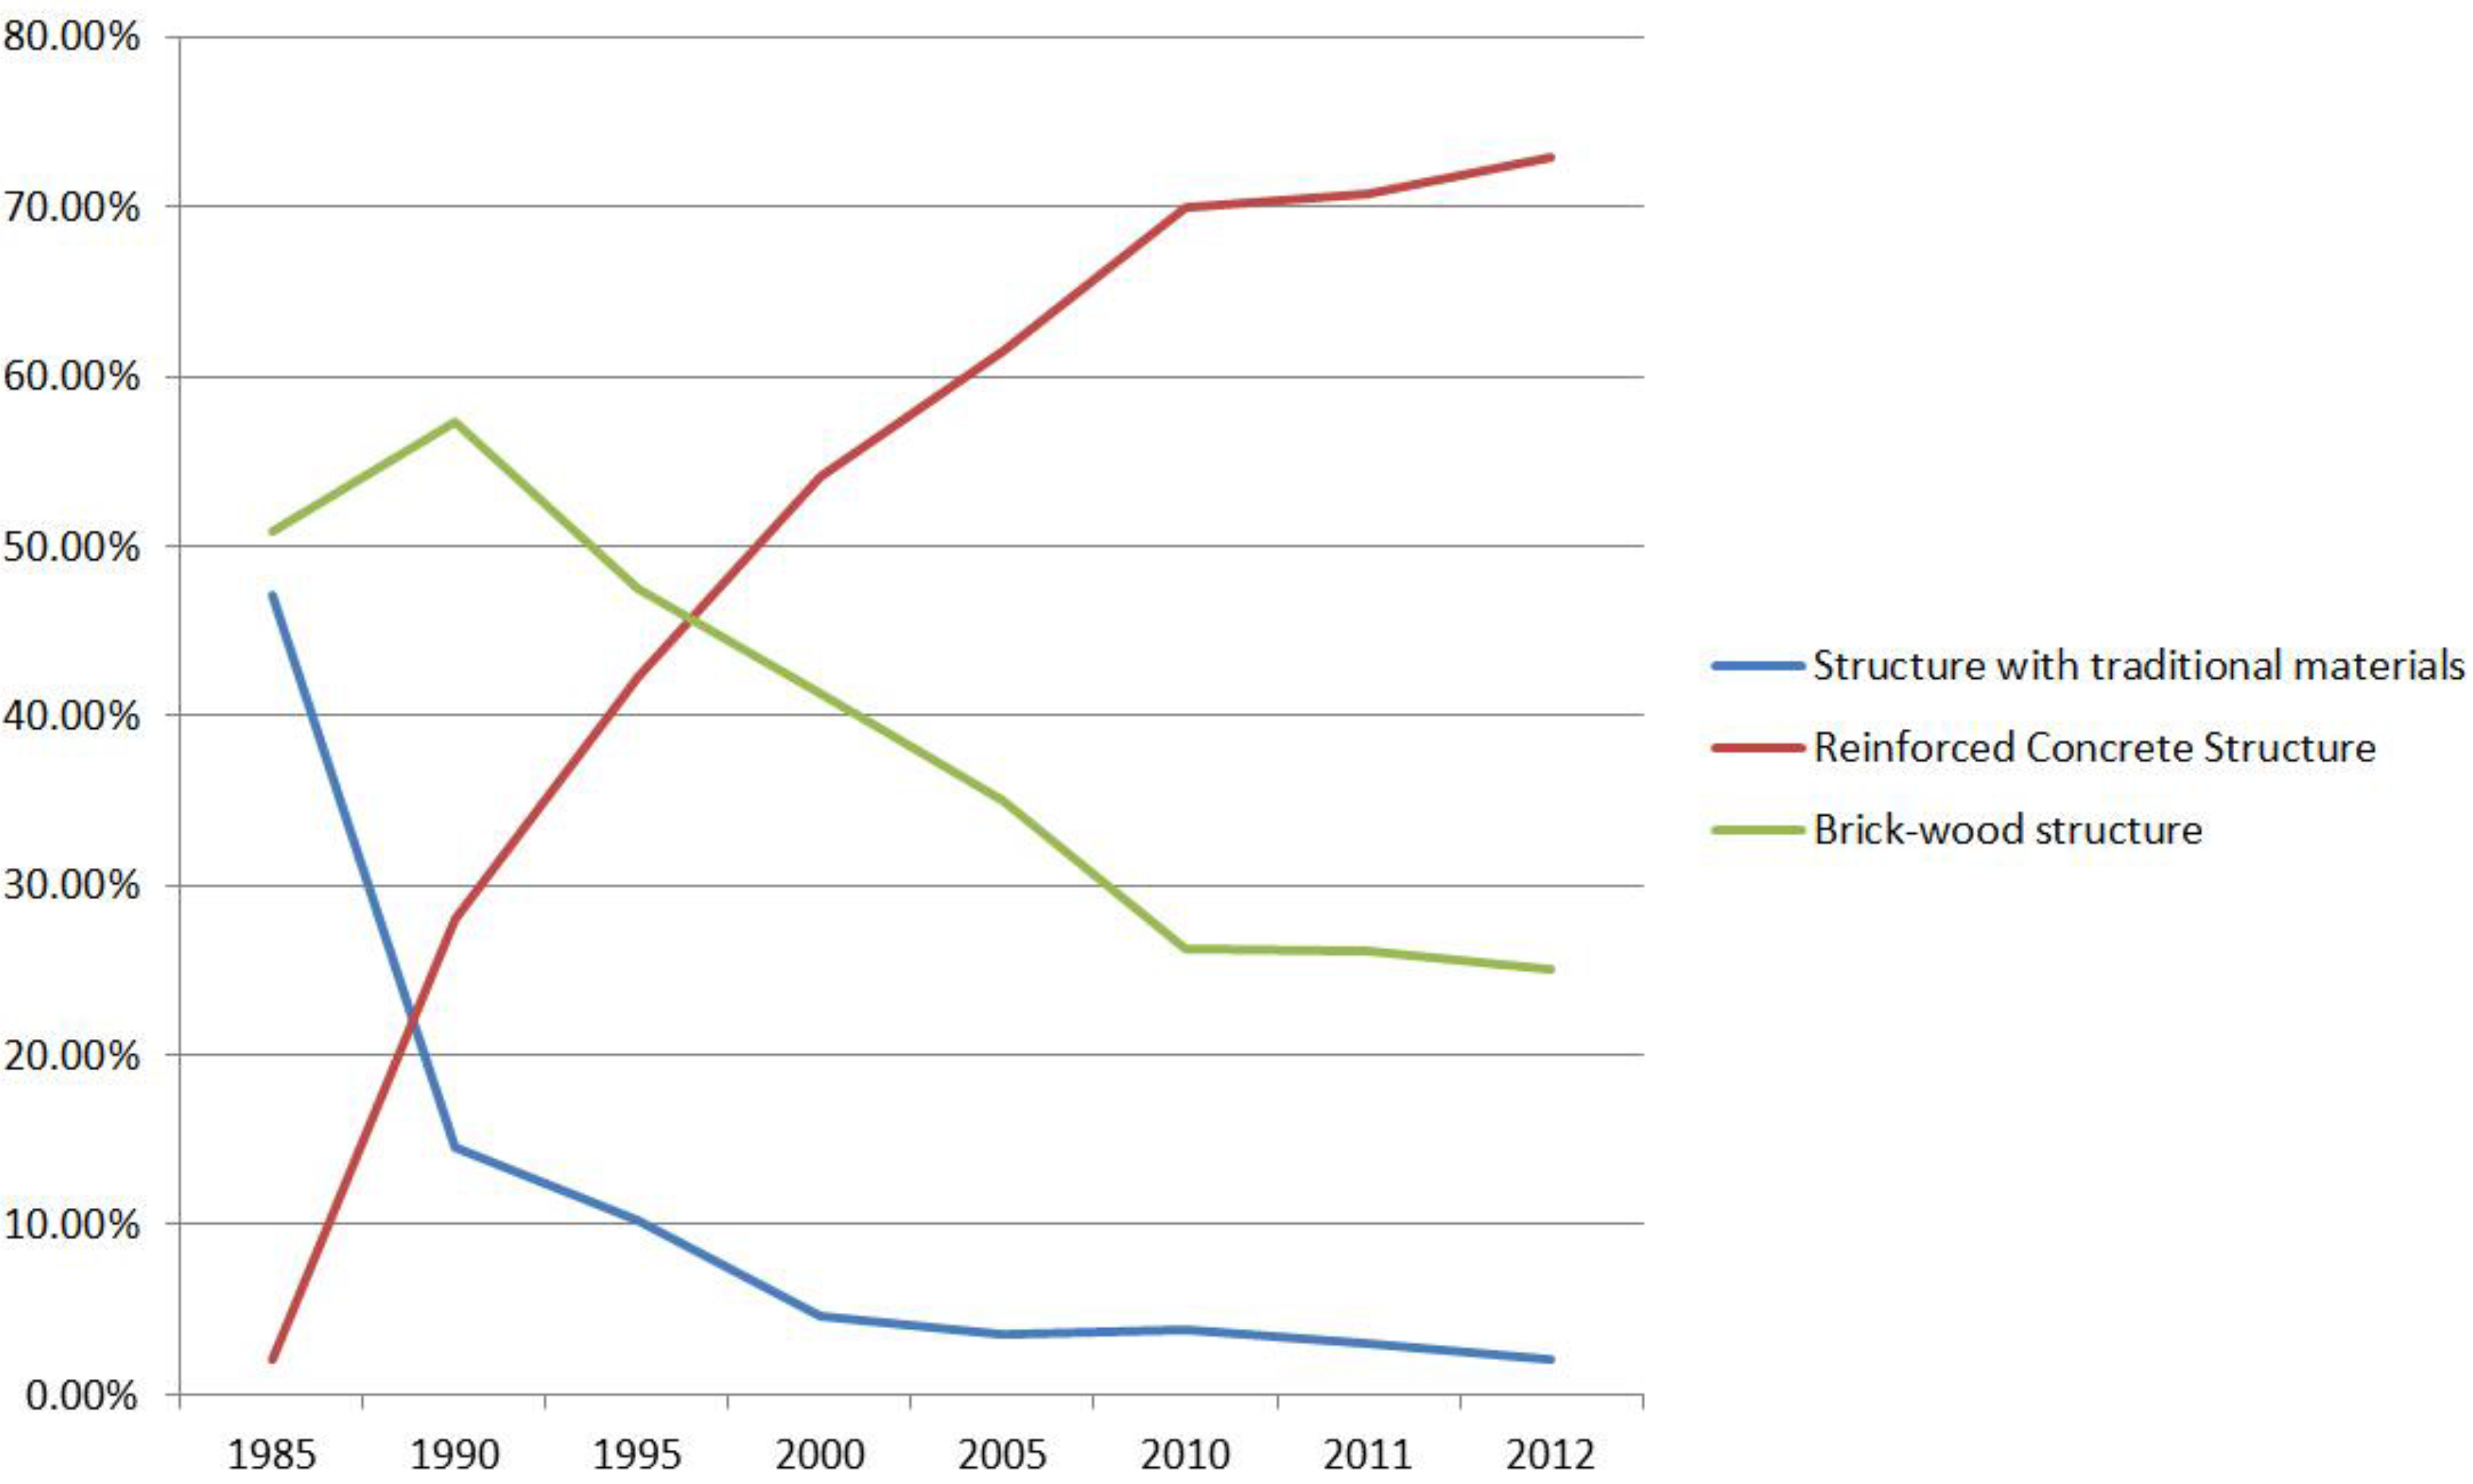
Figure 3.
Village layout indicating the three phases of housing development in Qinyong.

Figure 4.
Phase 1 house featuring the stone structure.

Figure 5.
Phase 2 house featuring the brick structure and stone foundation.

Figure 6.
Phase 3 house featuring concrete structure and brick walls.

Figure 7.
IES model of a typical Phase 1 house in Qinyong village.
Figure 8.
Predicted mean votes (PMV) values in different months with/without active systems.

Figure 9.
Concrete cladding used in some Phase 1 house.

Table 1.
Materials used in the three phases of housing development.
| Construction Elements | Materials Used for Phase 1 Housing | Materials Used for Phase 2 Housing | Materials Used for Phase 3 Housing |
|---|---|---|---|
| Walls | Rubble stone with a layer of mud mortar | Bricks and cement plasters with stone foundation | Bricks with reinforced concrete columns and beams |
| Roof | Pitched roof with clay tiles, supported by wooden rafters | Pitched roof with clay tiles, supported by wooden rafters | Pitched roof with cast in situ concrete |
| Windows | Small sized, timber framed, single glazed with clear glass | Medium sized, aluminium framed, double glazed | Large sized, aluminium framed, double glazed |
| Main Door | Timber | Aluminium | Aluminium |
| Floor | Exposed cement, rammed soil | Rammed soil and ceramic tiles for the ground floor, and hardwood for the first floor | Rammed soil and ceramic tiles for the ground floor, and hardwood for the first floor |
| Courtyard | Externally located, fully open, exposed cement surfacing with stone foundation | Internally located, fully open, concrete surfacing, ceramic tiled | Internally located, half covered by glass ceiling, concrete surfacing, ceramic tiled |
Table 2.
Thermal sensation scale in Fanger’s model.
| PMV Value | Thermal Sensation |
|---|---|
| +3 | Hot |
| +2 | Warm |
| +1 | Slightly warm |
| 0 | Neutral |
| −1 | Slightly cool |
| −2 | Cool |
| −3 | Cold |
Source: CIBSE (Chartered Institution of Building Services Engineers) Guide A: Environmental Design, Table 1.3.
Table 3.
U-values for the construction elements of each house.
| U-Value (w/m2 K) | |||
|---|---|---|---|
| Construction Elements | Phase 1 House | Phase 2 House | Phase 3 House |
| Walls | 3.95 | 1.69 | 1.90 |
| Roof | 0.63 | 0.63 | 2.50 |
| Windows | 6.32 | 2.03 | 2.03 |
| Doors | 2.30 | 6.67 | 6.67 |
| Ground Floor | 1.90 | 1.90 | 1.90 |
Table 4.
PMV values in the three phases.
| Phase 1 | Phase 2 | Phase 3 | ||
|---|---|---|---|---|
| January | −2.8198 | −2.7482 | −2.8163 | |
| February | −2.7125 | −2.5591 | −2.6547 | |
| March | −2.2283 | −2.0445 | −2.1685 | |
| April | −0.9722 | −0.7810 | −0.8722 | |
| May | 0.1683 | 0.3787 | 0.2978 | |
| June | 1.0539 | 1.2361 | 1.1647 | |
| July | 1.9635 | 2.1712 | 2.0922 | |
| August | 1.9425 | 2.1880 | 2.1236 | |
| September | 1.0000 | 1.2534 | 1.1308 | |
| October | −0.2240 | 0.0353 | −0.1001 | |
| November | −1.4713 | −1.1860 | −1.3577 | |
| December | −2.5091 | −2.3309 | −2.4686 | |
| Average | Winter | −2.2667 | −2.0883 | −2.1566 |
| Summer | 1.0619 | 1.2620 | 1.1849 | |
Table 5.
Embodied energy (EE) consumption for each house.
| Materials | House Areas | Life Span (Year) | Volume (m3) | Density (kg/m3) | Weight (kg) | EE in Total (MJ) | EE (kWh/m2·year) | |
|---|---|---|---|---|---|---|---|---|
| Phase 1 | Rubble stone | 96 m2 | 50 | 125.9 | 2100 | 264,390 | 264,390 | 15.30 |
| Wooden rafter | 29.14 | 500 | 14,570 | 11,3646 | 6.58 | |||
| In total | 378,036 | 21.88 | ||||||
| Phase 2 | Rubble stone | 147 m2 | 50 | 82.71 | 2100 | 173,691 | 173,691 | 6.56 |
| Baked brick | 74.78 | 1700 | 127,126 | 381,378 | 14.41 | |||
| Wooden rafter | 47.95 | 500 | 23,975 | 187,005 | 7.07 | |||
| In total | 742,074 | 28.04 | ||||||
| Phase 3 | Baked brick | 150 m2 | 50 | 99.28 | 1700 | 168,776 | 506,328 | 18.75 |
| Concrete | 150.98 | 2500 | 377,450 | 358,588 | 13.28 | |||
| In total | 864,916 | 32.03 | ||||||
Note: Material densities are from the Thermal Design Code for Civil Building (GB5176-2016); the lifespan of residential houses in China is 50 years, as specified in Building Design Code for Residential buildings (GB50368-2005).
Table 6.
Embodied energy consumption of conventional residential buildings in different countries.
| Case Study | Country | Principal Structure | EE (kWh/m2·year) | Reference | |
|---|---|---|---|---|---|
| 1 | Sweden | Wood | 28 | Adalberth [23]. | |
| 2 | India | Adobe (Cement, sand, and soil) | 37 | Shukla et al. [24]. | |
| 3 | Indonesia | Clay | 13 | Utama and Gheewala [25]. | |
| 4 | China | Phase 1 | Stone | 21.88 | |
| Phase 2 | Baked brick | 28.04 | |||
| Phase 3 | Concrete and Baked brick | 32.03 | |||
© 2018 by the authors. Licensee MDPI, Basel, Switzerland. This article is an open access article distributed under the terms and conditions of the Creative Commons Attribution (CC BY) license (http://creativecommons.org/licenses/by/4.0/).
Share and Cite
MDPI and ACS Style
Deng, W.; Xie, J.; Peng, Z. Material Transitions and Associated Embodied Energy Input of Rural Buildings: Case Study of Qinyong Village in Ningbo China. Sustainability 2018, 10, 2016. https://doi.org/10.3390/su10062016
AMA Style
Deng W, Xie J, Peng Z. Material Transitions and Associated Embodied Energy Input of Rural Buildings: Case Study of Qinyong Village in Ningbo China. Sustainability. 2018; 10(6):2016. https://doi.org/10.3390/su10062016
Chicago/Turabian StyleDeng, Wu, Jing Xie, and Zhen Peng. 2018. "Material Transitions and Associated Embodied Energy Input of Rural Buildings: Case Study of Qinyong Village in Ningbo China" Sustainability 10, no. 6: 2016. https://doi.org/10.3390/su10062016
Note that from the first issue of 2016, this journal uses article numbers instead of page numbers. See further details here.