Transformations and the Level of Tourist Function Development in Polish Voivodeship Capital Cities


Department of Spatial Economy, Wrocław University of Environmental and Life Sciences, 50-375 Wrocław, Poland
*
Author to whom correspondence should be addressed.
Sustainability 2018, 10(6), 2095; https://doi.org/10.3390/su10062095
Submission received: 19 April 2018
/
Revised: 5 June 2018
/
Accepted: 15 June 2018
/
Published: 20 June 2018
(This article belongs to the Special Issue Sustainable Urban Tourism)
Abstract
:The article discusses transformations of the tourist function in Polish voivodeship capital cities in the period between 2005–2015. The first research stage was carried out through the background of the theory of city economic base using two indicators: index of surplus workers (ISW) and Florence specialisation coefficient (FSC). The conducted research covered employment size, structure, and changes, with a particular emphasis on employment in tourism. In the second stage of the study, based on a group of diagnostic characteristics describing the tourist functions performed by cities, taxonomic measures were constructed to determine the level of these functions’ development.
1. Introduction
The purpose of the article is to determine the level of development and the scope of tourist function implementation in Polish voivodeship capital cities. It is attempted to discuss the importance of this function for the economies of the studied cities in terms of impacts on their development opportunities. A question arises: to what extent was tourism forming the economic base of regional capitals? It is also interesting whether this function is gaining significance and becoming increasingly important for the entire economies of these capitals, i.e., against the background of other functions. The hypothesis will also verify whether the scope of tourist function implementation in the analysed cities continues to increase.
The study covers the years 2005–2015, and the changes identified within this time range will be analysed. The study is important to specify the distance separating cities in terms of the selected development aspect, and also allows distinguishing groups of cities presenting similar levels. The results may turn out to be useful for public authorities, predominantly the local government in managing urban organisms; in addition, they justify attracting more attention to tourist function development in the process of urban economic development. City authorities should consider why other entities presenting similar characteristics, having similar development potential and development factors, and frequently competing in a traditional way, can develop this economy sector dynamically. How do they do it; can the existing solutions be applied?
In the global dimension, tourism represents one of the most important and fastest-growing economic sectors [1,2,3,4,5]. The economic base diversification affects the stability of the economic system existing in an urban organism. Through having impact on the inflow of money to a city, it influences, through a series of effects, the improvement of its residents’ living standards. It is important from the perspective of achieving the sustainable development goals that are widely present in both the strategic documents of all of the studied regional capitals, the national strategic documents [6,7,8] and the European Union (EU) and global development guidelines [9]. It is also important that the economic effects of tourism apply to the elements of the natural or cultural environment as well [10].
Tourism, as opposed to other economic functions, carries out its mission, goals, and tasks using not only its own resources but, above all, the resources of the cooperating sectors [11]. It requires infrastructure development, adequate communication accessibility, additional services, efficient management of the entire area, and, moreover, an increased access to the information technologies that change a city into a smart city [12]. The aspect of proper care for the condition of the natural environment is essential. However, it is worth observing that the city structure transformations caused by the rapid development of tourism are not always positive and expected by the residents [13,14,15,16,17,18].
After the administrative reform, which came into force on 1 January 1999, 16 new voivodeships were established in Poland; simultaneously, 18 cities started functioning as their capitals: voivodeship cities. Fourteen of them i.e., Białystok, Gdańsk, Katowice, Kielce, Cracow, Lublin, Łódź, Olsztyn, Opole, Poznań, Rzeszów, Szczecin, Warsaw, and Wrocław are also the seats of voivodeship governors, and the seats of voivodeship self-government authorities. These functions were separated in two voivodeships. In Kujawsko-Pomorskie, voivodeship Bydgoszcz is the seat of the voivodeship governor, and Toruń is the seat of voivodeship Parliament and Marshal’s Office. The situation is similar in Lubuskie voivodeship: Gorzów Wielkopolski remains the seat of the voivodeship governor, whereas Zielona Góra is the seat of voivodeship self-government authorities [19,20,21]. Even though all of the surveyed cities, according to the typological classification that is popular in Poland [22], are included in the group of large cities [over 100,000 inhabitants], there are significant differences in their sizes (Table 1).
2. Background
Tourism is a dynamically developing area of economic activity. Hence, it is so important that it meets the requirements of sustainable development. The urban context makes the development processes take on a slightly different character, and it is not obvious how to plan, implement, and evaluate actions that are aimed at the sustainable development of a city [23]. The aforementioned problem is perceived by the supporters of the so-called compact city, i.e., the theory highlighting strong connections between the urban form and sustainable development, but also recognizing that these relationships are not direct and therefore difficult to capture and model [24]. Striving for the sustainable development of urban areas requires balancing the city functions [25], which is particularly important in the context of the dominating approach, presented in the subject literature, about the existence of a close correlation between the level of tourist function and the dynamics of city development [26,27,28,29]. The promotion of urban tourism is associated with economic revitalisation and economic development of cities [30]. At the same time, it has been highlighted for a long time that mass tourism brings about the danger of undesirable space transformation and cultural changes [31,32,33,34,35]. It primarily refers to historic city centres [36]. The above-mentioned phenomenon may result in the loss of city endogenous potential, on which the development of the described function is based. In Poland, this problem occurs primarily in Krakow, which is a city presenting specific cultural values that is visited by several million tourists annually [37,38]. The described threats can be eliminated by placing emphasis on ensuring a coherent social structure and urban planning along with adopting the paradigm of balancing the interests of current and future city space users [39].
From the perspective of sustainable city development and sustainable urban tourism development, the research conducted by Freestone is highly important, since he observed that the so-called green town planning can cause the city to be perceived as a tourist attraction [40]. The above observation is also significant in the context of local development [41]. In Poland, the city of Poznań offers attractive green areas (so-called Malta). It is also important to appreciate the role of the city’s cultural policy as a product addressed to both residents and tourists [42]. In this respect, Wrocław, playing the role of the European Capital of Culture, stood out among other Polish cities. Empirical research indicates that in the case of cities with industrial heritage tourism, it is also important in the context of post-industrial development [43]. In Poland, e.g., Łódź or Szczecin are included among such cities. The adequately supported tourist function triggers infrastructure base development, increasing the city’s economic competitiveness and upgrading the residents’ living conditions [44]. Empirical research indicates that tourism supports the development of relations between enterprises operating in a given space and enables them to achieve a synergistic effect [45]. All of the listed nuances of tourism and urban development connections emphasise the importance of tourist functions in the processes of economic development.
The administrative reform carried out in Poland (1999) created specific conditions for the development of the studies cities, which makes international comparisons highly difficult. In administrative terms, the role of the analysed cities as the leading (central) centres in the region was emphasised. It is well known that central cities have administrative and political goods at their disposal that determine their higher position in the settlement system structure. These external functions are manifested in their greater development dynamics [46], which has bearing on the conducted research.
3. Research Method
The first stage of the study was based on the theory of economic base. This is one of the more popular concepts explaining the development processes occurring in a regional or local scale, e.g., in a city [47]. Its primary assumption is to base area development on export, i.e., the activity that meets the needs of residents from other domestic and foreign territorial units. According to this concept, an external demand for goods or services produced in a given area represents the most important component stimulating economic growth. Export-oriented companies and economic sectors form the so-called economic base of the region, or economic base of the city. The development of this database provides multiplier effects in the form of the related sectors, subcontractors, and the local and regional services market development [48]. In theory, people employed in a given city can be divided into two groups: an endogenous group, which consists of people working for the needs of the city and its residents, and an exogenous group, which includes employees who work, in a way, “for export” purposes, i.e., meet the needs of residents from other areas.
Such a division of employees in a city allows distinguishing two basic groups of city functions:
- endogenous (service-oriented) functions: met by these branches of city economy, which mainly serve the local population and decide, to a great extent, about the city’s attractiveness for its residents,
- exogenous (city-forming, specialized) functions: met by these branches of city economy that serve not only the local population, but predominantly the population living in city outer areas, which form the economic base of the city; their development results in cash inflow to the city, in a rapid increase of endogenous activity, and consequently in an overall city development [49]. The development of exogenous functions can become a source of general social benefits, which will be manifested by an increased importance of a city centre, an extended range of its impacts, an increased level of attractiveness as the place meeting higher-order needs, and a potential location for new investments [50]. Companies representing these branches, especially the ones of a regional nature, should thus be supported by public authorities [51]. The additional argument for supporting local entrepreneurs is their usually higher “loyalty” and emotional ties with the territory where their companies and households are located. It is also related to these companies’ development based on endogenous development factors. It is worth emphasising that a number of significant regional and local development concepts highlight the positive effects of development processes based on the above-mentioned factors, and recommend supporting local enterprises by public authorities.
Two methods for city economic base measurement were used in the article: index of surplus workers (ISW) and Florence specialisation coefficient (FSC).
An index of surplus workers can be used to determine employment size in the exogenous group. This is done by comparing the actual employment structure in the city against the structure adopted as the basis of reference, such as for example, national or regional employment structure. A negative measure value indicates a shortage in a particular area, which has to be supplemented by importing products from external areas. A positive measure value indicates the size of an exogenous group within the given sphere of activity. By bringing it to a comparable relative form, the employment structure indexes in an exogenous group are obtained, and thus the measures of particular types of city-forming functions in an examined object are obtained also.
FSC allows identifying the specialised functions (FSC >1) that are decisive for city importance in a region or a country. The higher the coefficient value, the higher the level of city specialisation in a given economic sector. It should be added that FSC and ISW were comprehensively characterised in earlier studies [52,53].
In the second stage of the study, the level of tourist function development in cities was examined using a non-model synthetic measure hi. The application of synthetic measures allows quantifying, by means of using a single number, the development status of the studied phenomenon describing something that usually requires using many diagnostic characteristics [54,55,56,57,58,59]. The application of synthetic indicator measures allow for the effective characteristics and the organisation of socio-economic changes occurring in the examined area [60]. It is possible to create the ranking of examined objects; thus, the perception of the studied problem becomes more complete [61].
The hi index is the arithmetic mean of normalised variables. The obtained measures are normalised in the range <0; 1>. The higher the measured value, the higher the object’s position in the created ranking.
Firstly, the tourist function characteristics in the examined cities were chosen, and their values were subject to preliminary analysis. The analysis covered:
The Baretje–Defert index (1): informing about the level of tourist function development in a given area [62].
2. The Charvat index (2): the measure defining the number of overnight stays sold per 100 residents of the area, which allows assessing the intensity of tourist traffic in the studied area [63].
The accommodation density index: calculated as the quotient of the number of beds per km2, informing about the level of tourist development of the area.
The Florence specialisation coefficient: calculated for cumulated sections I (activities related to accommodation and catering services) and R (activities related to culture, entertainment, and recreation) based on the Polish Statistical Classification of Economic Activities (NACE) 2007.
In order to standardise the measurement units for particular characteristics and their order of magnitude, normalisation was performed according to Formula (3):
where:
- zij–normalised object value of i number for Xj characteristic
- xij–object value of i number for Xj characteristic
The applied procedure allows maintaining the diversified variation of characteristics and proportions between the normalised and primary values, thus assigning a differentiated significance to them.
Next, using Formula (4), hi measures were calculated for the studied cities:
where:
- hi: non-model synthetic measure value in i object
- p: number of characteristics.
The article does not aim at introducing the new methodology, but rather at defining the development level and the scope of tourist function implementation. The research methods used in the article are present in the subject literature. However, it is worth noting that they were not widely used in the context of analysing tourist functions. In the first stage of the study, as indicated above, they refer to the theory of economic base, which was broadly discussed in the social sciences in the 20th century. A certain novelty in the second stage of the research is the construction of a synthetic measure, and more precisely the selection of a set of diagnostic characteristics describing the tourist function in the studied cities.
4. Results
4.1. Transformations of the Functional Structure of Polish Voivodeship Capital Cities, with Particular Emphasis on Tourist Function Changes
For the purposes of the study, the data on the number of the employed in Polish voivodeship capital cities, and in Poland in total, were collected in particular groups of sections (sectors), according to NACE 2007, in 2005 and in 2015. In addition, the information about employment in sections I and R was provided, as closely related to the tourist function played by the regional capitals. Based on the data presented in Table 2, ISW was calculated for Polish voivodeship capital cities (Table 3). The domestic employment structure was adopted as the reference base for the study. The form of ISW was also brought down to a relative form, allowing for comparisons in the city group. As a result, the measure of particular city-forming functions was obtained, i.e., employment structure in an exogenous group (Table 4). The FSC was also calculated on the basis of the data from Table 2 and is presented in Table 5.
It can be noticed that the measured ISW of exogenous groups’ size (Table 3) in 17 out of 18 cities recorded the highest increase, i.e., over 2.5 times in Toruń [accompanied by significant transformations of this city functional structure] or in Wrocław (by 71%). The size of the city-forming group was reduced only in Zielona Góra, where it accounted for 83% of the 2005 size. Except for Gorzów Wielkopolski, Polish capital cities remained multi-functional centres with the dominant role of different types of services. It is worth paying attention to the relatively small importance of the industrial sector, which played an important role for the city-forming part of economy in Gorzów Wielkopolski only.
Having focused on the tourism function carried out in regional capitals (Table 3, bold shows negative values of ISW), it is noticeable that in 2005, it supplemented the economic landscape in 16 cities (excluding Bydgoszcz and Rzeszów), including in section I of NACE in 10 of them, and in case of section R, in 15. In nine cities: Cracow, Poznan, Warsaw, Opole, Szczecin, Wroclaw, Gdansk, Olsztyn, and Lublin, both sections related to tourism were simultaneously involved in exogenous employment. Among them (Table 4), tourism was most important for the city-forming group in Cracow (jointly for section I and R, over an 18% share in the entire exogenous group) and in Poznań (8.9%), whereas it was the least important in Olsztyn and Lublin (2.3% and 0.9%, respectively).
The analysis of employment structure indicators, in the exogenous group of the analysed cities in 2015, shows that after 10 years in one city only, i.e., industrial Gorzów Wielkopolski, tourist functions did not present the city-forming nature. At the same time, in nine regional capitals: Cracow, Toruń, Kielce, Opole, Gdańsk, Warsaw, Szczecin, Wrocław, and Olsztyn, two sections related to tourism were simultaneously involved in exogenous employment. For Cracow, it was 11.5%, for Toruń it was 10.2%, whereas for Wrocław and Olsztyn, it was 3.6% and 3.5%, respectively.
However, it should be observed that in case of nine out of the 18 studied cities, the importance of tourist function, measured by its share in the exogenous group, went down. It is even more significant as it covers the group of the largest Polish cities, which are inhabited by at least 500,000 residents: the country capital Warsaw, Cracow, Łódź, Wrocław, and Poznanń (as well as next in size, Gdańsk and Szczecin).
The above information can be supplemented by the analysis of FSC for the studied cities (Table 5, bold means the absence of specialisation). As it has already been mentioned, FSC allows the identification of specialised functions, which are decisive for the importance of a city in a country; it is also helpful in defining this specialisation level. The value of the W ≤ 1 measure informs that the city does not specialise in a particular economy sector, i.e., this activity area is of an endogenous nature. The value in the range 1.5 < W ≤ 2 means an average specialisation level, while W > 2 informs that the centre is characterised by a high specialisation level in a given section.
It is noticeable that in 2005, only Cracow presented high specialisation in the activities related to accommodation and catering services (section I). The level of this specialisation was decreasing till 2015; however, it maintained the highest level in the group of analysed cities (FSC value in 2005–2.02 and in 2015–1.91). In Poznań, Warsaw, and Wrocław the specialisation level in terms of this section went down from medium to low, while in other cities, it did not exceed the low level.
In terms of culture, entertainment, and recreation-related activities (section R), two significant changes, heading in different directions, were recorded. In Cracow, the importance of this section shrank from medium to low; however, in Katowice, it simultaneously went up from low to medium (FSC value in 2005–1.07 and in 2015–1.67). The other urban centres presented low specialisation levels in this respect (in 2015: Gdańsk, Kielce, Lublin, Łódź, Olsztyn, Opole, Szczecin, Toruń, Warszawa, Wrocław, Zielona Góra) or its absence (in 2015: Białystok, Bydgoszcz, Gorzów Wielkopolski, Poznań, Rzeszów).
The results of FSC value analysis were calculated for joint (cumulated) sections I and R of NACE 2007 (Table 5). However, the highest decreasing specialisation level regarding the carried out tourist function, in the group of regional capitals, was recorded for Cracow (2005–1.78, 2015–1.58). The country capital Warsaw was characterised by the decreasing specialisation level in this economy sector, from medium to low (2005–1.64, 2015–1.34).
A stable (change up to 10% indicator value within 10 years) or low specialisation level related to this function was recorded in eight cities (Białystok, Gdańsk, Lublin, Olsztyn, Opole, Szczecin, Wrocław, and Zielona Góra), while Poznań was characterised by its low level along with its dynamic fall. In Katowice, Kielce, and Toruń, in the period of 10 years, tourist functions were developed and gained a city-forming nature, whereas in Gorzów Wielkopolski, and Łódź, the loss of specialisation in this respect, which was already low in 2005, was recorded. In Bydgoszcz and Rzeszów, the tourist function, when measured in this way, did not present an exogenous nature.
4.2. Tourist Function Development Level in Cities Analysed Using Non-Model Synthetic Measure Hi
The preliminary analysis, covering the values of characteristics collected for the study (Table 6) allows concluding that the level of tourist function recorded a decline in three examined cities: Gorzów Wielkopolski (by 28.89%), Zielona Góra (by 14.89%), and in Olsztyn (6%). In the other centres, the comparison of the Baretje–Defert index for 2005 and 2015 shows an increased level of the discussed function development. The intensity of tourist traffic increased in 16 studied cities; only Gorzów Wielkopolski and Zielona Góra recorded a decline in the Charvat index value. The level of tourism development that was measured using the accommodation density index was similar to the Baretje–Defert index; Gorzów Wielkopolski, Olsztyn, and Zielona Góra were characterised by lower values in 2015 than in 2005. The other cities were characterised by a higher density of accommodation facilities. More detailed information is presented in Table 6.
Based on the above presented data, supplemented by the information about FSC for the cumulated sections I and R of NACE 2007 (Table 4), using Formulas (3) and (4), the non-model synthetic measure was calculated for the regional capitals (Table 7).
It is noticeable that the level of tourist function realisation in the analysed cities, which was measured using the non-model synthetic measure, was significantly different. In 2005 in Bydgoszcz, which presented the lowest values in this respect, it amounted to 31.3% of the best Cracow value. In 2015, Gorzów Wielkopolski and Zielona Góra were ranked ex aequo at the lowest positions. The values of the measures calculated for them were 24.7% of the ranking leader’s value.
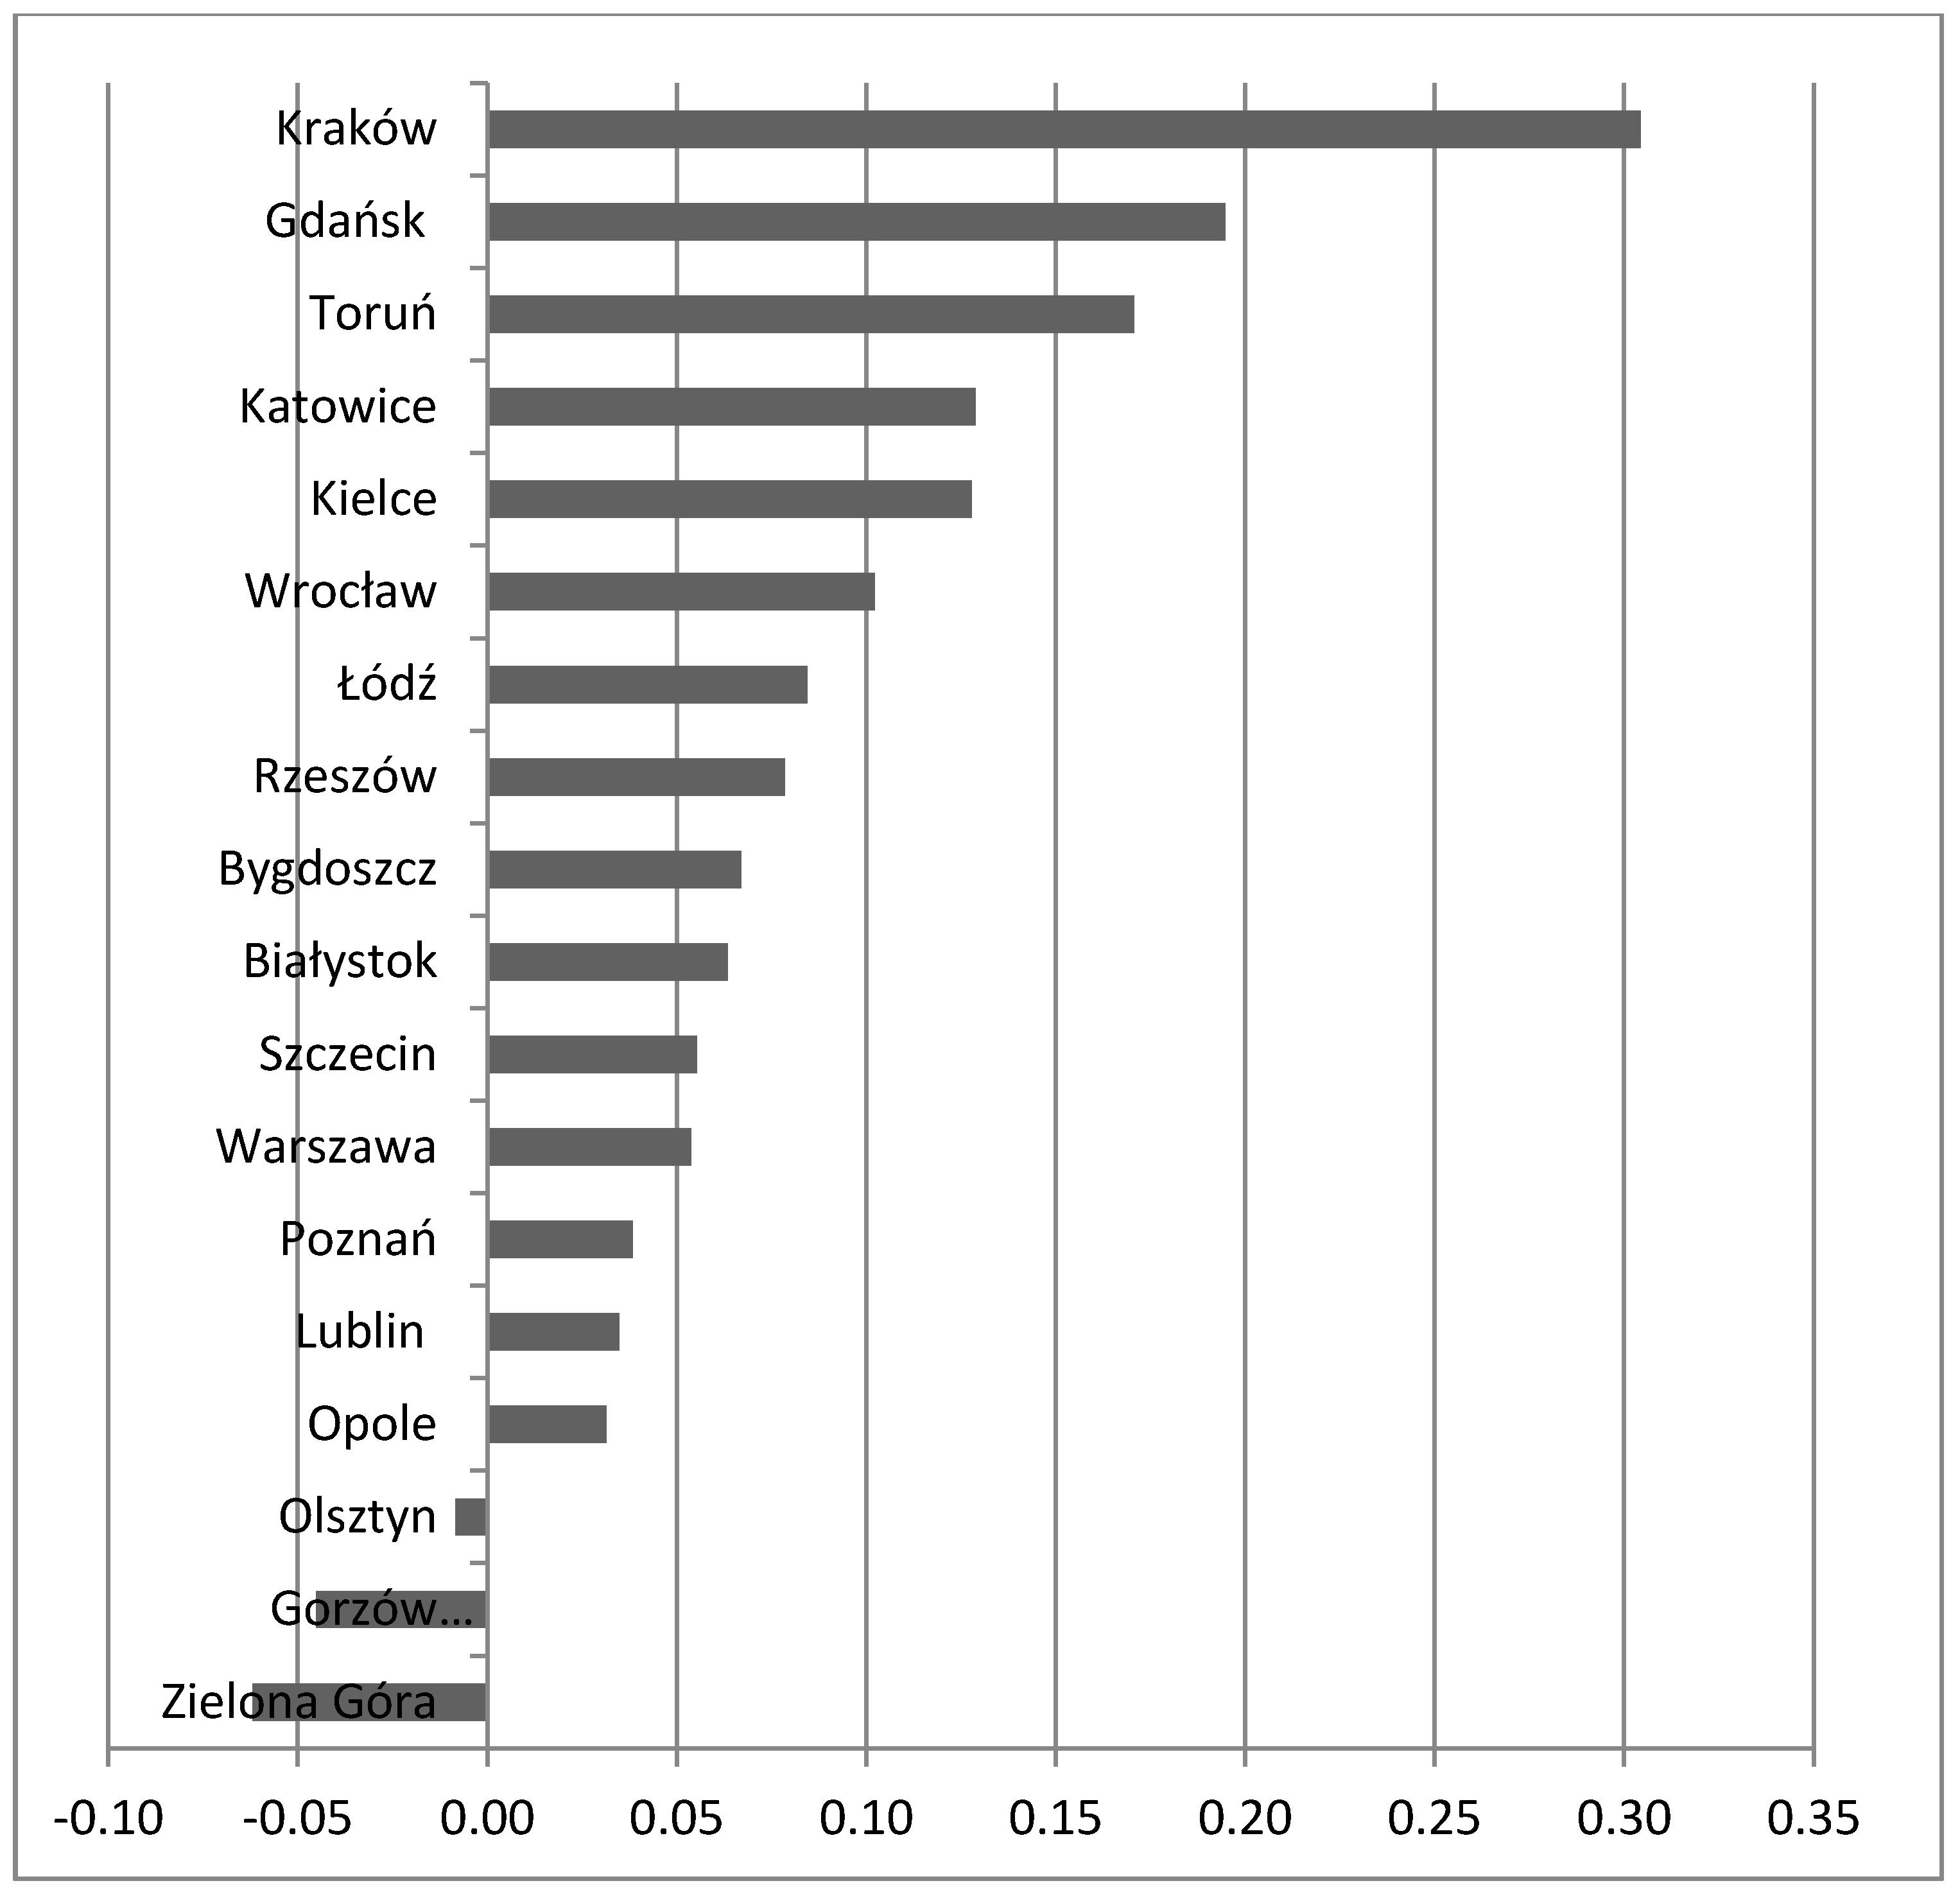
To better illustrate the changes in hi values, for each city, the figure was used (Figure 1). It presents the differences between the measured values in 2005 and 2015. Positive values show its increase, and thus the tourist function upward trend in a given city, whereas negative values point to the decline of this function in the city. Therefore, it can be concluded that in case of 15 out of 18 cities, the tourist function was developed the most in Cracow, Gdańsk, and Toruń. These cities, already in 2005 (and before), offered extensive accommodation facilities and advantages enhancing tourism development. By 2015, their level of attractiveness and competitiveness increased significantly against other cities. The country capital Warsaw was by no means better compared with the other cities, as it recorded a lower than average increase in the dynamics of the studied phenomenon. The research result is even more interesting if it is considered that Warsaw represents the largest centre of business tourism in Poland [64]. In recent years, many attractive tourist facilities were also established here (including the Warsaw Uprising Museum, Copernicus Science Centre, POLIN Museum of the History of Polish Jews); the city participated in international events such as e.g., UEFA European Championship EURO 2012, or the Men’s Volleyball World Championship 2014. It is worth comparing it with the research results on the European cities development. Although large centres benefit from their size, it is not automatically manifested by their dominance in all aspects of development [65]. In three voivideship cities, the scope of the discussed function realisation was reduced, most significantly in Zielona Góra, and next in Gorzów Wielkopolski and Olsztyn. The case of Olsztyn is interesting, since the scope of tourist functions carried out by this city, at the background of other cities, was high already in 2005 and remained so till 2015. However, as opposed to the majority of other cities, not much was invested in the development of tourism in the course of 10 years; thus, this situation can be referred to as a specific stagnation. It is even more significant that Olsztyn is the capital of a very attractive tourist region, the Warmińsko-Mazurskie voivodeship, which is rich in natural wealth and called “The Land of Thousands of Lakes”. The significant decline recorded by Zielona Góra is mainly attributed to the statistical effect related to the change in the territorial division of the viovodeship. In 2015, several adjacent municipalities, which were poorer in tourist infrastructure, were included in Zielona Góra. It resulted in its area increasing from 58 km2 up to 277 km2, and the decline in this infrastructure saturation in the new municipalities of the city. Gorzów Wielkopolski, as it has been demonstrated in the first part of the research, represents the city in which development is based on industry and public service sector, and that does not correspond to involvement in tourism.
5. Conclusions
The research was conducted in two stages. In the first step, based on the theory of economic base, following an in-depth analysis of employment size, the more expensive role of tourism function in city economies was specified. This stage allowed determining the scope of the analysed function realisation in capital cities against the background of the national economy. It answered the question of to what extent tourism formed the economic base of regional capitals, and whether the tourist function keeps gaining importance and becoming increasingly essential for the entirety of urban economies, i.e., against the background of other functions performed. Basically, it can be stated that this function was a part of these cities’ economic landscape as their supplementing feature, but it was not the dominating one. It can be noticed that only in industrial Gorzów Wielkopolski, the tourist functions did not present a city-forming nature. The vast majority of Polish voivodeship capital cities remained multi-functional centres with developed service sectors, including tourist services. Apparently, this tendency is characteristic for most large cities worldwide. The ongoing processes, which are related to land and other real estate prices, resulted in the communication access of the industry moving partially out of cities and being replaced by various types of services.
It should be emphasised that the importance of tourist functions recorded a decline in half of the 18 studied cities, as measured by the share in the exogenous group. It is all the more significant that it referred to the group of the largest Polish cities inhabited by at least 500,000 residents. It can be adopted that this is due to two factors: a significant increase in the number of people employed in sections I and R of NACE 2007 across Poland, which served as benchmark in the study (statistical effect), and the dynamic increase in employment of other NACE sections establishing the economic base of the examined cities. In the years 2005–2015, Poland recorded a great economic success, manifested in e.g., stable gross domestic product (GDP) increase. In 2016, Polish GDP, in accordance with the World Bank estimates, amounted to USD469.5 billion against USD306.1 billion in 2005. The value of exports more than doubled, from USD89,388.1 million in 2005 to USD205,047.7 million in 2016. At the same time, gross real disposable income in the household sector in 2016 accounted for 143.9% of the value for 2005 [66]. It obviously resulted in a lower unemployment rate, along with a simultaneous higher employment rate in particular industries, constituting in line with the adopted methodology, the basis for determining the scope of the implementation of the analysed functions.
According to the predominant approach presented in the subject literature, settlement units, which concentrate several or all types of functions in their area, have greater chances for survival and rapid development [67,68,69]. In this context, it should be observed that the diversification of a city’s economic base, including tourism-related activities, facilitates the construction of an area’s development potential. As mentioned before, a number of important concepts of regional and local development emphasise the positive effects of development processes based on endogenous development factors. It is worth observing that in their operations, tourism sector companies mainly take advantage of regional and local potentials, drawing from these factors. Public authorities, by creating favourable conditions for running a business, along with caring about the quality of resources at their disposal, including a proper institutional and legal system and personnel resources, should therefore strive to strengthen the significance of the discussed industry sector.
It is worth paying attention to the increasing size of the exogenous group in 17 out of 18 cities between 2005–2015. It can be adopted that this result is a derivative of the dynamic development processes occurring in regional capitals, also covering the structures of their economies.
The second stage consisted of constructing rankings of the cities selected for the study in terms of the scope of their tourist functions in 2005 and 2015. The ranking was developed based on four characteristics, which comprehensively describe the phenomenon studied in regional capitals. In both cases, Cracow was the leader as the city with large, centuries-old traditions, also in the field of tourism. Warsaw, Olsztyn, and Gdańsk were alternately taking high positions as well.
The second stage also allowed verifying the hypothesis that the scope of tourist functions in the studied cities does increase. The study covered the same set of characteristics for 2005 and 2015. Therefore, it was possible to determine changes in the level of tourist activities measured using the synthetic measure, i.e., to specify how the analysed centres were developing in the discussed area against each other. The verified hypothesis was only partially confirmed. In the vast majority of voivodeship capital cities (15 out of 18), the scope of tourist activity expanded, although much of the diversified dynamics of this phenomenon should be emphasised. However, in three cities: Olsztyn, Gorzów Wielkopolski, and Zielona Góra, for various reasons, the reduced intensity of respective activities or even stagnation in this area was observed.
The application of the proposed indicator measure can serve as a helpful tool in managing the process of city or regional development. Using such tools allows implementing decision support systems by the local authorities [70,71], and thus supporting smart decision-making, which brings cities and regions closer to the idea of sustainable development.
The dynamics of tourist market transformations and the emerging phenomenon of some consumers abandoning mass tourism, based on a standardised product, forces city authorities to change their tourist offerings. Many experts emphasise the importance of the role played by the local government in developing their municipality attractiveness [72]. Creating scenarios for the development of tourist functions respecting residents’ rights and preventing the cultural value loss of the space, along with fulfilling visitors’ expectations, becomes increasingly important [73]. An open question remains as to whether Polish cities are going to keep up with this trend. The introduction of city games and questing as a tourist product of Warsaw is a good example [74].
Author Contributions
Both authors designed the research and analyzed the data. Both authors wrote the paper, read, and approved the final manuscript.
Conflicts of Interest
The authors declare no conflict of interest.
References
- Martins, L.; Gan, Y.; Ferreira-Lopes, A. An empirical analysis of the influence of macroeconomic determinants on World tourism demand. Tour. Manag. 2017, 61, 248–260. [Google Scholar] [CrossRef] [Green Version]
- Romão, J.; Kourtit, K.; Neuts, B.; Nijkamp, P. The smart city as a common place for tourists and residents: A structural analysis of the determinants of urban attractiveness. Cities 2018, 78, 67–75. [Google Scholar] [CrossRef]
- García-Hernández, M.; Calle-Vaquero, M.; Yubero, C. Cultural Heritage and Urban Tourism: Historic City Centres under Pressure. Sustainability 2017, 9, 1346. [Google Scholar] [CrossRef]
- Moutinho, L.; Vargas-Sanchez, A. (Eds.) Strategic Management in Tourism; CABI Tourism Texts; CABI: Wallingford, UK, 2018. [Google Scholar]
- Vanhove, N. The Economics of Tourism Destinations: Theory and Practice; Routledge: London, UK, 2017. [Google Scholar]
- Prezesa Rady Ministrów. Resolution No. 157 of the Council of Ministers of September 25, 2012 on adopting the National Development Strategy 2020; Monitor Polski: Warsaw, Poland, 2012. [Google Scholar]
- Prezesa Rady Ministrów. Resolution No. 16 of the Council of Ministers of February 5, 2013 on adopting the Long-term National Development Strategy. Poland 2030. The Third Wave of Modernity; Monitor Polski: Warsaw, Poland, 2013. [Google Scholar]
- Prezesa Rady Ministrów. Resolution No. 8 of the Council of Ministers of February 14, 2017 on adopting the Responsible Development Strategy until 2020 (with a prospect until 2030); Monitor Polski: Warsaw, Poland, 2012. [Google Scholar]
- The United Nations (UN). Transforming our world: The 2030 Agenda for Sustainable Development KOM (2010). Available online: http://www.un.org (accessed on 1 June 2018).
- Kachniewska, M.; Nawrocka, E. Turystyka jako przedmiot badań ekonomicznych [Tourism as the subject of economic research]. In Rynek Turystyczny [Tourist Market]; Kachniewska, M., Nawrocka, E., Niezgoda, A., Pawlicz, A., Eds.; Wolters Kluwers Publishers: Warsaw, Poland, 2012; pp. 15–32. [Google Scholar]
- Kubiak, B. Rola informacji w warunkach globalizacji: Kapitał, turystyka, usługi [The role of information in globalization conditions: Capital, tourism, services]. In Konsument na Rynku Turystycznym. Informacja Turystyczna w Europie [A Consumer on the Tourist Market. Tourist Information in Europe]; Chudy-Hyski, D., Żemła, M., Eds.; University of Business in Wrocław Press: Katowice, Poland, 2010; pp. 17–34. [Google Scholar]
- Encalada, L.; Boavida-Portugal, I.; Cardoso Ferreira, C.; Rocha, J. Identifying Tourist Places of Interest Based on Digital Imprints: Towards a Sustainable Smart City. Sustainability 2017, 9, 2317. [Google Scholar] [CrossRef]
- Chadha, H.; Onkar, P. Changing Cities in the Perspective of Religious Tourism—A case of Allahabad. Procedia Technol. 2016, 24, 1706–1713. [Google Scholar] [CrossRef]
- De Roo, G. Integrating City Planning and Environmental Improvement: Practicable Strategies for Sustainable Urban Development; Routledge: London, UK, 2017. [Google Scholar]
- Yang, B.; Xu, T.; Shi, L. Analysis on sustainable urban development levels and trends in China’s cities. J. Clean. Prod. 2017, 141, 868–880. [Google Scholar] [CrossRef]
- Guzmán, P.C.; Roders, A.P.; Colenbrander, B.J.F. Measuring links between cultural heritage management and sustainable urban development: An overview of global monitoring tools. Cities 2017, 60, 192–201. [Google Scholar] [CrossRef]
- Waddell, P. UrbanSim: Modeling urban development for land use, transportation, and environmental planning. J. Am. Plan. Assoc. 2002, 68, 297–314. [Google Scholar] [CrossRef]
- Salet, W.G.; Thornley, A.; Kreukels, A. (Eds.) Metropolitan Governance and Spatial Planning: Comparative Case Studies of European City-Regions; Taylor & Francis: London, UK, 2003. [Google Scholar]
- Przybyła, K.; Kachniarz, M. The Impact of Administrative Reform on the Central Functions of Larger Polish Cities. J. Econ. Issues 2017, 51, 843–862. [Google Scholar]
- Przybyła, K.; Kulczyk-Dynowska, A.; Kachniarz, M. Quality of Life in the Regional Capitals of Poland. J. Econ. Issues 2014, 2014, 181–196. [Google Scholar] [CrossRef]
- Przybyła, K. Poziom Rozwoju Infrastruktury Technicznej w Miastach Wojewódzkich Polski [The Level of Technical Infrastructure Development in Polish Voivodeship Capital Cities]; Research Papers of Wrocław University of Economics No. 331; University of Business in Wrocław Press: Wrocław, Poland, 2014; pp. 106–115. [Google Scholar]
- Brol, R.; Maj, M.; Strahl, D. Metody Typologii Miast [City Typology Methods]; University of Economics in Wrocław Press: Wrocław, Poland, 1990. [Google Scholar]
- Cohen, M. A Systematic Review of Urban Sustainability Assessment Literature. Sustainability 2017, 9, 2048. [Google Scholar] [CrossRef]
- Burton, E.; Jenks, M.; Williams, K. The concept of the compact city. In The Compact City: A Sustainable Urban Form? Burton, E., Jenks, M., Williams, K., Eds.; Routledge, Oxford Brookes University: Oxford, UK, 2003; pp. 2–6. [Google Scholar]
- Calthorpe, P. “The Next American Metropolis” from the Next American Metropolis: Ecology, Community, and the American Dream. In Sustainable Urban Development Reader; Wheeler, S.M., Beatley, T., Eds.; Urban Reader Series; Routledge: London, UK; New York, NY, USA, 1993; pp. 119–130. [Google Scholar]
- Law, C.M. Urban Tourism: Attracting Visitors to Large Cities; Mansell Publishing Limited: London, UK, 1993. [Google Scholar]
- Law, C.M. Urban Tourism: The Visitor Economy and the Growth of Large Cities; Cengage Learning Emea, Continuum: New York, NY, USA; London, UK, 2002. [Google Scholar]
- Page, S.J. Urban Tourism; Routledge, London, UK, 1995.
- Rogerson, C.M.; Visser, G. Tourism Research and Urban Africa the South African Experience. In Urban Tourism in the Developing World: The South African Experience; Rogerson, C.M., Visser, G., Eds.; Routledge: London, UK, 2007. [Google Scholar]
- Rogerson, C.M. Urban tourism in the developing world: The case of Johannesburg. Dev. South. Afr. 2002, 19, 169–190. [Google Scholar] [CrossRef]
- Berg, L.D.; Borg, J.; Meer, J.V. Urban tourism: performance and strategies in eight European cities; Avebury: Aldershot, UK, 1995. [Google Scholar]
- Van der Borg, J.; Costa, P.; Gotti, G. Tourism in European heritage cities. Ann. Tour. Res. 1996, 23, 306–321. [Google Scholar] [CrossRef]
- Jansen-Verbeke, M.; Lievois, E. Analysing heritage resources for urban tourism in European cities. In Contemporary Issues in Tourism Development; Pearce, D.C., Butler, R.W., Eds.; Routledge: London, UK, 1999; pp. 81–107. [Google Scholar]
- Tombolini, I.; Zambon, I.; Ippolito, A.; Grigoriadis, S.; Serra, P.; Salvati, L. Revisiting “Southern” Sprawl: Urban Growth, Socio-Spatial Structure and the Influence of Local Economic Contexts. Economies 2015, 3, 237–259. [Google Scholar] [CrossRef] [Green Version]
- Alvarez-Sousa, A. The Problems of Tourist Sustainability in Cultural Cities: Socio-Political Perceptions and Interests Management. Sustainability 2018, 10, 503. [Google Scholar] [CrossRef]
- García-Hernández, M.; de la Calle-Vaquero, M.; Yubero, C. Cultural Heritage and Urban Tourism: Historic City Centres under Pressure. Sustainability 2017, 9, 1346. [Google Scholar] [CrossRef]
- Ashworth, G.J. Holocaust tourism: The experience of Kraków-Kazimierz. Int. Res. Geogr. Environ. Educ. 2002, 11, 363–367. [Google Scholar] [CrossRef]
- Murzyn-Kupisz, M. Cultural quarters as a means of enhancing the creative capacity of Polish cities? Some evidence from Cracow. Quaestiones Geographicae 2012, 31, 63–76. [Google Scholar] [CrossRef]
- Borowczyk, J. Sustainable Urban Development: Spatial Analyses as Novel Tools for Planning a Universally Designed City. Sustainability 2018, 10, 1407. [Google Scholar] [CrossRef]
- Freestone, R. Urban Planning in a Changing World: The Twentieth Century Experience; Routledge: Abingdon, UK, 2000. [Google Scholar]
- Tang, W.; Zhou, T.; Sun, J.; Li, Y.; Li, W. Accelerated Urban Expansion in Lhasa City and the Implications for Sustainable Development in a Plateau City. Sustainability 2017, 9, 1499. [Google Scholar] [CrossRef]
- Garcia, B. Cultural policy and urban regeneration in Western European cities: Lessons from experience, prospects for the future. Local Econ. 2004, 19, 312–326. [Google Scholar] [CrossRef]
- Caffyn, A.; Lutz, J. Developing the heritage tourism product in multi-ethnic cities. Tour. Manag. 1999, 20, 213–221. [Google Scholar] [CrossRef]
- Crouch, G.I.; Ritchie, J.B. Tourism, competitiveness, and societal prosperity. J. Bus. Res. 1999, 44, 137–152. [Google Scholar] [CrossRef]
- Alberti, F.G.; Giusti, J.D. Cultural heritage, tourism and regional competitiveness: The Motor Valley cluster. City Cult. Soc. 2012, 3, 261–273. [Google Scholar] [CrossRef]
- Preston, R.E. Christaller’s research on the geography of administrative areas. Progress Hum. Geogr. 1992, 16, 523–539. [Google Scholar] [CrossRef]
- Schumpeter, J.; Backhaus, U. The theory of economic development. In Joseph Alois Schumpeter; Springer: Boston, MA, USA, 2003; pp. 61–116. [Google Scholar]
- Grosse, T.G. Przegląd Koncepcji Teoretycznych Rozwoju Regionalnego [The Review of Theoretical Concepts of Regional Development]; Regional and Local Studies; University of Warsaw: Warsaw, Poland, 2003. [Google Scholar]
- Słodczyk, J. Przestrzeń Miasta i jej Przeobrażenia [City Space and Its Transformations]; University of Opole Press: Opole, Poland, 2001. [Google Scholar]
- Zajdel, M. Selected theories according to regional and local development in context of labour market. Studia Prawno-Ekonomiczne 2011, 83, 397–421. [Google Scholar]
- Malizia, E.E.; Feser, E.J. Understanding Local Economic Development, Rutgers; Centre for Urban Policy Research: New Brunswick, NJ, USA, 1999. [Google Scholar]
- Przybyła, K. Wpływ Specjalnych Stref Ekonomicznych na Kształtowanie się Bazy Ekonomicznej Miast [The Impact of Special Economic Zones on City Economic Base Development]; University of Environmental and Life Sciences: Wrocław, Poland, 2010. [Google Scholar]
- Przybyła, Z.; Przybyła, K. The transformations in the functional structure of Jelenia Góra. In Hradec Economic Days 2011, Economic Development and Management of Regions, Part I; University of Hradec Kralove: Hradec Kralove, Czech Republic, 2011. [Google Scholar]
- Stanisławski, M. Ocena efektywności restrukturyzacji wybranego sektora gospodarki w Polsce z wykorzystaniem taksonomicznego miernika rozwoju społeczno—gospodarczego. Bank i Kredyt 2010, 6, 85–104. [Google Scholar]
- Marti, R.; Reinelt, G. The Linear Ordering Problem, Exact and Heuristic Methods in Combinatorial Optimization; Springer: Berlin/Heidelberg, Germany, 2011. [Google Scholar]
- Kukuła, K. Propozycja budowy rankingu obiektów z wykorzystaniem cech ilościowych oraz jakościowych [Proposal of ranking construction on the basis of quantitative and qualitative variables]. In Metody Ilościowe w Badaniach Ekonomicznych [Quantitative Methods in Economic Research]; SGGW Press: Warsaw, Poland, 2012; pp. 5–16. [Google Scholar]
- Kukuła, K. Zero unitarisation metod as a tool in ranking research. In Economic Science for Rural Development; Latvia University of Agriculture: Jelgava, Latvia, 2014; pp. 95–100. [Google Scholar]
- Kukuła, K.; Luty, L. Jeszcze o procedurze wyboru metody porządkowania liniowego [Once More about the Selection Procedure for the Linear Ordering Method]. Stat. Rev. 2017, 64, 163–176. [Google Scholar]
- Manly, B.F.J.; Navarro Alberto, J.A. Multivariate Statistical Methods; CRC Press Taylor & Francis Group: Boca Raton, FL, USA, 2017. [Google Scholar]
- Świąder, M.; Szewrański, S.; Kazak, J. The local development index as a tool for the evaluation of socio-spatial inequities. In Hradec Economic Days 2016; University of Hradec Kralove: Hradec Kralove, Czech Republic, 2016. [Google Scholar]
- Kachniarz, M. Prymusi i Maruderzy—Aktywność Inwestycyjna Gmin Dolnośląskich [Overachievers and Stragglers—Investment Activity of Lower Silesian Municipalities]; Research Papers of Wrocław University of Economics No. 367; University of Business in Wrocław Press: Wrocław, Poland, 2014; pp. 112–118. [Google Scholar]
- Kowalczyk, A. Geografia Turyzmu [Geography of Tourism]; PWN: Warsaw, Poland, 2002. [Google Scholar]
- Lijewski, T.; Mikułowski, B.; Wyrzykowski, J. Geografia Turystyki Polski [The Geography of Tourism of Poland]; PWE: Warsaw, Poland, 2008. [Google Scholar]
- Merski, J.; Kościelnik, J. Turystyka biznesowa w rejonie Warszawy—Możliwości i oczekiwania [Business tourism in Warsaw area—Possibilities and expectations]. In Turystyka Biznesowa [Business Tourism]; Academy of Tourism and Hotel Management in Gdańsk Press: Gdańsk, Poland, 2007. [Google Scholar]
- David, Q.; Peeters, D.; Van Hamme, G.; Vandermotten, C. Is bigger better? Economic performances of European cities, 1960–2009. Cities 2013, 35, 237–254. [Google Scholar] [CrossRef]
- Central Statistical Office, Macroeconomic Data Bank. Available online: http://bdm.stat.gov.pl/ (accessed on 12 March 2018).
- Dziewoński, K.; Iwanicka-Lyrowa, E. Rozmieszczenie i Migracje Ludności a System Osadniczy Polski Ludowej [Distribution and Migration of Population vs. Settlement System of People’s Republic of Poland]. In Prace Geograficzne [Studies in Geography]; IG PAN: Warsaw, Poland, 1997. [Google Scholar]
- Hall, P. Seven types of capital city. In Planning Twentieth Century Capital Cities; Gordon, D.L.A., Ed.; Routledge: New York, NY, USA, 2006. [Google Scholar]
- Mayer, H.; Sager, F.; Kaufmann, D.; Warland, M. Capital city dynamics: Linking regional innovation systems, locational policies and policy regimes. Cities 2016, 51, 11–12. [Google Scholar] [CrossRef]
- Kazak, J.; Szewrański, S. Indicator-based environmental assessment of spatial planning with the use of communityviz. In Geoinformatics for City Transformation; Technical University of Ostrava: Ostrava, Czech Republic, 2013. [Google Scholar]
- Kazak, J.; Van Hoof, J.; Szewranski, S. Challenges in the wind turbines location process in Central Europe—The use of spatial decision support systems. Renew. Sustain. Energy Rev. 2017, 76, 425–433. [Google Scholar] [CrossRef]
- Januszewska, M. Rola samorządu terytorialnego w kształtowaniu atrakcyjności inwestycyjnej gminy turystycznej [The role of local government in developing investment attractiveness of a tourist municipality]. In Rola Turystyki w Gospodarce Region [The Role of Tourism in Regional Economy]; Wyrzykowski, J., Ed.; University of Business in Wrocław Press: Wrocław, Poland, 2007; pp. 89–97. [Google Scholar]
- Demarco, D. Sustainable urban development perspectives in the era of tourism experience. Procedia Soc. Behav. Sci. 2016, 223, 335–341. [Google Scholar] [CrossRef]
- Banasik, W.; Fiszer, D. Gry miejskie i questing produktem turystycznym na przykładzie Warszawy [City games and questing as a tourist product based on the case of Warsaw]. In Dynamika Przemian Rynku Turystycznego [The Dynamics of Tourist Market Transformations]; Kruczek, Z., Banasik, W., Eds.; The Higher School of Tourism and Foreign Languages in Warsaw Press: Warsaw, Poland, 2014; pp. 139–150. [Google Scholar]
Figure 1.
Increase/decrease of hi measure value. Source: author’s compilation.


Table 1.
Population number in Polish voivodeship capital cities.
| City | Population Number in 2015 |
|---|---|
| Opole | 118,931 |
| Gorzów Wielkopolski | 123,762 |
| Zielona Góra | 138,711 |
| Olsztyn | 173,444 |
| Rzeszów | 185,896 |
| Kielce | 198,046 |
| Toruń | 202,689 |
| Białystok | 295,981 |
| Katowice | 299,910 |
| Lublin | 340,727 |
| Bydgoszcz | 355,645 |
| Szczecin | 405,657 |
| Gdańsk | 462,249 |
| Poznań | 542,348 |
| Wrocław | 635,759 |
| Łódź | 700,982 |
| Kraków | 761,069 |
| Warszawa | 1,744,351 |
Source: data provided by the Central Statistical Office (CSO).
Table 2.
The employed in Polish voivodeship capital cities and in Poland in 2005 and 2015 (according to the Polish Statistical Classification of Economic Activities (NACE) 2007). As at 31 December.
Table 2.
The employed in Polish voivodeship capital cities and in Poland in 2005 and 2015 (according to the Polish Statistical Classification of Economic Activities (NACE) 2007). As at 31 December.
| Specification | Year | Total | Sections | ||||||
|---|---|---|---|---|---|---|---|---|---|
| A 1 | B-F 2 | G-J 3 | Including I 4 | K-L 5 | M-U 6 | Including R 7 | |||
| Białystok | 2005 | 74,655 | 396 | 18,589 | 20,031 | 1321 | 3926 | 31,713 | 955 |
| 2015 | 82,591 | 133 | 17,459 | 22,955 | 1643 | 4051 | 37,993 | 1125 | |
| Bydgoszcz | 2005 | 107,970 | 263 | 37,305 | 26,949 | 1292 | 5853 | 37,600 | 1398 |
| 2015 | 120,166 | 171 | 37,535 | 29,236 | 1957 | 8101 | 45,123 | 1250 | |
| Gdańsk | 2005 | 131,132 | 342 | 35,122 | 34,625 | 2467 | 9778 | 51,265 | 2108 |
| 2015 | 156,336 | 103 | 33,677 | 45,765 | 3195 | 12,622 | 64,169 | 2435 | |
| Gorzów Wielkopolski | 2005 | 33,723 | 307 | 11,465 | 7413 | 440 | 1624 | 12,914 | 528 |
| 2015 | 40,062 | 96 | 14,842 | 8154 | 559 | 1838 | 15,132 | 546 | |
| Katowice | 2005 | 143,520 | 349 | 41,137 | 40,399 | 1830 | 9560 | 52,075 | 2188 |
| 2015 | 161,510 | 89 | 34,752 | 42,534 | 2033 | 15,207 | 68,928 | 3767 | |
| Kielce | 2005 | 67,511 | 208 | 20,770 | 16,800 | 695 | 3237 | 26,496 | 1015 |
| 2015 | 72,865 | 44 | 20,108 | 18,462 | 1289 | 2805 | 31,446 | 1409 | |
| Kraków | 2005 | 249,059 | 746 | 64,824 | 66,387 | 7055 | 13,425 | 103,677 | 5492 |
| 2015 | 312,109 | 369 | 63,170 | 92,463 | 9250 | 20,521 | 135,586 | 5301 | |
| Lublin | 2005 | 102,864 | 408 | 21,941 | 26,587 | 1539 | 6882 | 47,046 | 1530 |
| 2015 | 117,822 | 144 | 22,277 | 31,144 | 1762 | 8926 | 55,331 | 2001 | |
| Łódź | 2005 | 197,577 | 553 | 59,757 | 46,362 | 2396 | 12,043 | 78,862 | 3608 |
| 2015 | 229,964 | 101 | 58,661 | 57,592 | 3288 | 15,643 | 97,967 | 3353 | |
| Olsztyn | 2005 | 58,874 | 263 | 15,496 | 16,660 | 936 | 3756 | 22,699 | 889 |
| 2015 | 63,341 | 178 | 13,974 | 16,947 | 1110 | 3609 | 28,633 | 1045 | |
| Opole | 2005 | 47,186 | 194 | 12,431 | 12,705 | 818 | 2373 | 19,483 | 978 |
| 2015 | 51,655 | 64 | 12,475 | 13,381 | 817 | 2204 | 23,531 | 1045 | |
| Poznań | 2005 | 222,248 | 932 | 61,045 | 64,896 | 5046 | 12,937 | 82,438 | 3360 |
| 2015 | 234,666 | 511 | 49,401 | 66,471 | 4214 | 15,048 | 103,235 | 3262 | |
| Rzeszów | 2005 | 69,136 | 59 | 21,600 | 17,421 | 598 | 3932 | 26,124 | 771 |
| 2015 | 82,415 | 58 | 21,268 | 21,653 | 1370 | 3817 | 35,619 | 927 | |
| Szczecin | 2005 | 107,684 | 494 | 28,076 | 30,944 | 2090 | 6714 | 41,456 | 1872 |
| 2015 | 108,918 | 301 | 22,166 | 33,262 | 2196 | 6172 | 47,017 | 1725 | |
| Toruń | 2005 | 63,062 | 167 | 23,559 | 15,019 | 767 | 3226 | 21,091 | 1001 |
| 2015 | 62,986 | 94 | 17,489 | 17,570 | 1249 | 3786 | 24,047 | 1079 | |
| Warszawa | 2005 | 746,068 | 1420 | 127,231 | 249,087 | 18,803 | 84,920 | 283,410 | 15,822 |
| 2015 | 848,321 | 1178 | 107,001 | 267,297 | 18,688 | 116,797 | 356,048 | 14,892 | |
| Wrocław | 2005 | 189,689 | 511 | 48,192 | 50,703 | 4092 | 13,658 | 76,625 | 2985 |
| 2015 | 259,083 | 253 | 49,138 | 70,855 | 5257 | 21,706 | 117,131 | 3894 | |
| Zielona Góra | 2005 | 37,040 | 53 | 8689 | 10,423 | 510 | 2593 | 15,282 | 594 |
| 2015 | 42,567 | 531 | 9870 | 11,903 | 504 | 2324 | 17,939 | 807 | |
| Polska | 2005 | 7,835,758 | 115,329 | 2,907,305 | 1,689,882 | 109,742 | 386,037 | 2,737,205 | 111,716 |
| 2015 | 8,935,102 | 107,165 | 3,039,364 | 2,148,434 | 138,776 | 430,018 | 3,210,121 | 125,105 | |
Source: CSO data. Z-06 report on employment, remuneration, and working time. 1–agriculture, forestry, hunting, and fishing; 2–industry and construction; 3–trade, repair of motor vehicles, transport and storage, accommodation and catering, information and communication; 4–activities related to accommodation and catering services; 5–financial and insurance activities, real estate services; 6–other services: e.g., education, health care, and social welfare, public administration, and national defence, compulsory social security; 7–activities related to culture, entertainment, and recreation.
Table 3.
Index of surplus workers (ISW) value for the group of analysed cities.
| Specification | Year | Sections | Exogenous Group Size | ||||||
|---|---|---|---|---|---|---|---|---|---|
| A | B-F | G-J | Including I | K-L | M-U | Including R | |||
| Białystok | 2005 | −702.8 | −9110.3 | 3930.7 | 275.4 | 248.0 | 5634.3 | −109.4 | 9813 |
| 2015 | −857.6 | −10,635.2 | 3096.1 | 360.2 | 76.2 | 8320.5 | −31.4 | 11,493 | |
| Bydgoszcz | 2005 | −1326.1 | −2755.2 | 3663.9 | −220.2 | 533.7 | −116.3 | −141.4 | 4198 |
| 2015 | −1270.2 | −3340.7 | 342.2 | 90.6 | 2317.8 | 1950.9 | −432.5 | 4611 | |
| Gdańsk | 2005 | −1588.0 | −13,532.0 | 6344.7 | 630.5 | 3317.6 | 5457.7 | 238.4 | 15,120 |
| 2015 | −1772.0 | −19,502.2 | 8174.2 | 766.9 | 5098.0 | 8002.0 | 246.1 | 21,274 | |
| Gorzów Wielkopolski | 2005 | −189.3 | −1047.3 | 140.2 | −32.3 | −37.4 | 1133.8 | 47.2 | 1274 |
| 2015 | −384.5 | 1214.5 | −1478.9 | −63.2 | −90.1 | 738.9 | −14.9 | 1953 | |
| Katowice | 2005 | −1763.4 | −12,113.3 | 9447.1 | −180.0 | 2489.3 | 1940.3 | 141.8 | 13,877 |
| 2015 | −1848.1 | −20,187.2 | 3699.1 | −475.5 | 7434.0 | 10,902.2 | 1505.6 | 22,035 | |
| Kielce | 2005 | −785.6 | −4278.6 | 2240.4 | −250.5 | −89.0 | 2912.9 | 52.5 | 5153 |
| 2015 | −829.9 | −4677.8 | 941.7 | 157.3 | −701.8 | 5267.7 | 388.8 | 6209 | |
| Kraków | 2005 | −2919.7 | −27,584.5 | 12,674.2 | 3566.9 | 1154.8 | 16,675.1 | 1941.1 | 30,504 |
| 2015 | −3374.3 | −42,997.0 | 17,416.8 | 4402.5 | 5500.2 | 23,454.4 | 931.0 | 46,371 | |
| Lublin | 2005 | −1106.0 | −16,224.7 | 4403.1 | 98.4 | 1814.3 | 11,113.3 | 63.4 | 17,331 |
| 2015 | −1269.1 | −17,801.3 | 2813.8 | −68.0 | 3255.6 | 13,001.0 | 351.3 | 19,070 | |
| Łódź | 2005 | −2355.0 | −13,550.1 | 3752.0 | −371.1 | 2309.2 | 9843.9 | 791.1 | 15,905 |
| 2015 | −2657.1 | −19,563.5 | 2297.4 | −283.7 | 4575.6 | 15,347.7 | 133.2 | 22,221 | |
| Olsztyn | 2005 | −603.5 | −6348.0 | 3963.1 | 111.5 | 855.5 | 2133.0 | 49.6 | 6952 |
| 2015 | −581.7 | −7572.1 | 1716.7 | 126.2 | 560.6 | 5876.4 | 158.1 | 8154 | |
| Opole | 2005 | −500.5 | −5076.4 | 2528.7 | 157.1 | 48.3 | 2999.9 | 305.3 | 5577 |
| 2015 | −555.5 | −5096.0 | 960.6 | 14.7 | −282.0 | 4972.9 | 321.8 | 5933 | |
| Poznań | 2005 | −2339.1 | −21,415.8 | 16,965.4 | 1933.4 | 1987.7 | 4801.8 | 191.4 | 23,755 |
| 2015 | −2303.5 | −30,423.0 | 10,045.9 | 569.3 | 3754.3 | 18,926.4 | −23.7 | 32,726 | |
| Rzeszów | 2005 | −958.6 | −4051.6 | 2510.9 | −370.3 | 525.9 | 1973.3 | −214.7 | 5010 |
| 2015 | −930.5 | −6766.3 | 1836.4 | 90.0 | −149.4 | 6009.7 | −226.9 | 7846 | |
| Szczecin | 2005 | −1090.9 | −11,878.0 | 7720.6 | 581.9 | 1408.8 | 3839.6 | 336.7 | 12,969 |
| 2015 | −1005.3 | −14,883.5 | 7072.8 | 504.3 | 930.1 | 7885.9 | 200.0 | 15,889 | |
| Toruń | 2005 | −761.2 | 161.1 | 1418.9 | −116.2 | 119.2 | −938.0 | 101.9 | 1699 |
| 2015 | −661.4 | −3936.3 | 2425.1 | 270.7 | 754.7 | 1418.0 | 197.1 | 4598 | |
| Warszawa | 2005 | −9560.8 | −149,583 | 88,187.8 | 8354.1 | 48,164.2 | 22,791.8 | 5185.2 | 159,144 |
| 2015 | −8996.5 | −181,564 | 63,319.3 | 5512.3 | 75,970.0 | 51,271.1 | 3014.2 | 190,560 | |
| Wrocław | 2005 | −2280.9 | −22,188.4 | 9794.1 | 1435.4 | 4312.8 | 10,362.4 | 280.6 | 24,469 |
| 2015 | −2854.4 | −38,991.7 | 8558.8 | 1233.0 | 9237.2 | 24,050.1 | 266.4 | 41,846 | |
| Zielona Góra | 2005 | −492.2 | −5054.0 | 2434.8 | −8.8 | 768.2 | 2343.1 | 65.9 | 5546 |
| 2015 | 20.5 | −4609.6 | 1667.8 | −157.1 | 275.4 | 2645.9 | 211.0 | 4610 | |
Source: author’s compilation.
Table 4.
Employment structure indicators in the exogenous group of the analysed cities (%).
| Specification | Year | Sections | Of Which | |||||
|---|---|---|---|---|---|---|---|---|
| A | B-F | G-J | K-L | M-U | I | R | ||
| Białystok | 2005 | / | / | 40.1 | 2.5 | 57.4 | 2.8 | / |
| 2015 | / | / | 26.9 | 0.7 | 72.4 | 3.1 | / | |
| Bydgoszcz | 2005 | / | / | 87.3 | 12.7 | / | / | / |
| 2015 | / | / | 7.4 | 50.3 | 42.3 | 2.0 | / | |
| Gdańsk | 2005 | / | / | 42.0 | 21.9 | 36.1 | 4.2 | 1.6 |
| 2015 | / | / | 38.4 | 24.0 | 37.6 | 3.6 | 1.2 | |
| Gorzów Wielkopolski | 2005 | / | / | 11.0 | / | 89.0 | / | 3.7 |
| 2015 | / | 62.2 | / | / | 37.8 | / | / | |
| Katowice | 2005 | / | / | 68.1 | 17.9 | 14.0 | / | 1.0 |
| 2015 | / | / | 16.8 | 33.7 | 49.5 | / | 6.8 | |
| Kielce | 2005 | / | / | 43.5 | / | 56.5 | / | 1.0 |
| 2015 | / | / | 15.2 | / | 84.8 | 2.5 | 6.3 | |
| Kraków | 2005 | / | / | 41.5 | 3.8 | 54.7 | 11.7 | 6.4 |
| 2015 | / | / | 37.6 | 11.9 | 50.6 | 9.5 | 2.0 | |
| Lublin | 2005 | / | / | 25.4 | 10.5 | 64.1 | 0.6 | 0.4 |
| 2015 | / | / | 14.8 | 17.1 | 68.2 | / | 1.8 | |
| Łódź | 2005 | / | / | 23.6 | 14.5 | 61.9 | / | 5.0 |
| 2015 | / | / | 10.3 | 20.6 | 69.1 | / | 0.6 | |
| Olsztyn | 2005 | / | / | 57.0 | 12.3 | 30.7 | 1.6 | 0.7 |
| 2015 | / | / | 21.1 | 6.9 | 72.1 | 1.5 | 1.9 | |
| Opole | 2005 | / | / | 45.3 | 0.9 | 53.8 | 2.8 | 5.5 |
| 2015 | / | / | 16.2 | / | 83.8 | 0.2 | 5.4 | |
| Poznań | 2005 | / | / | 71.4 | 8.4 | 20.2 | 8.1 | 0.8 |
| 2015 | / | / | 30.7 | 11.5 | 57.8 | 1.7 | / | |
| Rzeszów | 2005 | / | / | 50.1 | 10.5 | 39.4 | / | / |
| 2015 | / | / | 23.4 | / | 76.6 | 1.1 | / | |
| Szczecin | 2005 | / | / | 59.5 | 10.9 | 29.6 | 4.5 | 2.6 |
| 2015 | / | / | 44.5 | 5.9 | 49.6 | 3.2 | 1.3 | |
| Toruń | 2005 | / | 9.5 | 83.5 | 7.0 | / | / | 6.0 |
| 2015 | / | / | 52.7 | 16.4 | 30.8 | 5.9 | 4.3 | |
| Warszawa | 2005 | / | / | 55.4 | 30.3 | 14.3 | 5.2 | 3.3 |
| 2015 | / | / | 33.2 | 39.9 | 26.9 | 2.9 | 1.6 | |
| Wrocław | 2005 | / | / | 40.0 | 17.6 | 42.3 | 5.9 | 1.1 |
| 2015 | / | / | 20.5 | 22.1 | 57.5 | 2.9 | 0.6 | |
| Zielona Góra | 2005 | / | / | 43.9 | 13.9 | 42.2 | / | 1.2 |
| 2015 | 0.4 | / | 36.2 | 6.0 | 57.4 | / | 4.6 | |
Source: author’s compilation.
Table 5.
Florence specialisation coefficient (FSC) value for the group of analysed cities.
| Specification | Year | Sections | |||||||
|---|---|---|---|---|---|---|---|---|---|
| A | B-F | G-J | Including I | K-L | M-U | Including R | I+R | ||
| Białystok | 2005 | 0.36 | 0.67 | 1.24 | 1.26 | 1.07 | 1.22 | 0.9 | 1.08 |
| 2015 | 0.13 | 0.62 | 1.16 | 1.28 | 1.02 | 1.28 | 0.97 | 1.13 | |
| Bydgoszcz | 2005 | 0.17 | 0.93 | 1.16 | 0.85 | 1.1 | 0.99 | 0.91 | 0.88 |
| 2015 | 0.12 | 0.92 | 1.01 | 1.05 | 1.4 | 1.05 | 0.74 | 0.90 | |
| Gdańsk | 2005 | 0.18 | 0.72 | 1.22 | 1.34 | 1.51 | 1.12 | 1.13 | 1.23 |
| 2015 | 0.05 | 0.63 | 1.22 | 1.32 | 1.68 | 1.14 | 1.11 | 1.22 | |
| Gorzów Wielkopolski | 2005 | 0.62 | 0.92 | 1.02 | 0.93 | 0.98 | 1.1 | 1.1 | 1.02 |
| 2015 | 0.2 | 1.09 | 0.85 | 0.9 | 0.95 | 1.05 | 0.97 | 0.93 | |
| Katowice | 2005 | 0.17 | 0.77 | 1.31 | 0.91 | 1.35 | 1.04 | 1.07 | 0.99 |
| 2015 | 0.05 | 0.63 | 1.1 | 0.81 | 1.96 | 1.19 | 1.67 | 1.22 | |
| Kielce | 2005 | 0.21 | 0.83 | 1.15 | 0.74 | 0.97 | 1.12 | 1.05 | 0.90 |
| 2015 | 0.05 | 0.81 | 1.05 | 1.14 | 0.8 | 1.2 | 1.38 | 1.25 | |
| Kraków | 2005 | 0.2 | 0.7 | 1.24 | 2.02 | 1.09 | 1.19 | 1.55 | 1.78 |
| 2015 | 0.1 | 0.6 | 1.23 | 1.91 | 1.37 | 1.21 | 1.21 | 1.58 | |
| Lublin | 2005 | 0.27 | 0.57 | 1.2 | 1.07 | 1.36 | 1.31 | 1.04 | 1.06 |
| 2015 | 0.1 | 0.56 | 1.1 | 0.96 | 1.57 | 1.31 | 1.21 | 1.08 | |
| Łódź | 2005 | 0.19 | 0.82 | 1.09 | 0.87 | 1.24 | 1.14 | 1.28 | 1.08 |
| 2015 | 0.04 | 0.75 | 1.04 | 0.92 | 1.41 | 1.19 | 1.04 | 0.98 | |
| Olsztyn | 2005 | 0.3 | 0.71 | 1.31 | 1.14 | 1.29 | 1.1 | 1.06 | 1.10 |
| 2015 | 0.23 | 0.65 | 1.11 | 1.13 | 1.18 | 1.26 | 1.18 | 1.15 | |
| Opole | 2005 | 0.28 | 0.71 | 1.25 | 1.24 | 1.02 | 1.18 | 1.45 | 1.35 |
| 2015 | 0.1 | 0.71 | 1.08 | 1.02 | 0.89 | 1.27 | 1.44 | 1.22 | |
| Poznań | 2005 | 0.28 | 0.74 | 1.35 | 1.62 | 1.18 | 1.06 | 1.06 | 1.34 |
| 2015 | 0.18 | 0.62 | 1.18 | 1.16 | 1.33 | 1.22 | 0.99 | 1.08 | |
| Rzeszów | 2005 | 0.06 | 0.84 | 1.17 | 0.62 | 1.15 | 1.08 | 0.78 | 0.70 |
| 2015 | 0.06 | 0.76 | 1.09 | 1.07 | 0.96 | 1.2 | 0.8 | 0.94 | |
| Szczecin | 2005 | 0.31 | 0.7 | 1.33 | 1.39 | 1.27 | 1.1 | 1.22 | 1.30 |
| 2015 | 0.23 | 0.6 | 1.27 | 1.3 | 1.18 | 1.2 | 1.13 | 1.22 | |
| Toruń | 2005 | 0.18 | 1.01 | 1.1 | 0.87 | 1.04 | 0.96 | 1.11 | 0.99 |
| 2015 | 0.12 | 0.82 | 1.16 | 1.28 | 1.25 | 1.06 | 1.22 | 1.25 | |
| Warszawa | 2005 | 0.13 | 0.46 | 1.55 | 1.8 | 2.31 | 1.09 | 1.49 | 1.64 |
| 2015 | 0.12 | 0.37 | 1.31 | 1.42 | 2.86 | 1.17 | 1.25 | 1.34 | |
| Wrocław | 2005 | 0.18 | 0.68 | 1.24 | 1.54 | 1.46 | 1.16 | 1.1 | 1.32 |
| 2015 | 0.08 | 0.56 | 1.14 | 1.31 | 1.74 | 1.26 | 1.07 | 1.20 | |
| Zielona Góra | 2005 | 0.1 | 0.63 | 1.3 | 0.98 | 1.42 | 1.18 | 1.12 | 1.05 |
| 2015 | 1.04 | 0.68 | 1.16 | 0.76 | 1.13 | 1.17 | 1.35 | 1.04 | |
Source: author’s compilation.
Table 6.
Baretje–Defert index, Charvat index, and accommodation density index for the group of analysed cities.
Table 6.
Baretje–Defert index, Charvat index, and accommodation density index for the group of analysed cities.
| Specification | Baretje–Defert Index | Charvat Index | Accommodation Density Index | |||
|---|---|---|---|---|---|---|
| 2005 | 2015 | 2005 | 2015 | 2005 | 2015 | |
| Białystok | 0.54 | 0.78 | 61.84 | 114.13 | 16.86 | 22.66 |
| Bydgoszcz | 0.53 | 0.84 | 45.05 | 104.38 | 11.08 | 17.07 |
| Gdańsk | 2.12 | 2.98 | 193.42 | 413.18 | 37.04 | 52.59 |
| Gorzów Wielkopolski | 0.9 | 0.64 | 98.49 | 88.62 | 13.06 | 9.14 |
| Katowice | 0.84 | 1.3 | 104.45 | 208.28 | 16.18 | 23.68 |
| Kielce | 0.74 | 1.23 | 61.7 | 110.75 | 14.17 | 22.07 |
| Kraków | 2.03 | 3.62 | 331.25 | 600.98 | 46.92 | 84.35 |
| Lublin | 0.68 | 0.84 | 77.19 | 102.02 | 16.22 | 19.55 |
| Łódź | 0.46 | 0.99 | 65.24 | 129.07 | 11.99 | 23.8 |
| Olsztyn | 3.5 | 3.29 | 151.14 | 179.16 | 69.31 | 64.81 |
| Opole | 0.56 | 0.92 | 81.13 | 112.75 | 7.52 | 11.24 |
| Poznań | 1.38 | 1.63 | 137.15 | 239.84 | 28.83 | 33.81 |
| Rzeszów | 1.06 | 1.57 | 107.28 | 173.34 | 31.09 | 24.91 |
| Szczecin | 1.27 | 1.66 | 154.78 | 215.42 | 17.39 | 22.37 |
| Toruń | 1.01 | 1.74 | 120.97 | 233.99 | 18.05 | 30.45 |
| Warszawa | 1.26 | 1.53 | 183.00 | 295.88 | 41.27 | 51.55 |
| Wrocław | 1.14 | 1.73 | 177.06 | 274.62 | 24.65 | 37.57 |
| Zielona Góra | 0.94 | 0.8 | 86.71 | 73.49 | 19.21 | 3.99 |
Source: author’s compilation.
Table 7.
The values of non-model synthetic measure hi for the analysed cities arranged in ascending order in 2005 and in 2015.
Table 7.
The values of non-model synthetic measure hi for the analysed cities arranged in ascending order in 2005 and in 2015.
| City | 2005 | City | 2015 |
|---|---|---|---|
| Bydgoszcz | 0.21 | Gorzów Wielkopolski | 0.24 |
| Kielce | 0.24 | Zielona Góra | 0.24 |
| Łódź | 0.25 | Bydgoszcz | 0.28 |
| Białystok | 0.26 | Lublin | 0.31 |
| Lublin | 0.28 | Opole | 0.31 |
| Opole | 0.28 | Białystok | 0.33 |
| Gorzów Wielkopolski | 0.28 | Łódź | 0.33 |
| Katowice | 0.29 | Kielce | 0.37 |
| Zielona Góra | 0.31 | Rzeszów | 0.39 |
| Rzeszów | 0.31 | Katowice | 0.42 |
| Toruń | 0.31 | Szczecin | 0.44 |
| Szczecin | 0.39 | Poznań | 0.46 |
| Wrocław | 0.41 | Toruń | 0.48 |
| Poznań | 0.43 | Wrocław | 0.51 |
| Gdańsk | 0.51 | Warszawa | 0.57 |
| Warszawa | 0.52 | Olsztyn | 0.66 |
| Olsztyn | 0.66 | Gdańsk | 0.70 |
| Kraków | 0.67 | Kraków | 0.97 |
Source: author’s compilation.
© 2018 by the authors. Licensee MDPI, Basel, Switzerland. This article is an open access article distributed under the terms and conditions of the Creative Commons Attribution (CC BY) license (http://creativecommons.org/licenses/by/4.0/).
Share and Cite
MDPI and ACS Style
Przybyła, K.; Kulczyk-Dynowska, A. Transformations and the Level of Tourist Function Development in Polish Voivodeship Capital Cities. Sustainability 2018, 10, 2095. https://doi.org/10.3390/su10062095
AMA Style
Przybyła K, Kulczyk-Dynowska A. Transformations and the Level of Tourist Function Development in Polish Voivodeship Capital Cities. Sustainability. 2018; 10(6):2095. https://doi.org/10.3390/su10062095
Chicago/Turabian StylePrzybyła, Katarzyna, and Alina Kulczyk-Dynowska. 2018. "Transformations and the Level of Tourist Function Development in Polish Voivodeship Capital Cities" Sustainability 10, no. 6: 2095. https://doi.org/10.3390/su10062095
Note that from the first issue of 2016, this journal uses article numbers instead of page numbers. See further details here.