Assessment of Air Pollution from Household Solid Waste Open Burning in Thailand


1
Faculty of Public Health, Thammasat University, Pathumthani 12121, Thailand
2
Faculty of Environment and Resource Studies, Mahidol University, Phutthamonthon, Nakhon Pathom 73170, Thailand
3
The Joint Graduate School of Energy and Environment (JGSEE), King Mongkut’s University of Technology Thonburi (KMUTT), Bangkok 10140, Thailand
4
Center of Excellence on Energy Technology and Environment (CEE–PERDO), Ministry of Education, Bangkok 10140, Thailand
*
Author to whom correspondence should be addressed.
Sustainability 2018, 10(7), 2553; https://doi.org/10.3390/su10072553
Submission received: 20 June 2018
/
Revised: 12 July 2018
/
Accepted: 17 July 2018
/
Published: 20 July 2018
(This article belongs to the Collection Trends in Municipal Solid Waste Management)
Abstract
:The purpose of this study was to assess household solid waste management in areas governed by local administrative organizations (LAOs). The obtained results would be used to assess the amount of air pollution emitted from household solid waste open burning. A survey was employed, through the use of questionnaires, to collect data from a random sample of 4300 households residing in areas governed by 96 LAOs. According to the results, it was evident that a total of 26.17 Mt of solid waste were generated per year, of which 6.39 Mt/year was not collected by the LAOs and was eliminated by households. Moreover, the percentage of waste burned on or outside the households’ property was 53.7%, or an equivalent of 3.43 Mt/year of solid waste burned in open areas. In addition, it was found that 0.66 Mt/year of solid waste collected by the LAOs was burned in open areas and was not eliminated properly. Hence, the total amount of solid waste from these two sources was 4.09 Mt/year, which resulted in the emissions of carbon dioxide equivalent, carbon monoxide, sulfur dioxide, nitric oxide, and particulate matter of 1247.3 kt/year, 103.0 kt/year, 1.2 kt/year, 7.4 kt/year, and 19.6 kt/year, respectively.
1. Introduction
1.1. State of Problem
In 2012, a project called “What a Waste: A Global Review of Solid Waste Management” [1] under the patronage of the World Bank reported that every city across the globe collectively generated around 1.3 billion tons of municipal solid waste per year, which was expected to increase by 2.2 billion tons by 2025. The rate of increase of solid waste in low-income countries was anticipated to be higher than that of high-income countries. Thailand is considered a lower middle-income country and generates municipal solid waste at the average of 0.29 ton/capita/year with 68% efficiency in collecting the generated solid waste.
The 2016 Thailand State of Pollution Report, conducted by the Pollution Control Department (PCD), Ministry of Natural Resources and Environment [2], revealed the state of municipal solid waste problems in Thailand. It was reported that solid waste problems had become increasingly more severe due to an increase of solid waste, which was accounted for by the increased population growth, economic expansion, change in consumer behavior, and inadequate services for municipal waste collection and disposal. These factors subsequently cause various households to adopt their own methods of eliminating solid waste, most of which are not aligned with standard sanitary practices, such as illegal dumping of waste into abandoned ditches, incorrect burial of waste, open burning of waste on property and roadside, and open dumping of waste.
In addition, the PCD also published the 2016 Municipal Solid Waste Situation of Thailand Report [3] that surveyed the amount of solid waste generated across the country using questionnaires and interviews with household members. The study areas comprised 7782 LAOs across the country. Findings from the survey indicated that Thailand generated approximately 26.8 million tons (Mt) of municipal solid waste, or an equivalent of 73,000 tons per day, of which 4.1 Mt (15%) was generated in Bangkok (capital city of Thailand), 10.2 Mt (38%) was generated in municipalities, and 12.5 Mt (47%) was generated in subdistrict administrative organization (SAOs). With regard to solid waste management in the areas governed by SAOs, it was found that 7.4 Mt (59%) or 20,000 tons per day of solid waste generated in 4179 SAOs (54%) were collected and disposed at the waste disposal sites in accordance with the sanitary requirements.
According to the above, it can be observed that approximately 5.1 Mt/year (41%) or 19,000 tons per day of municipal solid waste are improperly collected and disposed by the LAOs, such as open burning of waste at dumping sites and open dumping in earthen ponds or abandoned ditches. This is particularly true for small-sized LAOs that are in need of budget for solid waste management. Furthermore, the 2016 Municipal Solid Waste Situation of Thailand Report [3] indicated that 46% of total waste generated in Thailand were not collected and eliminated according to the prescribed sanitary practices. Nonetheless, there is no report on the proportion of eliminating household solid waste that is not collected from LAOs [4]. Hence, this study identified the proportion of uncollected solid waste managed by households, assessed the amount of air pollution emitted from illegal open burning of solid waste, and conducted opinion surveys with officials from the LAOs to determine appropriate guidelines for future solid waste management.
1.2. The Status of Municipal Solid Waste Management in Thailand
This study was concerned with the assessment of air pollution emitted from household solid waste open burning in Thailand, which is a developing country in Southeast Asia. In 2017, the population of Thailand was estimated to be 66,188,503 persons, of which 64,627,515 were Thai nationals and 1,560,988 were non-Thai nationals [5]. Thailand has a total area of 513,120 square kilometers, which is divided into 77 provinces with Bangkok as the capital city located in the central region. Its public administration is classified into two types: (1) ordinary local administration, which governs all provinces and is subdivided into municipality, subdistrict administrative organization (SAO), and provincial administrative organization (PAO); and (2) special administration, which governs Bangkok and Pattaya. Based on the 2017 data, Thailand had a total of 7852 LAOs, divided into 76 PAOs, 2411 municipalities, 5333 SAOs, and two special local government organizations. The LAOs are considered to be closest to citizens with dependence on the government for administration. They are authorized to collect local taxes from citizens within certain areas [6].
Upon consideration of current legal provisions on the incineration of community waste, it is found that there is no legal provision that prescribes guidelines, procedures, or measures for waste disposal by incineration. Nonetheless, by virtue of the Public Health Act B.E. 2535 (1992) [7], local administrative organizations (LAOs) may promulgate local legislations to stipulate guidelines, procedures, and conditions for waste disposal by incineration that are in accordance with relevant principles to be applied in their locality. Regarding the prohibition of waste incineration, it is solely enforced by the Public Health Act B.E. 2535 [7]. Pursuant to Section 25(4) [7] thereof, any event that may cause disturbance to residents in the neighboring area or any act that causes odor, light, radiation, noise, heat, toxic matter, vibration, dust, soot, or ash to the extent that leads to impairment or danger to health shall be deemed the source of nuisance. Local officials shall have the authority to prohibit any person from causing nuisance in a public or private property, as well as to abate and remove all and any sources of nuisance. In addition, pursuant to Section 80 of the Public Health Act B.E. 2535 (1992) [7], any operator who fails to comply with the order of local officials shall be sentenced to imprisonment for a term not exceeding six months or a fine not exceeding 10,000 Baht, or both, and shall be subjected to an additional fine of 5000 Baht per day throughout the period of incompliance. Nevertheless, the general public are not aware of the provisions and regulations of the Public Health Act B.E. 2535 (1992) [7]. Consequently, citizens residing in areas outside LAOs’ waste collection services continue to practice waste incineration in their residential areas, concerning the fact that it is an easy and inexpensive method of waste disposal. Likewise, if there is no complaint filed by the neighbors, citizens can continue to incinerate their waste.
With respect to the government policy on community waste disposal by incineration, Thailand has implemented a five-year Environmental Quality Management Plan 2017–2021 [8]. The second strategy of this plan emphasizes the protection, rehabilitation, and restoration of environmental quality with the primary objectives to prevent environmental problems at source, reduce the amount of waste in every process, promote reusing activities, and establish an integrated waste management system. Regarding the target for the next five years (2021), at least 75% of community waste must be properly managed in accordance with the recommended principle and at least 30% of national waste must be recycled. The Pollution Control Department (PCD) will be responsible for implementing this environmental quality management plan in collaboration with LAOs. Presently, the Pollution Control Department has enforced the Draft Ministerial Regulation on service fees for waste management, which stipulates the rate of service fees that LAOs will collect from households. If the amount of household waste does not exceed 20 L or 4 kg per day, the service fee for collection and transportation of waste shall not exceed 65 Baht per month, and the service fee for waste disposal or treatment shall not exceed 155 Baht per month. In addition, the Pollution Control Department (PCD) is also responsible for regulating, monitoring, and promoting LAOs to proceed according to the operational plan on provincial waste management. In 2016, a total of 4422 LAOs out of 7759 LAOs issued a legal provision on garbage and waste disposal.
1.3. Composition of Municipal Solid Waste in Thailand
The composition of municipal solid waste is an important factor in the consideration of appropriate solid waste management practices. The primary components of municipal solid waste are generally food waste, followed by paper and plastic. However, the proportion of these components depends on each source of municipal solid waste. According to the World Bank [1], the average composition of municipal solid waste across the globe comprises organic waste, paper, plastic, glass, metal, and other components, at 46%, 17%, 10%, 5%, 4%, and 18%, respectively. Similarly, the World Bank reported that the average composition of municipal solid waste in Thailand consists of organic waste, paper, plastic, glass, metal, and other components, at 48%, 15%, 14%, 5%, 4%, and 14%, respectively.
Regarding the composition of solid waste in Thailand, a survey and analysis of the composition of municipal solid waste were conducted by the PCD [9] by collecting data from various agencies in the context of physical composition of solid waste at each source and elimination of solid waste at each site. The physical composition of solid waste was analyzed based on administrative areas, which were further divided into city municipalities and subdistrict municipality. According to the survey, the average composition of municipal solid waste in city municipality area comprises food waste, plastic, paper, glass, metal, cloth, wood, and other components, at 57.75%, 22.22%, 10.82%, 2.49%, 1.10%, 2.21%, 0.59%, and 2.82%, respectively. While the composition of municipal solid waste in subdistrict municipality comprises food waste, plastic, paper, glass, metal, cloth, wood, and other components, at 52.44%, 26.36%, 10.36%, 1.98%, 1.69%, 1.48%, 3.33%, and 2.36%, respectively. Concerning the comparison of municipal solid waste composition, solid waste in city municipalities consisted of food waste and paper at a greater proportion than those in subdistrict municipalities, but with a lower proportion of plastic.
2. Methodology
2.1. Data Collection
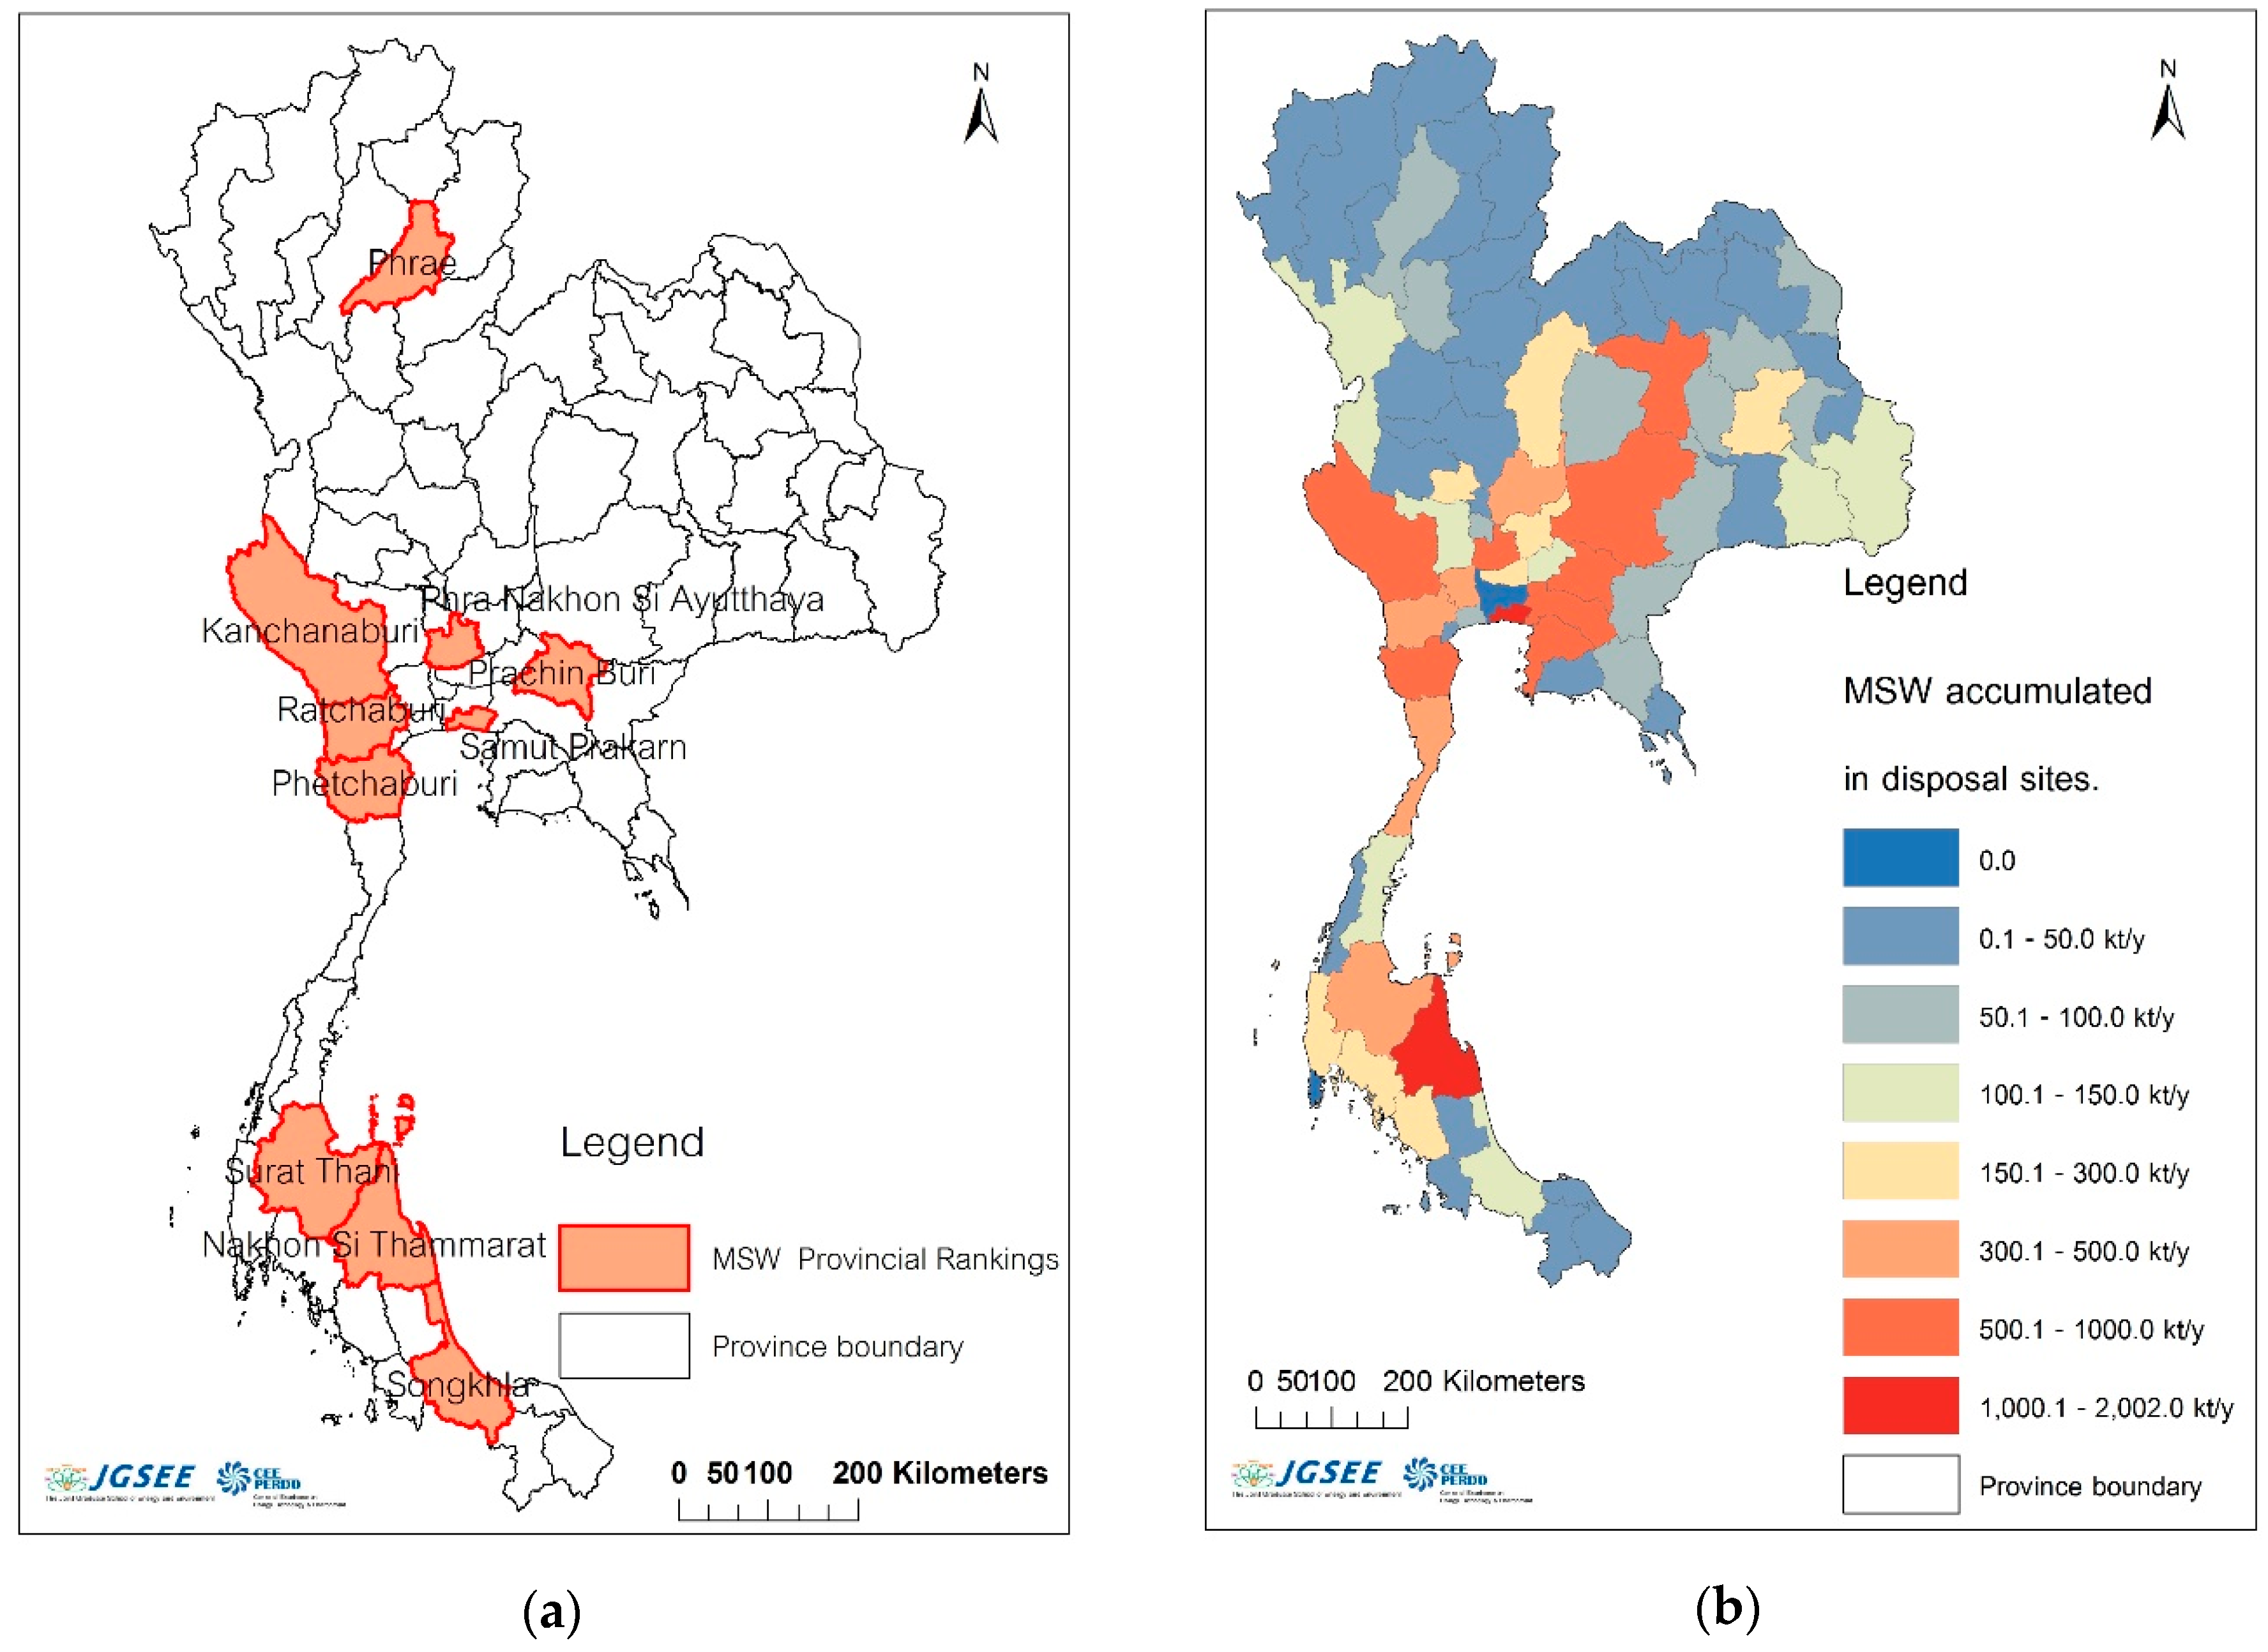
The PCD [3] ranked provinces in Thailand that encountered problems of solid waste management by considering the amount of solid waste that were not collected and disposed, the amount of solid waste that were not eliminated in accordance with the prescribed sanitary practices, and the amount of solid waste accumulated at improper disposal sites. According to the ranking, the top 10 provinces with critical problems of solid waste management were Songkhla, Samut Prakan, Kanchanaburi, Nakhon Si Thammarat, Surat Thani, Ratchaburi, Phetchaburi, Prae, Prachinburi, and Phra Nakhon Si Ayutthaya, sequentially. Hence, to obtain the maximum number of households who are faced with the problems of solid waste management, while ensuring that the sample is representative of the entire population, households in these 10 provinces were employed as a sample for data collection using questionnaires (see Figure 1a). Figure 1b demonstrates the spatial allocation of municipal solid waste that were accumulated at improper disposal sites in Thailand.
2.2. Questionnaire Design
Questionnaires were used as a research instrument to collect data from households who resided in the areas governed by LAOs. The structure of questionnaire was designed to identify the specific goals for survey, consider mode of survey administration, define the population and identify the study sample. To obtain valid and reliable answers, a pilot testing questionnaire was used with small groups (50 samples), which helped to identify problems such as issues causing low response rates, questions not being answered, and questions too difficult to answer. Cronbach’s alpha was used to analyze the reliability, or internal consistency, of a set of scale or test items. Cronbach’s alpha coefficient was computed by correlating the score for each scale item with the total score for each observation, and then comparing that to the variance for all individual item scores. The key questions are as follows:
- On average, how many kilograms of solid waste are generated by your household per day?
- What is the composition of solid waste generated by your household?
- What are the methods of solid waste management in your household and community?
- Which method do you employ to manage solid waste that cannot be collected by the LAO agencies?
- What are your suggestions for solving the problems of municipal solid waste that are not collected by the LAO agencies?
- Does your household receive information about waste, maintenance of cleanliness, and waste disposal from a local administrative organization, and to what extent?
In addition, questionnaires were designed to be used for interviewing officials of the LAOs who are responsible for collecting household solid waste. The questionnaires primarily emphasized on the state of the problems of collecting solid waste, as well as solutions to such problems.
2.3. Sampling Method
The sample employed in this study consisted of households who resided in 10 provinces in Thailand. According to the National Statistics Organization (2014) [10], there were a total of 3,119,050 households in these 10 provinces. Moreover, the Research and Development Division of System Design and Structure, Department of Local Administration [11], reported that there were a total of 1134 LAOs in these 10 provinces.
With respect to the determination of sample, the stratified random sampling method [12] was adopted to calculate the sample size. The sample was then divided amongst the 10 provinces using the proportional allocation method. In other words, provinces with higher number of households or LAOs would have a larger sample size accordingly.
Regarding the equation for the determination of sample size in the case of which the questionnaires entail a summary of result in term of proportion, the sample size (n) would have the error (e) and the confidence level of (1 − α) × 100%, which can be expressed as follows:
where P means the proportion of population units having specific characteristics; Ph means the proportion of population of h and Qh = (1 − Ph); and N means the entire population when population N is subdivided into L groups (strata), where each stratum has N1, N2, N3, …, and NL unit, respectively.
The total sample size (n) in this study was defined as: (1) the number of households interviewed; and (2) the number of LAOs in which the sample resided. For the total sample size of households, the margin of error was determined to be less than 1.0% at a confidence level of 95%. Hence, the total sample size of 4300 households would be obtained according to the equation. Alternatively, for the total sample size of LAOs, the margin of error was determined to be less than 5.0% at a confidence level of 95%, which gives the total sample size of 96 LAOs.
2.4. Parameter Estimation
The data obtained from questionnaires were analyzed using inferential statistics, which involve an estimation of parameters to examine population characteristics from the sample. Parameter estimation can be performed using mean, total, proportion, and variance, depending on the method of sampling. Since stratified random sampling was employed in this research, the estimation of parameters can be conducted using Equations in Table 1.
2.5. Assessment of the Amount of Air Pollution Emitted from Solid Waste Open Burning
Open burning or incineration of waste without air treatment system emits greenhouse gases to the atmosphere, including carbon dioxide (CO2), methane (CH4), and nitrous oxide (N2O). The method for calculating greenhouse gases are expressed in Equations (2)–(4) [13].
where ECO2 refers to the amount of CO2 emission (ton per year); MSW refers to the wet weight of municipal solid waste that were burnt in open areas or incinerators (ton per year); DM refers to the proportion of solid waste on the dry weight and wet weight basis (no unit); CF refers to the proportion of carbon to wet weight of solid waste (no unit); FCF refers to the proportion of fossil carbon to the total carbon in solid waste (no unit); OF refers to the oxidation factor (no unit); and 44/12 refers to the conversion of carbon value to carbon dioxide value.
where ECH4 refers to the amount of CH4 emission (ton per year); MSW refers to the wet weight of solid waste that were burnt in open areas or incinerators (ton per year); and EF refers to the emission coefficient of methane gas (gram per ton).
where EN2O refers to the amount of N2O emission (ton per year); MSW refers to the wet weight of municipal solid waste that were burnt in open areas or incinerators (ton per year); and EF refers to the emission coefficient of nitrous oxide gas (gram per ton).
ECO2 = MSW × DM × CF × FCF × OF × (44/12)
ECH4 = MSW × EF
EN2O = MSW × EF
In this study, the proportion of dry weight to wet weight of solid waste and the proportion of carbon to dry weight of solid waste were 0.6 and 0.46, respectively, which were obtained from the results of the Survey and Analysis of Municipal Solid Waste Component in Municipalities in Thailand conducted by the PCD [14]. In addition, the proportion of fossil carbon to the total carbon in solid waste was 0.208 and the oxidation factor was 0.58, which were retrieved from the study results of Thailand’s Second National Communication that were submitted to the UNFCCC on 23 March 2011 [15]. Meanwhile, the emission coefficients of CH4 and N2O were determined to be 6500 g per ton and 150 g per ton, respectively, which were derived from the default value stated in the revised 1996 IPCC Guidelines for National Greenhouse Gas Inventories [13].
The assessment of emission of other air pollutants, such as carbon monoxide (CO), sulfur dioxide (SO2), nitrogen oxide (NO), and particulate matter (PM), was conducted using the classical equation of Seiler and Crutzen (1980) [16], which represents the relationship between the combustion process and its emission, as follows:
where Ei is the emission of the pollutant i (g); M is the mass of municipal solid waste burned (kg dry matter); and EFi is the emission factor of the pollutant i (g/kg material burned). The emission factors in this study were derived from the US EPA reviewed by Paul M. L. et al. (2004) [17], which presented the emission factors of CO, SO2, NO, and PM to be 42.0 g/kg, 0.5 g/kg, 3.0 g/kg, and 8.0 g/kg, respectively.
Ei = M × EFi
3. Results and Discussion
3.1. Household Solid Waste Management
According to the findings from interviews with households on solid waste management, it was evident that the majority of households residing in the areas governed by the LAOs generated approximately 2 kg of solid waste per day (kg/day) or an equivalent of 41.7% (Standard error (S.E.) = 0.72%), followed by 1 kg/day or 26.2% (S.E. = 0.42) (see Figure 2). The average weight of solid waste per household was 2.5 kg/day (S.E. = 0.02 kg/day) or 0.70 kg/capita/day. Moreover, it was found that 63.2% (S.E. = 0.73%) of household solid waste was collected by the LAOs and the remaining 36.8% (S.E. = 0.73%) was not collected. The frequency of waste collection services provided by the LAOs was about two times per week.
When considering the management of solid waste based on composition, it was found that 57.2% of wet solid waste, vegetable scraps, and food waste were collected by the LAOs. Meanwhile, 62.2% of plastic bags and 63.6% of polyurethane foam waste and foam containers were collected by the LAOs. Solid waste that could be segregated and sold by the households, such as plastic bottles, aluminum cans, glass bottles, and papers, were recycled and managed by the households themselves, estimated at 67.4%, 59.0%, 63.2%, and 61.4%, respectively (see Table 2).
When considering the management of household solid waste that were not collected by the LAOs, there were a total of 15 methods employed by the households. The methods of household solid waste management were: (1) collection of solid waste in bags and dumping thereof on authorized sites (23.7%); (2) burning of solid waste on their property (34.4%); (3) burning of solid waste outside their property (19.3%); (4) dumping of solid waste on their property (1.7%); (5) dumping of solid waste on the roadside (2.2%); (6) dumping of solid waste into a trench or small canal (0.5%); (7) dumping of solid waste on abandoned lands (0.8%); (8) burial of solid waste on their property (0.8%); (9) burial of solid waste outside their property (0.3%); (10) dumping of solid waste into a river, canal, or swamp (0.5%); (11) segregation of solid waste for sale (2.1%); (12) segregation of hazardous waste to be dumped on authorized sites provided by LAOs or municipalities (0.02%); (13) composting of solid waste (0.4%); (14) segregation of food waste for animal feed (8.6%); and (15) others (4.7%).
In addition, when considering the methods of household solid waste management that were not collected by the LAOs categorized by solid waste composition, the percentage of methods adopted by the households are shown in Table 3. According to the results, recyclable solid waste consisted of plastic bottles, plastic products, papers, newspapers, paper cartons, beverage cans, metals, steels, glass debris, and glass bottles, of which 90.8%, 84.0%, 80.3%, 62.7%, and 66.2% were segregated by the households for sale, respectively. For solid waste that could not be segregated for sale, such as wet solid waste, plant scraps, vegetable scraps, food waste, plastic bags, wooden pieces, leaves, and branches, the households would employ different methods to eliminate them. Between 4.8% and 67.5% of solid waste were managed by means of putting them in plastic bags and disposing in the trash cans provided by the LAOs, such as trash cans in the community or municipality areas and trash cans in fresh markets, which depended on the types of solid waste. Furthermore, it was evident that the solid waste collected and disposed at the provided sites were those that could not be managed by the households or could not be eliminated by burning due to their concern over poisonous fumes. Examples of these types of solid waste include cloth remnants, clothes, clothing products, rubbers, polyurethane foam waste, foam containers, and large solid waste such as wood, furniture, and wooden products.
With respect to the open burning of solid waste by households, whether inside or outside their property, it was found that plastic bags, polyurethane foam waste, foam containers, wooden pieces, leaves, branches, wet solid waste, plant scraps, vegetable scraps, food waste, rubbers, and leathers were most subjected to open burning by households, estimated at 66.8%, 60.2%, 55.3%, 35.4%, and 34.9%, respectively.
3.2. Air Pollution Emitted from Open Burning of Household Solid Waste
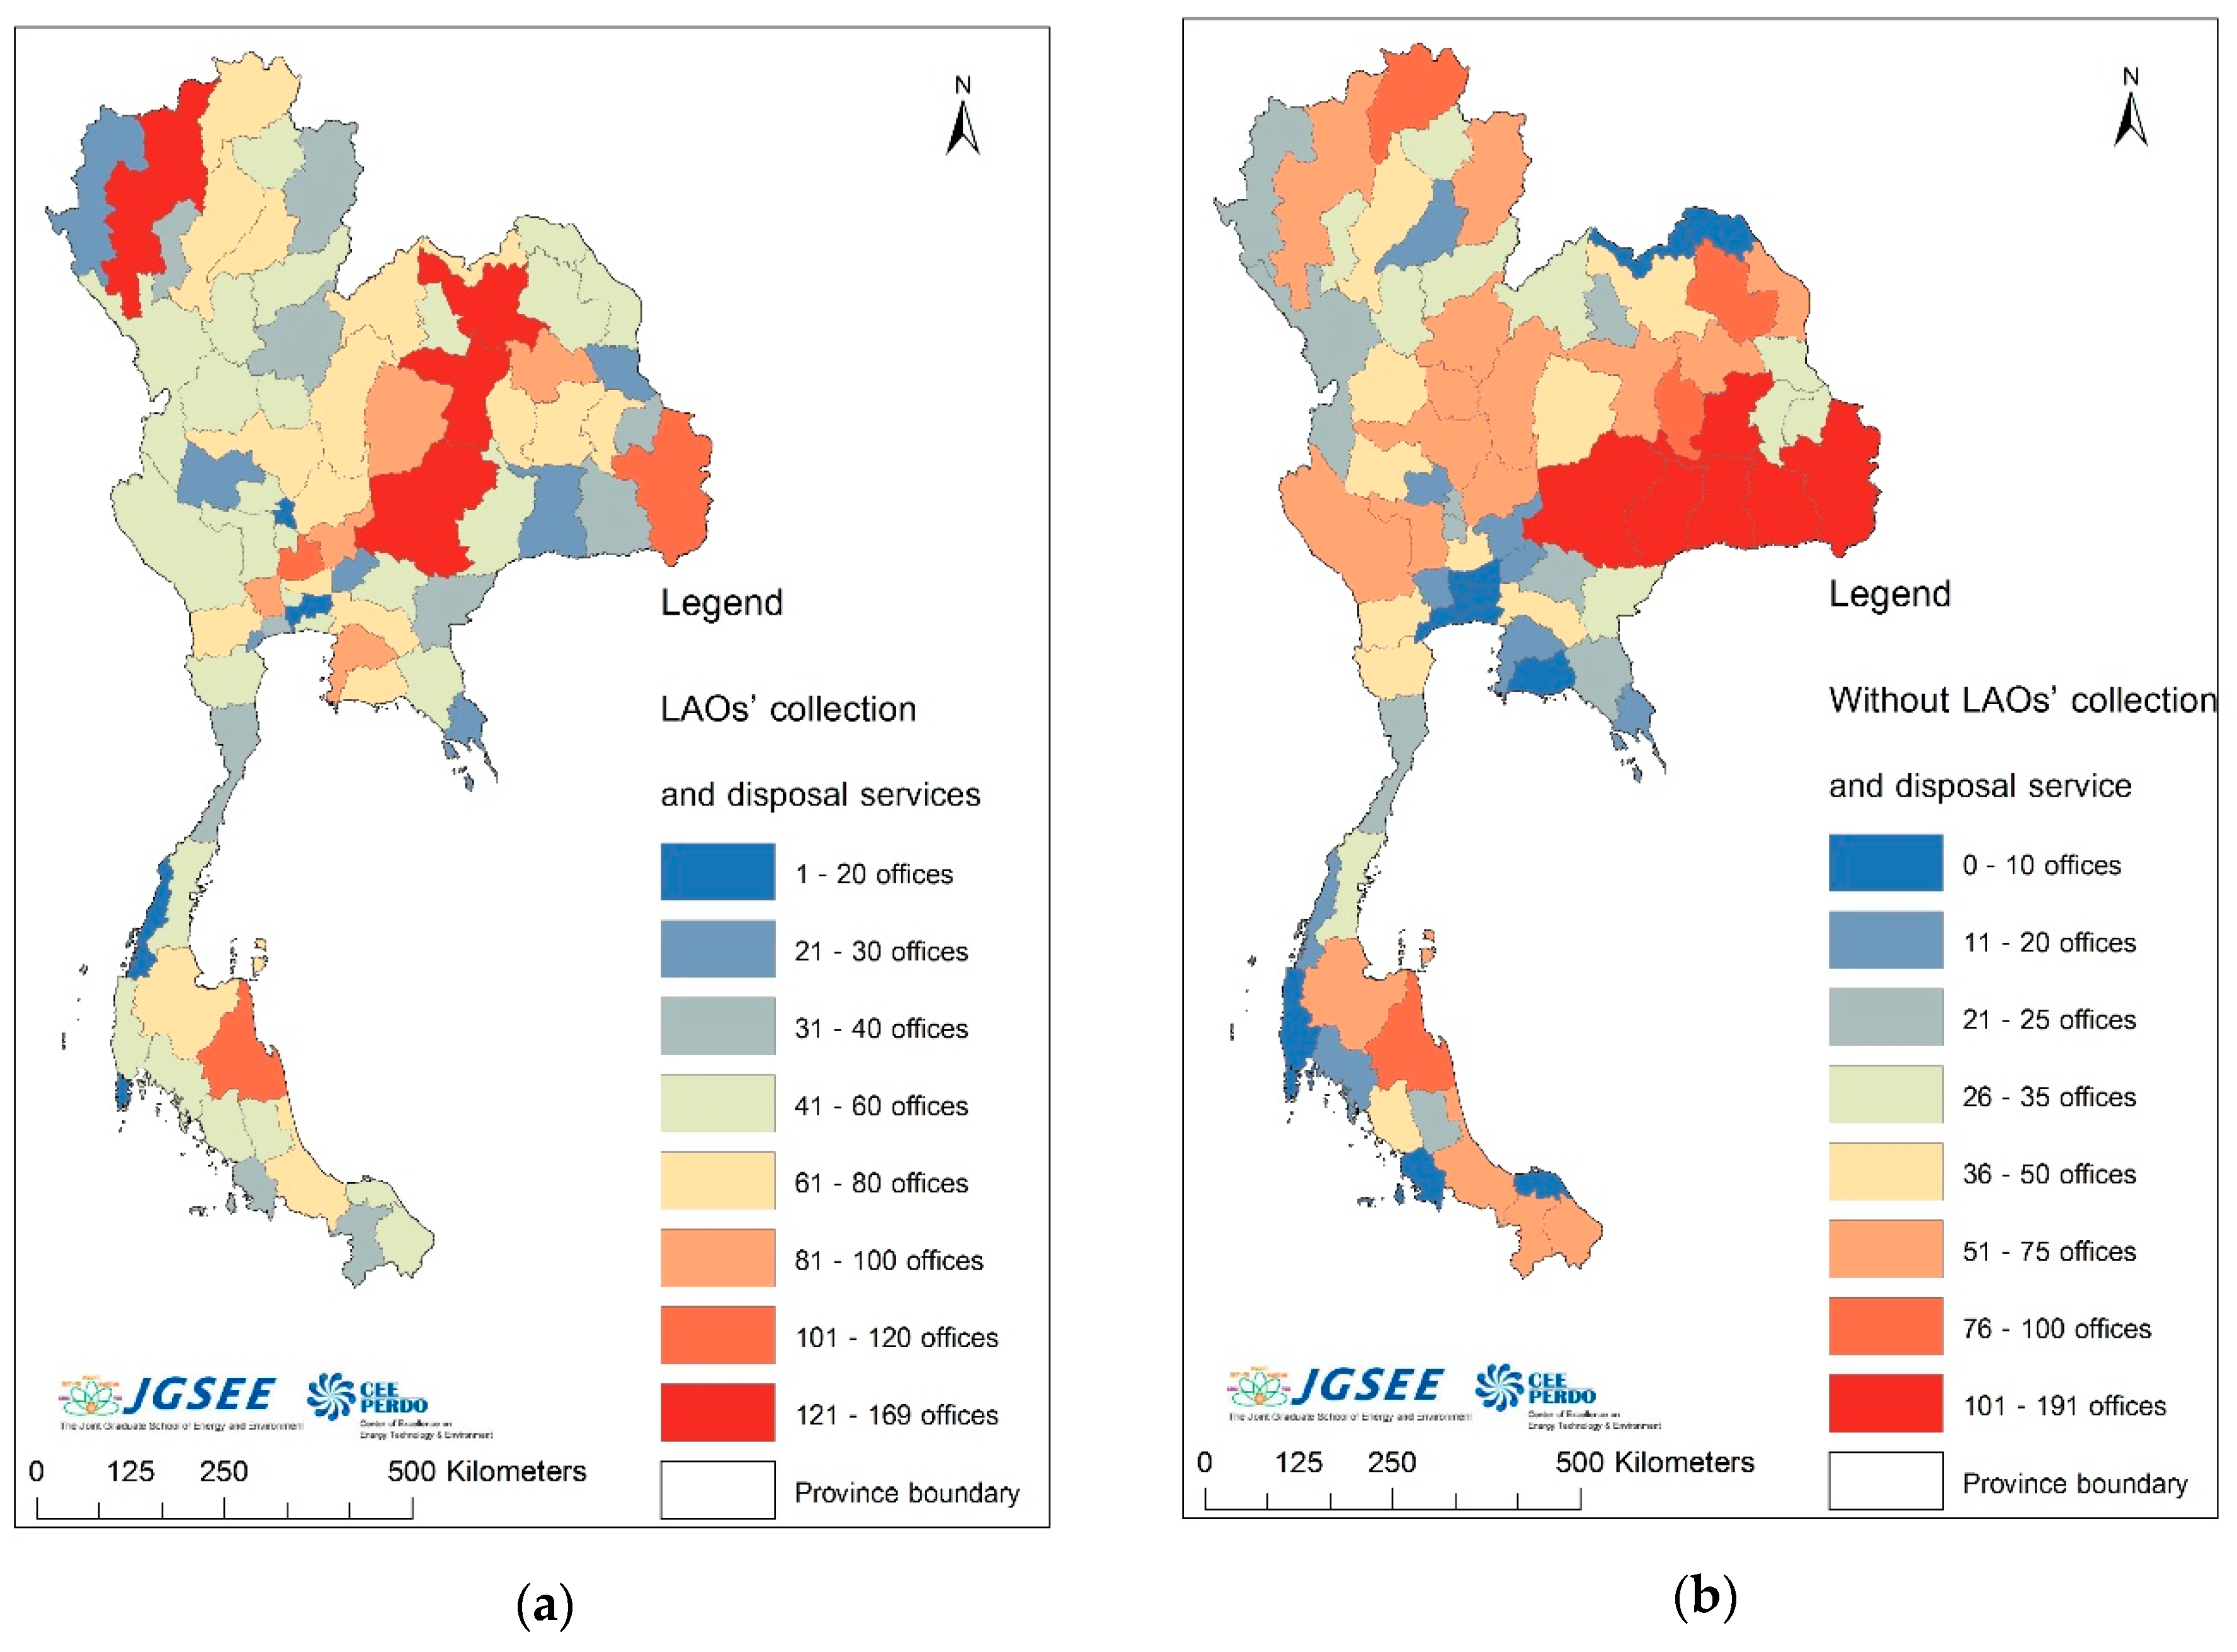
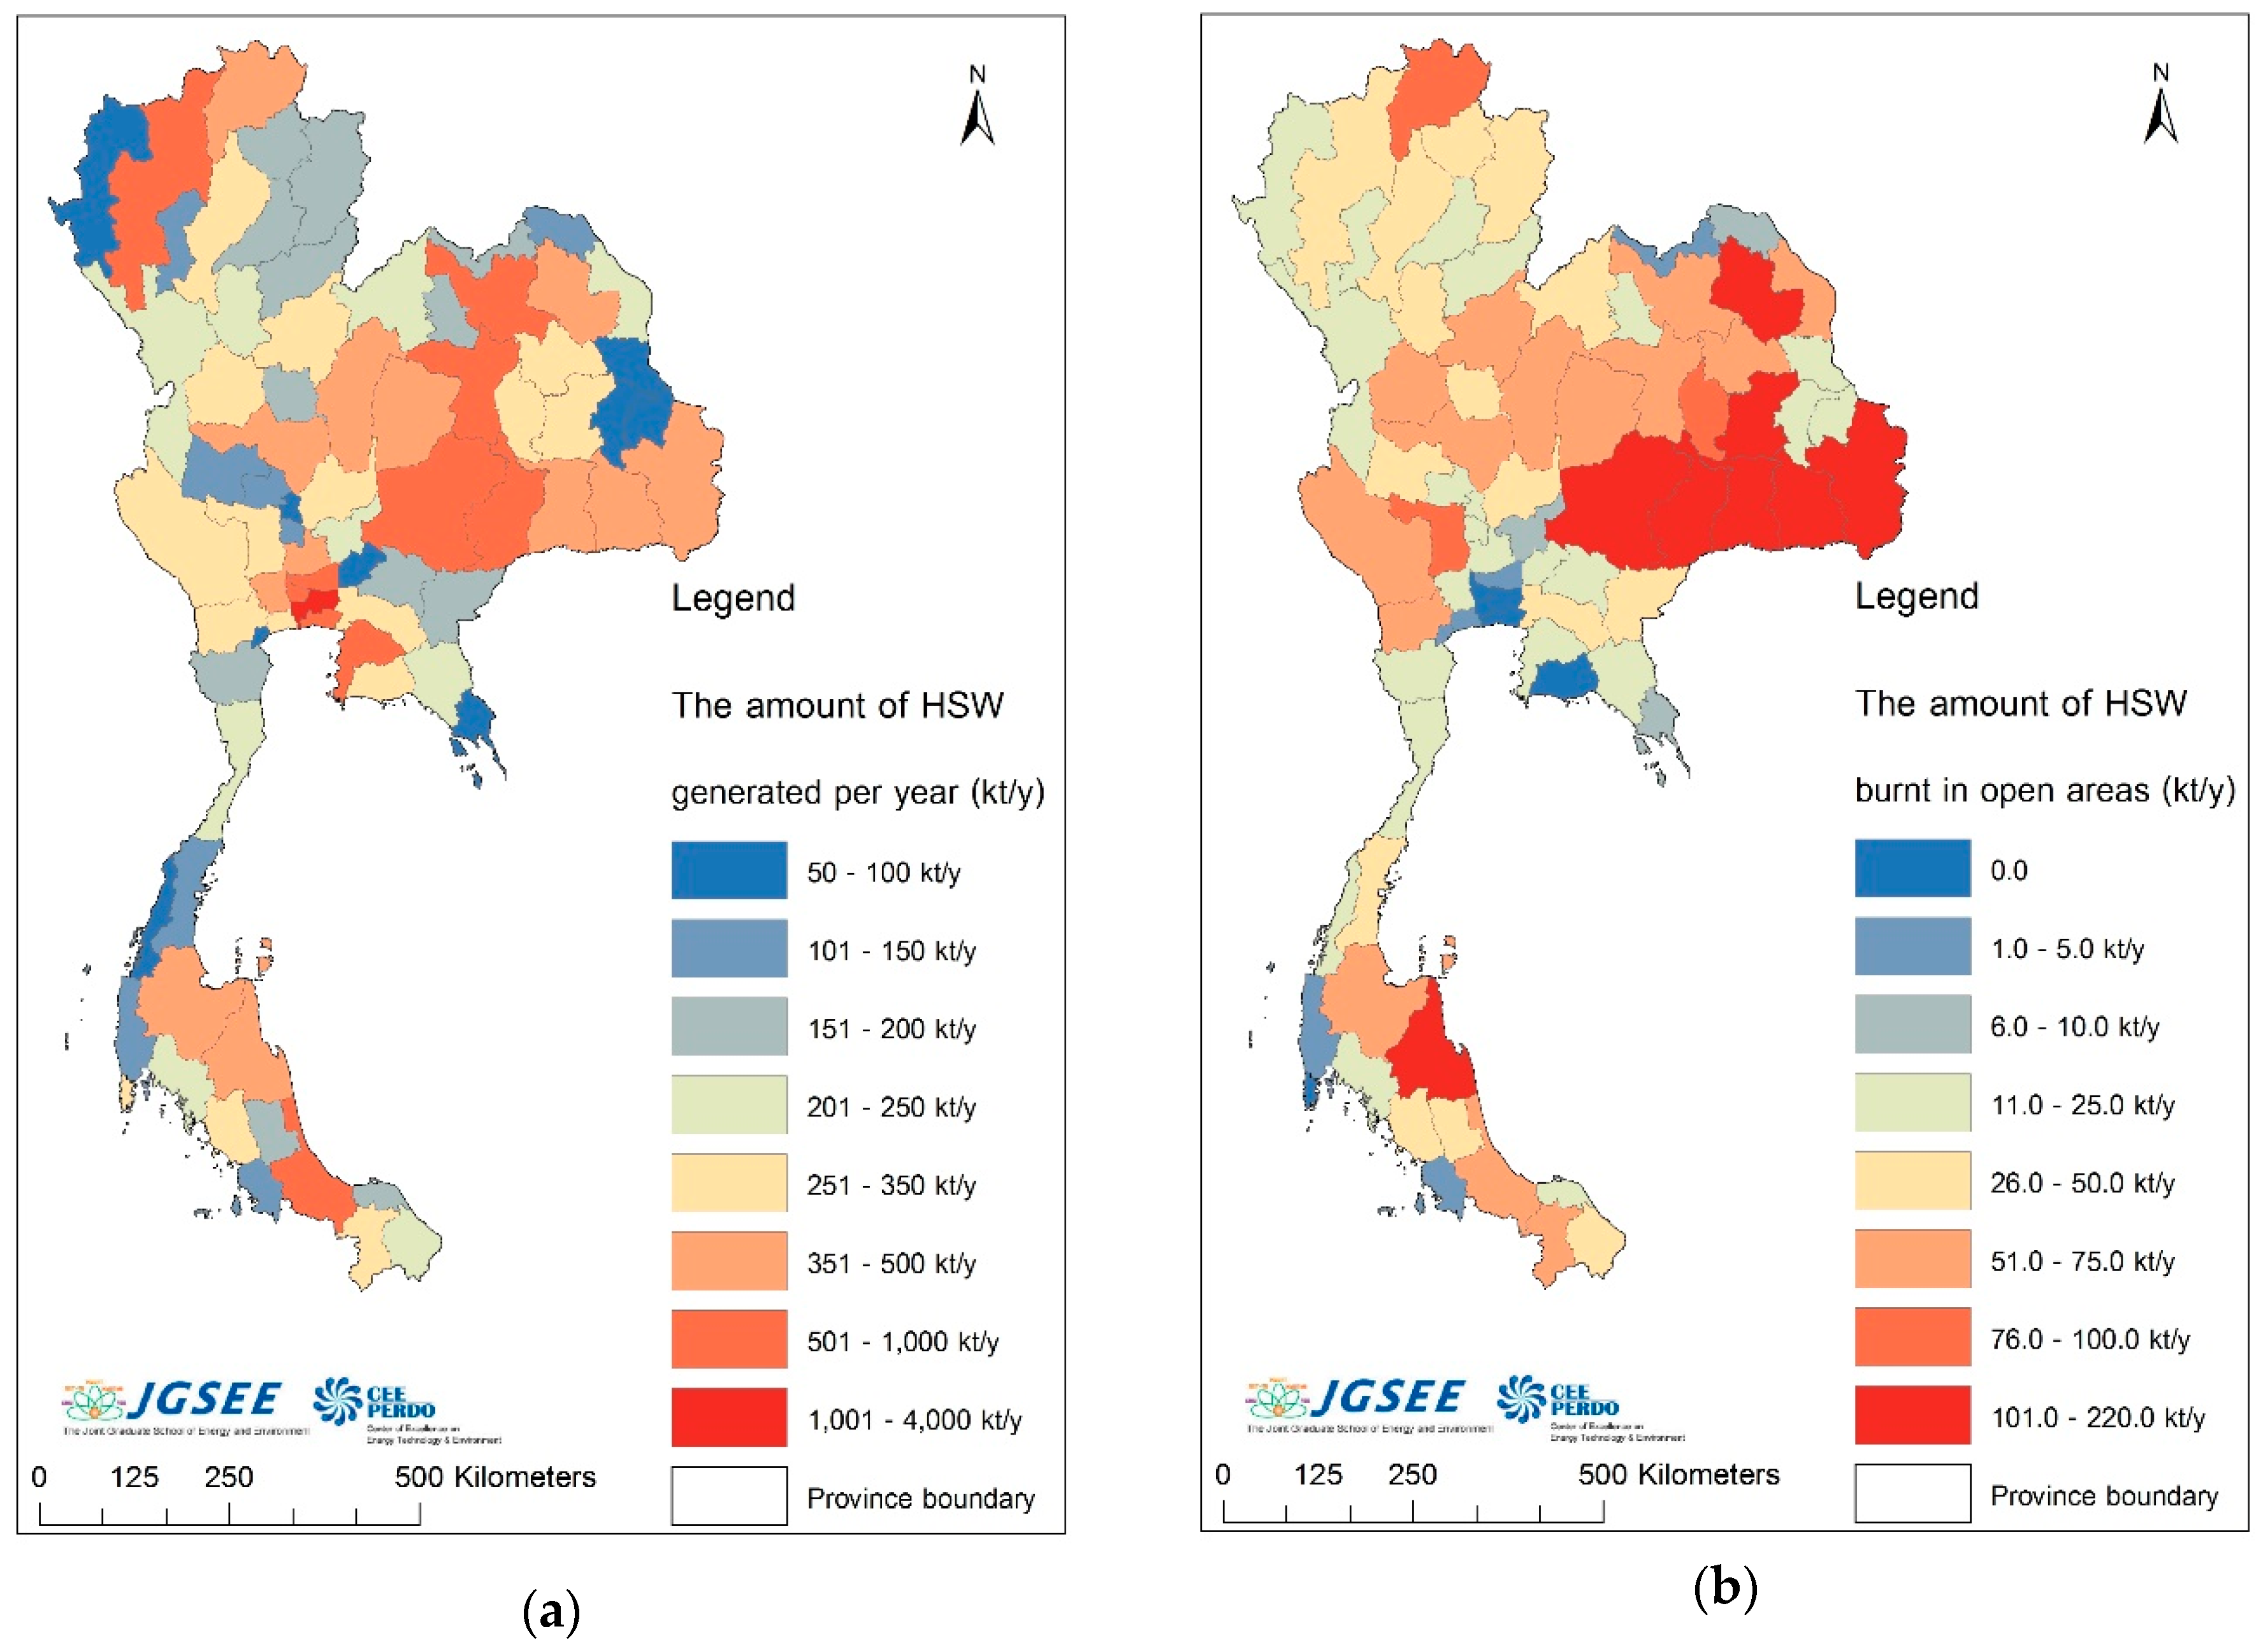
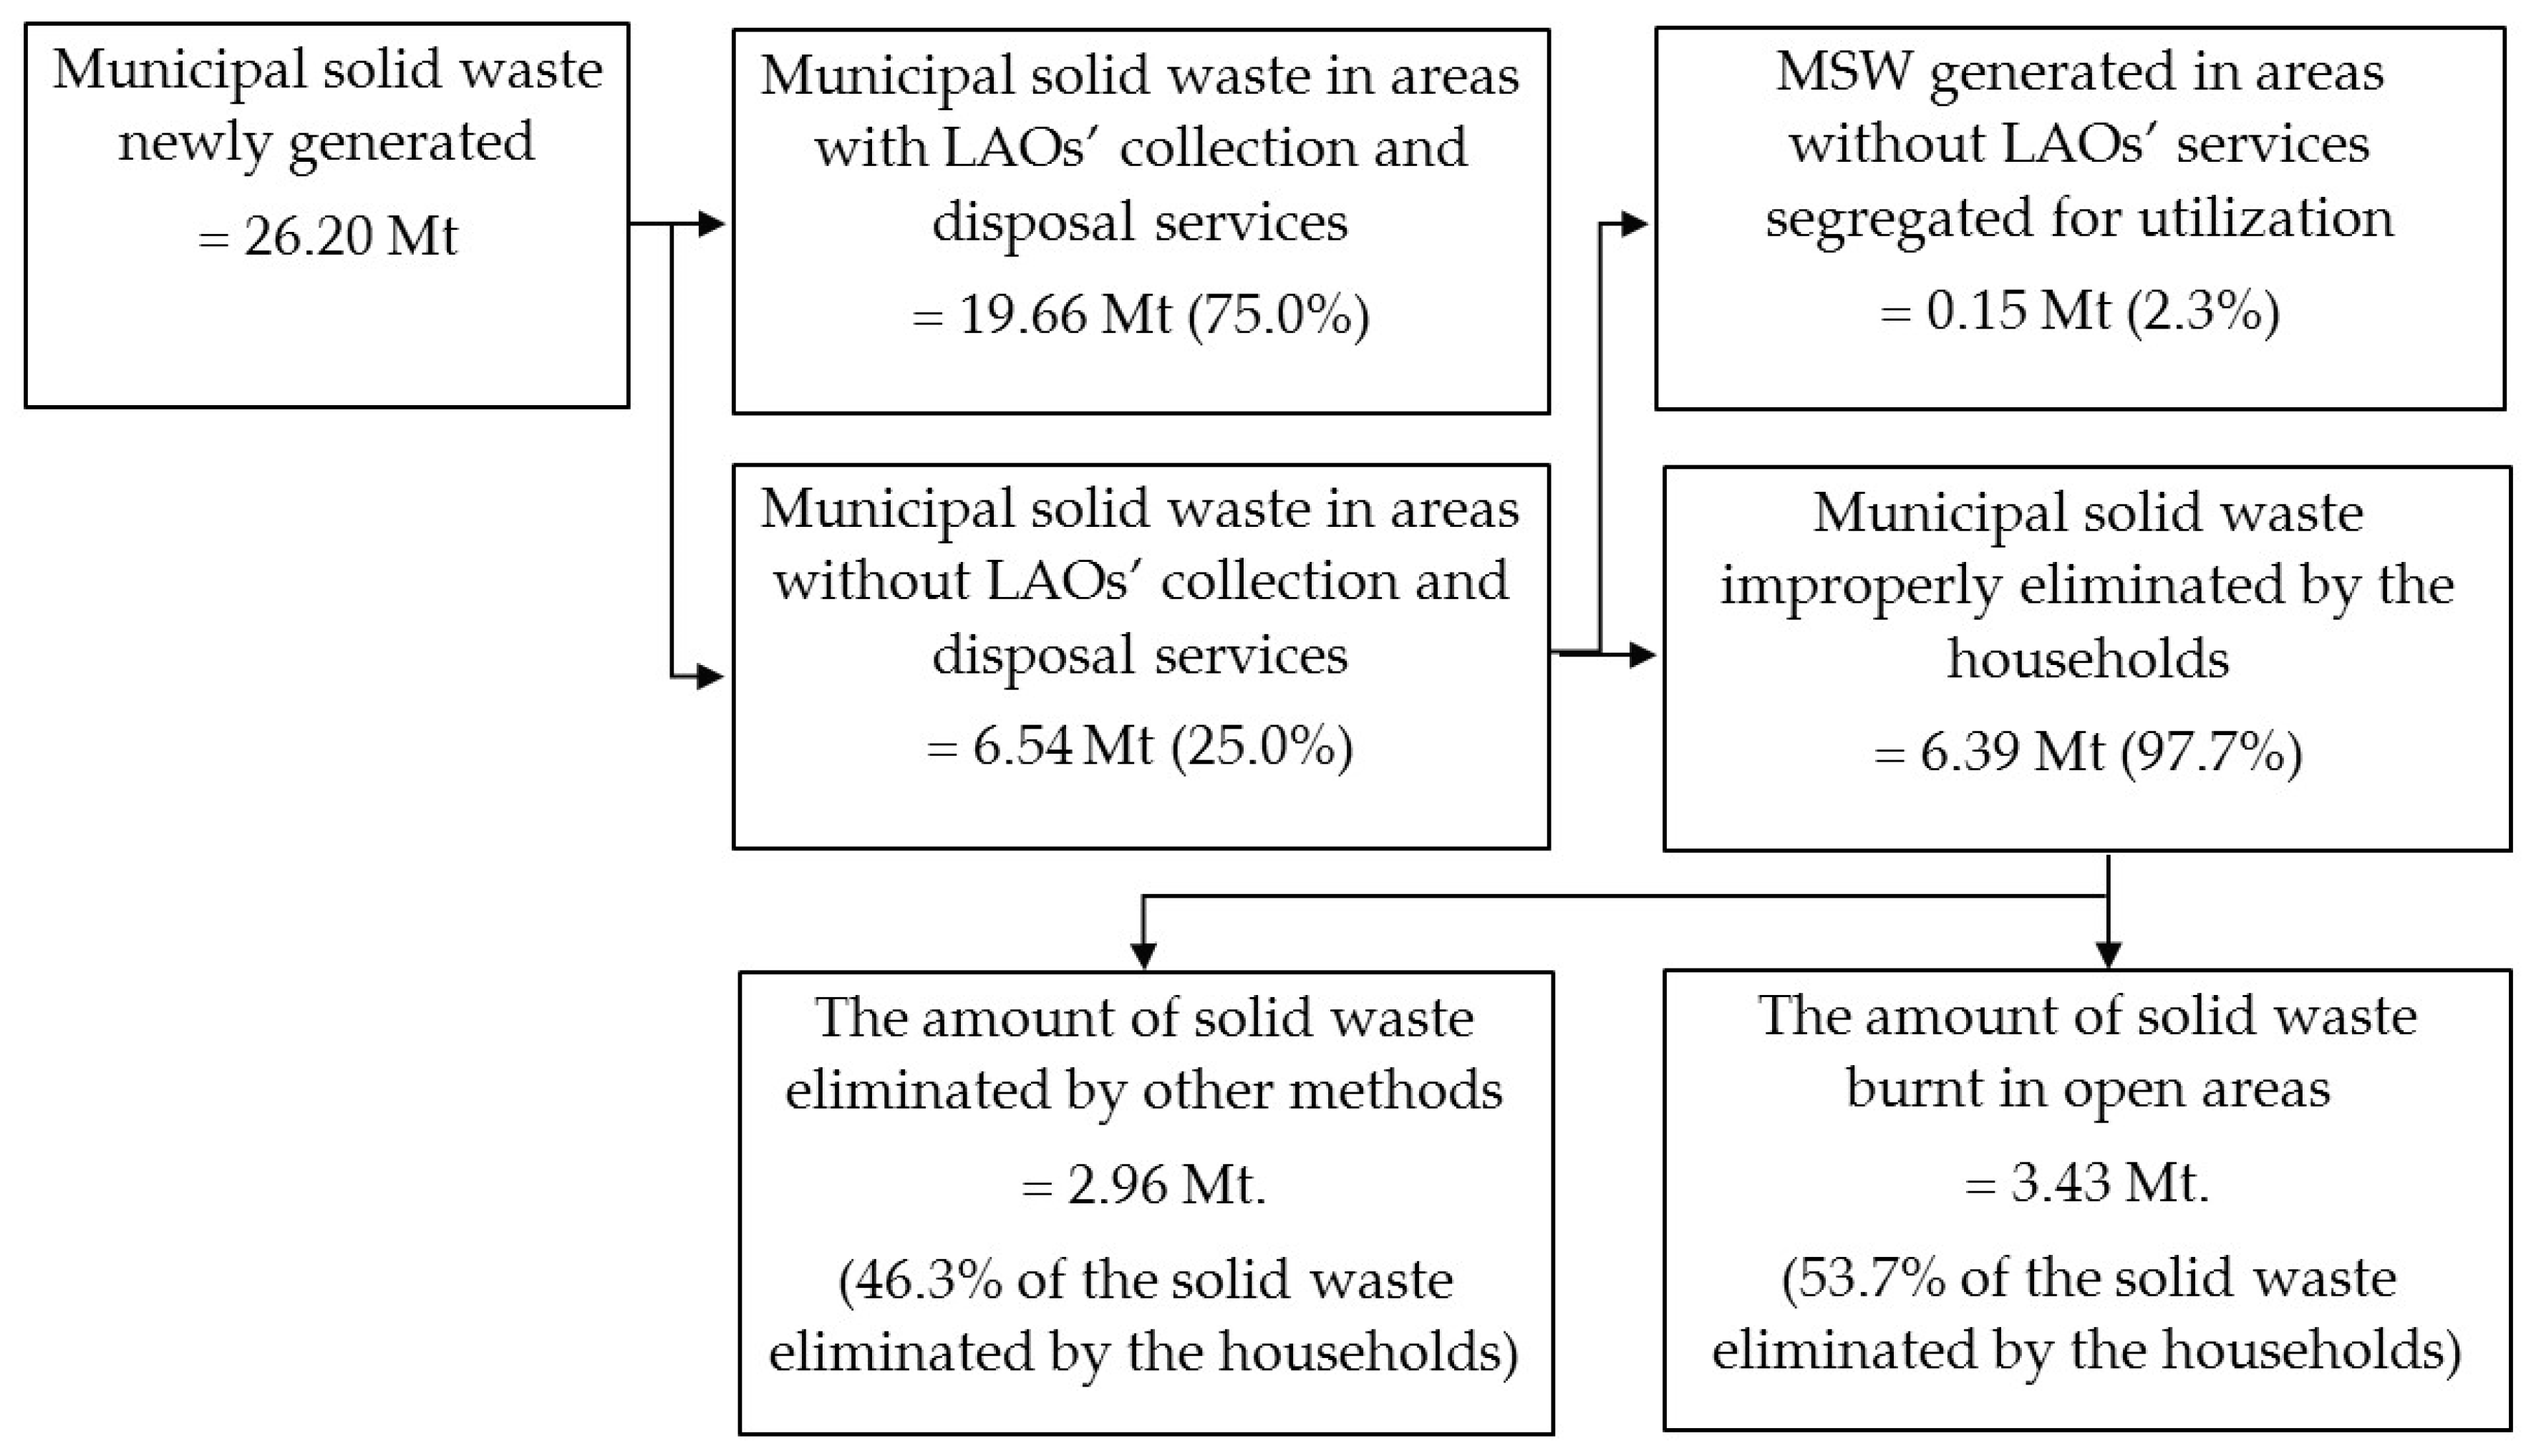
According to the survey on the amount of household solid waste generated in 2016 [3], which was conducted by the PCD in February 2017, it was found that 14.80 Mt of solid waste were accumulated from the past and 26.20 Mt of solid waste were newly generated. With respect to the generated solid waste, there were 19.66 Mt of solid waste in areas with LAOs’ collection and disposal services (see Figure 3a) and 6.54 Mt of solid waste in areas without LAOs’ collection and disposal services (see Figure 3b). Only 0.15 Mt of solid waste generated in areas without LAOs’ services were segregated for utilization. Moreover, 6.39 Mt of leftover solid waste were improperly eliminated by the households. Figure 4a illustrates the amount of household solid waste generated per year by province.
The amount of solid waste eliminated by the households was calculated from the results of interviews with 4300 households who resided in areas without LAOs’ collection and disposal services. It was found that the average amount of solid waste burnt in open areas accounted for 53.7% of the total solid waste eliminated by the households, or an equivalent of 3.43 Mt. Figure 4b demonstrates the amount of solid waste burnt in open areas by province. Open burning of solid waste emitted CO2, CH4, and N2O at the rate of 418.73 kiloton per year (kt/year), 22.29 kt/year, and 0.514 kt/year, respectively, which collectively accounted for 1046.4 kt/year of carbon dioxide equivalent (CO2e). Open burning also emitted other air pollutants such as CO, SO2, NO, and PM, at the rate of 86.4 kt/year, 1.0 kt/year, 6.2 kt/year, and 16.5 kt/year, respectively.
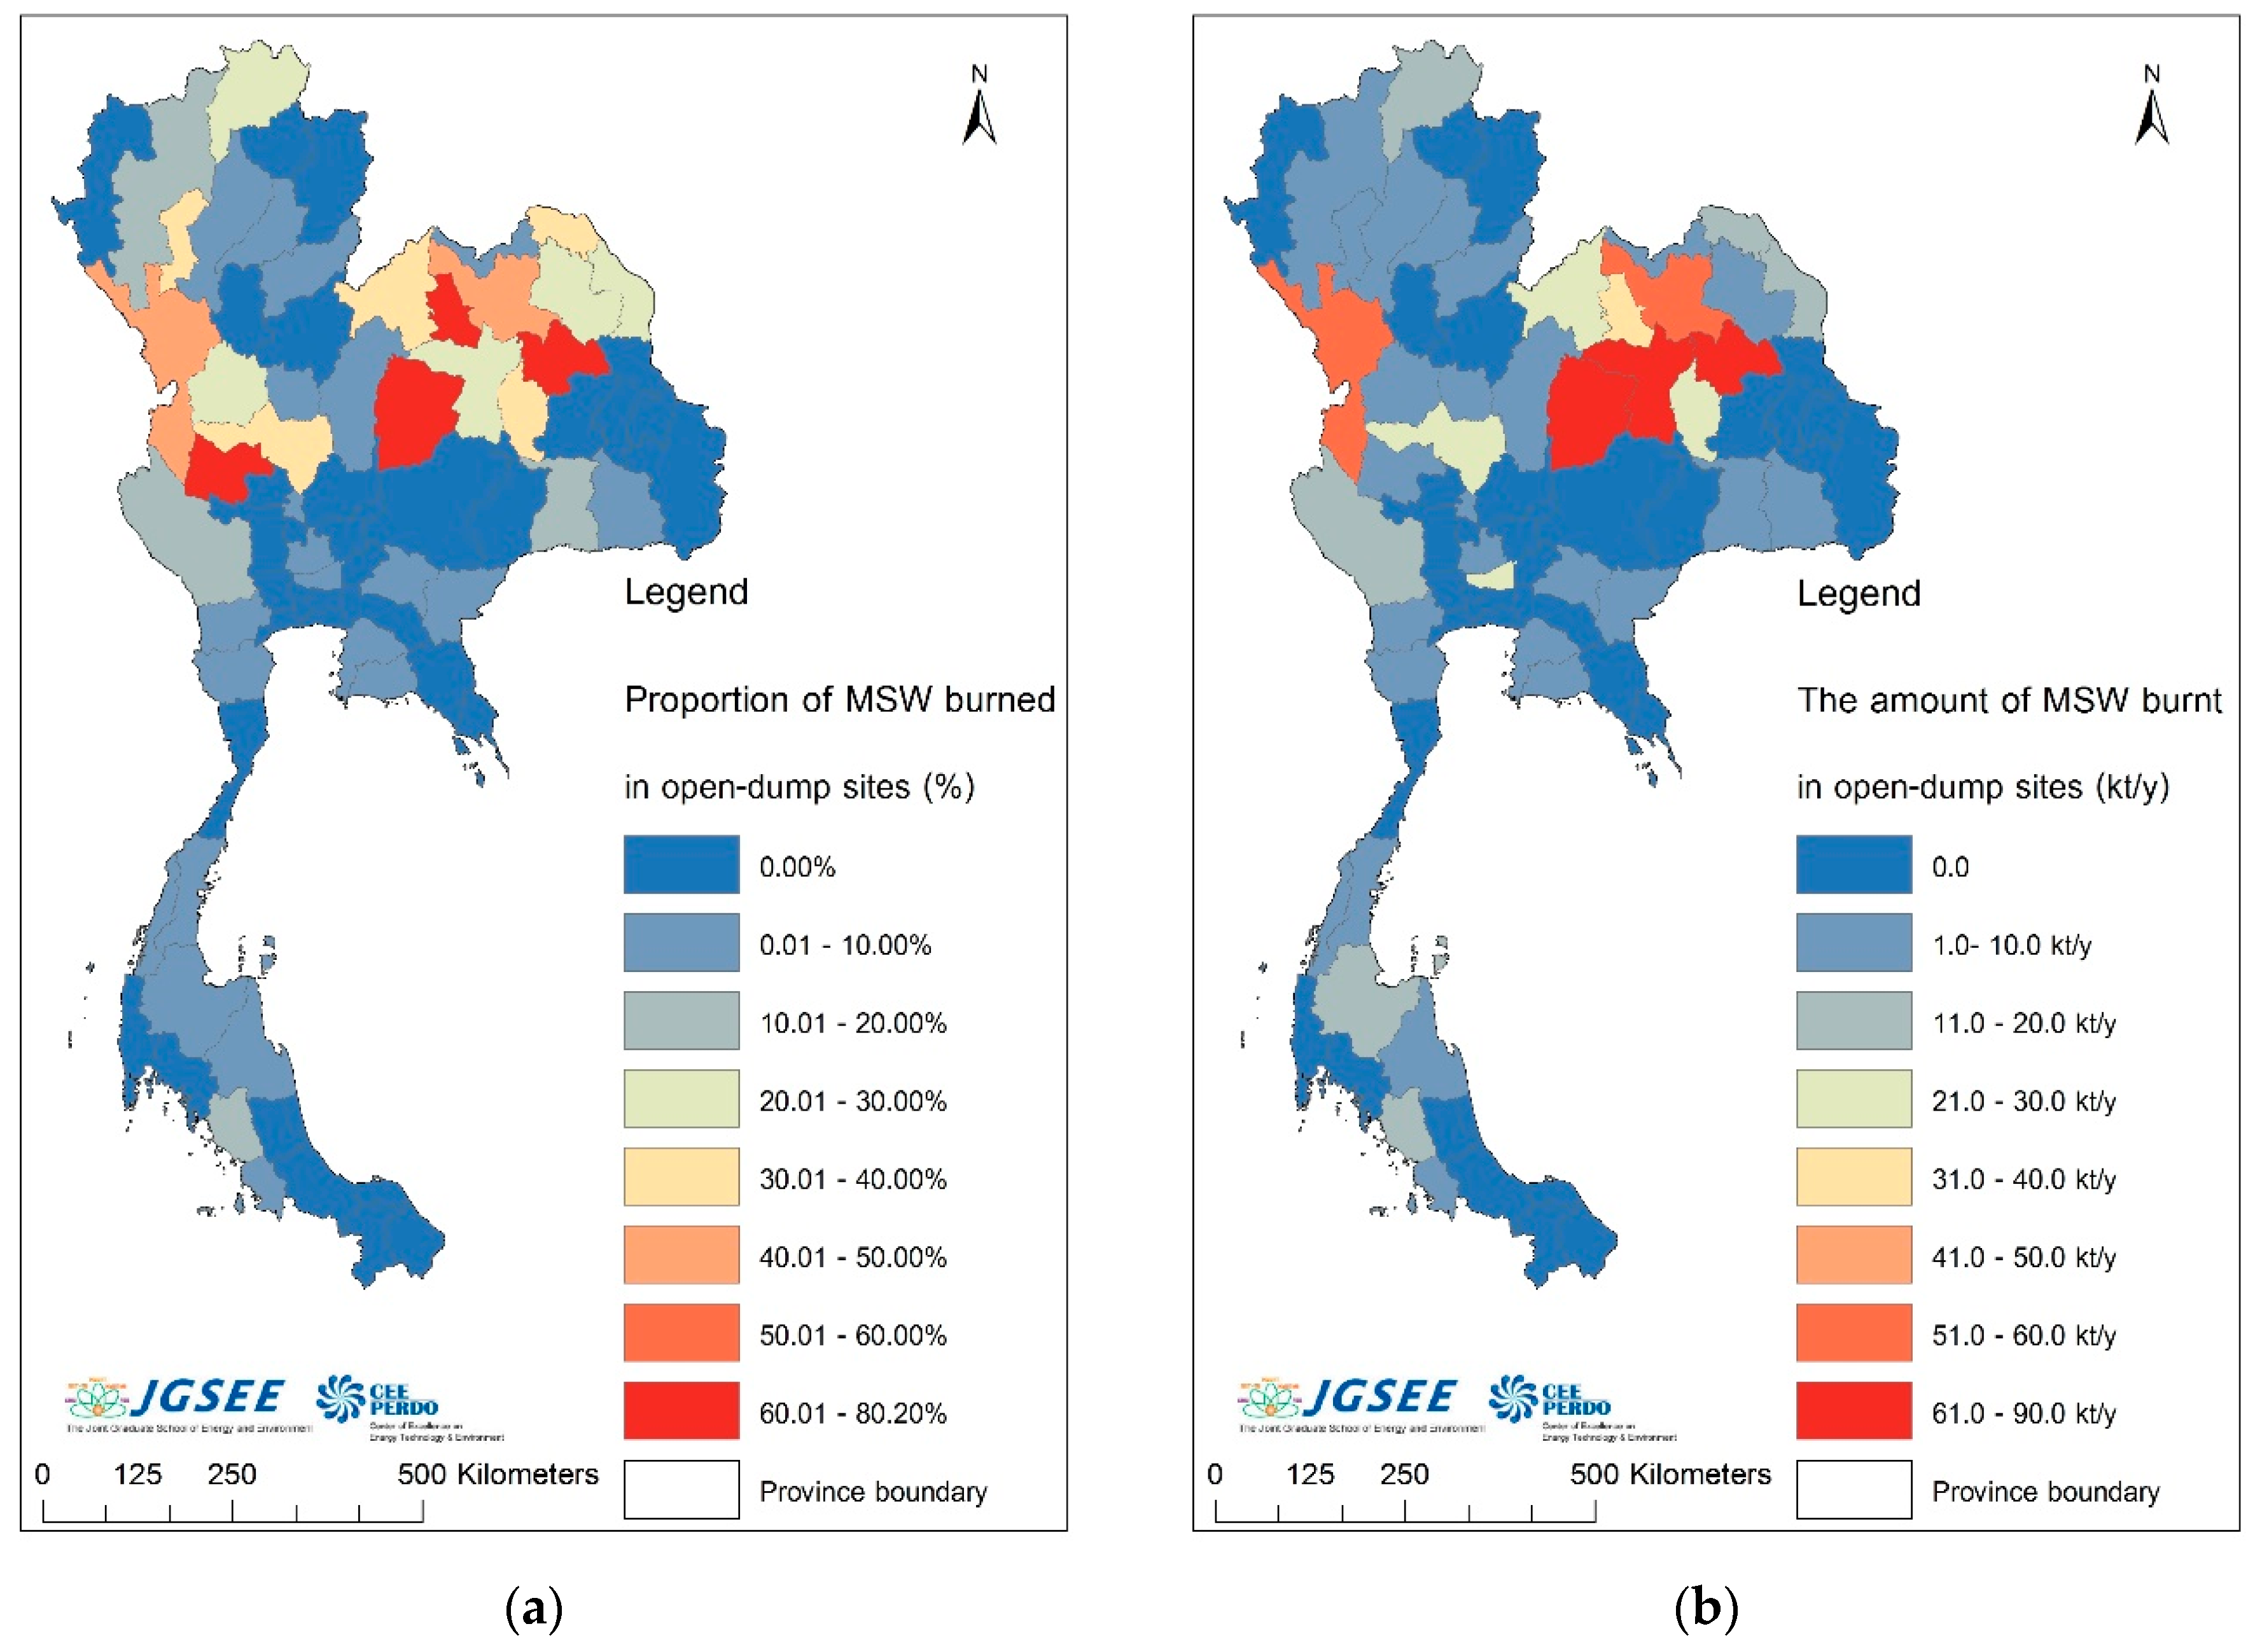
Moreover, the survey on household solid waste generated in 2016 [3] found that 19.66 Mt of solid waste generated in areas with LAOs’ services were collected for elimination. However, it was found that 6.91 Mt of these solid waste (35.2%) were incorrectly eliminated, such as by burning in open-dump sites. The proportion of solid waste in each province that was incorrectly eliminated and failed to meet the standard sanitary practices ranged from 0.0% to 80.2%, depending on the management method employed by each agency (see Figure 5a). In addition, the total amount of solid waste that was incorrectly eliminated and burnt in open-dump sites was found to be 0.66 Mt/year, which emitted 80.44 kt/year of CO2, 4.28 kt/year of CH4, and 0.099 kt/year of N2O—all of which accounted for 201.0 kt/year of CO2e. Other air pollutants were also emitted, including CO, SO2, NO, and PM, at the rate of 16.6 kt/year, 0.2 kt/year, 1.2 kt/year, and 3.2 kt/year, respectively. Figure 5b illustrates the amount of solid waste burnt in open-dump sites by province.
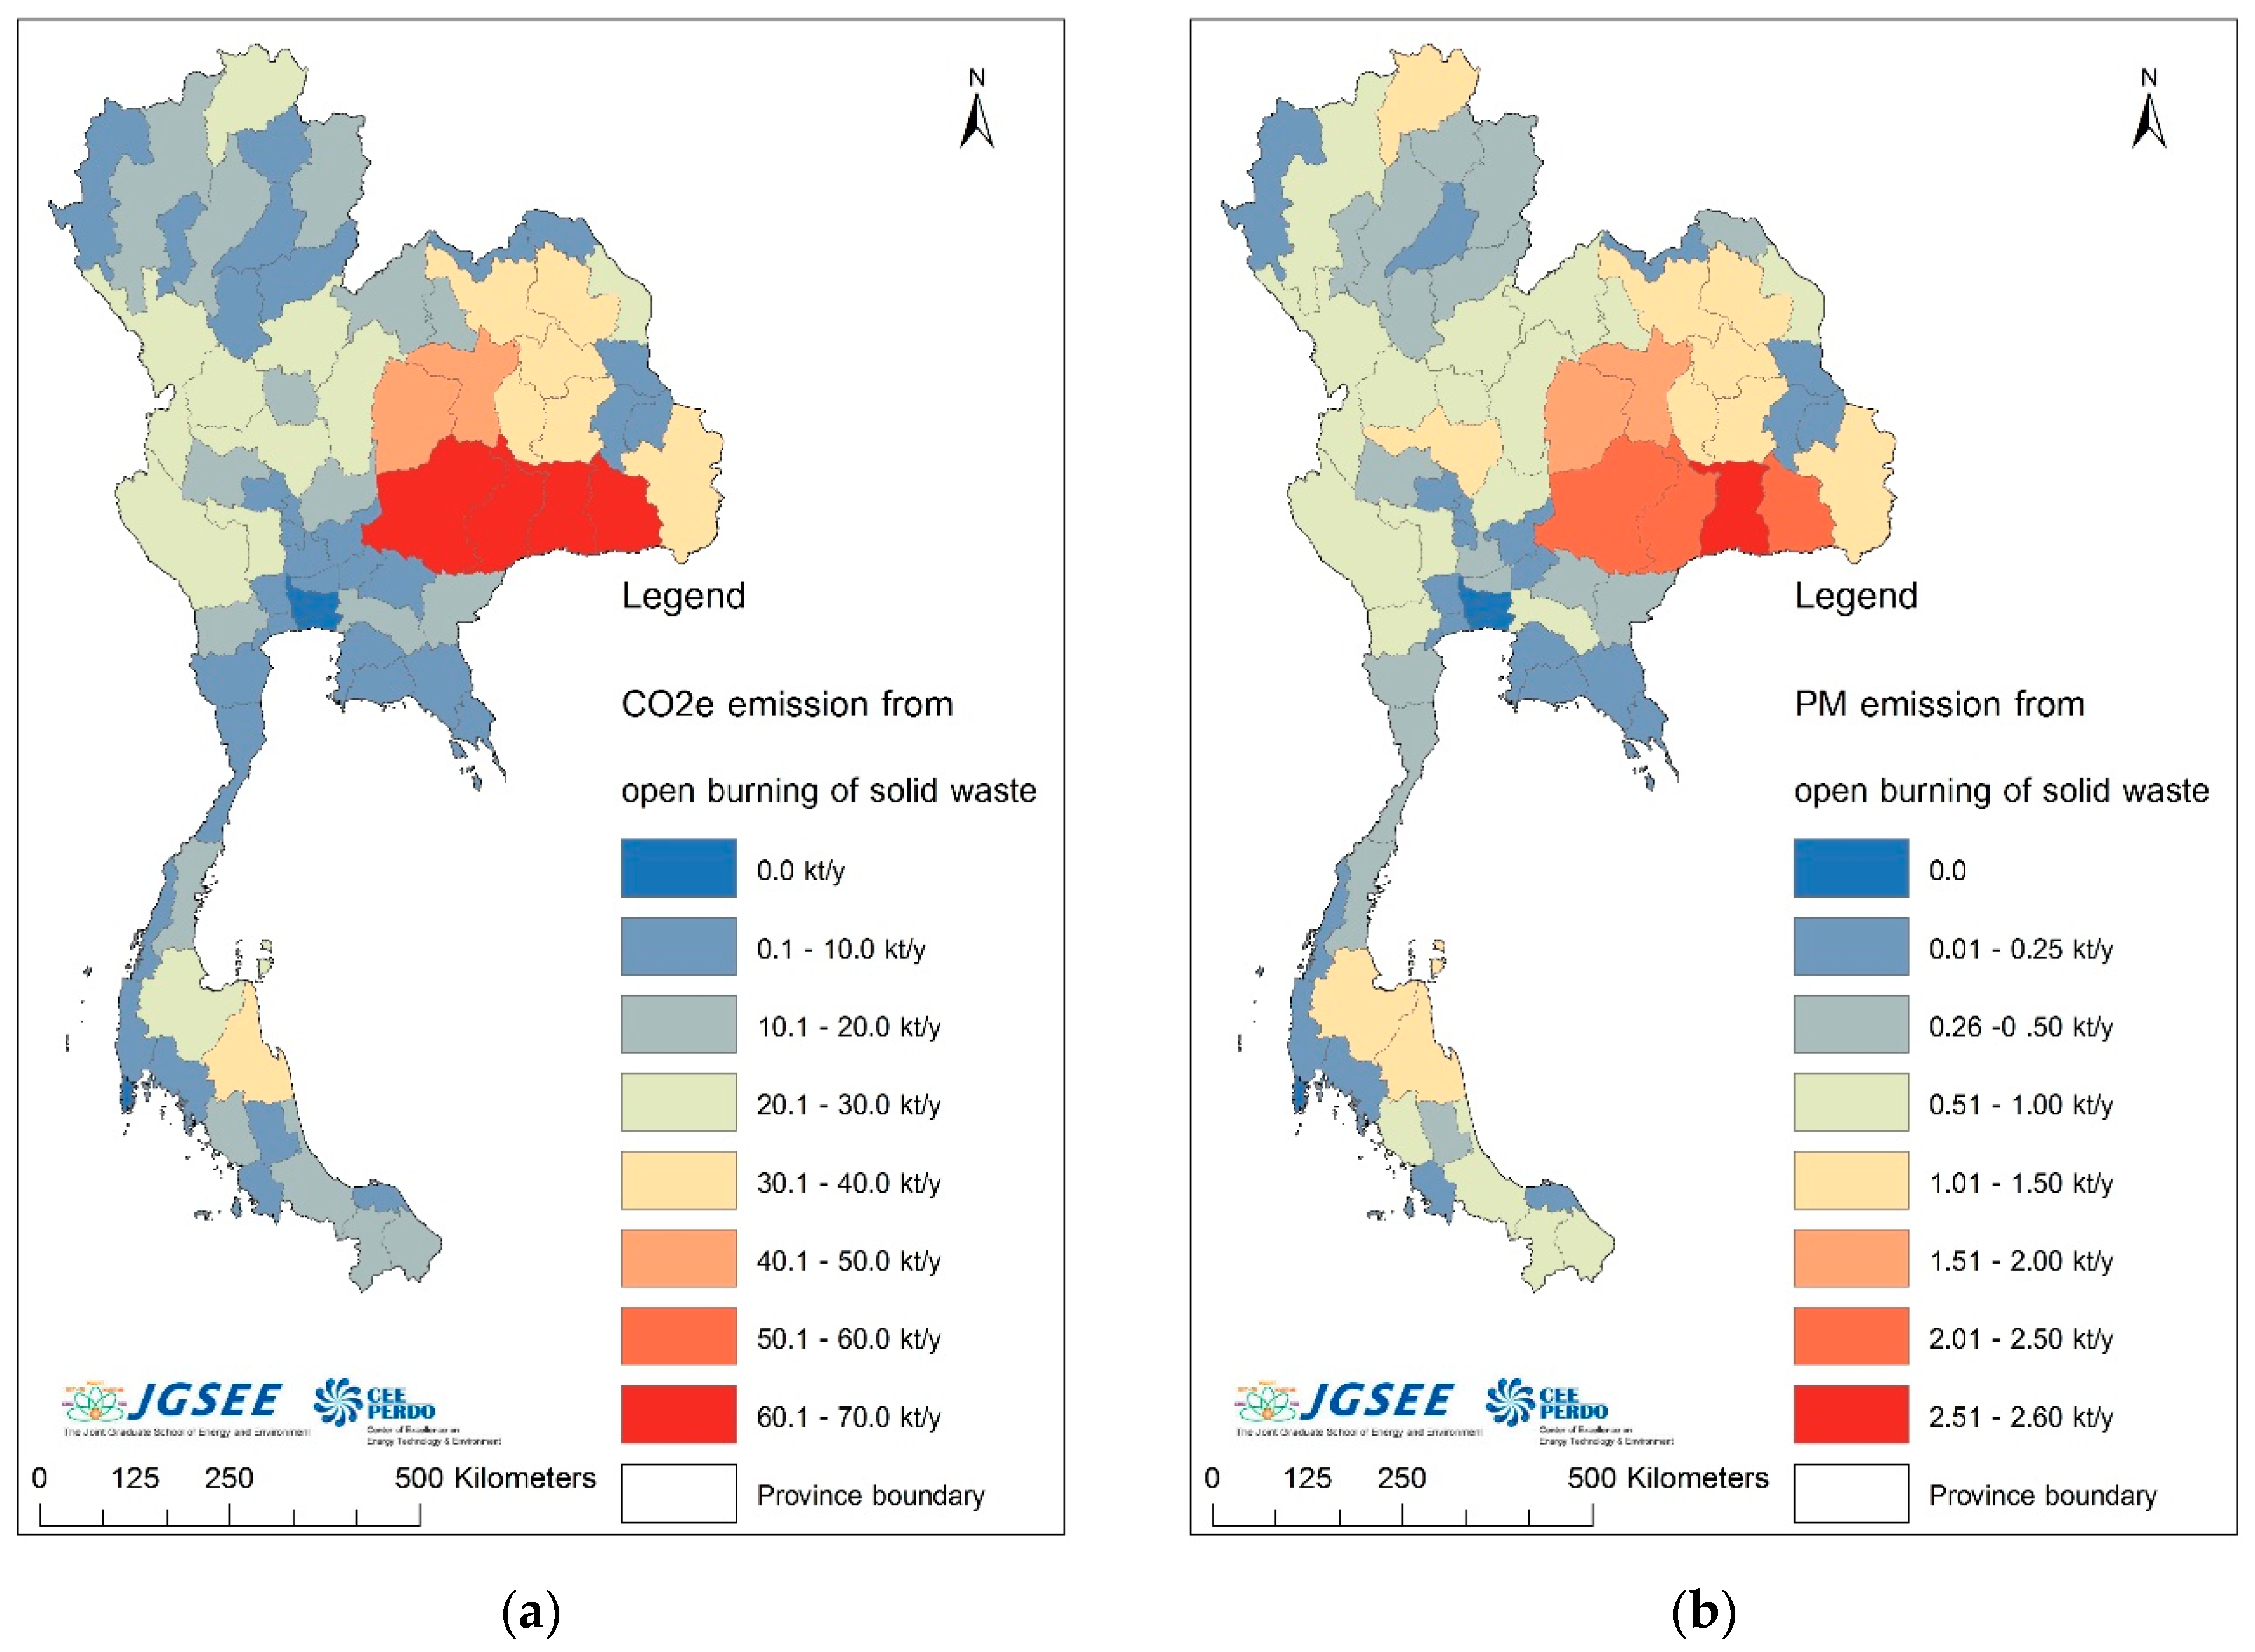
Concerning the emission of greenhouse gases from solid waste open burning, it can be concluded that the total amount of solid waste burnt in open areas in Thailand in 2016 was 4.09 kt/year, of which 499.15 kt/year of CO2, 26.57 kt/year of CH4, and 0.61 kt/year of N2O were emitted and accounted for 1247.3 kt/year of CO2e, or an equivalent of 51.8 kg of CO2e per household and 19.3 kg of CO2e per capita. Other air pollutants were also emitted, including CO, SO2, NO, and PM, at the rate of 103.0 kt/year, 1.2 kt/year, 7.4 kt/year, and 19.6 kt/year, respectively. Figure 6a,b demonstrates the amount of CO2e emission and PM emission from open burning of solid waste by province. It is evident that provinces in the lower northeastern region, such as Nakhon Ratchasima, Buriram, Surin, and Sisaket, had high levels of CO2e emission and PM emission, ranging from 60 to 70 kt/year and 2.0 to 2.60 kt/year, respectively. This is because these provinces had a substantial amount of solid waste that was not collected, which had to be eliminated by the households. Likewise, even though the collection services of the LAOs were available in these provinces, a huge amount of waste was not correctly eliminated according to the sanitary practices. The obtained results can be used to provide information to support policy measures concerning the mitigation of solid waste burning activities. Concisely, Figure 7 demonstrates flow diagram of solid waste management in areas governed by LAOs. The amount of air pollution emitted from household solid waste open burning in Thailand in 2016 is summarized in Table 4.
3.3. Comparisons with National Greenhouse Gas Emissions Inventories in Thailand
According to the national greenhouse gas emission inventory obtained from Thailand’s First Biennial Update Report 2015 [4], which was issued by the Office of Natural Resources and Environmental Policy and Planning, Thailand had a total of 305.52 Mt of CO2e, wherein 222.94 Mt CO2e (72.97%) was from the energy sector, 52.92 Mt CO2e (17.32%) was from the agricultural sector, 18.23 Mt CO2e (5.97%) was from the industrial sector, and 11.43 Mt CO2e (3.74%) was from the waste sector. With respect to the waste sector, it can be further classified into sub-activities, where: 4.93 Mt CO2e (43.10%) was from solid waste disposal on land, 6.41 Mt CO2e (56.07%) was from wastewater handling, and 0.09 Mt CO2e (0.83%) was from waste incineration. Nonetheless, the report did not assess the emission of greenhouse gases from open burning of municipal solid waste due to insufficient data on household solid waste management. When considering the amount of greenhouse gas emission from solid waste open burning, along with the amount of greenhouse gas generated from the waste sector, it was found that Thailand emitted a total of 12.68 Mt CO2e, which accounted for 10.9% of the total emission from the waste sector. Moreover, it was evident that Thailand emitted a total of 306.77 Mt CO2e from the four aforementioned sectors.
3.4. Solutions to Solid Waste Management Problems of the LAOs
Upon consideration of households’ reception of information regarding waste disposal of LAOs, it was evident that the majority of households (50.3%) never received any information. Meanwhile, 40.3% of households rarely received information, 8.7% of households often received information, and only 0.7% of households received such information on a regular basis. Based on the results of analysis, it can be inferred that households’ reception of information from LAOs was poor, which consequently caused them to incinerate waste as a means of waste disposal. Similarly, households were not aware of legal provisions on the practice of garbage and waste disposal by LAOs in their residential areas.
According to the interviews with officers from 24 LAOs (chosen from 96 LAOs) who were responsible for the collection of solid waste, it was found that the LAOs could not collect solid waste from all households due to a small number of households in the area, which subsequently led to an insufficient amount of budget allocated to the area. As a result, the LAOs could not provide machines and vehicles for the transportation of solid waste. Similarly, they did not have enough budget to employ staff for collection of solid waste and could not find proper sites for disposal of solid waste. Hence, the monthly expense in hiring staff to undertake the responsibility of solid waste management was somewhat high. On the contrary, LAOs with a higher number of households would determine the operational plan for solid waste collection, as well as regulations on the elimination of solid waste and sewage. Meanwhile, the fact that the LAOs did not provide collection services to all areas under their supervision was because the households in those areas were located too far from their offices and were scattered across remote areas. With such remoteness of the households, the LAOs perceived that the cost of gasoline would not compensate the collection fee. Thus, they mainly collected solid waste from households who resided within close proximity to their offices. To solve the aforementioned problems, the officers of the LAOs stated that they held a meeting with villagers to identify appropriate guidelines to address the problems. The officers further recommended that specific places should be determined for households to dispose their solid waste, whereby waste collection vehicles would be sent around 2–3 days per week for solid waste management, which would reduce the fuel costs of the collection vehicles.
4. Conclusions
Based on data from the survey and the national municipal solid waste statistics, which provide the amount of household solid waste generated, managed, and subjected to burning, this study calculated the amount of air pollution from open burning of household solid waste in Thailand in 2016. According to the results of this study, households generated approximately 26.17 Mt of solid waste, of which nearly three-fourths was managed by the LAOs and one-fourth was eliminated by the households. Almost 53.7% of the total uncollected household solid waste was subjected to open burning. Moreover, the results indicated that the amount of household solid waste burnt inside or outside the households’ property was 3.43 Mt, which accounted for nearly 13% of the total household solid waste generated. Annual emissions from open burning of household solid waste comprised 418.73 kt of CO2, 22.29 kt of CH4, 0.514 kt of N2O, 86.4 kt of CO, 1.0 kt of SO2, 6.2 kt of NO, and 16.5 kt of PM, which were predominantly generated from the northeastern and central regions of Thailand. With that respect, these regions entail effective mitigation measures to reduce the amount of air pollution.
Furthermore, this study also identifies solutions to the solid waste management problems of the LAOs. It can be observed that small-to-medium LAOs with low budgets and small number of households encounter similar problems, which include insufficient budgets for collection and elimination of municipal solid waste. The study revealed that, despite many LAOs in the country, households had to adopt their own methods for elimination of solid waste—most of which caused environmental and health problems to citizens in the area. It is undoubted that these problems are critical and should be solved by the public sector by means of allocating more budgets to the LAOs for the purposes of solid waste collection and determination of appropriate places for waste disposal. The public sector should impose regulations on the LAOs concerning the elimination of solid waste and sewage to ensure that the collection services provided by the LAOs are conducted in an appropriate and sustainable manner. In addition, households who prefer to eliminate solid waste by themselves should be educated on the appropriate methods for solid waste elimination, which can alleviate the problems of solid waste management. Examples of these methods include segregating hazardous waste to be disposed at appropriate sites provided by the public sector or local agencies, collecting solid waste to be disposed at the provided sites, segregating recyclable waste from common solid waste, reducing the use of plastic bags, and preventing undesirable behaviors that hinder the elimination of solid waste, such as replacing plastic bags with reusable bags. Local government agencies should provide households with knowledge on solid waste management and instill conscience in those who reside in the areas with and without the LAOs’ services.
Suggestion for further work, regarding the target of Thailand Environmental Quality Management Plan 2017–2021 [8], the proportion of disposal methods adopted by households for waste that is not collected by LAOs should be updated using questionnaires and field data collection. In addition, the real composition of household solid waste generated in the sample household should be evaluated to increase the quality of the survey, especially conducted in northeastern provinces where the majority of LAOs have not promulgated legal provisions on garbage and waste disposal.
Author Contributions
J.P. and A.J. devised the project, the main conceptual ideas and proof outline. They worked out almost all of the technical details, questionnaire surveys, and performed the numerical calculations. A.J. work on the spatial distribution of emission from household solid waste open burning by using Geographic Information System (GIS) program. A.J. proposed the result in discussions with S.G. All authors discussed the results and contributed to the final manuscript.
Funding
This research was funded by the Thammasat University and the Thailand Research Fund grant number [TRG6080012].
Acknowledgments
This study was supported by Thammasat University. The authors would also like to thank research funds from The Thailand Research Fund (TRG6080012) for research activities. The authors would like to express gratitude to the Pollution Control Department–Ministry of Natural Resources and Environment for providing all of the information used in this study. Lastly, the authors sincerely appreciate all of the people for their cooperation in answering questions and granting the officers from 24 local administrative organizations to interview the questionnaire.
Conflicts of Interest
The authors declare no conflict of interest.
References
- Hoornweg, D.; Bhada-Tata, P. What a Waste: A Global Review of Solid Waste Management; Urban Development & Local Government Unit, World Bank: Washington, DC, USA, 2012; p. 9. [Google Scholar]
- PCD—Pollution Control Department. Thailand State of Pollution Report 2016; PCD—Pollution Control Department, Ministry of Natural Resources and Environment: Bangkok, Thailand, 2016. Available online: http://infofile.pcd.go.th/mgt/Pollution%20Report%202016%20.pdf?CFID=2513660&CFTOKEN=16816152 (accessed on 3 March 2018).
- PCD—Pollution Control Department. Municipal Solid Waste Situation of Thailand 2016; PCD—Pollution Control Department, Ministry of Natural Resources and Environment: Bangkok, Thailand, 2016. Available online: http://infofile.pcd.go.th/waste/wsthaz_annual59.pdf (accessed on 3 March 2018).
- ONEP—Office of Natural Resources and Environmental Policy and Planning. Thailand’s First Biennial Update Report under the United Nations Framework Convention on Climate Change; ONEP—Office of Natural Resources and Environmental Policy and Planning: Bangkok, Thailand, 2015; Available online: https://unfccc.int/files/national_reports/nonannex_i_parties/biennial_update_reports/application/pdf/thabur1.pdf (accessed on 3 March 2018).
- NSO—National Statistical Office. Thailand Population (2017); NSO—National Statistical Office, Official Statistics Registration Systems: Bangkok, Thailand, 2017. Available online: http://stat.dopa.go.th/stat/statnew/upstat_age_disp.php (accessed on 10 February 2018).
- DPA—Department of Provincial Administration. Thailand Administrative Organizations; DPA—Department of Provincial Administration, Office of Official Information Commission: Bangkok, Thailand, 2017. Available online: http://www.oic.go.th/FILEWEB/CABINFOCENTER17/DRAWER007/GENERAL/DATA0000/00000024.PDF (accessed on 10 February 2018).
- ILO—International Labour Organization. Public Health Act B.E. 2535 (1992); ILO—International Labour Organization: Bangkok, Thailand, 2015; Available online: http://www.ilo.org/dyn/natlex/docs/ELECTRONIC/89340/102614/F988836675/THA89340.pdf (accessed on 3 July 2018).
- ONEP—Office of Natural Resources and Environmental Policy and Planning. Thailand Environmental Quality Management Plan 2017–2021; ONEP—Office of Natural Resources and Environmental Policy and Planning: Bangkok, Thailand, 2015. Available online: http://www.onep.go.th/wp-content/uploads/3.1.Plan-2060-2564.pdf (accessed on 3 July 2018).
- PCD—Pollution Control Department. Surveying and Analyzing Composition of Municipal Solid Waste of Municipalities in Thailand; PCD—Pollution Control Department, Ministry of Natural Resources and Environment: Bangkok, Thailand, 2002.
- NSO—National Statistic Organization. Number of Household of Thailand during 2006–2015; NSO—National Statistic Organization: Bangkok, Thailand, 2017. Available online: http://service.nso.go.th/nso/web/statseries/tables/00000_Whole_Kingdom/household.xls (accessed on 10 August 2016).
- DLA—Department of Local Administration. Summary of Local Administrative Organizations in Thailand; DLA—Department of Local Administration, Ministry of Interior: Bangkok, Thailand, 2017. Available online: http://www.dla.go.th/work/abt/index.jsp (accessed on 10 August 2016).
- Cochran, W.G. Stratified Random Sampling. In Sampling Techniques, 3rd ed.; John Wiley & Sons: New York, NY, USA, 1977; Chapter 5; pp. 89–97. Available online: https://archive.org/details/Cochran1977SamplingTechniques_201703 (accessed on 10 August 2016).
- Houghton, J.T.; Meira Filho, L.G.; Lim, B.; Tranton, K.; Mamaty, I.; Bonduki, Y.; Griggs, D.J.; Callander, B.A. Revised 1996 IPCC Guidelines for National Greenhouse Gas Inventories, Volume 5: Waste; Intergovernmental Panel on Climate Change (IPCC), Meteorological Office: Bracknell, UK, 1997; p. 482. [Google Scholar]
- PCD—Pollution Control Department. Project of Survey and Analysis of Municipal Solid Waste Component from Municipalities in Thailand; PCD—Pollution Control Department, Ministry of Natural Resources and Environment: Bangkok, Thailand, 2004. Available online: http://ptech.pcd.go.th/pcd/document/005940/005940.pdf (accessed on 10 August 2016).
- ONEP—Office of Natural Resources and Environmental Policy and Planning. Thailand’s Second National Communication under UNFCCC; ONEP—Office of Natural Resources and Environmental Policy and Planning, Ministry of Resources and Environment: Bangkok, Thailand, 2011; Available online: https://unfccc.int/resource/docs/natc/thainc2.pdf (accessed on 10 August 2016).
- Seiler, W.; Crutzen, P.J. Estimates of gross and net fluxes of carbon between the biosphere and the atmosphere from biomass burning. Clim. Chang. 1980, 2, 207–247. [Google Scholar] [CrossRef]
- Lemieux, P.M.; Lutes, C.C.; Santoianni, D.A. Emissions of organic air toxics from open burning: A comprehensive review. Prog. Energy Combust. Sci. 2004, 30, 1–32. [Google Scholar] [CrossRef]
Figure 1.
(a) Top 10 provinces in Thailand with problems of solid waste management; and (b) the amount of municipal solid waste accumulated at disposal sites.
Figure 1.
(a) Top 10 provinces in Thailand with problems of solid waste management; and (b) the amount of municipal solid waste accumulated at disposal sites.

Figure 2.
Percentage of municipal solid waste generated by the LAOs in Thailand.

Figure 3.
The map of provinces: (a) areas with LAOs’ collection and disposal services (4422 places); and (b) areas without LAOs’ collection and disposal service (3337 places).
Figure 3.
The map of provinces: (a) areas with LAOs’ collection and disposal services (4422 places); and (b) areas without LAOs’ collection and disposal service (3337 places).

Figure 4.
Spatial distribution of: (a) the amount of household solid waste generated per year; and (b) the amount of household solid waste burnt in open areas.
Figure 4.
Spatial distribution of: (a) the amount of household solid waste generated per year; and (b) the amount of household solid waste burnt in open areas.

Figure 5.
(a) The proportion of solid waste burnt in open-dump sites; and (b) the amount of household solid waste burnt in open-dump sites by province.
Figure 5.
(a) The proportion of solid waste burnt in open-dump sites; and (b) the amount of household solid waste burnt in open-dump sites by province.

Figure 6.
The spatial allocation of: (a) CO2e emission; and (b) PM emission from open burning of solid waste.
Figure 6.
The spatial allocation of: (a) CO2e emission; and (b) PM emission from open burning of solid waste.

Figure 7.
Flow diagram of solid waste management in areas governed by LAOs.


Table 1.
Equations for estimation of parameters to describe characteristics of the population, including mean, total, proportion, and variance.
Table 1.
Equations for estimation of parameters to describe characteristics of the population, including mean, total, proportion, and variance.
| Parameters | Equations |
|---|---|
| Mean of population () | |
| Variance of population mean () | |
| when | |
| Standard error of population mean (S.E.) | |
| Total of population () | |
| Variance of population total () | |
| Standard error of population total (S.E.) | |
| Proportion of population () | |
| Variance of population proportion () | |
| Standard error of population proportion (S.E.) |
Table 2.
Municipal solid waste management analyzed from the interviews with households.
| Type of Solid Waste | Management by Municipal/SAO | Self-Management | S.E. (%) |
|---|---|---|---|
| Wet solid waste, plant scraps, vegetable scraps, and food waste | 57.2 | 42.4 | 0.75 |
| Plastic bags | 62.2 | 37.8 | 0.74 |
| Polyurethane foam waste, and foam containers | 63.6 | 36.4 | 0.73 |
| Plastic bottles and plastic products | 32.5 | 67.4 | 0.71 |
| Papers, newspapers, and paper cartons | 38.6 | 61.4 | 0.74 |
| Beverage cans | 41.0 | 59.0 | 0.75 |
| Wooden pieces, leaves, branches, and grasses | 37.8 | 62.2 | 0.74 |
| Wooden furniture and wooden products | 67.0 | 33.0 | 0.72 |
| Cloth remnants, clothes, and clothing products | 73.1 | 26.9 | 0.68 |
| Sanitary napkins | 62.6 | 37.2 | 0.74 |
| Rubbers and leathers | 78.8 | 21.2 | 0.62 |
| Metals and steels | 49.1 | 50.9 | 0.76 |
| Glasses and glass debris | 45.8 | 54.2 | 0.76 |
| Other types of waste, such as torch batteries and light bulbs | 67.0 | 33.0 | 0.72 |
Table 3.
Percentage of households who managed solid waste that were not collected by the LAOs, categorized by solid waste composition.
Table 3.
Percentage of households who managed solid waste that were not collected by the LAOs, categorized by solid waste composition.
| Solid Waste Management | Composition of Household Solid Waste (%) 1 | ||||||||||||
|---|---|---|---|---|---|---|---|---|---|---|---|---|---|
| C1 | C2 | C3 | C4 | C5 | C6 | C7 | C8 | C9 | C10 | C11 | C12 | C13 | |
| Collection of waste in bags and disposal thereof at the waste disposal sites | 25.0 0.66 | 28.8 0.69 | 39.5 0.74 | 4.8 0.33 | 8.1 0.42 | 12.0 0.50 | 10.1 0.46 | 52.7 0.76 | 67.5 0.71 | 54.6 0.76 | 25.6 0.67 | 20.8 0.62 | 36.4 0.73 |
| Burning of solid waste on their property | 24.1 0.65 | 44.4 0.76 | 27.0 0.68 | 2.5 0.24 | 3.0 0.26 | 2.2 0.22 | 39.8 0.75 | 12.9 0.51 | 4.9 0.33 | 19.7 0.61 | 1.6 0.19 | 0.5 0.11 | 3.8 0.29 |
| Burning of solid waste outside their property | 11.3 0.48 | 22.4 0.64 | 28.3 0.69 | 0.6 0.12 | 1.5 0.19 | 2.8 0.25 | 20.4 0.61 | 19.2 0.60 | 22.8 0.64 | 15.2 0.55 | 6.4 0.37 | 2.7 0.25 | 6.3 0.37 |
| Open dumping on their property | 3.3 0.27 | 0.2 0.07 | 0.4 0.10 | 0.3 0.08 | 0.4 0.10 | 0.8 0.14 | 2.0 0.21 | 2.4 0.23 | 2.4 0.23 | 0.0 - | 0.0 - | 0.0 - | 0.0 - |
| Open dumping on the roadside | 1.4 0.18 | 0.7 0.13 | 0.0 - | 0.0 - | 0.6 0.12 | 0.5 0.11 | 5.5 0.35 | 0.0 - | 0.0 - | 0.0 - | 3.7 0.29 | 0.0 - | 0.0 - |
| Open dumping into ditches along the roadside | 1.4 0.18 | 0.1 0.05 | 0.0 - | 0.0 - | 0.2 0.07 | 0.0 - | 0.2 0.07 | 0.0 - | 0.0 - | 0.0 - | 0.0 - | 0.0 - | 0.0 - |
| Open dumping on abandoned lands | 0.7 0.13 | 0.9 0.14 | 0.2 0.07 | 0.0 - | 0.6 0.12 | 0.0 - | 0.9 0.14 | 5.7 0.35 | 0.0 - | 0.0 - | 0.0 - | 0.8 0.14 | 3.8 0.29 |
| Burial of solid waste in their property | 2.5 0.24 | 0.4 0.10 | 0.0 - | 0.0 - | 0.0 - | 0.0 - | 0.0 - | 0.0 - | 0.0 - | 0.0 - | 0.0 - | 0.5 0.11 | 1.9 0.21 |
| Burial of solid waste outside their property | 0.9 0.14 | 0.1 0.05 | 0.2 0.07 | 0.0 - | 0.0 - | 0.0 - | 0.0 - | 0.0 - | 0.0 - | 0.0 - | 0.0 - | 2.7 0.25 | 0.0 - |
| Disposal of solid waste into rivers/canals/swamps | 1.6 0.19 | 0.0 - | 0.0 - | 0.0 - | 0.0 - | 0.0 - | 0.0 - | 0.0 - | 0.0 - | 0.0 - | 0.0 - | 0.0 - | 4.4 0.31 |
| Segregation of some solid waste for sale | 0.4 0.10 | 2.0 0.21 | 4.4 0.31 | 91.8 0.42 | 84.9 0.55 | 81.7 0.59 | 5.5 0.35 | 4.8 0.33 | 2.4 0.23 | 10.6 0.47 | 62.7 0.74 | 66.2 0.72 | 27.4 0.68 |
| Segregation of hazardous waste to be disposed at the waste disposal sites provided by the LAOs | 0.0 - | 0.0 - | 0.0 - | 0.0 - | 0.0 - | 0.0 - | 0.0 - | 0.0 - | 0.0 - | 0.0 - | 0.0 - | 5.9 0.36 | 15.9 0.56 |
| Composting of solid waste | 1.2 0.17 | 0.0 - | 0.0 - | 0.0 - | 0.0 - | 0.0 - | 0.2 0.07 | 2.4 0.23 | 0.0 - | 0.0 - | 0.0 - | 0.0 - | 0.0 - |
| Segregation of solid waste for animal feed | 26.3 0.67 | 0.0 - | 0.0 - | 0.0 - | 0.0 - | 0.0 - | 0.0 - | 0.0 - | 0.0 - | 0.0 - | 0.0 - | 0.0 - | 0.0 - |
| Others | 0.0 - | 0.0 - | 0.0 - | 0.0 - | 0.5 0.07 | 0.0 - | 15.4 0.55 | 0.0 - | 0.0 - | 0.0 - | 0.0 - | 0.0 - | 0.0 - |
1 C1, Wet solid waste, plant scraps, vegetable scraps, and food waste; C2, Plastic bags, C3, Polyurethane foam waste and foam containers; C4, Plastic bottles and plastic products; C5, Papers, newspapers, and paper cartons; C6, Beverage cans; C7, Wooden pieces, branches, leaves, and grasses; C8, Wood, furniture, and wooden products; C9, Cloth remnants, clothes, and clothing products; C10, Rubbers and leathers; C11, Metals and steels; C12, Glass debris and glass bottles; and C13, Other waste such as torch batteries and light bulbs, percentage of standard error (S.E.) in italics.
Table 4.
The amount of air pollution emitted from household solid waste open burning.
| Solid Waste Management | Amount of Solid Waste Burnt (Mt/Year) | Greenhouse Gases (kt/year) | Air Pollutants (kt/year) | ||||||
|---|---|---|---|---|---|---|---|---|---|
| CO2 | CH4 | N2O | CO2e | CO | SO2 | NO | PM | ||
| Without LAOs’ collection and disposal services | 3.43 | 418.73 | 22.29 | 0.514 | 1046.4 | 86.4 | 1.0 | 6.2 | 16.5 |
| LAOs’ collection and disposal services | 0.66 | 80.44 | 4.28 | 0.099 | 201.0 | 16.6 | 0.2 | 1.2 | 3.2 |
| Total | 4.09 | 499.15 | 26.57 | 0.61 | 1247.3 | 103.0 | 1.2 | 7.4 | 19.6 |
© 2018 by the authors. Licensee MDPI, Basel, Switzerland. This article is an open access article distributed under the terms and conditions of the Creative Commons Attribution (CC BY) license (http://creativecommons.org/licenses/by/4.0/).
Share and Cite
MDPI and ACS Style
Pansuk, J.; Junpen, A.; Garivait, S. Assessment of Air Pollution from Household Solid Waste Open Burning in Thailand. Sustainability 2018, 10, 2553. https://doi.org/10.3390/su10072553
AMA Style
Pansuk J, Junpen A, Garivait S. Assessment of Air Pollution from Household Solid Waste Open Burning in Thailand. Sustainability. 2018; 10(7):2553. https://doi.org/10.3390/su10072553
Chicago/Turabian StylePansuk, Jirataya, Agapol Junpen, and Savitri Garivait. 2018. "Assessment of Air Pollution from Household Solid Waste Open Burning in Thailand" Sustainability 10, no. 7: 2553. https://doi.org/10.3390/su10072553
Note that from the first issue of 2016, this journal uses article numbers instead of page numbers. See further details here.