Design of a CRM Level and Performance Measurement Model


The Faculty of Operation and Economics of Transport and Communications, Department of Economics, University of Zilina, Univerzitna 1, 010 26 Zilina, Slovakia
*
Author to whom correspondence should be addressed.
Sustainability 2018, 10(7), 2567; https://doi.org/10.3390/su10072567
Submission received: 26 June 2018
/
Revised: 10 July 2018
/
Accepted: 17 July 2018
/
Published: 23 July 2018
(This article belongs to the Special Issue Foresight Methodologies in Field of Sustainability Analyses)
Abstract
:The main objective of the contribution is to create the CRM (Customer Relationship Management) level and performance measurement model. It is almost impossible to create an absolutely universal model. On the other hand, we can develop a model in a particular sector based on the most advanced CRACK method with nine key areas such as Brand management, Offer management, Classic marketing, Sales activities, Service and support activities, Logistics operations, Compliance with promised terms, Internet activities, Customer Support, and Complex indicators. The monitored criteria in the key areas were determined on the basis of an objective questionnaire survey conducted by the pharmaceutical industry on the B2B market in the Slovak Republic. One of the primary requirements for the construction of the model was to obtain information to help predict the future development of performance because only in this way can the company correct CRM activities. Based on the data acquisition methodology, we can evaluate the CRM level and performance measurement model not only as a current state indicator but also as a foresight with insight based on hindsight because companies that choose to get info from customers will want to get closer to the desired optimal values of the customers.
1. Introduction
The business environment is changing year by year. There is not only an increase in supply that largely exceeds demand, but also globalization of the competitive environment [1,2]. Each business entity is more or less influenced by its surroundings and, therefore, it is very important to be distinguished from others by not only focusing on product quality but also on the quality of customer relationship. At present, customer satisfaction is a prerequisite for prosperity in the business [3]. It can be achieved by being able to predict correctly and in a timely manner the trends and risks in the industry in which they are doing business and at the same time adapting to customer requirements. The most important factor in achieving and sustaining the success of an enterprise is through effectively solicitude and maintaining close customer relationships through customer relationship management [4,5]. Recent empirical studies have also demonstrated that there is a positive relationship between CRM practices and firm performance [6]. Business management identifies a CRM strategy for several years and actively uses it in conjunction with a technological background. The theoretical framework of CRM strategies is documented in many publications, yet not all businesses are able to fully exploit the CRM strategy and related systems and evaluate the success of this strategy or propose measures to improve and refine these strategies. According to surveys conducted in the Slovak republic, most businesses know the concept of customer relationship management, but only a very small percentage can well distinguish the difference between strategy and software. Survey results have also shown that only a very small percentage of Slovak businesses are engaged in measuring and evaluating CRM performance, which significantly affects the proper functioning of CRM in enterprises and may lead to under-utilization of the potential hidden in CRM [7]. In order to continuously improve our CRM strategy and improve customer relationships in companies, and thereby contribute to improving their business goals, we have decided to create the CRM level and performance measurement model. If we want to create a generalized model, we need to build on the content of the concept of CRM that is business strategy oriented. It is almost impossible to create an absolutely universal model that could be used in every situation and in every business. On the other hand, it is possible to CRM level and performance measurement model for companies in a particular sector that share certain specific features. The main objective of the contribution was to create the CRM level and performance measurement model in companies in the pharmaceutical sector in the B2B market in the Slovak Republic.
2. Literature Review
In general, there is no uniform CRM definition. Each author defines CRM in a different way, as follows. Customer Relationship Management is an interactive process designed to achieve an optimal balance between corporate investment and customer satisfaction. The optimum balance is determined by the maximum profit of both parties [8,9,10]. CRM is a set of tools that promote marketing, sales, and customer service in the company [11,12]. A prerequisite for supporting these features is the perfect customer knowledge that guarantees delivery of the product or service at the right time in the right place [13]. Customer Relationship Management includes employees, business processes and technologies (information systems and information and communication technologies) to maximize customer loyalty and, as a result, business profitability. It is part of the corporate strategy and becomes part of corporate culture [14]. Hung et al. treated CRM as a managerial strategy that helps organizations collect, analyze, and manage customer related information through the use of information technology tools and techniques in order to satisfy customer needs and establish a long-term and mutually beneficial relationship [15]. According to Reinartz et al., CRM is the systematic process to manage customer relationship initiation, maintenance, and termination across all customer contact points to maximize the value of the relationship portfolio [16]. CRM is a comprehensive business and marketing strategy that integrates technology, process, and all business activities around the customer [17]. Brown points out that CRM as the key competitive strategy you need to stay focused on the needs of your customers and to integrate a customer-facing approach throughout your organization [18].
In the current era of the digital world, the information technology has a great impact on business and the creation of a competitive advantage. CRM is currently widely supported by the development of information technology [19]. e-CRM is a strategic technology-centric relationship marketing business model, combining traditional CRM with e-business marketplace applications [20]. But enterprises, especially SMEs, are generally inclined to use traditional technologies instead of the updated ones, which are also cheap and easy to use [21]. They do not use the full potential of the new digital tools, and so are not deriving benefit from the opportunities they provide [22]. Kennedy according to Dzopalic notes that the internet can provide a platform for e-CRM initiatives that will help companies to develop and better manage customer relationships and improve and facilitate customer supplier relationships, as well [23]. Firms that have implemented fundamental e-CRM practices are reaping numerous benefits, ranging from superior customer service, improved profitability, sales, reduced operational costs, enlarged customer base and a broader market share [20].
Based on the above, we can state that Customer Relationship Management is an interactive process that aims primarily to create long-lasting and as far as possible mutually beneficial and valuable customer relationships. CRM is a process based on four interrelated and complementary elements, such as people, processes, technologies, and content.
Interaction by feedback, which informs us about functionality and performance, is an important part of CRM. At present, a large number of methods are used to measure the level of CRM and the associated satisfaction of customer needs. They are mostly based on questionnaire structures and final objective evaluation. The most well-known and most used ones are: CRM Maturity model, CRM ScoreCard, Model for evaluating the effectiveness of CRM by Kim, Suh, Hwang, Methodology of CRM measurement by Storback a Lehtinen, CRM BodyCheck method, and CRACK method [8,24,25,26,27,28,29]. Chlebovsky states that there are six key reasons to explain the merits of CRM performance quantification:
- Measurement leads to a better strategy refinement and increased trust in the strategy between employees. The strategy should be redrafted not only at the level of CRM but also at a whole level.
- Measurement allows unification of communication about strategy and key CRM factors.
- Measurement increases employee loyalty and identification with enterprise strategy and goals.
- Measurement increases the share of successful changes. There are various business changes that are more likely to succeed after successful CRM implementation.
- Measurement increases possibilities and capabilities to predict problems.
- Measurement simplifies to monitor the continuous impact of changes on individual business segments [28].
At the microeconomic level, there are a large number of traditional measurement methods in the area of financial indicators [30,31]. Negatives of such models are their monitoring of past events without the possibility of looking ahead. It is also important to note that when measuring the level of CRM, an enterprise can not only focus on customer behavior and attitudes but must also focus on internal processes and activities that are completing and related to customer behavior [32,33,34]. The design of the CRM level and performance measurement model must always be based on the corporate structure and take into account its baseline characteristics. As well as creating a CRM strategy, the CRM level model must also be based on good knowledge of the current state of the business. If we have sufficient CRM data, we can create a specific model.
3. Materials and Methods
In order to meet the goal of the work, we conducted a marketing survey in selected B2B market in the Slovak Republic, which was realized in the period April to November 2016. In the first phase of the research, a method of selecting a suitable sample, sample size, appropriate methods and survey tools was then established. The choice of the target group of respondents is an important step for successful marketing research. It is necessary to decide who will be the ultimate target entity. We defined the target group of respondents as business owners, business management, or marketing department representatives who have the information needed for the survey. The population size was based on data obtained from the Statistical Office of the Slovak Republic. The population consisted of economic entities classified according to the SK NACE Classification of Economic Activities into the following groups: 21100—Manufacture of basic pharmaceutical products, 21200—Manufacture of pharmaceutical preparations and 46460—Wholesale of pharmaceutical goods. We consider all companies in these groups as pharmaceutical companies. From the point of view of their product portfolio, they correspond to the basic attributes of businesses operating on the B2B market. The population size was 410 companies. The size of the research sample is determined on the basis of a formula that defined Chraska according to Nowak [35]. The confidence level was set at 95% confidence interval at 5%, According to Durica and Svabova, a confidence level of 95% is sufficient for a conjoint analysis, because it belongs to the set of multivariate methods and also combines data on preferences in a deeper context than the standard methods on preference detection do [36]. The confidence interval determines the margin of error we tolerate within the marketing research and the rate is based on current trends in marketing research [37]. So that the needed sample size is 199 companies. The choice of method for data collection depends on the information needs, as well as the budget, availability of resources and timetable. For the purposes of this research, we chose the method of collecting data through a questionnaire, even though we are aware of its shortcomings as time-consuming and low returns.
The questionnaire was divided into three parts. The first part focuses on defining the size of the business in terms of average annual turnover, and also depending on the number of employees and the lifetime of the company. The population is comprised of pharmaceutical B2B businesses in the Slovak Republic, so we did not consider any further identification data as necessary. The final question of the first part of the questionnaire was decisive for the next procedure in the questionnaire.
If companies responded positively to the question about using CRM in the company, they were only concerned with the second part of the questionnaire. This was comprised of questions to determine the level of CRM usage in enterprises, and the answers of which were important for compiling a CRM level and performance measurement model. If companies responded negatively, a third part of the questionnaire followed, which consisted of the questions needed to build a CRM level and performance measurement model as well.
4. Results
The monitored criteria for the CRM level and performance measurement model were determined on the basis of an objective questionnaire survey conducted in the pharmaceutical industry on the B2B market in the Slovak Republic. We defined six criteria (options) in each of nine key area and the last option was always appropriate for those businesses that do not consider any criterion to be relevant. Criteria and key areas are listed in Table 1.
199 respondents answered questions about the criteria that the selected businesses monitor or consider important to monitor. Respondents could identify more than one criterion, or they could indicate that none of the criteria considered important. The choice of criteria was based on the widely used CRACK model, which, as Chlebovsky states, is generally considered important in terms of customer relationship management [28]. In addition to looking at the frequency of responses to the criteria (Table 2), we also identified the importance of individual key areas in order to objectify the weights of each criterion. In the final model, we have selected seven areas that have a high abundance compared to Brand Management and Customer Support/Call Center. These areas have a very low frequency compared to the other, which means that the respondents considered them as very little relevant to their business.
Subsequent to the detection of the number of occurrences of the individual criteria, we selected three the most numerous criteria from each of the seven areas. Selected criteria are in the Table 3.
Qualitative calculation of the weights of the selected variables is an important step in the creation of a specific model of the CRM level measurement. For the purpose of excluding subjectivity in the weighting process, we determined the number of these variables on a sample of 199 enterprises, which ensured the objectification of values. There are several approaches to model the preferences between the criteria. According to Kliestik, the method of quantitative pairing of criteria is one of the most widely used [38].
In the case of pairing of criteria S = (sij), i, j = 1, 2, 3,..., n we use the scale, in which 1 means equivalent criteria i and j; 3 means slightly preferred criterion i before j; 5 means strongly preferred criterion i before j; 7 means very strongly preferred criterion i before j and 9 means absolutely preferred criterion i before j. Values 2, 4, 6, 8 are intermediate. The elements of the matrix sij are interpreted as estimates of the weight ratio of the i-th and j-th criteria [38].
this matrix is referred to as Saaty matrix, the following applies to its elements:
Saaty suggested using a custom vector corresponding to the largest custom number of the matrix to estimate the weight, while the solution is the normalized geometric mean of matrix. Based on the following relationship, we can calculate the weight of the i-th criterion.
the values of the Saaty matrix were obtained on the basis of a questionnaire survey, from which we obtained the number of occurrences of answers for each criterion. Based on these frequencies, we have defined preferences between criteria.
sij ≈ vi/vj i,j = 1,2,3,…,n,
sii = 1 i = 1,2,3,…,n,
sji = 1/sij i,j = 1,2,3,…,n,
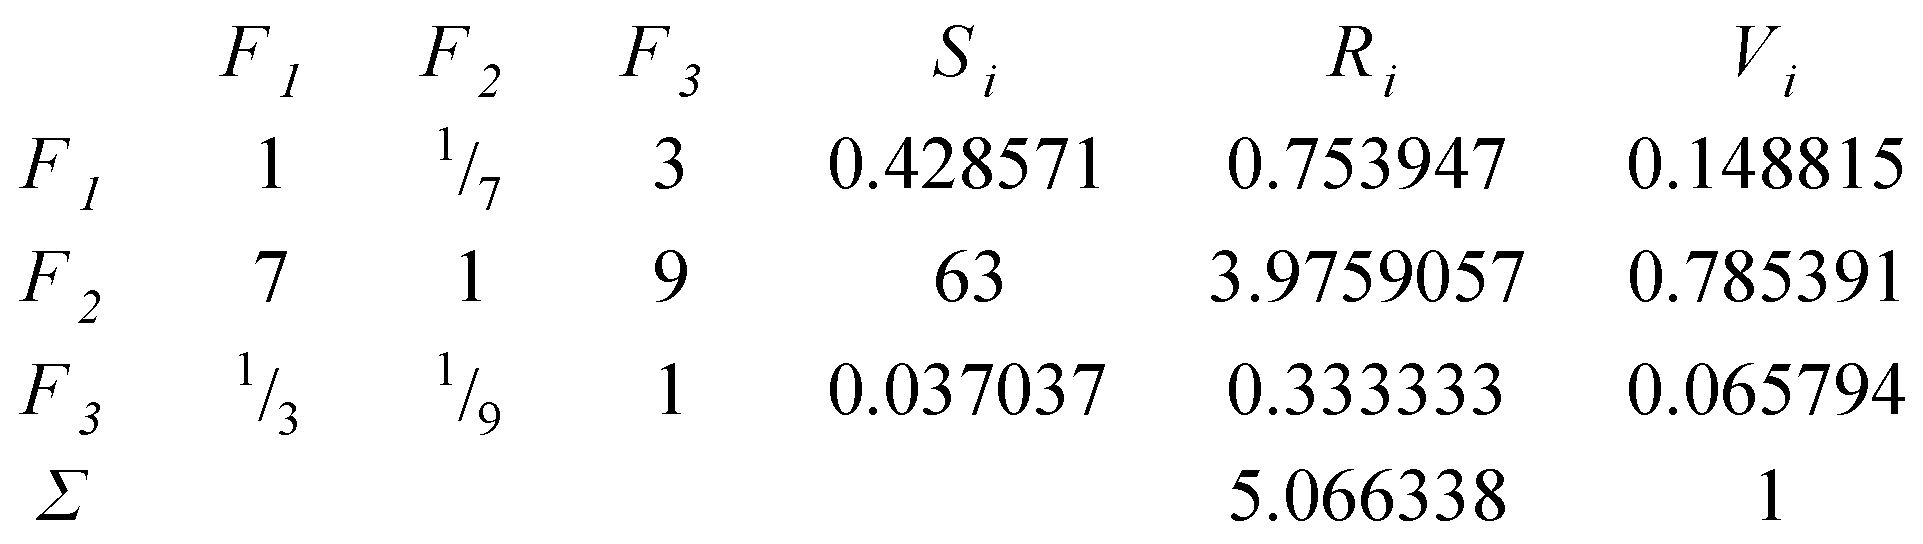
For the Offer management area, we have selected these three criteria F1 Customer loyalty with multiplicity 89, F2 Customer satisfaction with multiplicity 132 and F3 Value of products for customers with multiplicity 79. Based on the theoretical knowledge the criterion F1 is slightly preferred before F3 (s1,3 = 3), criterion F2 is absolutely preferred before F3 (s2,3 = 9). When comparing the criteria F1 and F2, it is a very strongly preferred criterion, but we have to compare them opposite, and thus the situation arises that criterion F2 is very strongly preferred before F1 (s1,2 = 1/7 and s2,1 = 7). Similarly, the preference was also given to other criteria within the surveyed areas. Preference for other criteria within the monitored areas was determined in a similar way.
After determining the preferences, we can create a Saaty matrix for the Offer Management area. To simplify the weight calculation, we divided it into three partial parts. At the beginning we calculated the value of Si according to the following relation:
this value represents the multiplication of all elements in the i-th line of the matrix. Subsequently, we have quantified the value of Ri, based on the relationship:
we then calculated the weight of criteria:
where n is the number of criteria.
Ri = 〖(Si)〗^(1⁄n),
The following matrix (Figure 1) contains the calculation of the weights of criteria in Offer management area. The sum of the weight must always be 1. The weight of the criterion F1 Customer is 0.148815, the weight of F2 Customer satisfaction is 0.785391 and the weight of F3 Value of products for customers is 0.065794.
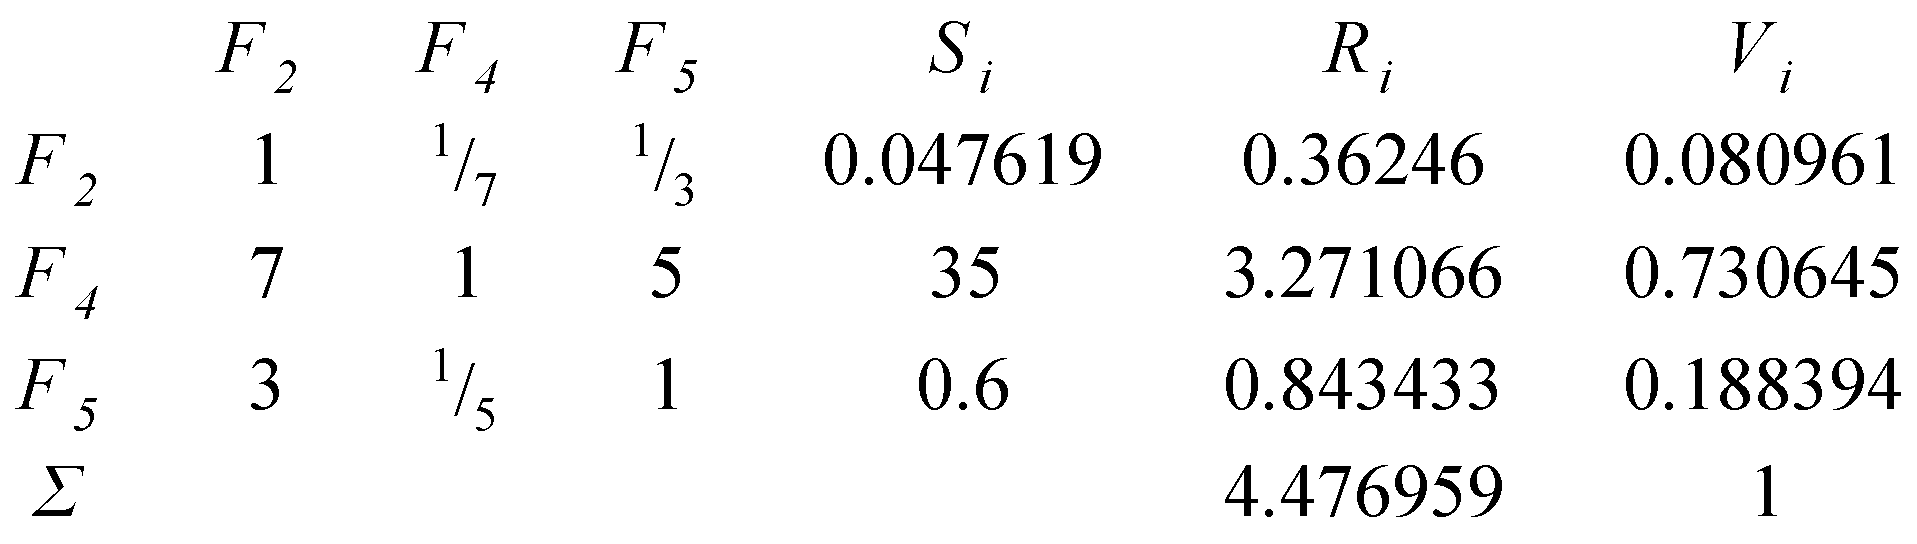
The Figure 2 shows that the Classic marketing area consists of criteria F2 Campaign reach with the weight 0.080961, F4 Cost of getting a new customer with the weight 0.730645 and F5 Average order size with the weight 0.188394.
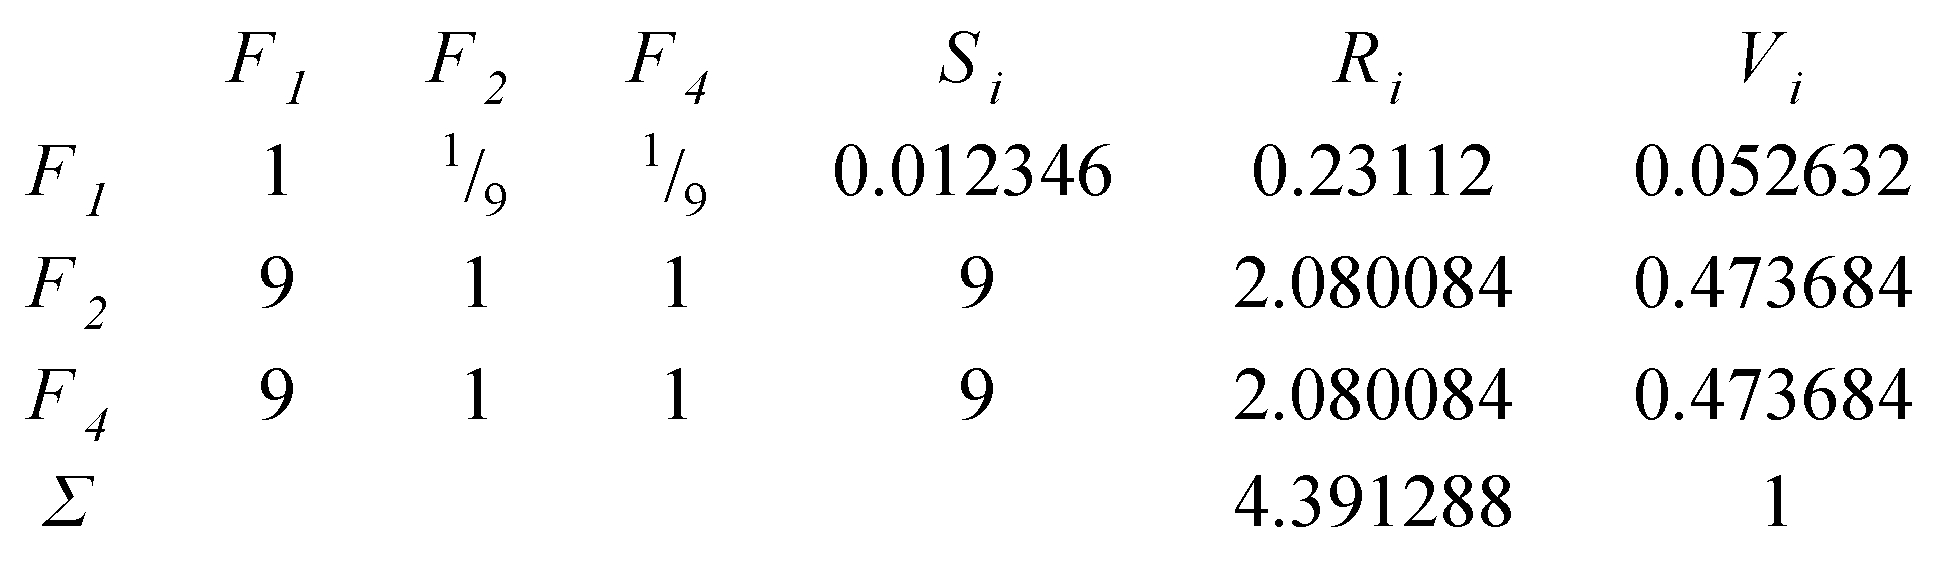
The Figure 3 shows that the Sales activities area consists of criteria F1 Likelihood of success with the weight 0.052632, F2 Sales costs with the weight 0.473684 and F4 Sales results with the weight 0.473684.
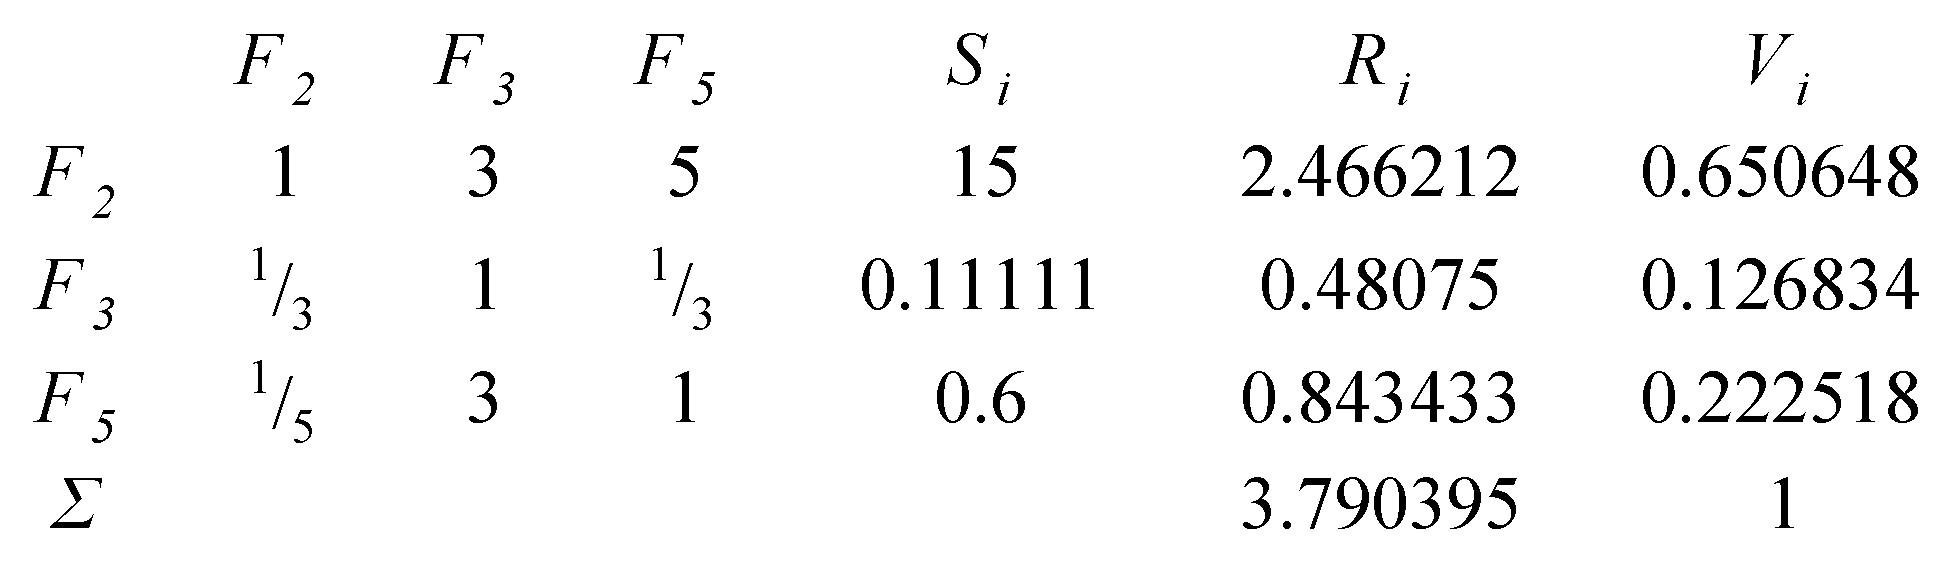
The Figure 4 shows that the Service and support activities area consists of criteria F2 Time of service operation with the weight 0.650648, F3 Customer satisfaction with service with the weight 0.126834 and F5 Communication with customers during the warranty period with the weight 0.222518.
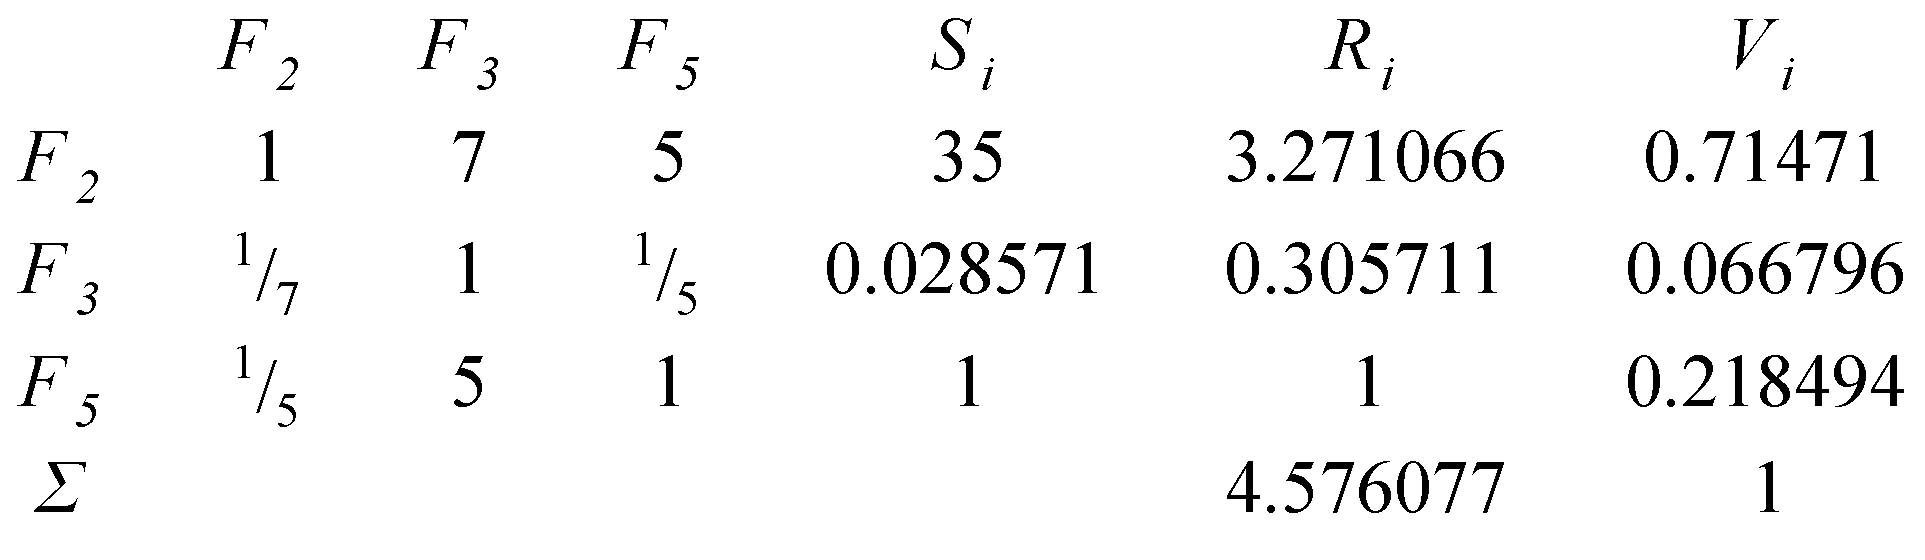
The Figure 5 shows that the Logistics operations area consists of criteria F2 Compliance with the required terms with the weight 0.71471, F3 Compliance with promised terms with the weight 0.066796 and F5 Reliability of the process with the weight 0.218494.
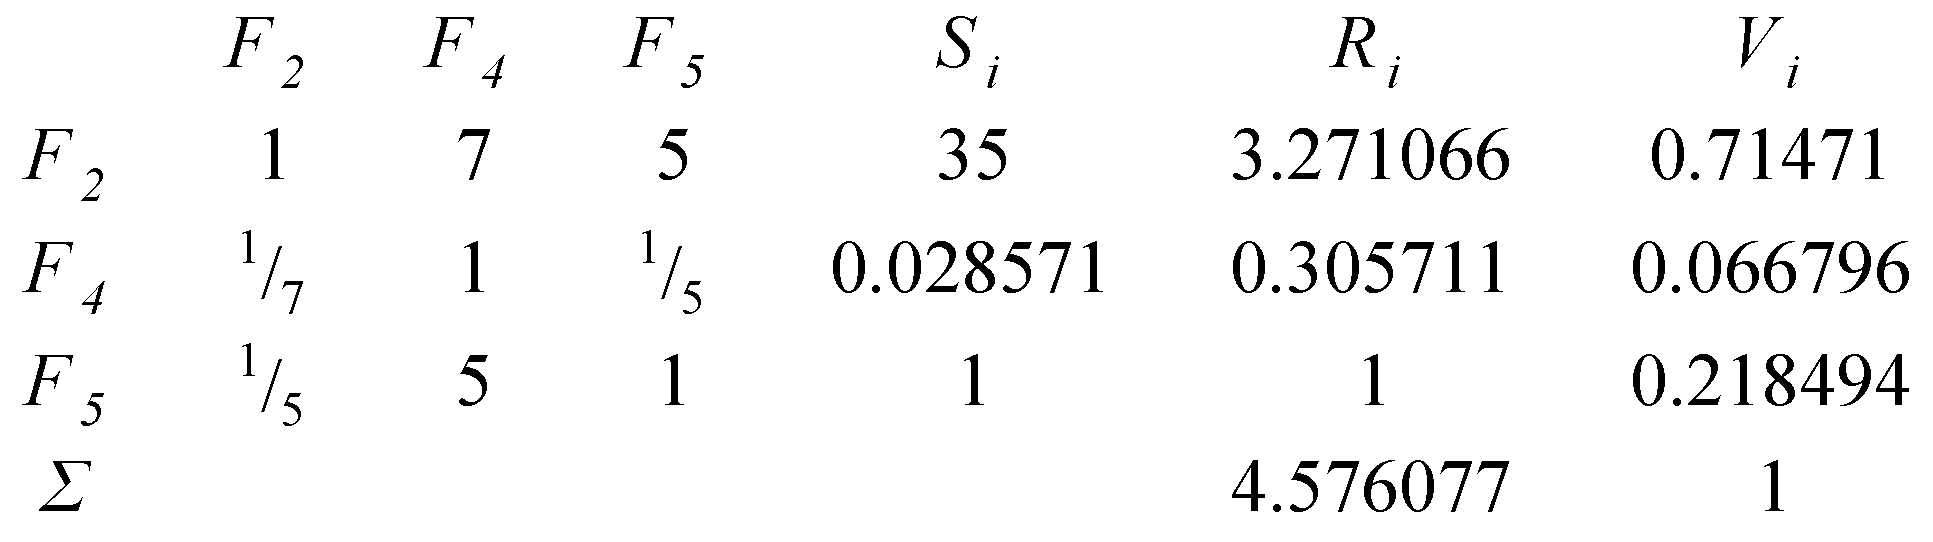
The Figure 6 shows that the Internet activities area consists of criteria F2 Number of total visitors with the weight 0.71471, F4 Number of registered users with the weight 0.066796 and F5 Average time spent on a website with the weight 0.218494.
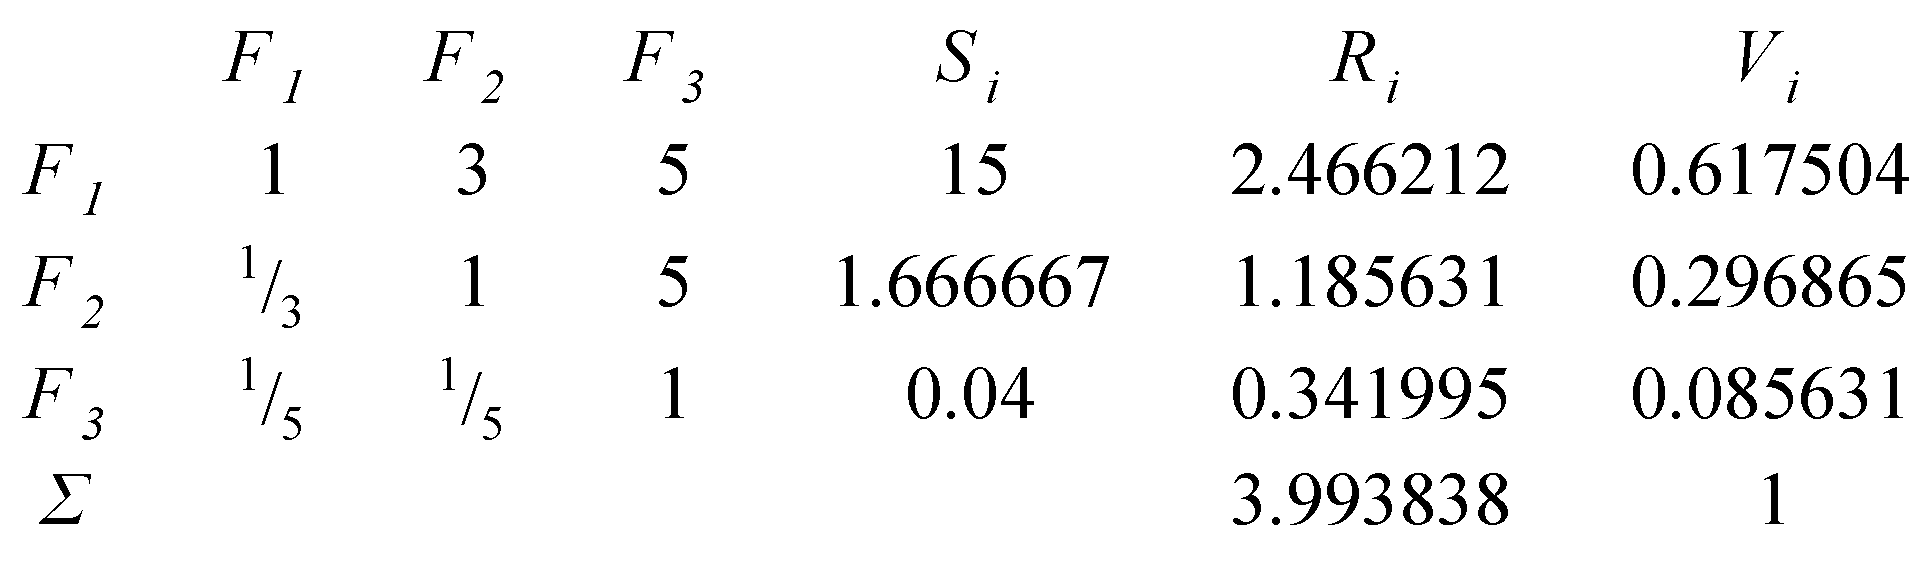
The Figure 7 shows that the Complex indicators area consists of criteria F1 Perspective of long-term relationships with the weight 0.617504, F2 Overall satisfaction with the business with the weight 0.296865 and F3 Detection of customer satisfaction with the weight 0.085631.
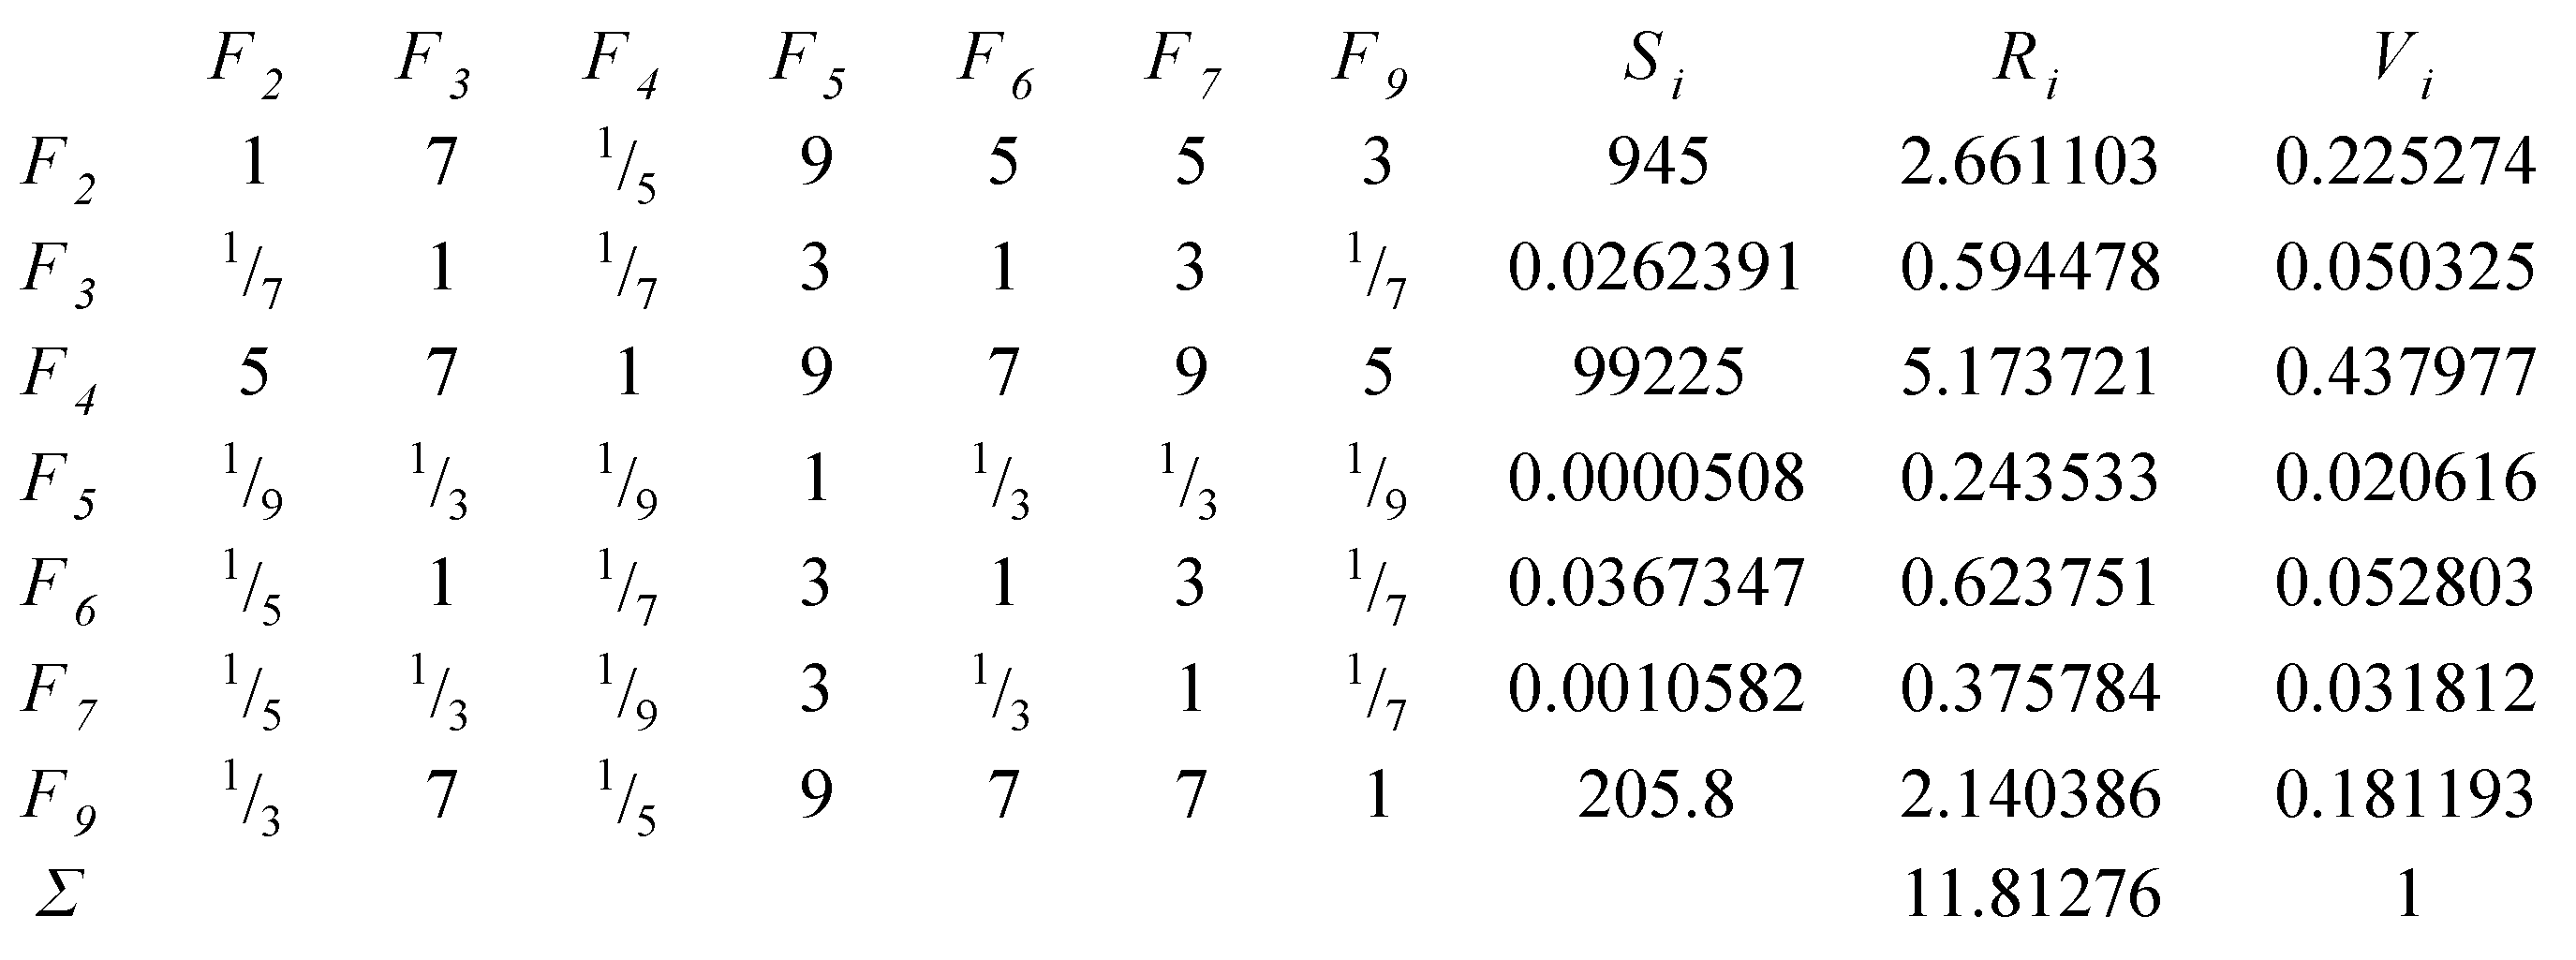
In order to objectify the obtained weights, we also asked in the questionnaire which areas of monitoring are considered to be important by enterprises. Based on the search, we found that Brand Management area and Customer Support/Call Center area businesses do not consider important to monitor. The order of preference for the areas was determined in the same way as for the criteria in the Offer management area. When calculating weights, we proceeded similarly to the previous sections. Below in Figure 8 is the resulting Saaty matrix with the calculated weights of each area.
Consequently, we have made the calculation of the objectified weights of each criterion based on the multiplication of weight of the areas and the criteria. The resulting weights are shown in the Table 4.
After defining the weights of criteria, we can proceed with the creation of the CRM level and performance measurement model for companies in the pharmaceutical industry on the B2B market in the Slovak Republic. For successful creation and implementation of the CRM level and performance measurement model, it is necessary to obtain information about the current state of CRM functionality in the enterprise. Typically, this information can be obtained at two levels, both corporate and customer. Within the selected criteria that enterprises identified as important in the questionnaire survey, we designed two questionnaires that contain questions about selected criteria. The first questionnaire was created for CRM assessment from the point of view of the employees of the company, respectively enterprise management. And the second one enables an enterprise to assess the level of CRM from the point of view of its customers, respectively business partners. The Table 5 lists the questions that are included in the questionnaires about CRM assessment from a company’s perspective and from a customer’s perspective as well.
The questionnaires were prepared in a generalized form so they could be used by any enterprise from a basic sample of pharmaceutical companies in the B2B market in the Slovak Republic. A company can individually decide whether to measure the level and performance of CRM from the company’s or customer’s point of view or determine the level of CRM at both levels and compare each other. The questions were in Likert scale form, using two types of responses ranging from 0 to 10 (0—the lowest level, volume, time, etc. and 10—the highest level, volume or time). The second alternative was the range from 0 to 100 in this case it was a percentage of the performance of the criterion). Each respondent, whether from a questionnaire addressed to an employee or a customer, answered the question of what the true level of execution of the criterion is and what, in their opinion should be the optimal level of execution of the criterion. On the basis of such data, we will be able to clearly define what the level and performance of CRM in a given enterprise at present is, and what should be the optimal level of CRM by the target group.
One of the primary requirements for the construction of the model was to obtain information to help predict future development of performance, because only in this way the company can correct CRM activities. The requirement emerges from the fact that some of the methods used to measure the level of CRM are focused on financial indicators and do not focus on qualitative indicators. Measuring financial ratios makes it possible to assess past developments, but customer relationship measurement methods can also predict trends in future developments [7,39]. Prognosis of the next period’s development is an indicator that can significantly affect important decisions and business strategy. Based on the data acquisition methodology, we can evaluate the CRM level and performance measurement model not only as a current state indicator but also as a foresight with insight based on hindsight because businesses that choose to get info from customers will want to get closer to the desired optimal values of the customers. And only through cooperation, consensus and mutual communication is it possible to maintain sustainable development.
5. Discussion
To confirm the usability of our model in practice, we have decided to cooperate with the selected company in the pharmaceutical industry on the B2B market in the Slovak Republic. The company agreed to cooperate without giving its name. From the point of view of annual turnover, the enterprise is classified as a medium-sized enterprise and is also classified as a medium-sized enterprise from the point of view of number of employees. It has been operating since 1994. The company has applied the CRM strategy for seven years and regularly surveys the satisfaction of its customers through a questionnaire survey. So far, company management has not deal with the possibility of measuring the level and performance of CRM. Company management has decided to apply a CRM level and performance measurement model to an enterprise, respectively to representatives of the five departments and then also to their customers. For this purpose, we created a Google Docs questionnaire that can be used by all businesses in the pharmaceutical industry on the B2B market and can be used simply by sending a link to the questionnaire by email to their employees. Each enterprise of can choose the number of employees who will form a sample of respondents to determine the level of CRM. If the criterion of the number of respondents needed to find the CRM level is met, we can export the results of the questionnaire survey in xslx format. The first column of the file contains a question that was posed to respondents, other columns contain the answers of respondents. The first numerical data denotes the actual fulfillment of the selected criteria in the opinion of the business representatives. The second numerical data indicates the optimum level of compliance, in our case the minimum level required by the business. In our surveyed company, five representatives of the company participated in the questionnaire survey. The decision on the number of respondents was the responsibility of the company. For optimal data processing and comparability of criteria, we have transformed the answers formatted 0–10 to percentages from 0 to 100%. Some of the monitored criteria have minimization character. This means that the goal was to achieve the smallest possible value. According to Chlebovsky [22], we adjusted these values using the following formula:
Valuemax = [(max − min) − value] × 100/(max − min).
We used this transformation for the following criteria: What are the average costs for getting a new partner? What is the level of sales costs? What is the average time of service operation? What percentage of errors occur in logistic processes? From the values obtained on the basis of the arithmetic mean, we obtain the final value for each criterion within the actually achieved values and the optimal values as well. Theoretically, the ideal state would be if the criteria had 100% value. Each respondent was able to comment on each criterion, and their assessment of fulfillment of the criteria was equivalent, as the departments work closely together to satisfy customers. We multiplied the resulting values of the criteria with the weight of each criterion, the sum of these multiplications is percentage level and performance of the CRM. We have obtained the actual and optimal values of each monitored criterion as well as the values of the overall actual and optimal level and performance of CRM from the enterprise perspective. By comparing the obtained data, we will conclude that certain reserves exist in the selected criteria, which the company could even optimize, respectively improved.
For successful operation of CRM, the enterprise must also seek the opinion of its customers, because customers are the most important article of the company. When calculating the level and performance of CRM from a customer perspective, we used a similar approach. We created a questionnaire that consisted of questions of the same nature that were addressed to business customers. In this case, the questionnaire can also be used for all companies of the selected pharmaceutical industry on the B2B market in the Slovak Republic. The company sent a questionnaire to the ten key customers in terms of sales volume over the last five years. In the questionnaire, we again determine the actual rate of fulfillment of each criterion, as well optimal performance level from the perspective of customers. We can export the results of the questionnaire survey in xslx format. The file contains questions that was posed to respondents and columns of the answers of respondents. The first numeric data represents the actual rate of fulfillment of the criteria and the second optimal level of fulfillment of the criteria. We processed the data in the same way as in CRM level and performance measurement model from the enterprise perspective. The weights of the individual criteria are the same. The minimization criteria were as follows: What was, in your opinion, the amount of costs our company has spent in gaining you as a customer? What is, in your opinion, the height of the sales costs of our company? What was the average time of service operation? What percentage of errors in logistics processes did you register when trading with our company? By this process we have obtained the actual and optimal values of each monitored criterion as well as the values of the overall actual and optimal level and performance of CRM from the customer perspective.
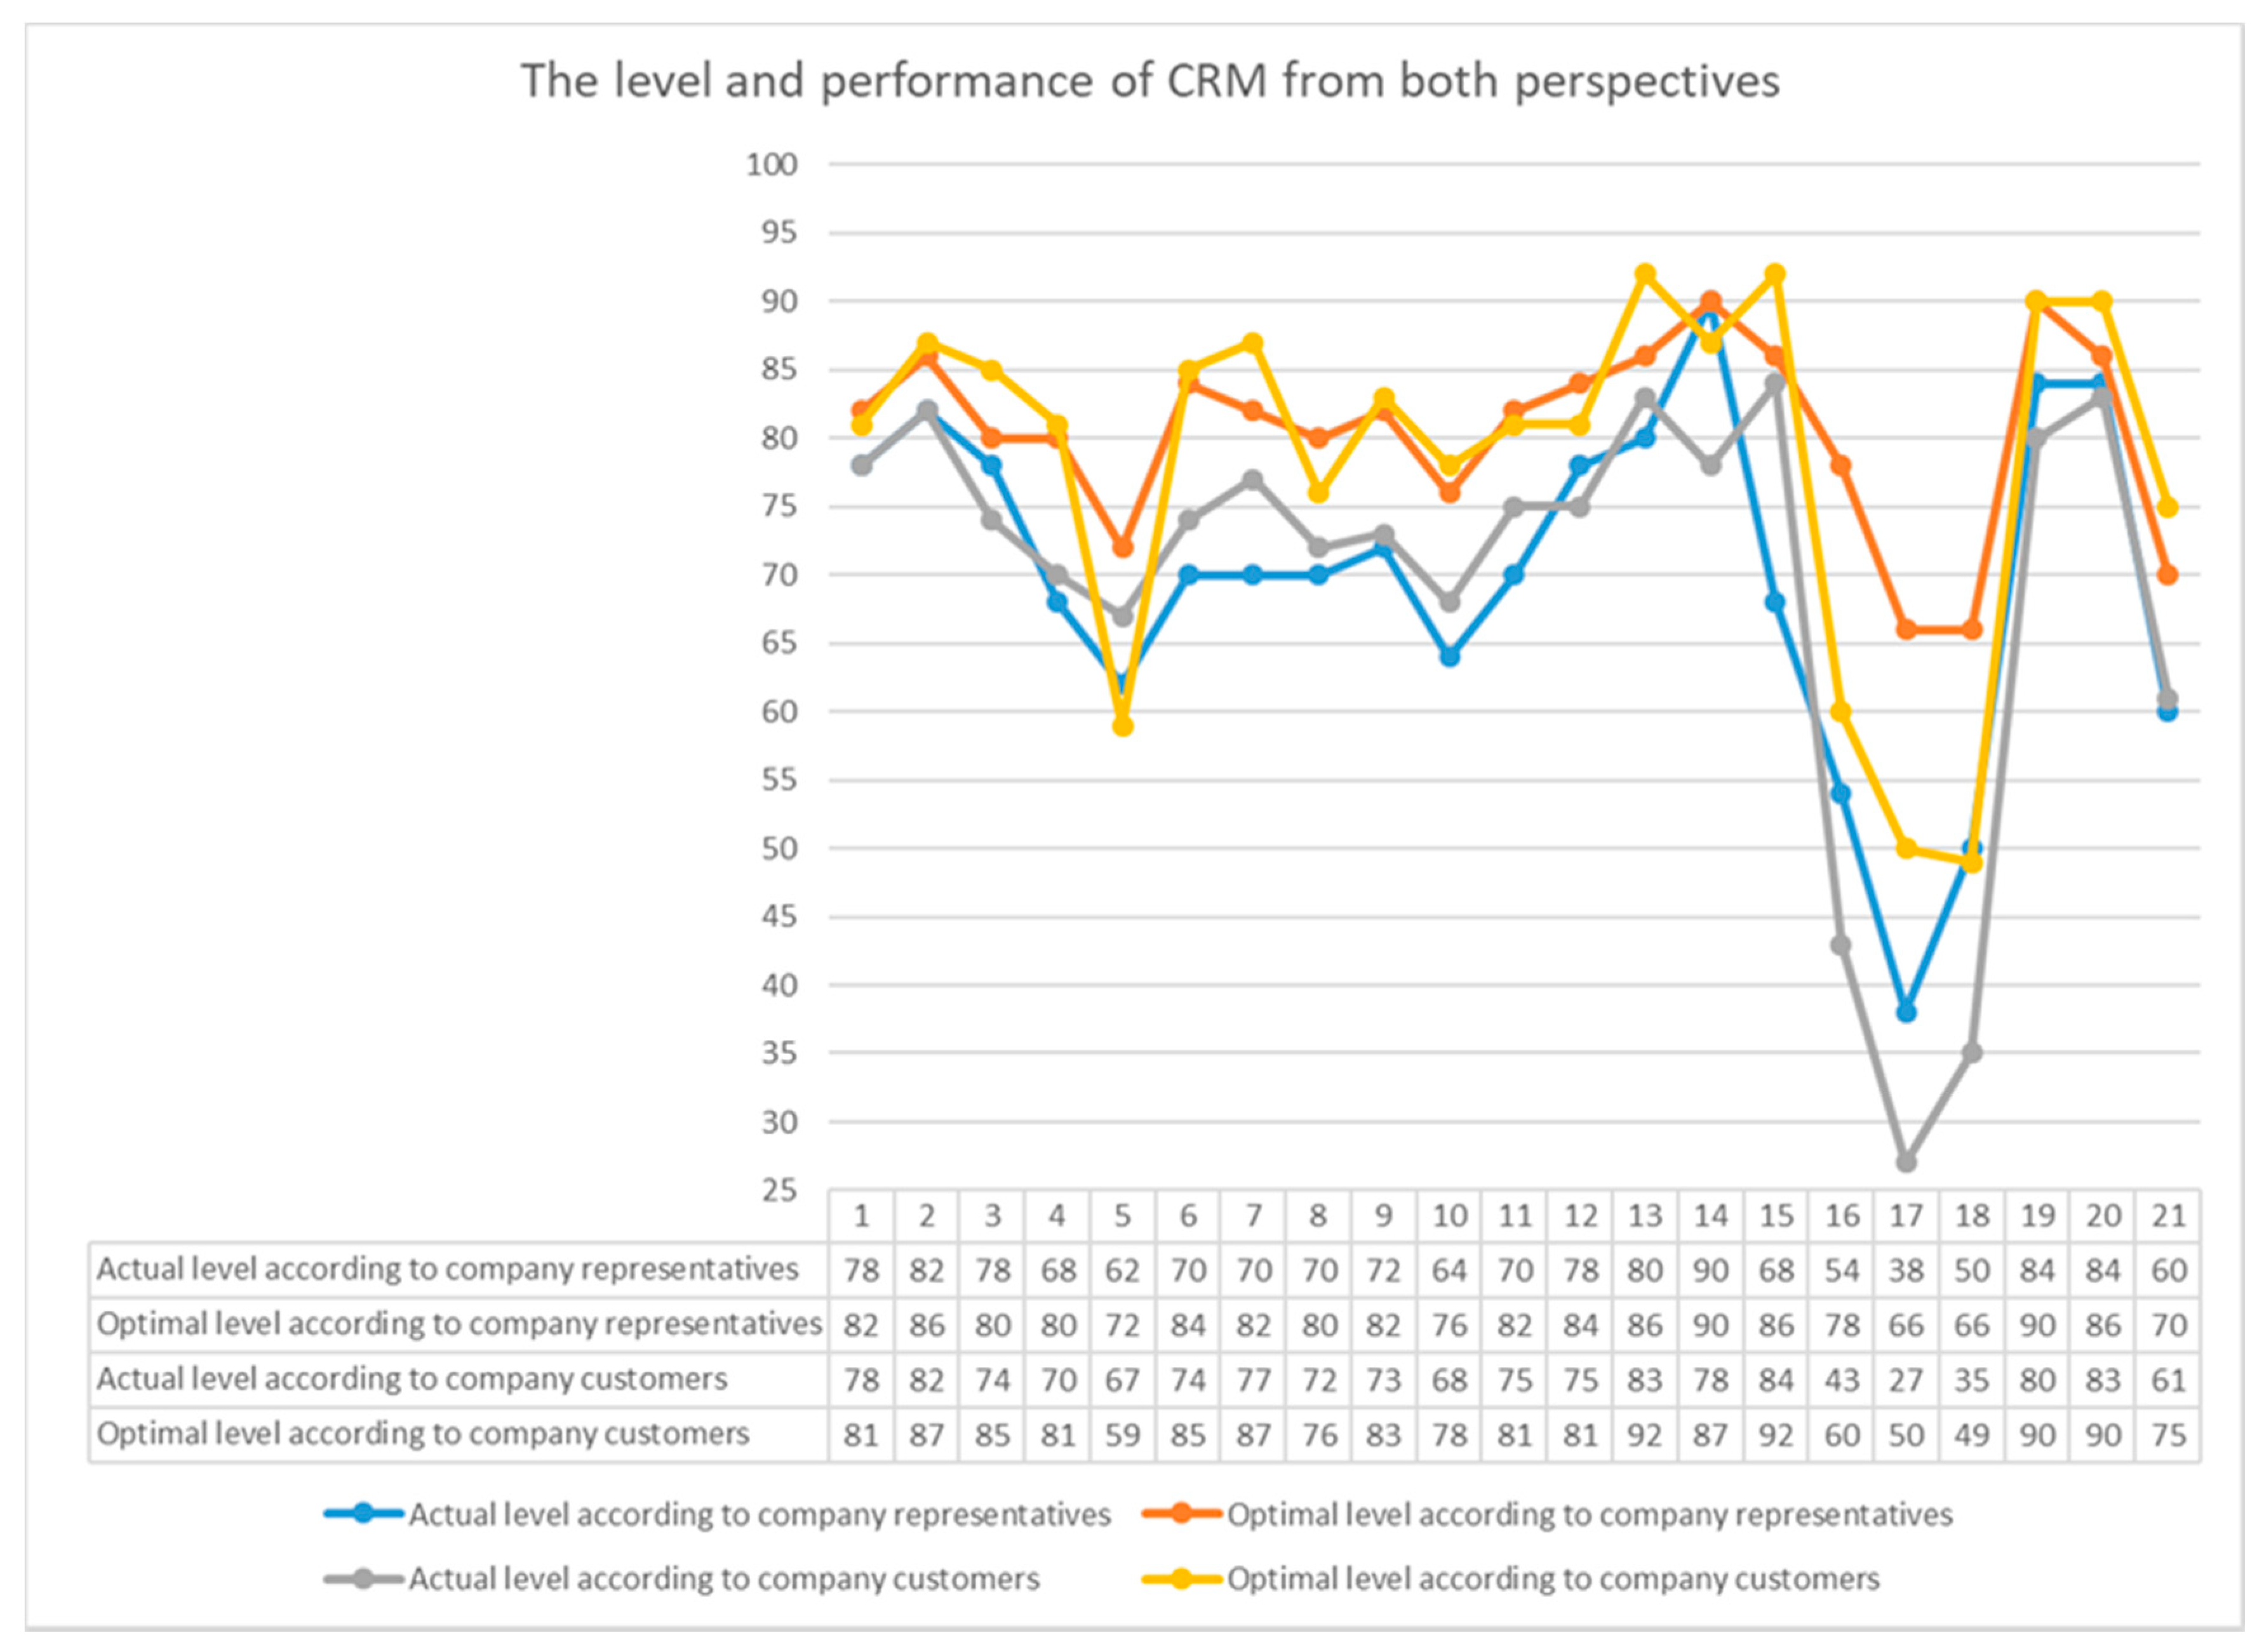
Based on the company’s request, we have compared the level and performance of CRM from both perspectives. Because of up to 21 evaluated criteria in our model, we have created only summary graph that compares the actual values of the criteria according to both company and customers, and the optimal values that the individual criteria should achieve from both perspectives as well. Below the graph are also given the numeric data of the fulfillment of individual criteria at actual and optimal level. As can be seen from the Figure 9, the opinion of the customers of the company and of the company representatives on the fulfillment of individual criteria develops in the same direction. Neither criterion develops in the opposite direction.
At the end of the comparison, we are making a direct comparison of the overall CRM levels and performance of all reviewed views. In the company’s view, the total optimum CRM should be 3.86% lower than the optimum level according to customers. This finding implies that the company should re-evaluate its maxima that it wants to achieve in its customer relationship, as customers expect to take greater care of their needs and requirements as the company plans to provide. Based on the above results, we can also say that compared to customers, the company evaluates its total performance of CRM better by 1.48%. This difference is not very large, but it also refers to an overestimation of CRM performance from a company perspective versus perceptions of the customer.
6. Conclusions
The results of an empirical survey show which areas the company has underestimated so far and do not give them the attention that customers and business representatives would require for selected criteria. From this, we can deduce managerial implications for practice. The company has the largest reserves in the field of Internet activities, while the actual levels are lower both from the point of view of the company and the customers in all three criteria (Number of total visitors, Number of registered users, Average time spent on a website). Customers see even greater reserves in this area as the company itself and it is, therefore, necessary to solve the situation. The company must re-edit its website and all Internet activities. The second area in which the business does not reach the results that the customers and representatives of the business considered as optimal is Classic marketing. Criterion Campaign reach is actually lower by more than 10 percentage points compared to the optimal value it should reach from the point of view of the company and the customers as well. The same value is reached in the Average order size criterion. Business management should focus on the wider reach of campaigns, because it is currently at an average level. Customers, respectively business partners would also welcome greater effort, creativity and the ability to engage in marketing activities in the field of classical marketing. The company assures a broad customer portfolio by its offer, but its communication skills, whether in the field of classic marketing or its online forms, lags far behind current trends, what is largely perceived by its customers. In other areas, an enterprise has reached a balanced value. From all the above, it is clear that the company must, first of all, make a marketing communication more effective. It has shortcomings in both its offline and online form. The company must pay more attention to the online marketing communication, which is at present perceived as the weak side of company marketing mix by not only the company itself but also by its business partners.
The results clearly show which tool of marketing mix an enterprise should target and at which it achieves the minimum required level from both perspectives. Since the use of this model can be tedious and unclear for businesses, which is a limitation of our research, we have decided to create a standalone software application. The software application was created based on the algorithm proposed in the previous chapters. Before using the software application, it is essential to send and receive questionnaire replies. Business or customer responses provide an insight into the current level and performance of CRM. If we have this data, we can access the application itself. Its use is described in the following steps. After running the application, we can specify the input data needed to calculate the actual and optimal CRM level. We enter this information via the Questionnaire—Company and Questionnaire—Customer icon. We can select these data from the Input subfolder. The application can work with the results of the questionnaire survey from both the company and the customer perspective, both jointly and individually. If we have entered input data, we can proceed to the calculation using the Run Calculation icon. Once the calculation is done, the app will display the Actual and Optimal CRM level from the enterprise perspective—1st value and from the customer’s perspective—2nd value. For greater clarity, the application uses the tool of the graphical user interface, namely tooltip. The application also includes a graphical view of the level of the criteria at the bottom of the application. The graph also uses the tooltip function to find out the level of fulfillment of the individual criteria that represent the x axis and their total number is twenty-one in a total of seven areas. The criteria names are located in the window above the chart and it is possible to be scrolled between them. The main application graph shows all the criteria, but the number of criteria can adversely affect transparency and evaluation of the fulfillment of individual criteria. For this reason, the application also includes the ability to display partial graphs for each area. Each area then contains three criteria and the results are more transparent. The criteria are re-depicted on the x-axis, they have a numeric designation, and in the window above the chart you can see namely the criteria. Even in this case, we can easily find out the level of fulfillment of each criterion through the tooltip. Usage of the application is relatively simple and we have tested it with the selected company, which basic characteristics are mentioned in the previous chapter. We tested the application based on data from questionnaire surveys for employees and company customers. Based on the results obtained through the software application, it was possible to identify the areas and criteria in which an enterprise achieves low performance rates. The CRM level and performance measurement results show areas underestimated by the company so far and it does not give them the attention that customers and company representatives require for selected criteria. From this, the company can then predict future development of performance, because only in this way the company can correct CRM activities.
Further limitations of the proposed model stem from the fact that it is not possible to create a generalized model but only a CRM level and performance measurement model for companies in a particular sector that share certain specific features. The model is primarily intended for companies in the pharmaceutical sector in the B2B market in the Slovak Republic. However, its calculation methodology is applicable to other industries in all countries as well. The limitations of the model point towards issues to be addressed in the future, such as identifying the importance of individual key areas in order to objectify the weights of each criterion in further empirical research.
Author Contributions
A.K. and L.G. conceived and designed the experiments; L.G. and M.N. performed the experiments and analyzed the data; A.K. and L.G. wrote the paper.
Acknowledgments
This contribution is a partial output of the project APVV-15-0505: Integrated Model of Management Support for Building and Managing the Brand Value in the Specific Conditions of the Slovak Republic.
Conflicts of Interest
The authors declare no conflict of interest.
References
- Sadaf, R.; Olah, J.; Popp, J.; Mate, D. An investigation of the influence of the worldwide governance and competitiveness on accounting fraud cases: A cross-country perspective. Sustainability 2018, 10, 588. [Google Scholar] [CrossRef]
- Syaglova, V.Y. Influence of the marketing paradigm’s cycles patterns on the global entrepreneurship. Econ. Manag. Spectrum 2017, 11, 48–61. [Google Scholar]
- Machan, T.R. Stakeholder vs. shareholder debate: Some skeptical reflections. Contemp. Read. Law Soc. Justice 2017, 9, 7–13. [Google Scholar]
- Kasych, A.; Vochozka, M. Theoretical and methodical principles of managing enterprise sustainable development. Market. Manag. Innovat. 2017, 2, 298–305. [Google Scholar] [CrossRef]
- Kliestik, T.; Misankova, M.; Valaskova, K.; Svabova, L. Bankruptcy prevention: new effort to reflect on legal and social changes. Sci. Eng. Ethics 2018, 24, 791–803. [Google Scholar] [CrossRef] [PubMed]
- Aheame, M.; Hughes, D.E.; Schillewart, N. Why sales reps should welcome information technology: Measuring the impact of CRM-based IT on sales effectiveness. Int. J. Res. Market. 2007, 24, 336–349. [Google Scholar] [CrossRef]
- Masarova, G. Marketingova Strategia Podiku v Oblasti B2B so Zameraním na CRM. Ph.D. Thesis, University of Zilina, Zilina, Slovakia, April 2015. [Google Scholar]
- Storbacka, K.; Lehtinen, J. Řízení Vztahú se Zákazníky: Customer Relationship Management, 1st ed.; Grada Publishing: Praha, Czech Republic, 2002; p. 167. ISBN 80-7169-813-X. [Google Scholar]
- Czubała, A. Corporate Social Responsibility in marketing. For. Scien. Oecon. 2016, 4, 103–111. [Google Scholar]
- Chwistecka-Dudek, H. Corporate Social Responsibility: Supporters vs. opponents of the concept. For. Scien. Oecon. 2016, 4, 171–180. [Google Scholar]
- Braciníková, V.; Matušínská, K. Marketing mix of financial services from the customers perspective. For. Scien. Oecon. 2017, 5, 35–48. [Google Scholar]
- Musova, Z. Social responsibility in company marketing activities. Econ. Manag. Spectrum 2016, 10, 12–23. [Google Scholar]
- Wesling, H. Aktívni Vztah k Zákazníkum Pomocí CRM, 1st ed.; Grada Publishing: Praha, Czech Republic, 2003; p. 196. ISBN 80-247-0569-9. [Google Scholar]
- Cerny, V. Prodejní Techniky, 1st ed.; Computer Press: Brno, Czech Republic, 2003; p. 486. ISBN 80-251-0032-4. [Google Scholar]
- Hung, S.Y.; Hung, W.H.; Tsai, C.A.; Jing, C. Critical factors of hospital adoption on CRM system: Organizational and information system perspectives. Decis. Support. Syst. 2010, 48, 592–606. [Google Scholar] [CrossRef]
- Reinartz, W.; Krafft, M.; Hoyer, W.D. The customer relationship management process: Its measurement and impact on performance. J. Market. Res. 2004, 41, 293–305. [Google Scholar] [CrossRef]
- Hosseini, S.M.S.; Maleki, A.; Gholamian, M.R. Cluster analysis using data mining approach to develop CRM methodology to assess the customer loyalty. Expert Syst. Appl. 2010, 37, 5259–5264. [Google Scholar] [CrossRef]
- Brown, S.A. Customer Relationship Management: A Strategic Imperative in the World of e-Business; John Wiley & Sons: New York, NY, USA, 2000; p. 376. ISBN 9780471644095. [Google Scholar]
- Pradana, H.A.; Riza, B.S.; Naseer, M.; Soetarno, D.; Mantoro, T. The effect of e-CRM towards service quality and net benefits using structure equation modeling. In Proceedings of the 2nd International Conference on Informatics and Computing, ICIC 2017, Papua, Indonesia, 1–3 November 2017; Institute of Electrical and Electronics Engineers Inc.: Piscataway, NJ, USA, 2018; pp. 1–6. [Google Scholar]
- Oumar, T.K.; Mang’Unyi, E.E.; Govender, K.K.; Rajkaran, S. Exploring the e-CRM—e-customer- e-loyalty nexus: A Kenyan commercial bank case study. Manag. Market. 2017, 12, 674–696. [Google Scholar] [CrossRef]
- Centobelli, P.; Cerchione, R.; Esposito, E.; Raffa, M. Digital marketing in small and medium enterprises: The impact of web-based technologies. Adv. Sci. Lett. 2016, 22, 1473–1476. [Google Scholar] [CrossRef]
- Taiminen, H.M.; Karjaluoto, H. The usage of digital marketing channels in SMEs. J. Small Bus. Enterprise Dev. 2015, 22, 633–651. [Google Scholar] [CrossRef] [Green Version]
- Grover, D. Effective Customer Relationship Management through e-CRM. Viewpoint 2011, 2, 27–38. [Google Scholar]
- Sohrabi, B.; Haghighi, M.; Khanlari, A. Customer relationship management maturity model (CRM3): A model for stepwise implementation. Int. J. Hum. Sci. 2010, 7, 1–20. [Google Scholar]
- Hyung-Su, K.; Young-Gul, K. A CRM performance measurement framework: Its development process and application. Ind. Market. Manag. 2009, 38, 477–489. [Google Scholar] [CrossRef]
- Jonghyeok, K.; Euiho, S.; Hyunseok, H. A model for evaluating the effectiveness of CRM using the balanced scorecard. J. Interact. Market. 2003, 17, 5–19. [Google Scholar] [CrossRef] [Green Version]
- Sampson, L. The CRM Evaluation Method––CRM BodyCheck. Available online: https://mthink.com/legacy/www.crmproject.com/content/pdf/CRM6_wp_lee.pdf (accessed on 25 June 2018).
- Chlebovsky, V. CRM Řízení Vztahu se Zákazníky; Computer Press: Brno, Czech Republic, 2005; p. 196. ISBN 80-2510-798-1. [Google Scholar]
- Milencicova, R. Meranie Ukazovatelov Výkonnosti CRM, 1st ed.; Univerzita sv. Cyrila a Matoda v Trnave, Fakulta masmediálnej komunikácie: Trnava, Slovak Repubic, 2012; p. 148. ISBN 978-80-8105-412-9. [Google Scholar]
- Balcerzak, A.P.; Kliestik, T.; Streimikiene, D.; Smrcka, L. Non-Parametric approach to measuring the efficiency of banking sectors in European Union countries. A. Polyt. Hungar. 2017, 14, 51–70. [Google Scholar]
- Kliestikova, J.; Misankova, M.; Kliestik, T. Bankruptcy in Slovakia: International comparison of the creditor’s position. Oecon. Coper. 2017, 8, 221–237. [Google Scholar] [CrossRef]
- Bratu, S. Is green consumerism really an environmentally conscious behaviour? Geopolitics Hist. Int. Relat. 2017, 9, 167–173. [Google Scholar]
- Enderstein, A. European identity and gender equality policies: Shaping the practice of gender expertise. J. Res. Gend. Stud. 2017, 7, 109–135. [Google Scholar] [CrossRef]
- Sedliacikova, M.; Moresova, M.; Bikar, M.; Bencikova, D. How the internal stakeholders perceive the implementation of controlling. Econ. Manag. Spectrum 2017, 11, 32–44. [Google Scholar] [CrossRef]
- Chraska, M. Metody Pedagogického Výzkumu: Základy Kvantitativního Výzkumu; Grada Publishing: Praha, Czech Republic, 2007; p. 265. ISBN 80-247-1369-4. [Google Scholar]
- Durica, M.; Svabova, L. Improvement of company marketing strategy based on Google search results analysis. Procedia Econ. Finance 2015, 26, 454–460. [Google Scholar] [CrossRef]
- Kliestiková, J.; Krizanova, A.; Corejova, T.; Kral, P.; Spuchlakova, E. Subsidies to increase remote pollution? Sci. Eng. Ethics 2018, 24, 755–767. [Google Scholar] [CrossRef] [PubMed]
- Kliestik, T.; Cisko, Š. Finančný Manažment Podniku II; Edis: Zilina, Slovak Republic, 2013; p. 775. ISBN 978-80-554-0684-8. [Google Scholar]
- Olah, J.; Zeman, Z.; Balogh, I.; Popp, J. Future challenges and areas of development for supply chain management. LogForum 2018, 14, 127–138. [Google Scholar] [CrossRef]
Figure 1.
Matrix of the calculation of criteria in Offer management area.

Figure 2.
Matrix of the calculation of criteria in Classic marketing area.

Figure 3.
Matrix of the calculation of criteria in Sales activity area.

Figure 4.
Matrix of the calculation of criteria in Service and support activities area.

Figure 5.
Matrix of the calculation of criteria in Logistics operations area.

Figure 6.
Matrix of the calculation of criteria in Internet activities area.

Figure 7.
Matrix of the calculation of criteria in Complex indicators area.

Figure 8.
Matrix with the calculated weights of each area.

Figure 9.
The level and performance of CRM from both perspectives.


Table 1.
Defining Criteria of CRM level and performance measurement model.
| Key Area | Name of Criteria | Criterion within the Key Area |
|---|---|---|
| Brand management | F1 | Brand associations |
| F2 | Brand awareness | |
| F3 | Brand loyalty | |
| F4 | Perceived brand quality | |
| F5 | Brand value in financial terms | |
| Offer management | F1 | Customer loyalty |
| F2 | Customer satisfaction | |
| F3 | Value of products for customers | |
| F4 | Brand value | |
| F5 | Skepticism towards quality | |
| Classic marketing | F1 | Reaction percent |
| F2 | Campaign reach | |
| F3 | Conversion rate | |
| F4 | Cost of getting a new customer | |
| F5 | Average order size | |
| Sales activities | F1 | Likelihood of success |
| F2 | Sales costs | |
| F3 | Rating of current customers | |
| F4 | Sales results | |
| F5 | New customer statistics | |
| Service and support activities | F1 | Reaction time |
| F2 | Time of service operation | |
| F3 | Customer satisfaction with service | |
| F4 | The total time of service intervention | |
| F5 | Communication with customers during the warranty period | |
| Logistics operations | F1 | Order execution rate |
| F2 | Compliance with the required terms | |
| F3 | Compliance with promised terms | |
| F4 | Percentage of unfulfilled orders | |
| F5 | Reliability of the process | |
| Internet activities | F1 | The popularity of the page bookmark |
| F2 | Number of total visitors | |
| F3 | Number of unique visitors | |
| F4 | Number of registered users | |
| F5 | Average time spent on a website | |
| Customer Support/Call Center | F1 | Average call costs |
| F2 | Number of calls | |
| F3 | Average waiting time | |
| F4 | Call center performance | |
| F5 | Summary time | |
| Complex indicators | F1 | Perspective of long-term relationships |
| F2 | Overall satisfaction with the business | |
| F3 | Detection of customer satisfaction | |
| F4 | Return on sales | |
| F5 | Return on investment |
Table 2.
Number of responses per area.
| Key Area | Number of Responses |
|---|---|
| Brand management | 33 |
| Offer management | 135 |
| Classic marketing | 98 |
| Sales activities | 156 |
| Service and support activities | 72 |
| Logistics operations | 97 |
| Internet activities | 83 |
| Customer Support/Call Center | 21 |
| Complex indicators | 120 |
Table 3.
Number of responses of selected criterion in monitored key areas.
| Key Area | Name of Criteria | Criterion within the Key Area |
|---|---|---|
| Offer management | F1 | Customer loyalty |
| F2 | Customer satisfaction | |
| F3 | Value of products for customers | |
| Classic marketing | F2 | Campaign reach |
| F4 | Cost of getting a new customer | |
| F5 | Average order size | |
| Sales activities | F1 | Likelihood of success |
| F2 | Sales costs | |
| F4 | Sales results | |
| Service and support activities | F2 | Time of service operation |
| F3 | Customer satisfaction with service | |
| F5 | Communication with customers during the warranty period | |
| Logistics operations | F2 | Compliance with the required terms |
| F3 | Compliance with promised terms | |
| F5 | Reliability of the process | |
| Internet activities | F2 | Number of total visitors |
| F4 | Number of registered users | |
| F5 | Average time spent on a website | |
| Complex indicators | F1 | Perspective of long-term relationships |
| F2 | Overall satisfaction with the business | |
| F3 | Detection of customer satisfaction |
Table 4.
Objectivized weight of selected criteria.
| Key Area | Name of Criteria | Criterion within the Key Area | Objectivized Weight |
|---|---|---|---|
| Offer management | F1 | Customer loyalty | 0.0335241 |
| F2 | Customer satisfaction | 0.1769279 | |
| F3 | Value of products for customers | 0.0148216 | |
| Classic marketing | F2 | Campaign reach | 0.035459196 |
| F4 | Cost of getting a new customer | 0.320005912 | |
| F5 | Average order size | 0.082512372 | |
| Sales activities | F1 | Likelihood of success | 0.002648687 |
| F2 | Sales costs | 0.023838183 | |
| F4 | Sales results | 0.023838183 | |
| Service and support activities | F2 | Time of service operation | 0.013413841 |
| F3 | Customer satisfaction with service | 0.002614821 | |
| F5 | Communication with customers during the warranty period | 0.004587469 | |
| Logistics operations | F2 | Compliance with the required terms | 0.037738903 |
| F3 | Compliance with promised terms | 0.003527042 | |
| F5 | Reliability of the process | 0.011537187 | |
| Internet activities | F2 | Number of total visitors | 0.022736137 |
| F4 | Number of registered users | 0.002124897 | |
| F5 | Average time spent on a website | 0.00695068 | |
| Complex indicators | F1 | Perspective of long-term relationships | 0.111887326 |
| F2 | Overall satisfaction with the business | 0.053789816 | |
| F3 | Detection of customer satisfaction | 0.015515668 |
Table 5.
Questionnaire questions for the assessment of CRM.
| The Assessment from A Company’s Perspective | The Assessment from A Customer’s Perspective |
|---|---|
| What is the degree of customer loyalty to the company‘s offer? | What is the degree of yours loyalty to our company? |
| What is the degree of customer satisfaction with the company‘s offer? | What is the degree of yours satisfaction with our company‘s offer? |
| How do your customers perceive the value contained in the company‘s offer? | How do you perceive the value contained in our company‘s offer? |
| What percentage of the addressed customers registered the marketing campaign? | How did our marketing campaign affect you? |
| What are the average costs of getting a new partner? | What was, in your opinion, the amount of costs our company‘s spent in gaining you as a customer? |
| What is the average order size from partners? | What is the size of your average order? |
| What is the success rate in business negotiations with partners? | What is the rate of successful business deals with our company? |
| What is the level of sales costs? | What is, in your opinion, the height of the sales costs of our company? |
| What is the success rate of sales? | What percentage of the offered deals were actually concluded with our company? |
| What is the average time of service operation? | What was the average time of service operation? |
| What is the degree of customer satisfaction with service and post-warranty services? | What is the degree of your satisfaction with our service and post-warranty service? |
| What is the effective communication rate with the customer during the warranty period? | What is the effective communication rate of our company during the warranty period? |
| What percentage of orders were provided in the requested deadline? | What percentage of your orders was provided in the requested deadline? |
| What percentage of orders was provided in the promised deadline? | What percentage of your orders was provided in the promised deadline? |
| What percentage of errors occur in logistic processes? | What percentage of errors in logistics processes did you register when trading with our company? |
| What is the total number of business website visitors? | How many of your employees visit our business website? |
| What percentage of registered users of a business website do you register? | How many of your employees are registered on our website? |
| What is the average time spent by visitors on a company‘s website? | How much time do you spend on our company‘s website? |
| What is the prospect of creating long-term relationships with partners? | What is the probability of keeping long-term relationships with our company? |
| What is the degree of total partner satisfaction with our company? | What is the degree of your total satisfaction with our company? |
| What is the rate of customer satisfaction with our company? | How do you rate our detection of your satisfaction as our partner? |
© 2018 by the authors. Licensee MDPI, Basel, Switzerland. This article is an open access article distributed under the terms and conditions of the Creative Commons Attribution (CC BY) license (http://creativecommons.org/licenses/by/4.0/).
Share and Cite
MDPI and ACS Style
Krizanova, A.; Gajanova, L.; Nadanyiova, M. Design of a CRM Level and Performance Measurement Model. Sustainability 2018, 10, 2567. https://doi.org/10.3390/su10072567
AMA Style
Krizanova A, Gajanova L, Nadanyiova M. Design of a CRM Level and Performance Measurement Model. Sustainability. 2018; 10(7):2567. https://doi.org/10.3390/su10072567
Chicago/Turabian StyleKrizanova, Anna, Lubica Gajanova, and Margareta Nadanyiova. 2018. "Design of a CRM Level and Performance Measurement Model" Sustainability 10, no. 7: 2567. https://doi.org/10.3390/su10072567
Note that from the first issue of 2016, this journal uses article numbers instead of page numbers. See further details here.