Special Regulation of Isolated Power Systems: The Canary Islands, Spain


Department of Industrial Organization, Business Administration and Statistics, Technical University of Madrid, c/José Gutiérrez Abascal, 2, 28006 Madrid, Spain
*
Author to whom correspondence should be addressed.
Sustainability 2018, 10(7), 2572; https://doi.org/10.3390/su10072572
Submission received: 6 June 2018
/
Revised: 5 July 2018
/
Accepted: 20 July 2018
/
Published: 23 July 2018
Abstract
:As non-mainland territories, the Canary Islands represent isolated electricity systems with their own peculiarities, derived mainly from their location. They are therefore subject to a special regulatory framework governing their electricity supply activities. These systems are less stable, in terms of both electrical energy generation and its transport infrastructures, because their site limitations require production to rely on a small number of plants, multiplying the problems that arise from potential grid or generator failures. This means that power generation costs in isolated groups of islands have been intrinsically higher than those on the mainland, above all in terms of fuel, given their greater dependence on fossil fuels. These costs also have a different structure, wherein variable costs prevail over fixed costs. The entry into force of Royal Decree 738/2015 defines a new method to determine the price of demand, generation, and additional costs. In addition, it creates a new virtual market for each isolated system (or subsystem), which takes into account the prices of the mainland, moving year, and generation costs. This implies a reduction in the volatility of the electricity market in these territories (lower risk) because part of the purchase price is already known. In this regard, the Canary Islands’ subsystem that has experienced the greatest increase in generation costs is the island El Hierro, since, in systems where there is a wider diversification in the generation methods, there is also a greater variation in monthly prices—that is, greater uncertainty. The aim of this study is to analyze the operation of the Canary Islands’ electricity market and the configuration of its dispatch pool. The wind-pumped hydropower station on El Hierro is described as a specific case study to illustrate the impact of the new regulatory framework.
1. Introduction
1.1. A General Idea about Isolated Environments
The literature on electricity generation systems in isolated regions is abundant, reflecting the importance of appropriately specifying how the general national policies and regulations are applied to these much smaller systems. Guerrero-Lemus et al. [1] analyzed the current electric power system and energy production in Tenerife, especially photovoltaic (PV) and wind energy. They further investigated the consequences of this new legislation and the planning initially approved by the government of the Canary Islands to substantially increase the share of both technologies by 2020. Likewise, Marrero and Ramos-Real [2] evaluated the situation of the electricity generation mix in the Canary Islands and compared it with the Canary Islands Energy Plan, highlighting the inefficiency of the current generation mix of the islands and studying measures to improve it. Another interesting example of renewable energy technology in isolated environments, applied this time to the island of Cozumel in Mexico, was offered by Mendoza-Vizcaino et al. [3]. This study shows that, by 2050, a feasible integration of a wind/PV-based system can be achieved on that island. Fokaides and Kulili [4] presented a study on the network parity in island systems as it applies to Cyprus, with special emphasis on the PV case. Kuang et al. [5] reflected on the use of renewable energies in isolated territories, especially in terms of distributed generation and smart grid technologies for their future application in isolated environments. Finally, Díaz et al. [6] described the impact of electric vehicles as distributed energy storage, using the particular case of Tenerife Island, providing encouraging results.
In Spain, Article 10 of Law 24/2013 for the electricity sector [7] recognizes the need for special regulations for “Insular and Extra-peninsular Electricity Systems” (henceforth, non-mainland systems, or NMSs, where the mainland refers to the Iberian Peninsula—Spain and Portugal). This term refers to four territories composed of 10 subsystems, in terms of electrical power generation: (1) and (2) the cities of Ceuta and Melilla on the coast of Morocco; (3) the four Balearic Islands, separated into two subsystems: Mallorca–Menorca (Mallorca is interconnected to the mainland by cable) and Ibiza–Formentera; and (4) the Canary Islands: Tenerife, Gran Canaria, El Hierro, La Palma, La Gomera, Lanzarote, and Fuerteventura (the latter two are interconnected), constituting six differentiated subsystems. Given their isolated position and small size, NMSs present their own limitations and constraints affecting the electrical supply, resulting in higher investment and operating costs than a typical interconnected mainland grid system.
In the same way, their generation activity in these territories is not regulated according to the mainland model of a wholesale market, since this would not correctly respond to the aim of guaranteeing the electrical power supply by meeting demand efficiently, in cost terms. As is well known, generation in NMSs is through coal-fired, fuel-oil, or combined cycle generators, and, to a lesser extent, by wind, PV, and cogeneration facilities.
Bearing in mind that the surface area of Spain is about 505,940 km2 [8], the NMSs occupy 12,607 km2—that is, 2.5% of the national territory. Being clearly a small area, it is further divided into 11 islands, plus the cities of Ceuta and Melilla on the coast of Morocco. In fact, the largest of these systems is 30 times smaller than the mainland system. This means that the average size of their generators (31 MW) is much lower than those on the mainland (336 MW). As seen in Table 1, it is striking how the number of generating plants installed in the NMSs is quite similar to that on the mainland.
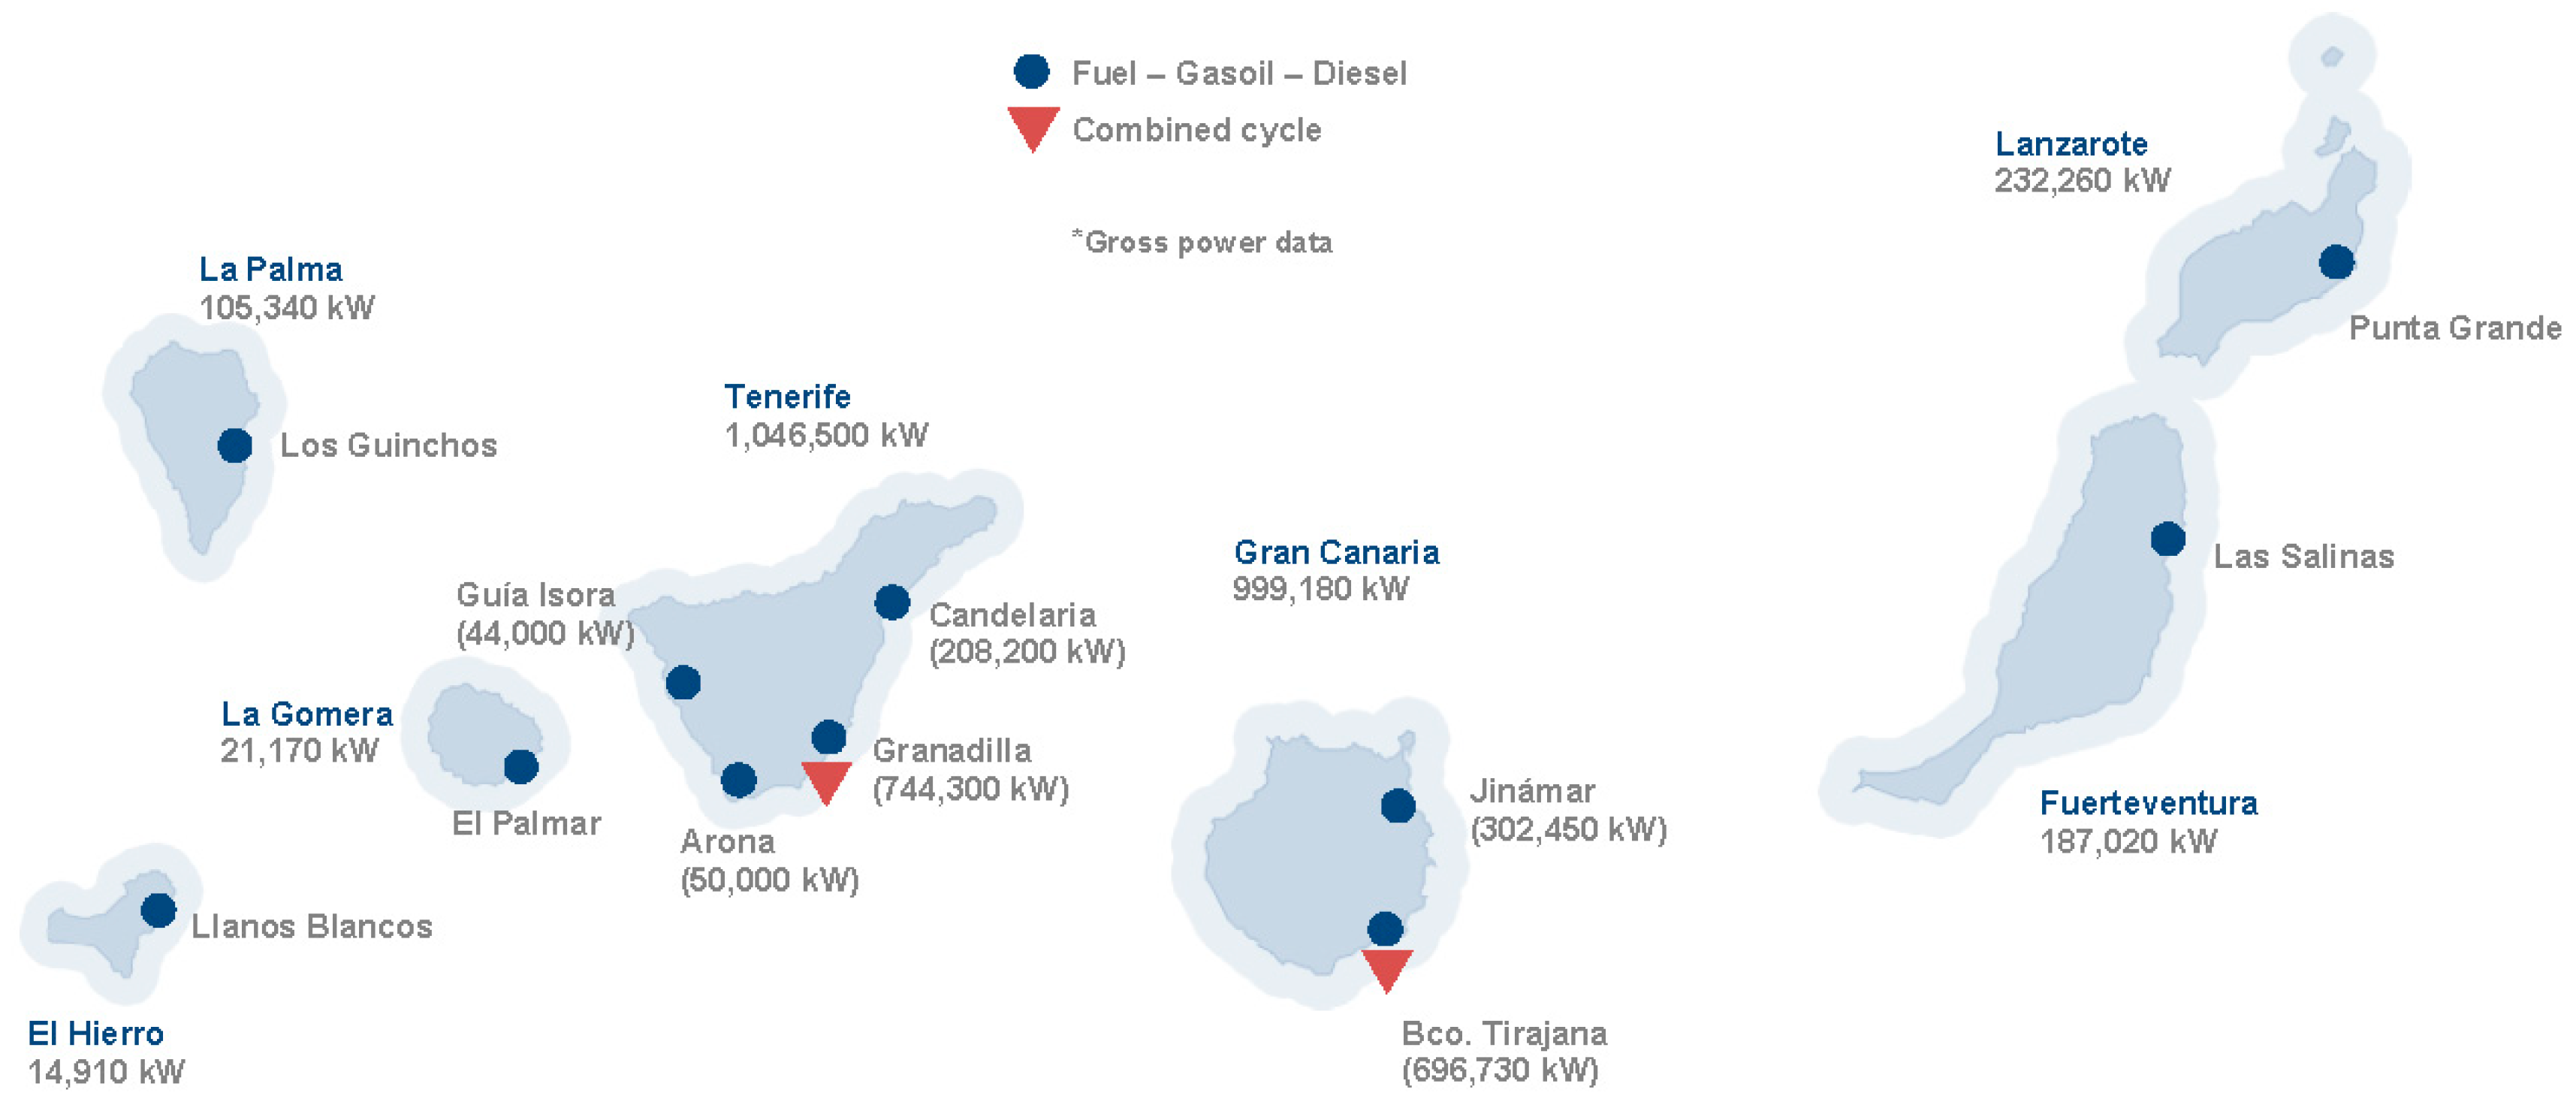
The small size of the power stations is a handicap that raises the generation costs, despite using mature conventional technologies. These non-mainland electricity systems are fragile, both in generation and in transport infrastructure. As seen in Figure 1, siting restrictions lead to reliance on a limited number of facilities, multiplying any problems in generation or in the grid.
Furthermore, the local peculiarities of NMSs have limited the mix of sources. In these territories, the least variable cost technologies, such as hydropower or nuclear, are not suitable. In the first case, because there is a lack of suitable natural resources for traditional technology and, in the second case, because it is not viable in such small subsystems from an economic point of view.
Given this inherent fragility, the operating criteria of isolated systems are different from those of interconnected continental grids. In the former, a higher priority must be given to the reliability of supply, which also affects the costs. For this reason, much higher reserve output margins are necessary to guarantee coverage of the demand than those needed in larger systems, as seen in Table 2. This reserve margin is also related with the electrical coverage index (CI), and it is a measure of the available capacity over and above the capacity needed to meet normal peak demand levels [11]. It is usually expressed as a percentage.
Similarly, climate, orography, and the seasonality of demand in touristic locations also impose additional costs. In the same context, there are also greater environmental requirements, e.g., protection of fauna and flora.
In brief, these singularities lead to higher generation costs than those in the mainland. This is especially true given the strong dependence of an NMS on fossil fuels. These higher costs have a different structure than those in the mainland, since variable costs prevail over fixed costs.
1.2. The Nature of the Generation Activity in Non-Mainland Systems
With respect to the configuration of the electricity market and its stakeholders, it is convenient to establish the differences between NMSs and mainland territories. The production dispatch, the economic regime of the electric power production facilities, the determination of the price of demand, and the additional costs of production activity are the four basic differences that we briefly comment on.
Firstly, in NMSs, a production dispatch is established for each of the isolated electrical systems of the non-mainland territories. Unlike the mainland systems, in which the matching of the Operator of the Iberian Energy market (OMIE) is carried out exclusively according to market criteria, in the NMSs, the system operator (SO) carries out generation schedules at a weekly, daily, and intradaily periodicity. These schedules are the result of a dispatch in three phases: a first phase, in which the demand is met with exclusively economic criteria; a second one, with economic and safety criteria; and a third one, taking into account the possible restrictions of the transport network.
Secondly, for the energy production facilities in the NMSs, three types of remuneration schemes are established, in order to help distribute the fixed costs and the variable generation costs associated with the singularities of these subsystems.
Third, the electricity price of the NMSs depends on the moving average of the OMIE peninsular prices of the 12 months prior to delivery of the supply, corrected by a coefficient of targeting, which is the reason that this new reference index considers the variation of the generation costs of each hour in each NMS.
Finally, for these isolated systems, the extra cost of the production activity is defined as the sum of the extra costs of generation in each of the isolated systems, and the income received from the acquisition of energy on the demand side (discounting the concepts destined for interruptibility and compensation to the market and system operator).
2. The Canary Islands’ Non-Mainland Electricity Systems (NMSs)
2.1. Specific Factors for the Canary Islands
These singularities of NMSs derive not only from the large dependence on fossil fuels, but also from the use of oversized equipment and the relatively long distances between generation and consumption locations, which causes energy losses in the grid.
As an example, Figure 2 shows that the highest generation costs in the islands appear at night when the demand is low, contrary to continental systems.
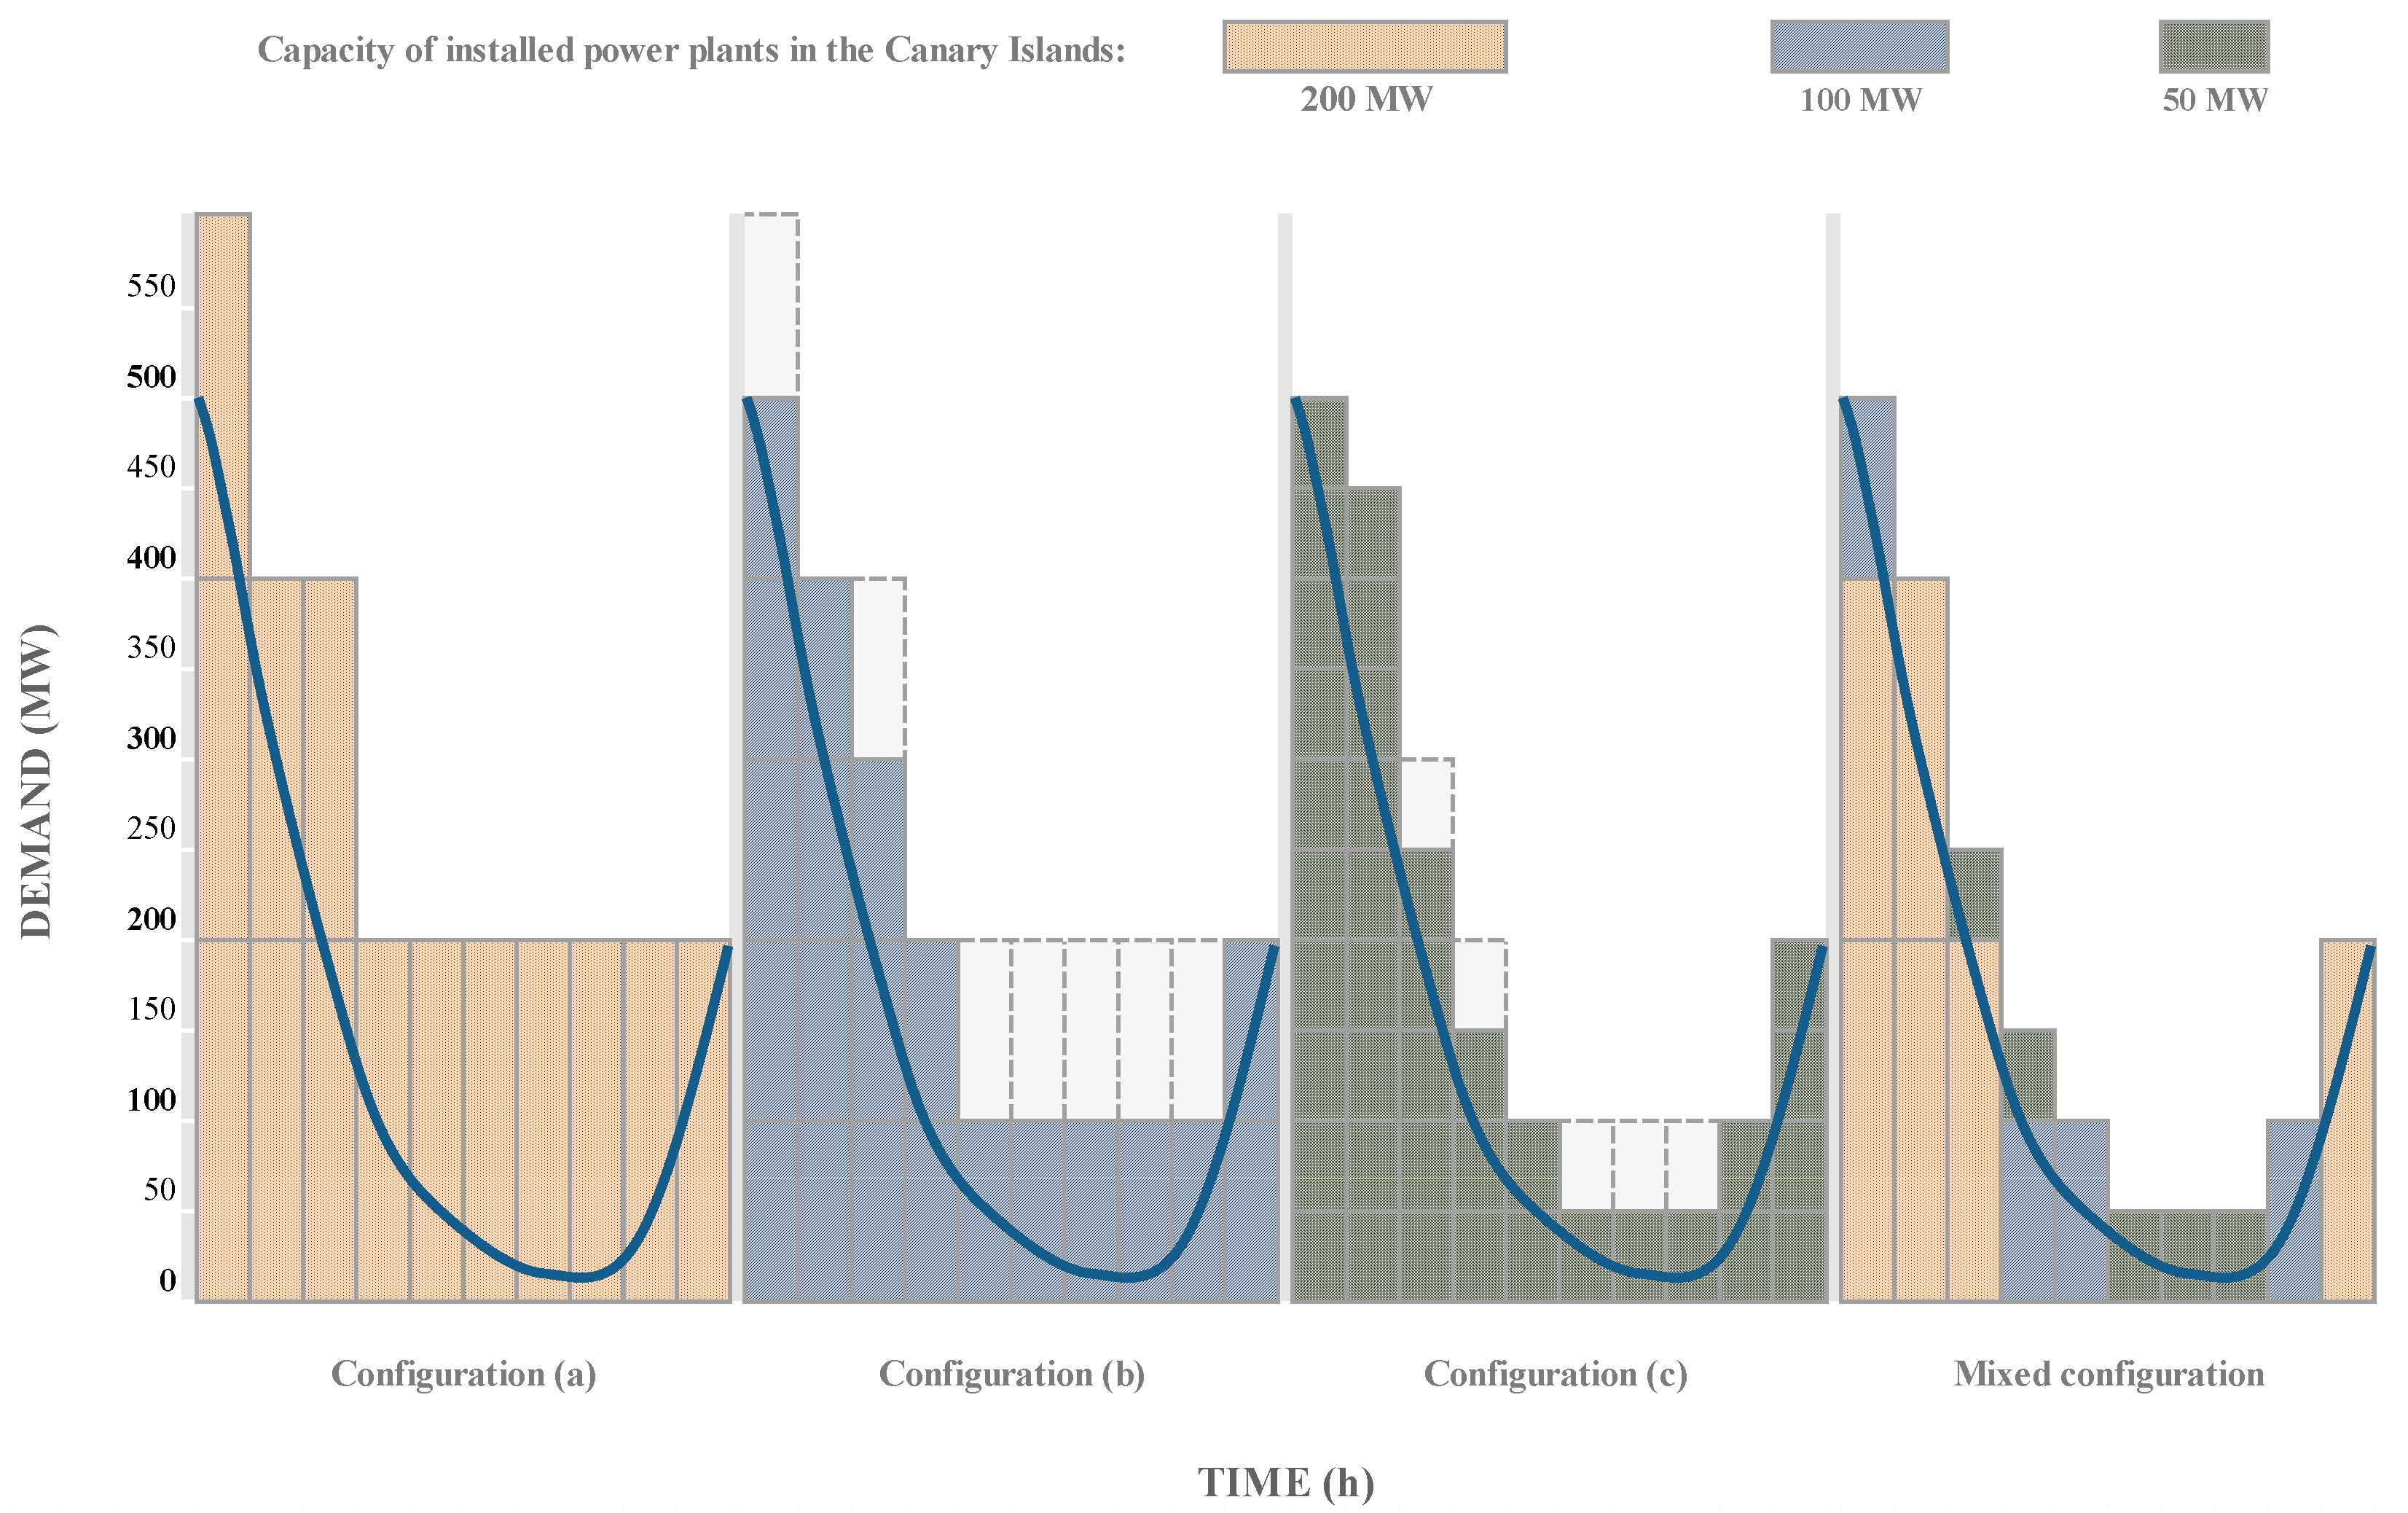
This is due to the fact that the efficiency of large generators drops at the low outputs required to cover low demand. Thus, changing to a mixed structure—that is, using different capacity increases, as shown in Figure 3—would raise the overall efficiency of the facilities and lower costs, thus adjusting better to such demand curves.
In fact, the Canary Islands’ NMS includes areas with high potential energy resources with adequate conditions for integrating renewable generation [12]. Recent studies have used sophisticated models to simulate these electrical systems, including scenarios with a 100% renewable electricity supply [13]. Others, like Schallenberg-Rodríguez and García Montesdeoca [14], have studied the viability of offshore wind energy as the first step in energy planning. However, besides the study performed by Guerrero-Lemus et al. [15], the operation of these networks is notably complicated by insufficient interlinking within the network, difficulties in their territorial expansion for environmental reasons, and voltage levels lower than those in mainland networks. These factors are combined with the difficulty of managing and scheduling intermittent generation sources that depend on wind speed and clear skies, for example. This approach has led to a limited use of renewable energy sources and a power system with few generation nodes, distant from each other and from the consumers, which implies higher costs.
2.2. Configuration of the Generation Facilities
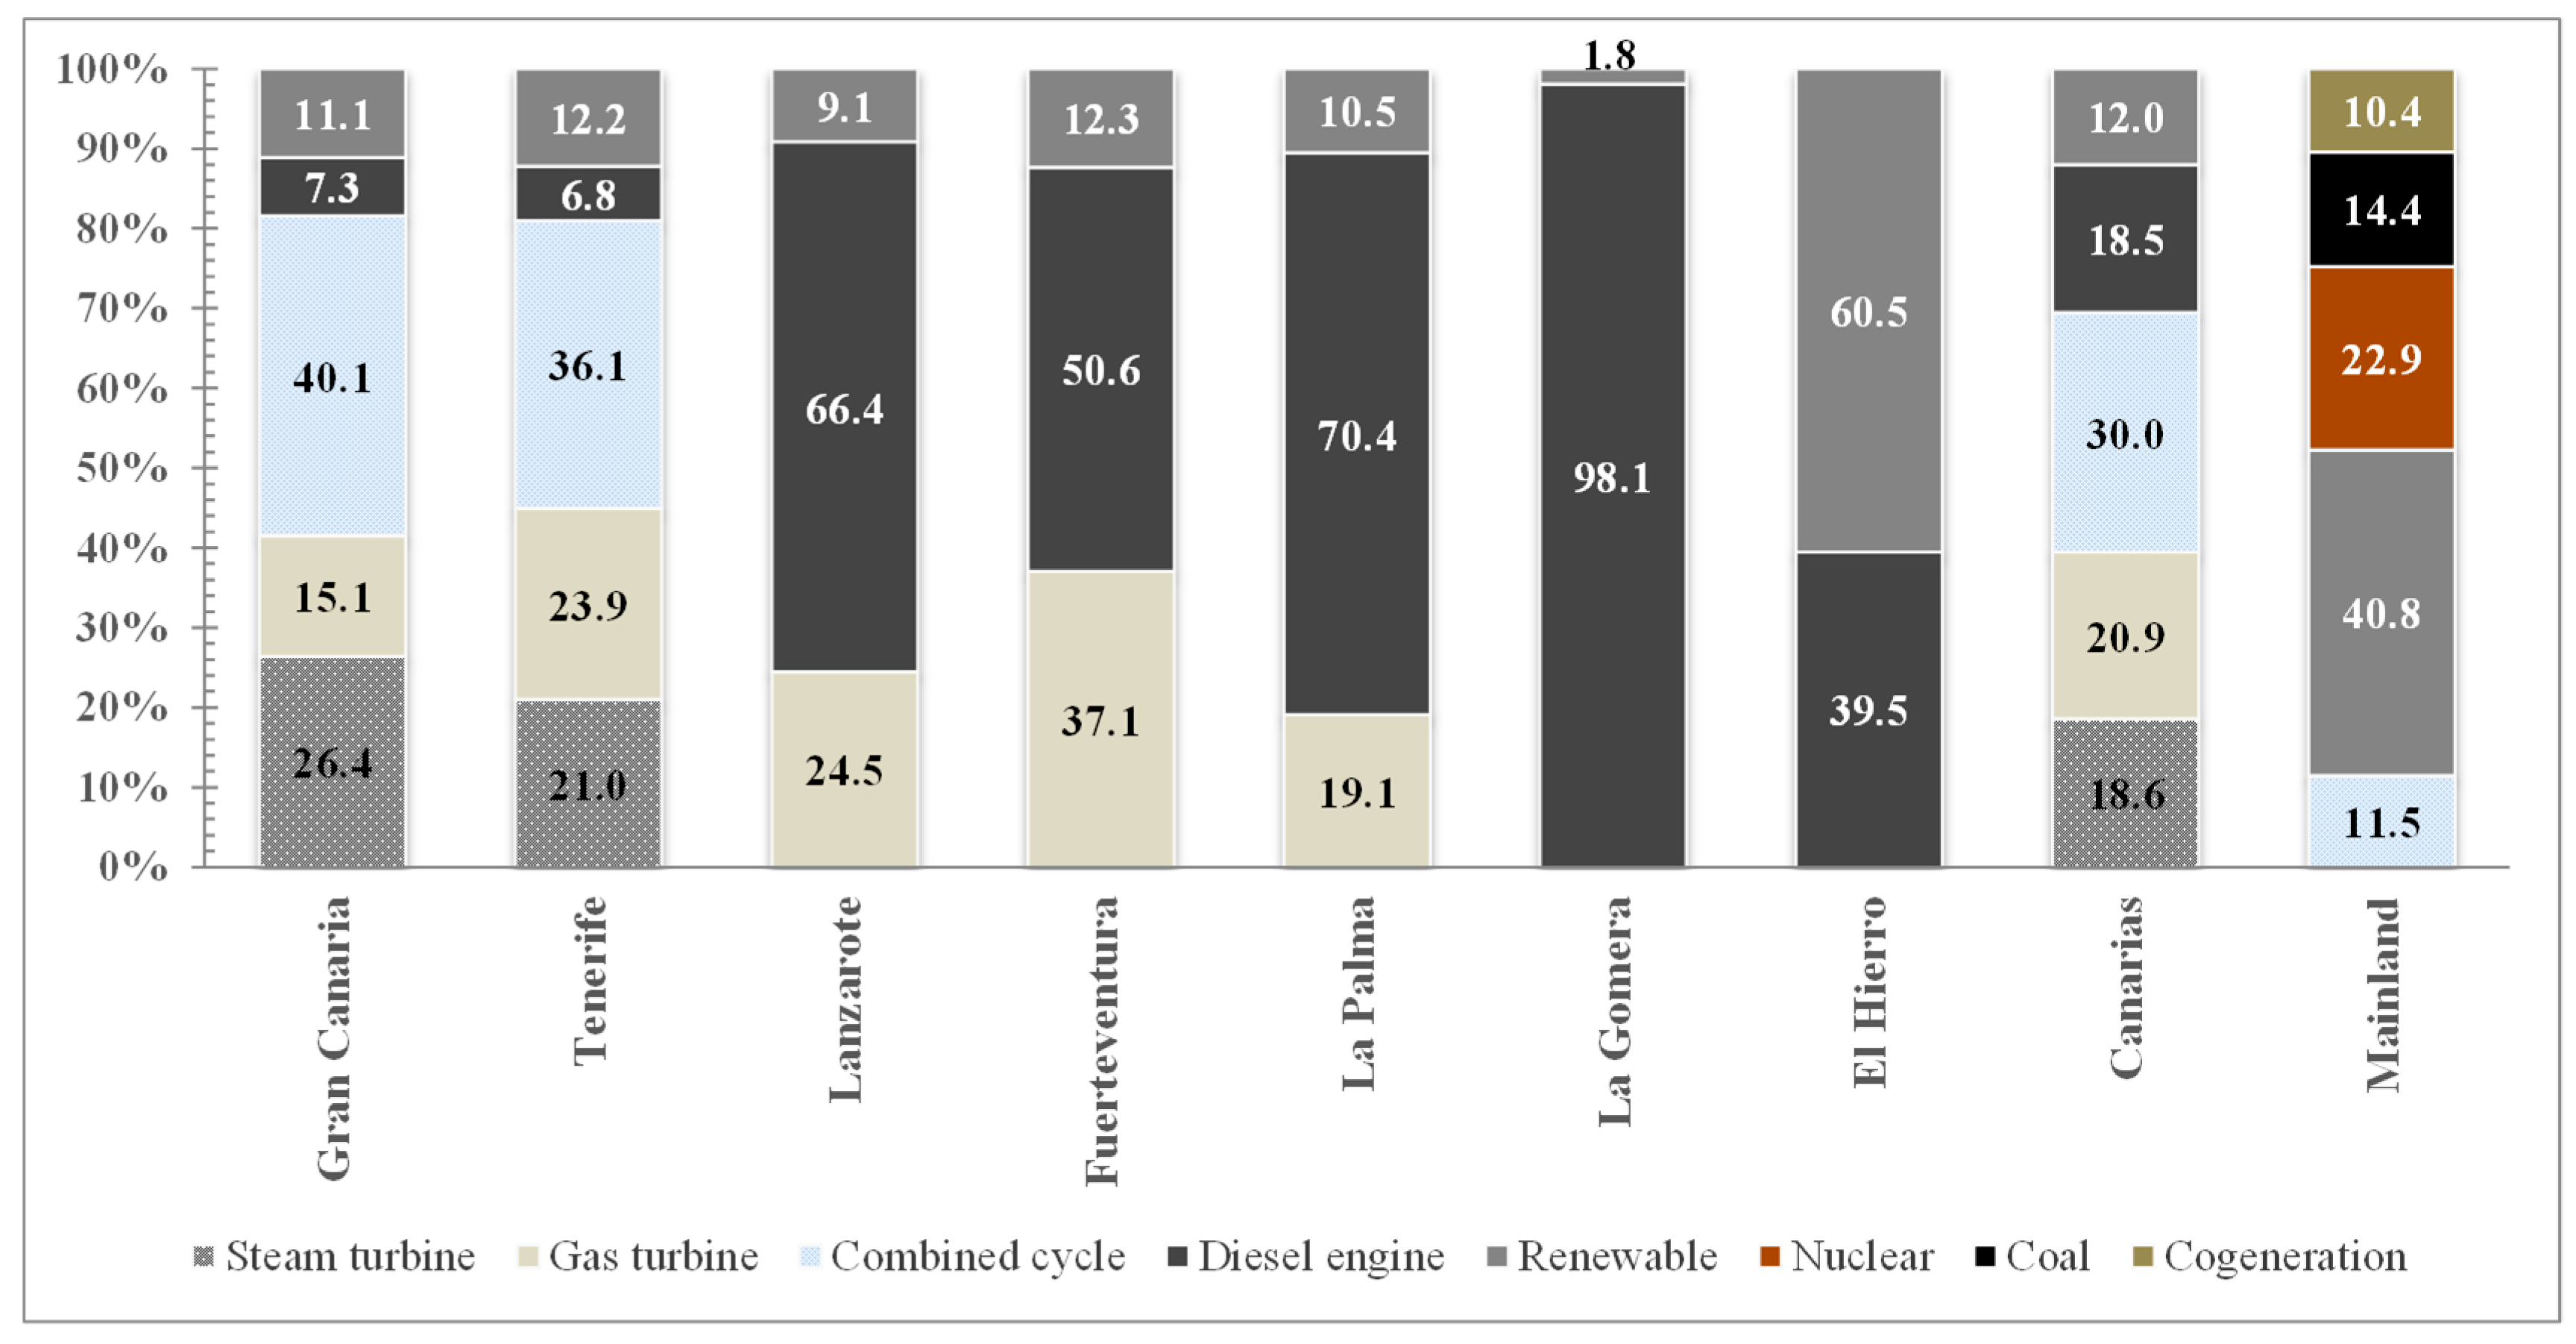
According to the latest data published by the Canary Islands’ government [10], shown in Table 3 and Figure 4, the power installed on each island is grouped according to the kind of energy source used. Renewable energy sources provide only 12.0% of the total energy requirements in the Canary Islands, adding up to 367.7 MW, distributed mainly between photovoltaic, with 180.5 MW (49.1%), and wind power, with 158.6 MW (43.1%). Although, as in previous years, the share of electricity produced from renewable sources in the Canary Islands is relatively small when compared to the total electricity generated. It is important to note that the island of El Hierro, thanks to its hydro-wind power plant, reached 66.1% energy use from renewable sources in July 2016.
Given that each island has its own peculiarities, both geographical and social-economic, there is a very diverse energy mix among them, as shown in Figure 4, which also presents the energy mix for mainland Spain.
First, in small islands like La Gomera, El Hierro, or La Palma, an energy mix based on combined cycles or steam turbines is not possible due to the extra costs generated by the associated infrastructure. The same happens in these islands for renewable energy based on waste, biomass, or solar energy. Second, islands like Tenerife and Lanzarote have a geothermal potential that has not yet been rigorously exploited. The authors consider that a study in this aspect would be relevant in order to determine this potential. Third, most of the total wind energy generation is located in Gran Canaria with 63.6%, mainly due to the greater amount of wind power installed on this island (55.6% of the total) followed by Tenerife with 18.1%. The smaller islands show much lower production percentages in the global calculation due to the size of their wind power plants. All this reflects the difference in the energy mix of the mainland. Another important factor to bear in mind with these systems are losses in power transportation and distribution. In 2016, these losses were about 586,075 MWh, i.e., 6.7% of the total electricity supplied to the grid. By island, the largest percentage loss was in Tenerife with 7.9%, followed by La Gomera and La Palma with 7.2%. The smallest losses occurred in El Hierro (4.4%) and Lanzarote (5.0%). In recent years, in the overall calculation for the islands, the percentages of annual losses rose by 0.3%, a trend that has been continuing since 2012. Regarding the quality of the network, Table 4 shows a comparison of the Canary and Balearic Islands’ NMSs with that on the Iberian mainland, where, in proportion to the different lengths in kilometers of their transportation networks, both the average time of interruption (ATI) and the energy not provided (ENP) are higher for the former, especially for the Canary Islands. The percentage of the energy not provided (PENP) is obtained as the ratio between the ENP and the new demand forecast (NDF) for the period.
In addition, the cost of generation on the islands is very different from the cost in the Spanish mainland. It is evident that this is largely attributable to the lower participation of the technologies with lower generation costs (nuclear and hydroelectric) in the energy mix. Examining the evolution of the average price of generation in the Canary Islands between 2012 and 2015 published by the system operator [16], the Canary Islands have by far the highest costs at 196.16 €/MWh, compared to the Balearic Islands and to the mainland with 141.33 €/MWh and 46.61 €/MWh, respectively. Based on Noussan et al. [17], it would be relevant to analyze the performance indicators of electricity production in these isolated systems, considering the proportion of renewable energy sources, primary energy consumption, and CO2 emissions.
2.3. Energy Mix
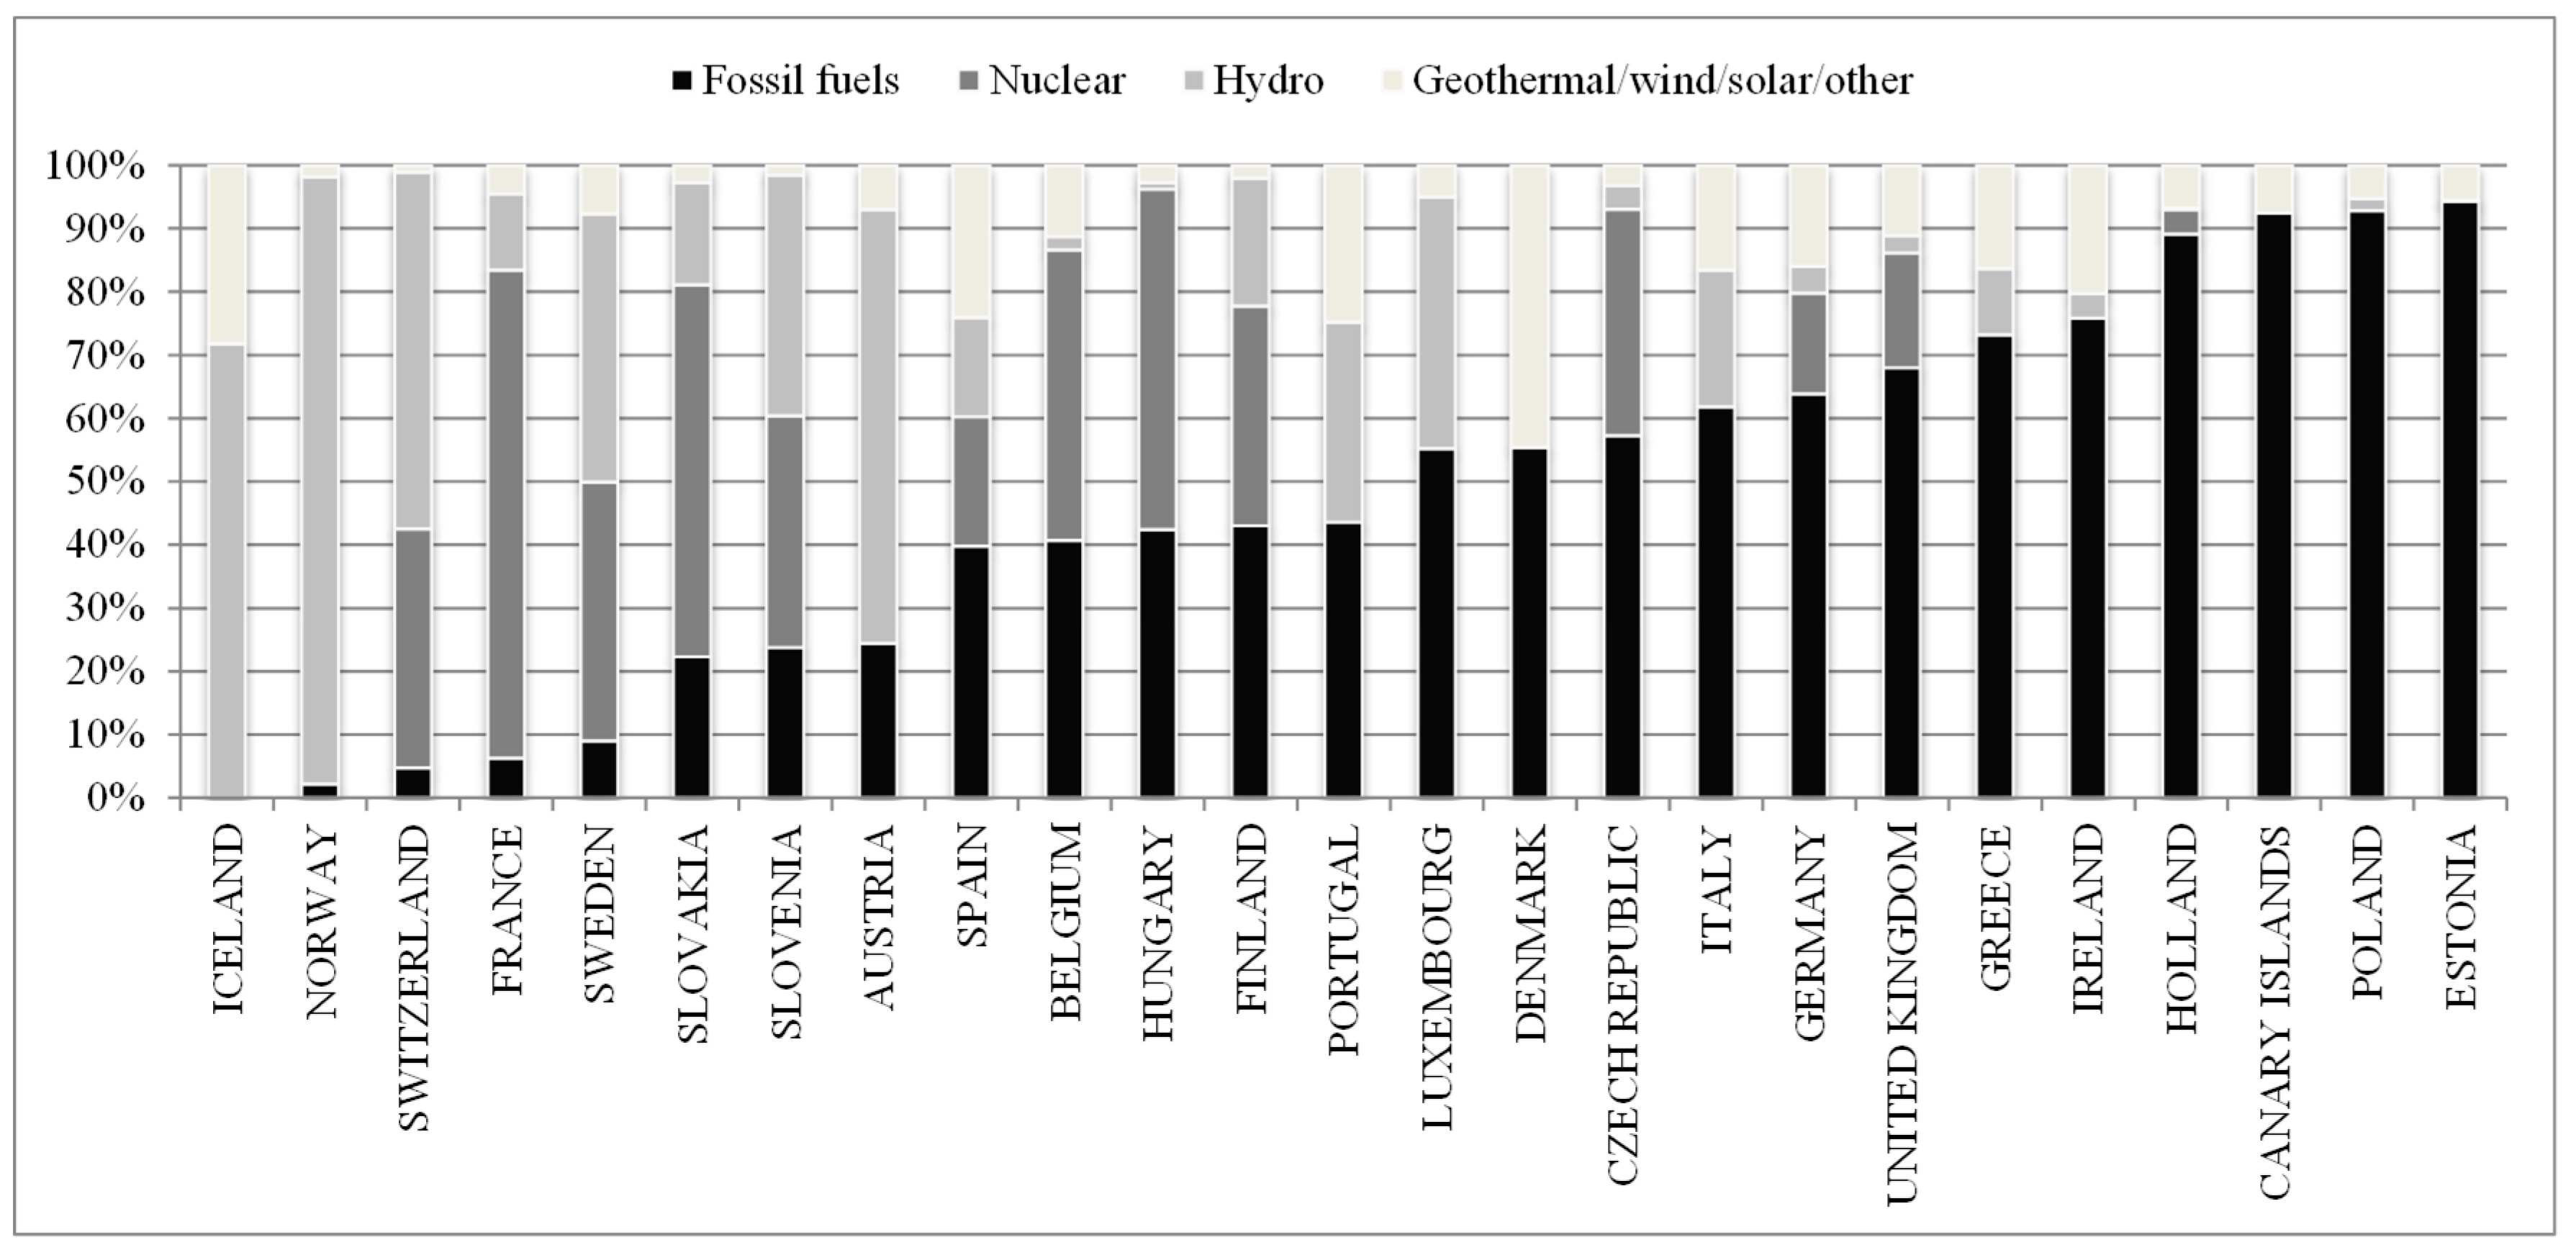
In the Canary Islands, internal production represents a very small fraction of the primary energy, that amount being the common contribution of all renewable energies (wind, photovoltaic, hydro-wind, small-scale hydro, and landfill biogas). Reflecting the meteorological conditions, its total participation has been practically stabilized for 2 years, with a contribution to the group of primary energies hardly reaching 1.50% in 2016. The absence of hydroelectric installations (with the exception of the recent start-up of the wind-pumped hydro generation plant in El Hierro) constrains a greater participation of renewable energies and maintains levels well below those reached in Spain or elsewhere in the European Union. Indeed, Figure 5 shows the percentage contribution of the different sources and technologies, in terms of input into the network for 2016. In particular, the following facts deserve special mention. In the first place, the energy policy in the Canary Islands must be clearly improved. These islands have adequate natural resources to increase the contribution of renewable energies. Currently, the Canary Islands are ranked at the bottom in the use of renewable energy, and they are a Spanish region that depends more on fossil fuels. A clear reference to analyze is the case of Iceland and its energy plan [18]. In this plan, the energy policy of Iceland could be categorized as ambitious with its aims at carbon neutrality, in that the use of fossil fuels is reduced as much as possible. Iceland is already well underway in this regard, since all sectors in Iceland, except for fishing and transportation, use mostly renewable energy from hydro or geothermal sources.
Fossil fuel supplies have a huge relevance towards end users within the structure of the Canary Islands’ energy sector. Indeed, petroleum products for end users absorb most of the demand for final energy, reaching 79.68% of that figure in 2016. The remaining 20.32% is composed of 20.08% in electricity and 0.24% in direct use of solar thermal energy. Most of the direct fuel consumption occurs in the transportation sector, which receives 74.30% of the final energy in its three modes: land-based (34.35%), air (32.48%), and maritime (7.47%).
3. Evolution of the Regulatory Framework of the NMSs
Since the beginning of 1998, the Spanish electricity sector has undergone a huge transformation, owing to the regulatory modifications in the 96/92/EC Directive [19], whose fundamental objective was to take the first steps towards an internal electricity market in the European Union, starting with the liberalization of both generation and commercialization of the electricity industry [20,21,22].
As already mentioned, the NMSs are subject to special regulations for electric energy supply due to their specific isolated characteristics. Law 54/1997 [23] was enacted with the purpose of maintaining prices similar to those in the Iberian mainland system. It established a mechanism of economic compatibility, taking into account the higher cost of generation in the isolated systems, hence avoiding discrimination against their consumers and retailers. Thus, the energy output was remunerated according to mainland prices, adding a further payment to cover the specific costs of these systems, including generation costs unaffordable from the income obtained there. Thus, a dispatch mechanism was applied to pay for the units or batches of power generated. This gave preference to economic ‘merit’ until the planned demand was met, maintaining reliability and quality of supply. The system operator (SO) is responsible for this dispatch process.
As a compensatory measure, a mechanism of economic compatibility was established for the demand from energy buyers, thus avoiding any discrimination with respect to the buyers in the mainland system. There was, however, a difference generated between costs and incomes of the activities with regulated remuneration, which generated a rising debt in the sector. In order to balance this, the Spanish government analyzed issues such as the variation over time of such compensation for the generation activity in the NMSs and proposed several measures. Among them, the most important was to begin the overhaul of the legislation in force until then. Indeed, 2012 and 2013 were years with several regulatory changes in the electric utility sector. This paper cannot cover the entire regulatory framework of this period. Nevertheless, Table 5 provides a brief summary of the modifications affecting non-mainland territories.
Royal Decree Law 13/2012 [24] incorporates into the Spanish legal framework Directive 2009/72/EC of the European Parliament and of the Council [25]. It establishes the remuneration criteria for the conventional generation regime in the non-mainland electricity systems and initiates the revision of the remunerative model of fixed and variable costs for power-generating facilities, which then came into effect on 1 January 2012 with Royal Decree 20/2012 [26].
In order to guarantee supply and stimulate competition, Law 17/2013 [28] was passed to further ensure electricity supply, allowing a reduction in the costs of the activity itself. Finally, Law 24/2013 [7] repealed Law 54/1997 [23] establishing mechanisms for specific regulation of the NMSs, encouraging renewable sources that can be technically integrated and reduce costs in the system. It stipulates that criteria homogeneous to those for generation in the mainland should be applied in calculating remuneration.
4. Analysis and Application of the New NMS Regulations
4.1. Introduction to RD 738/2015
Even though Royal Decree 413/2014 [30] was intended to regulate electricity production from renewable sources (at first, this RD led to certain controversies with Directive 2012/27/EU [32]), RD 738/2015 [31] regulates both overall production and the dispatch procedure. As a general idea, it attempts to adopt a model that prioritizes the efficiency of technologies, and the management, maintenance, and renovation of the generation facilities in operation. This RD-law is basically divisible into four parts. The first one focuses on the establishment of a dispatch pool of energy production for each of the isolated non-mainland systems. Likewise, this procedure is defined in three phases: firstly, one during which supplies are selected exclusively on economic criteria; a second one, on economic and reliability criteria; and a third one taking into account the possible restrictions of the transport network. This process also defines the facilities which should be covering the demand, taking into account their variable costs, the technical restrictions, and the reserve potential to guarantee the quality of service. This first important change has two implications: producers are paid according to the established regime for the power generated, and, in turn, direct consumers and retailers start to acquire energy at the demand price. This latter value is obtained from the corrected mainland price, applying a coefficient that takes into consideration the cost variation during each hour of generation. This coefficient (pointer) is explained later, and it is a value that the system operator registers.
The second part deals with the financial regime of the power generation facilities. It establishes three remunerative regimes depending on their type: (i) an additional remunerative regime; (ii) a specific remunerative regime; and (iii) a financial regime without a right to either of the previous ones. The third and fourth parts respectively clarify the methodology used to determine the demand price, the cost of generation and extra cost.
The specific remunerative regime is set out in Guerrero-Lemus et al. [1], following the rules of the reference scheme [30] for the case of wind power. The part corresponding to the additional remunerative regime [31] remains lost in no man’s land, since, given the typical conventional facilities in isolated systems, there are still no types of facilities on which to base applicable and viable models in these territories. This appears to be a promising regulatory framework with great possibilities, but it is difficult to apply in practice because of its rigid administrative procedure.
Next, the aim is to study in more detail how the creation of this market has influenced the isolated subsystems since this decree came into effect. This involves performing a practical application to the Canary Islands’ system, using the specific case of the new wind-pumped hydro plant on El Hierro.
4.2. Determination of the Demand Price, the Generation Cost, and the Extra Cost
Before RD 738/2015 came into effect, the demand acquisition price for direct retailers and consumers in NMSs was governed by the same cost structure as that in the mainland. The final hourly price of the demand followed the expression below (note that the equations are in reference to a 1 h time interval, so they are denoted by h):
where OMIEh is the cost of purchasing energy in the daily and intraday market (in Spain: OMIE), and SAh represents the costs incurred by the system adjustment services.
FPh = OMIEh + SAh
Once RD 738/2015 entered into effect, the NMS exchanged its reference index (FPh) for another one that takes into account the variation of the generation costs in each hour, PhDemand(j). So, for each electrical system (j), the new expression is as follows:
where PhDemand(j) is the hourly price of the demand; Pmov-yr-mainland is the average final mainland price of the moving year. Ah(j) is the hourly pointing of the average final mainland price, obtained from an hourly matrix for each isolated system. Finally, Pmov-yr(j) is the average price of the variable costs in the NMS in a moving year, obtained from the weighted average of the monthly pointers in the NMS during the last 12 months.
PhDemand(j) = Pmov-yr-mainland × Ah(j)/Pmov-yr(j)
Unlike the previous system, the PhDemand(j) will be different in each subsystem (j). A notable aspect is that, since this RD came into effect in the non-mainland territories, the price of the electric energy depends on the moving average of the mainland OMIE prices in the 12 months previous to the dispatch of the supply, corrected by a pointer coefficient Ah. Therefore, this new reference rate takes into account the variation in the generation costs of every hour in each of the NMSs.
Lastly, in regard to the price of both generation activity and the extra cost in the isolated power systems of non-mainland territories, the following is noted. The final hourly time-of-generation price is determined by the quotient between the sum of adjustment and generation service costs in NMS generation plants and the total energy generated at the terminals (‘bus-bars’) before entering the grid.
The extra cost of generation activity in such systems is defined as the sum of the generation extra costs in each of the isolated systems—which can be calculated from the difference between generation and adjustment service costs—and the income derived from meeting the electricity demand, after subtracting the amounts intended to account for interruptibility and remuneration of the SO and OMIE.
4.3. Impact on the Purchase Price of the Demand
As mentioned earlier, the price of demand in the NMSs is made up differently from that in the mainland, where the price is still indexed to the market price (OMIE). After the implementation date of RD 738/2015, the base reference is the average market price of the OMIE time market during the 12 months previous to the commencement of supply.
On using a more stable reference, the volatility of the daily market-price derived from matching the supply and demand structures with seasonal influences will no longer be reflected in the demand acquisition prices in the NMS.
Until a historical database of the calculated pointers is published by the system operator, it will be too complicated to estimate variable Ah. Consequently, the current uncertainty concerning this will be reflected in the short-term in the bids made by the electricity marketing companies. In preparing this report, only data published during September were considered. Table 6 shows that, except for La Gomera, the Ph Demand price was less than the arithmetical average acquisition price on the mainland.
However, this does not mean that any future price configured by the electricity marketing companies will be lower for the NMS than for mainland sales, due to the higher costs. Without historical annual data, it is not possible to compare the price of purchasing demand prior to and after the RD came into force. Uncertainty over future variations in purchase prices is reflected in the offers of fixed prices from the marketing companies, as they incorporate risk premiums that then lead to higher priced bids.
Furthermore, it can be seen that the periodic price offers are configured taking into consideration pointer percentages different from those earlier than 1 September, which requires consulting the consumption profile. Figure 6 illustrates the differences between price pointing prior to the RD coming into force (in the mainland) and later when applied in September (subsystems). The differences between prices during peak and off-peak periods end up being reduced in all subsystems.
4.4. The Particular Case of the Hydro-Wind Plant on El Hierro: “Gorona del Viento”
We now attempt to analyze the new pricing methodology for the purchase and sale of energy in the case of the Canary Islands, with special emphasis on the island of El Hierro due to its power mix configuration since opening its wind-pumped hydro plant.
After the publication of Royal Decree 738/2015, a new pricing-matching methodology has been implemented, both in the purchase and in the sale of energy. Table 7 shows the evolution of the purchase price of energy in the subsystems that make up the Canary Islands’ electricity system.
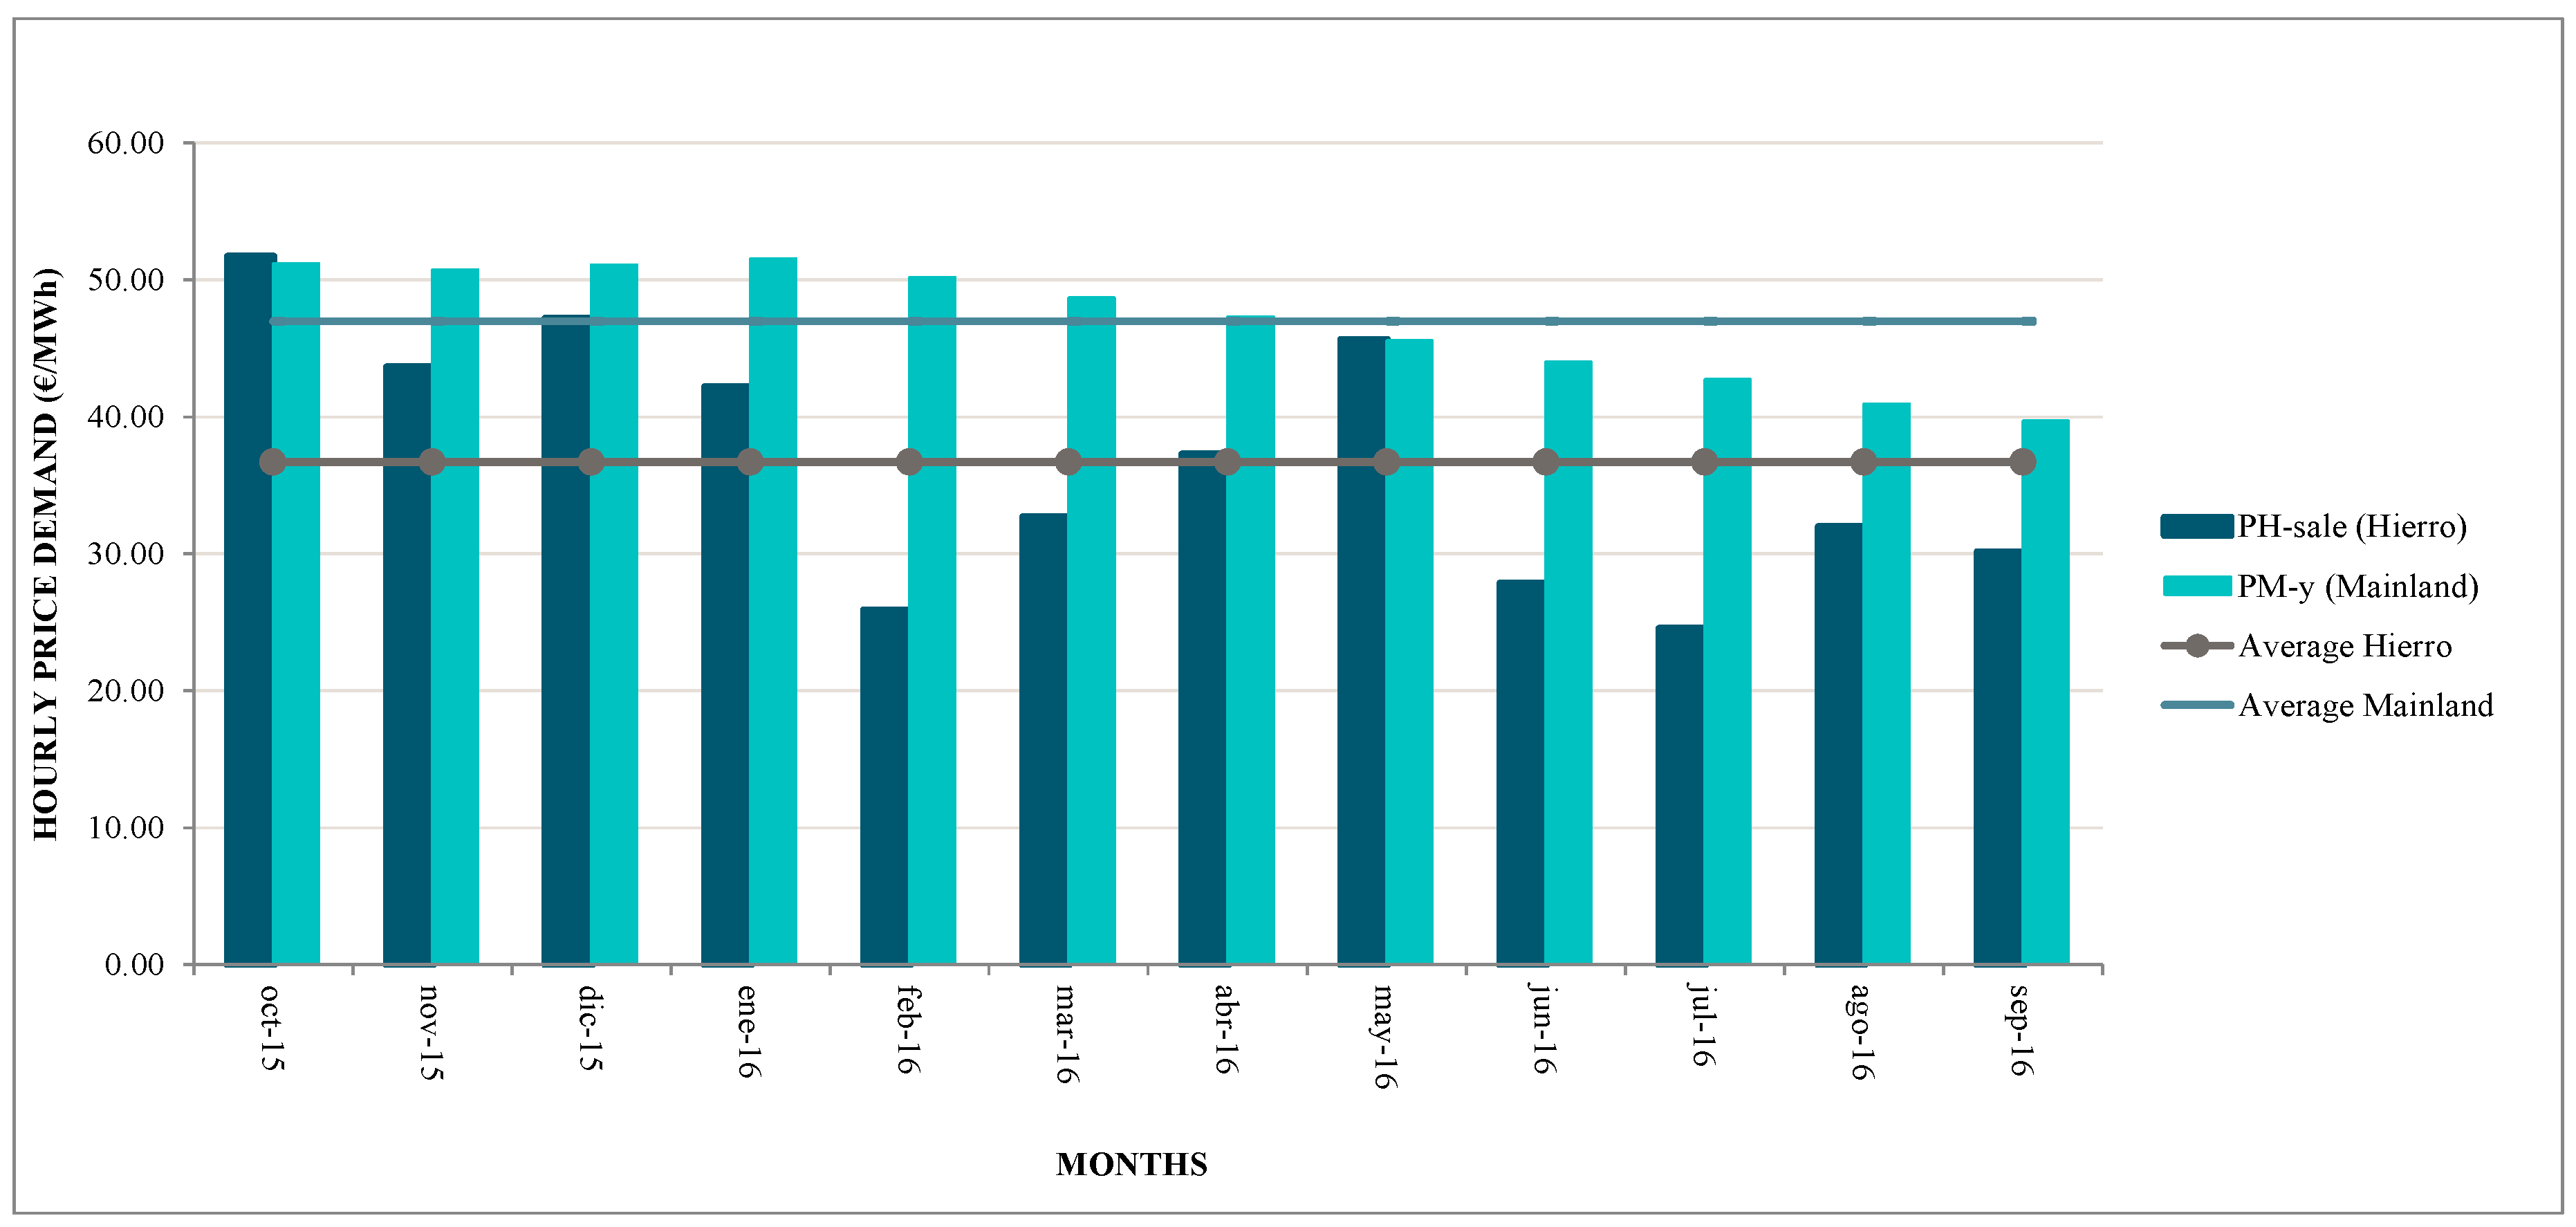
On the other hand, Table 8 presents the trends of the sale price of energy in the Canary Islands’ subsystems, comparing them with the annual mobile average of the mainland.
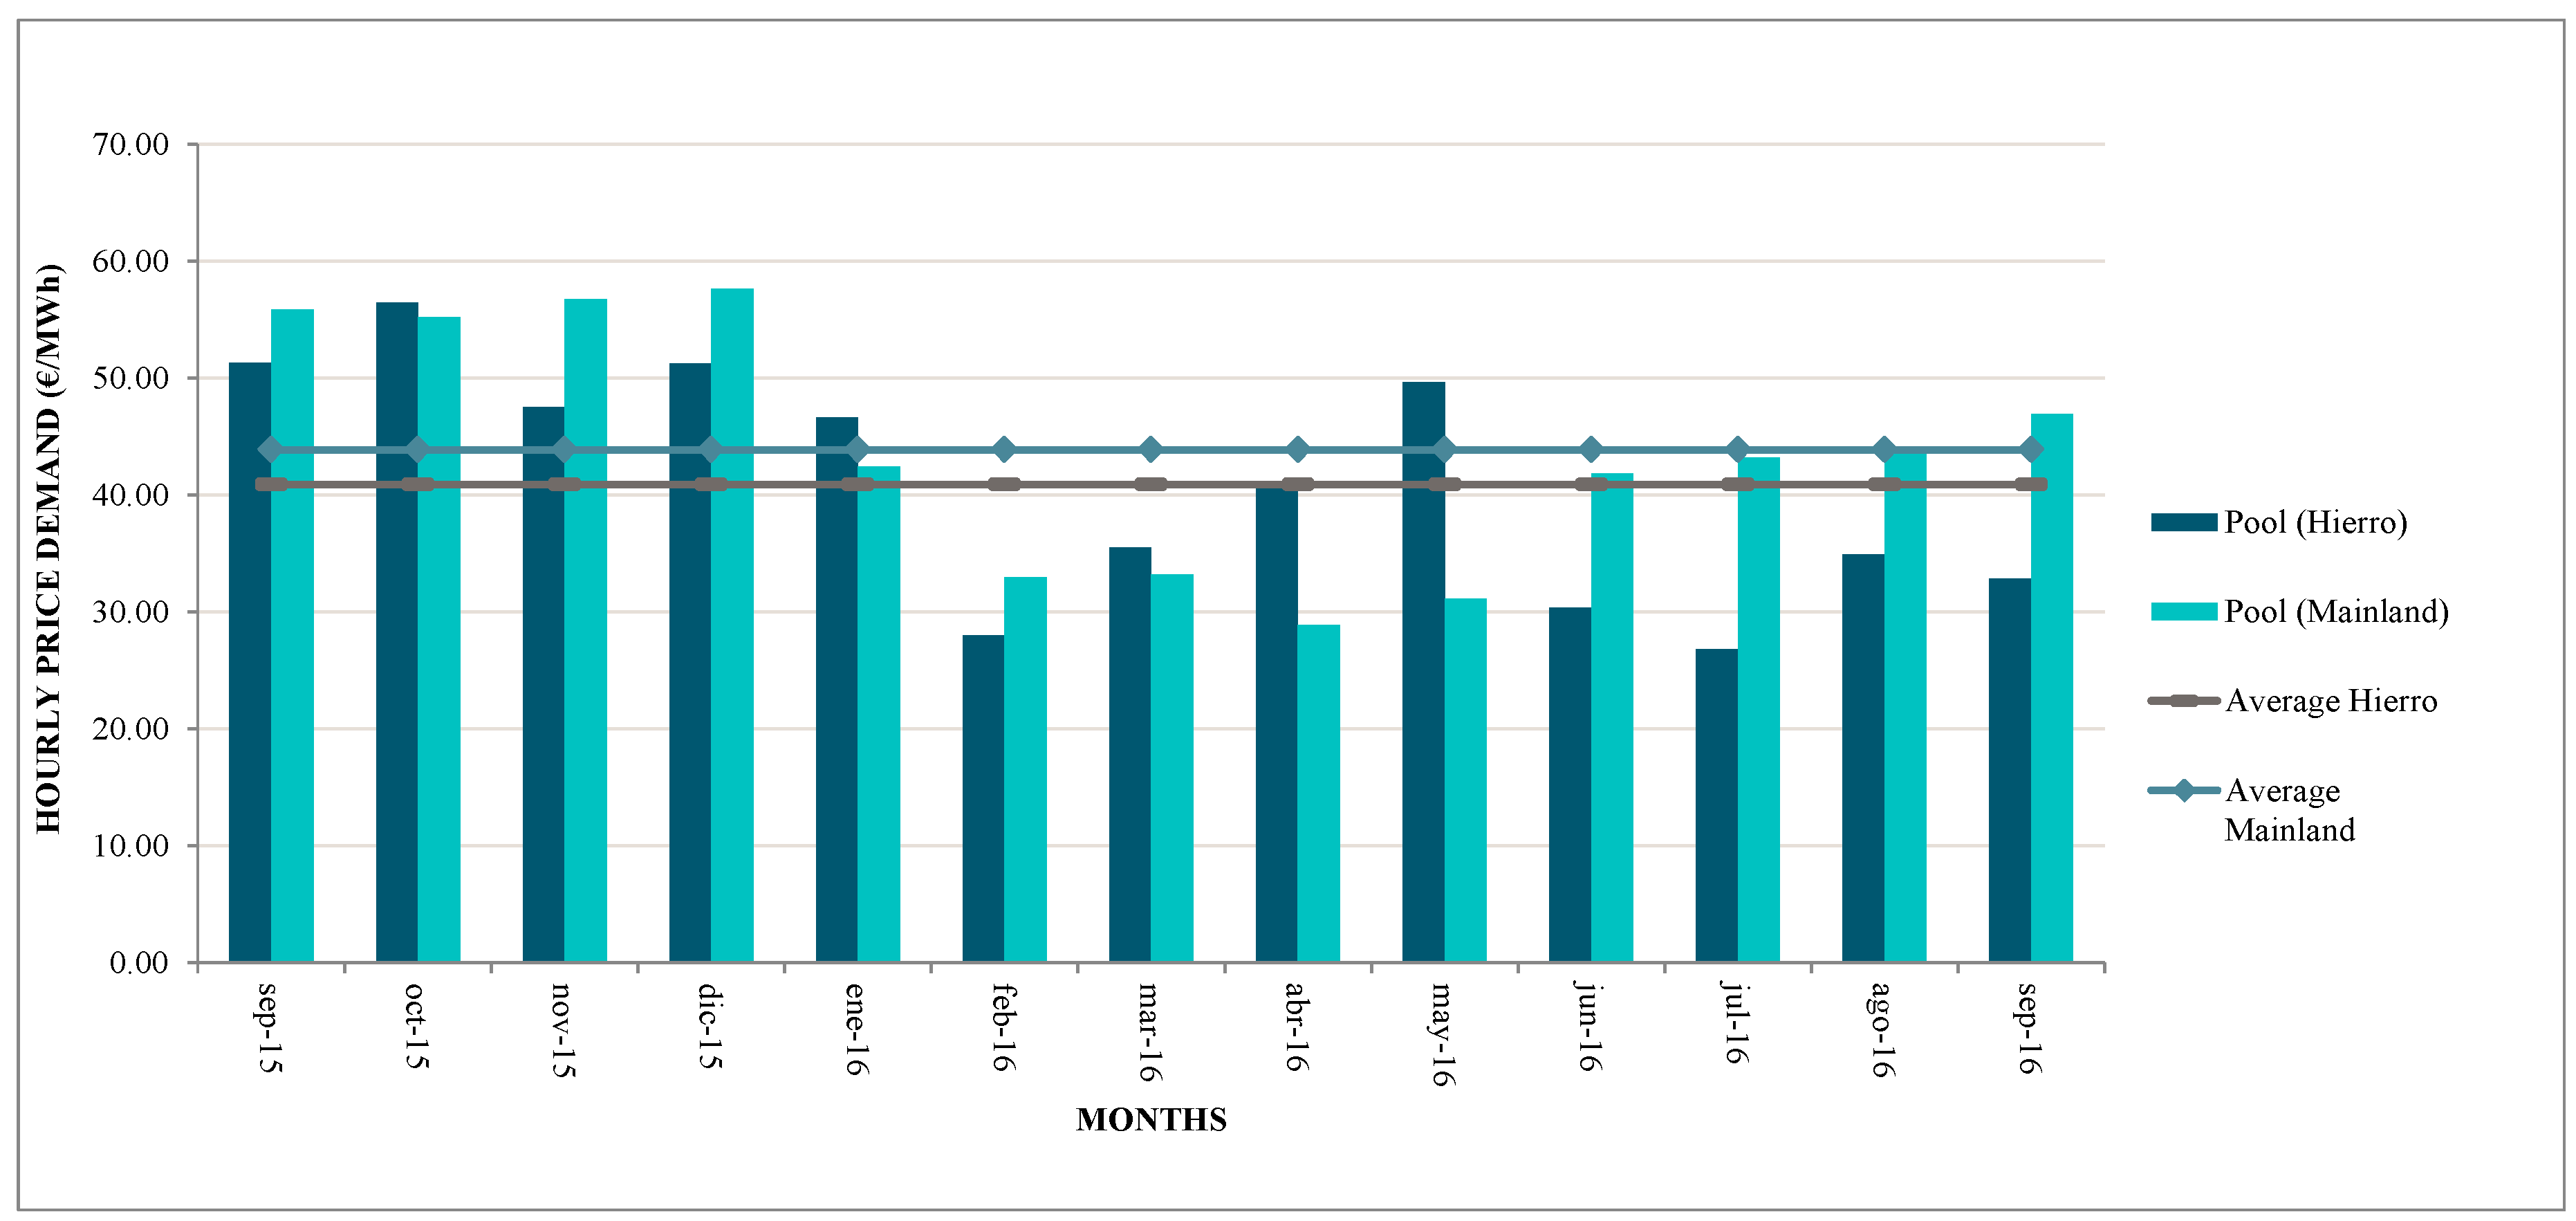
In both tables, the same trend is observed: El Hierro’s subsystem is one of the most volatile due to its specific power mix, substantially different from the rest. Figure 7 shows how the average price in El Hierro’s subsystem is below the market price on the mainland.
This trend is repeated in Figure 8: the selling price in the subsystem of El Hierro is lower than the average mainland price.
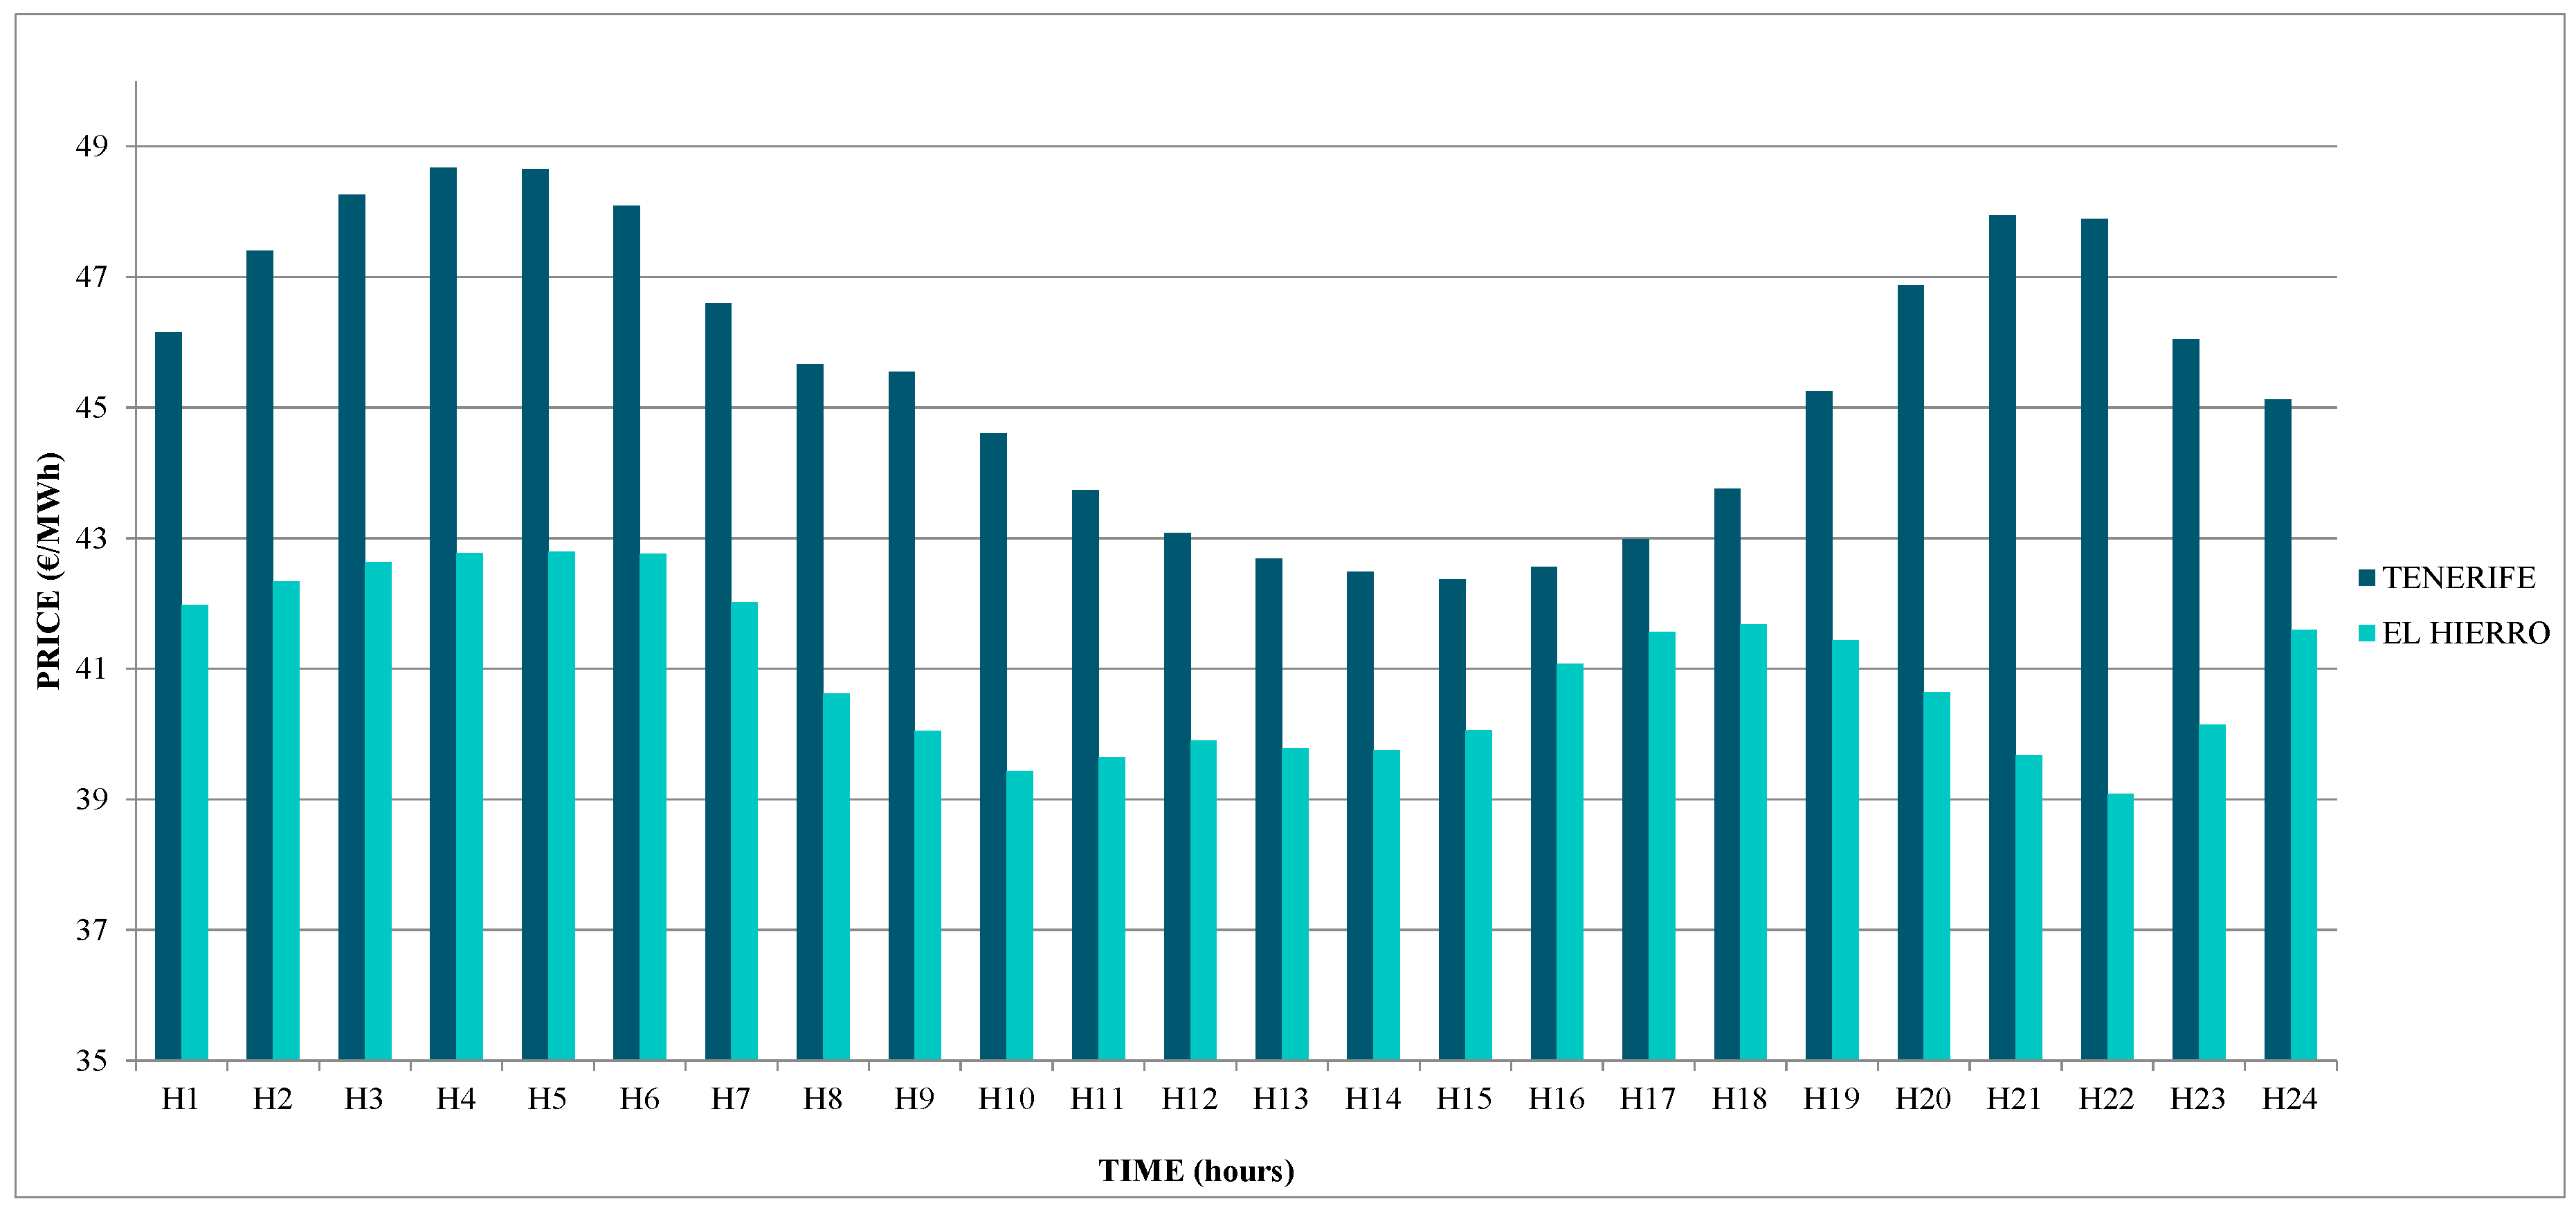
It is also interesting to compare the hourly price of demand in two Canary Islands’ subsystems. Tenerife was chosen since it is the provincial capital of the western Canary Islands, as shown in Figure 9. It can be observed that the price rises in the Tenerife subsystem during the earliest and latest hours of the day. This is because the generators that meet the demand are not working at their highest efficiency and, therefore, costs are higher at those times. However, in El Hierro, those hours coincide with the periods when there is a more frequent contribution of wind power, thus resulting in a lower price.
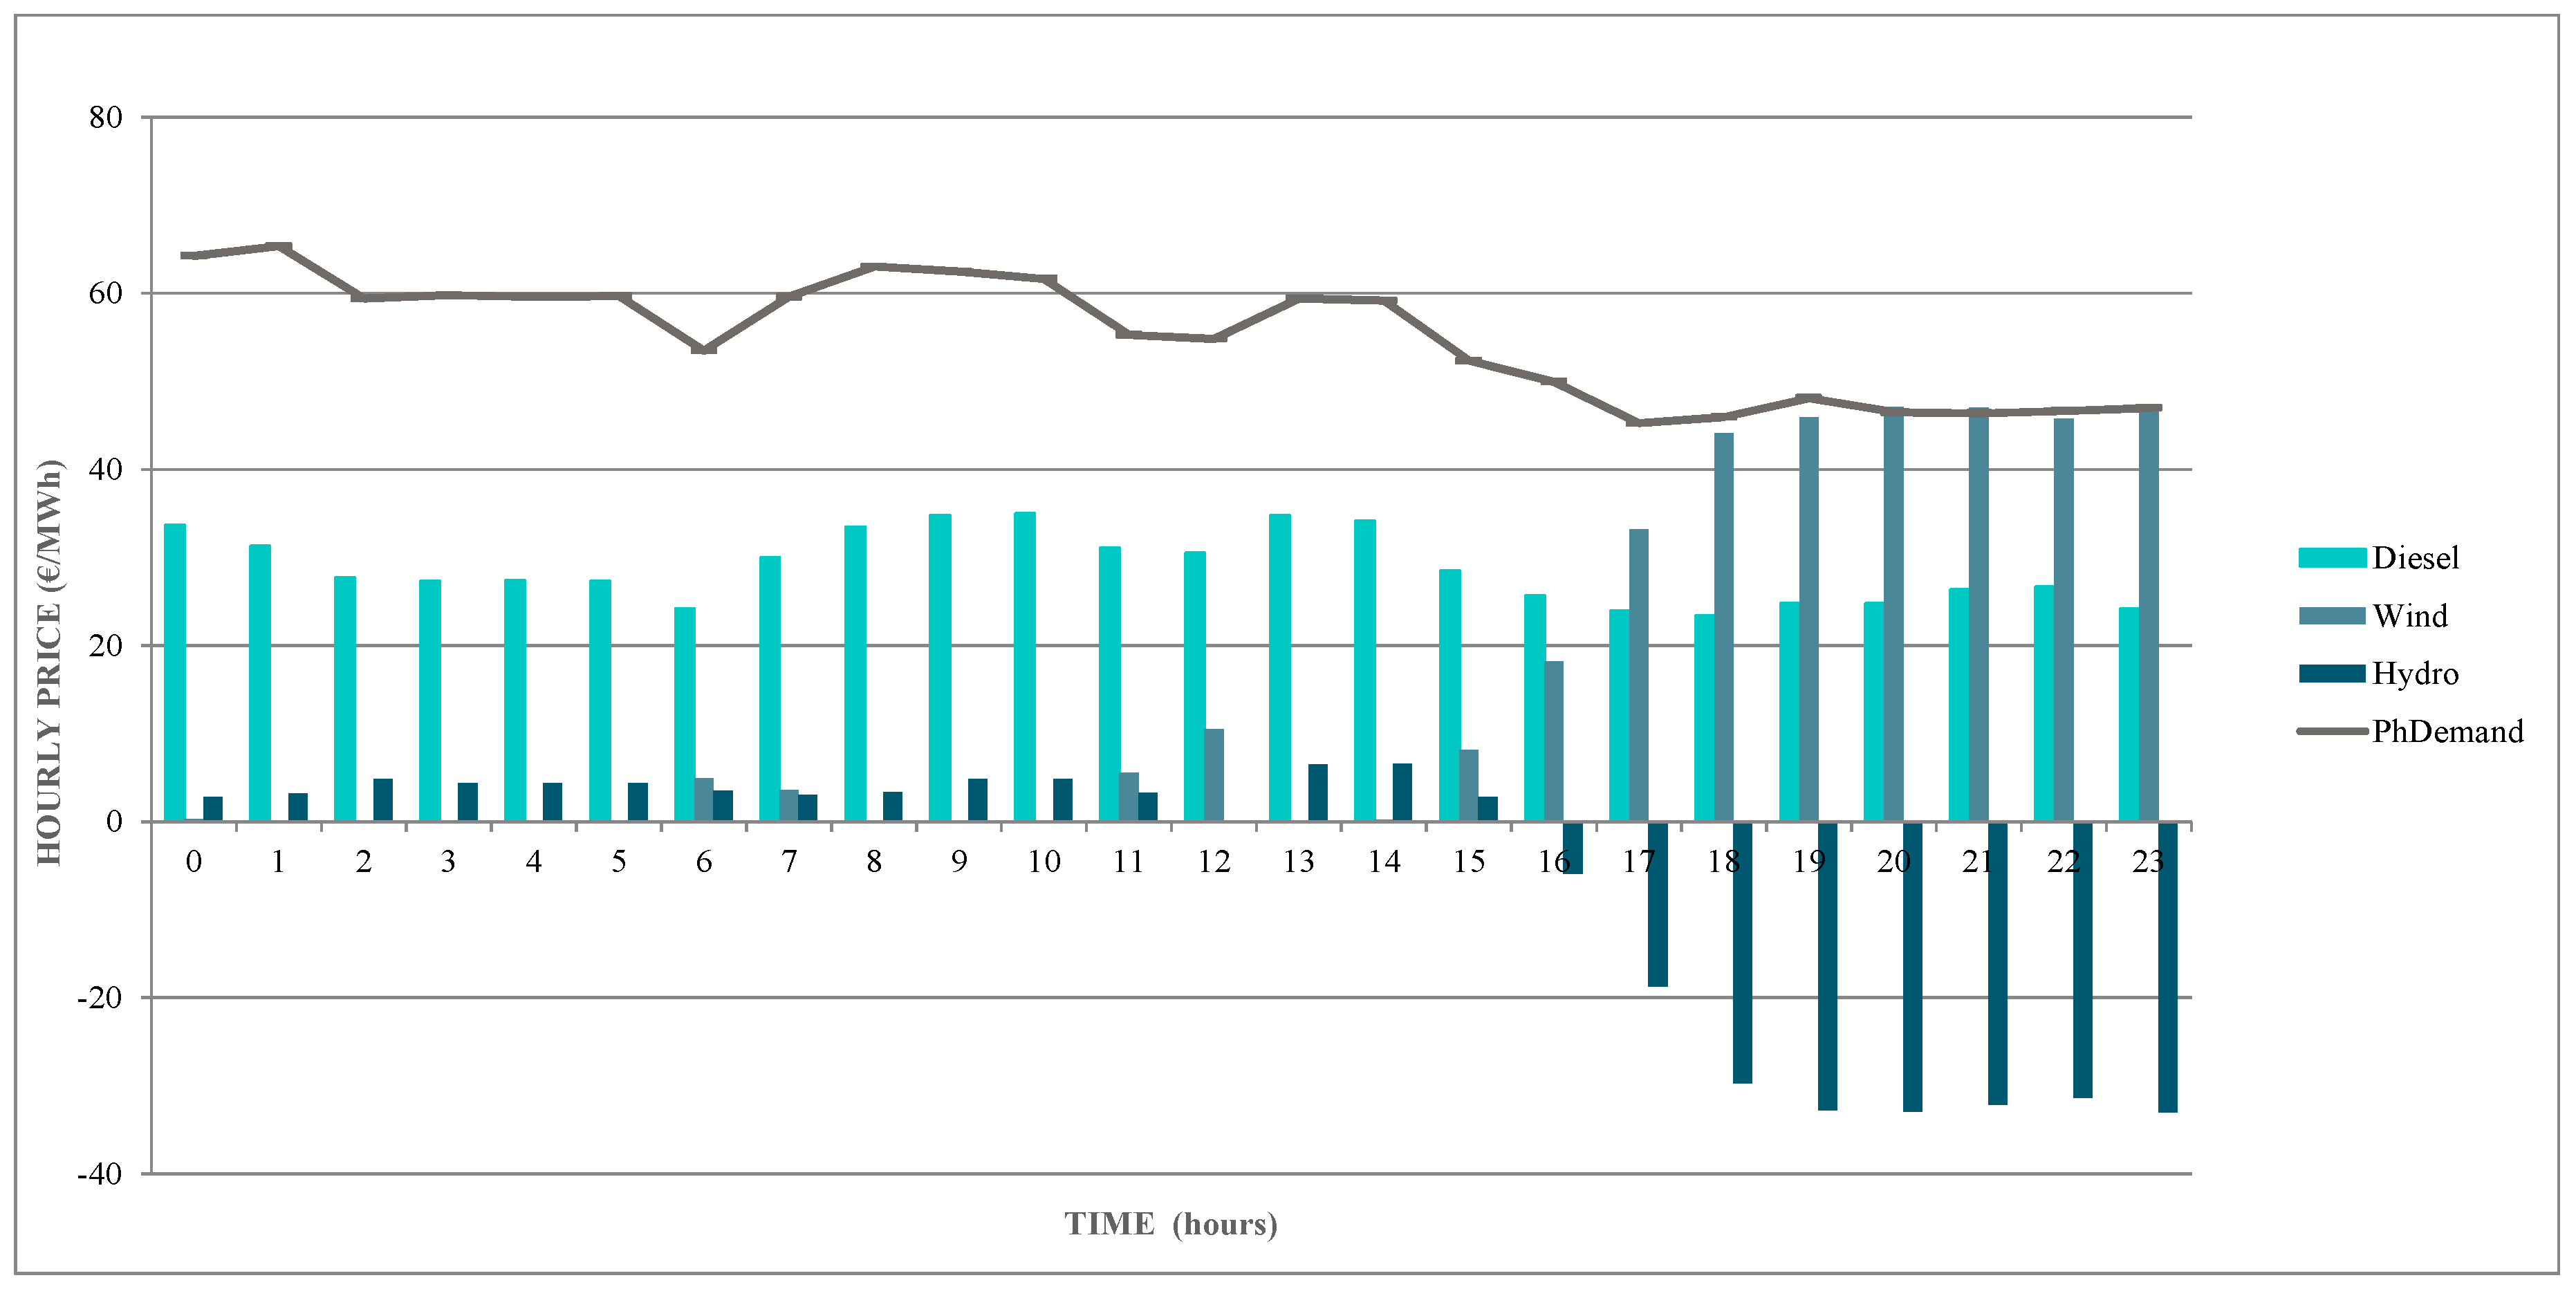
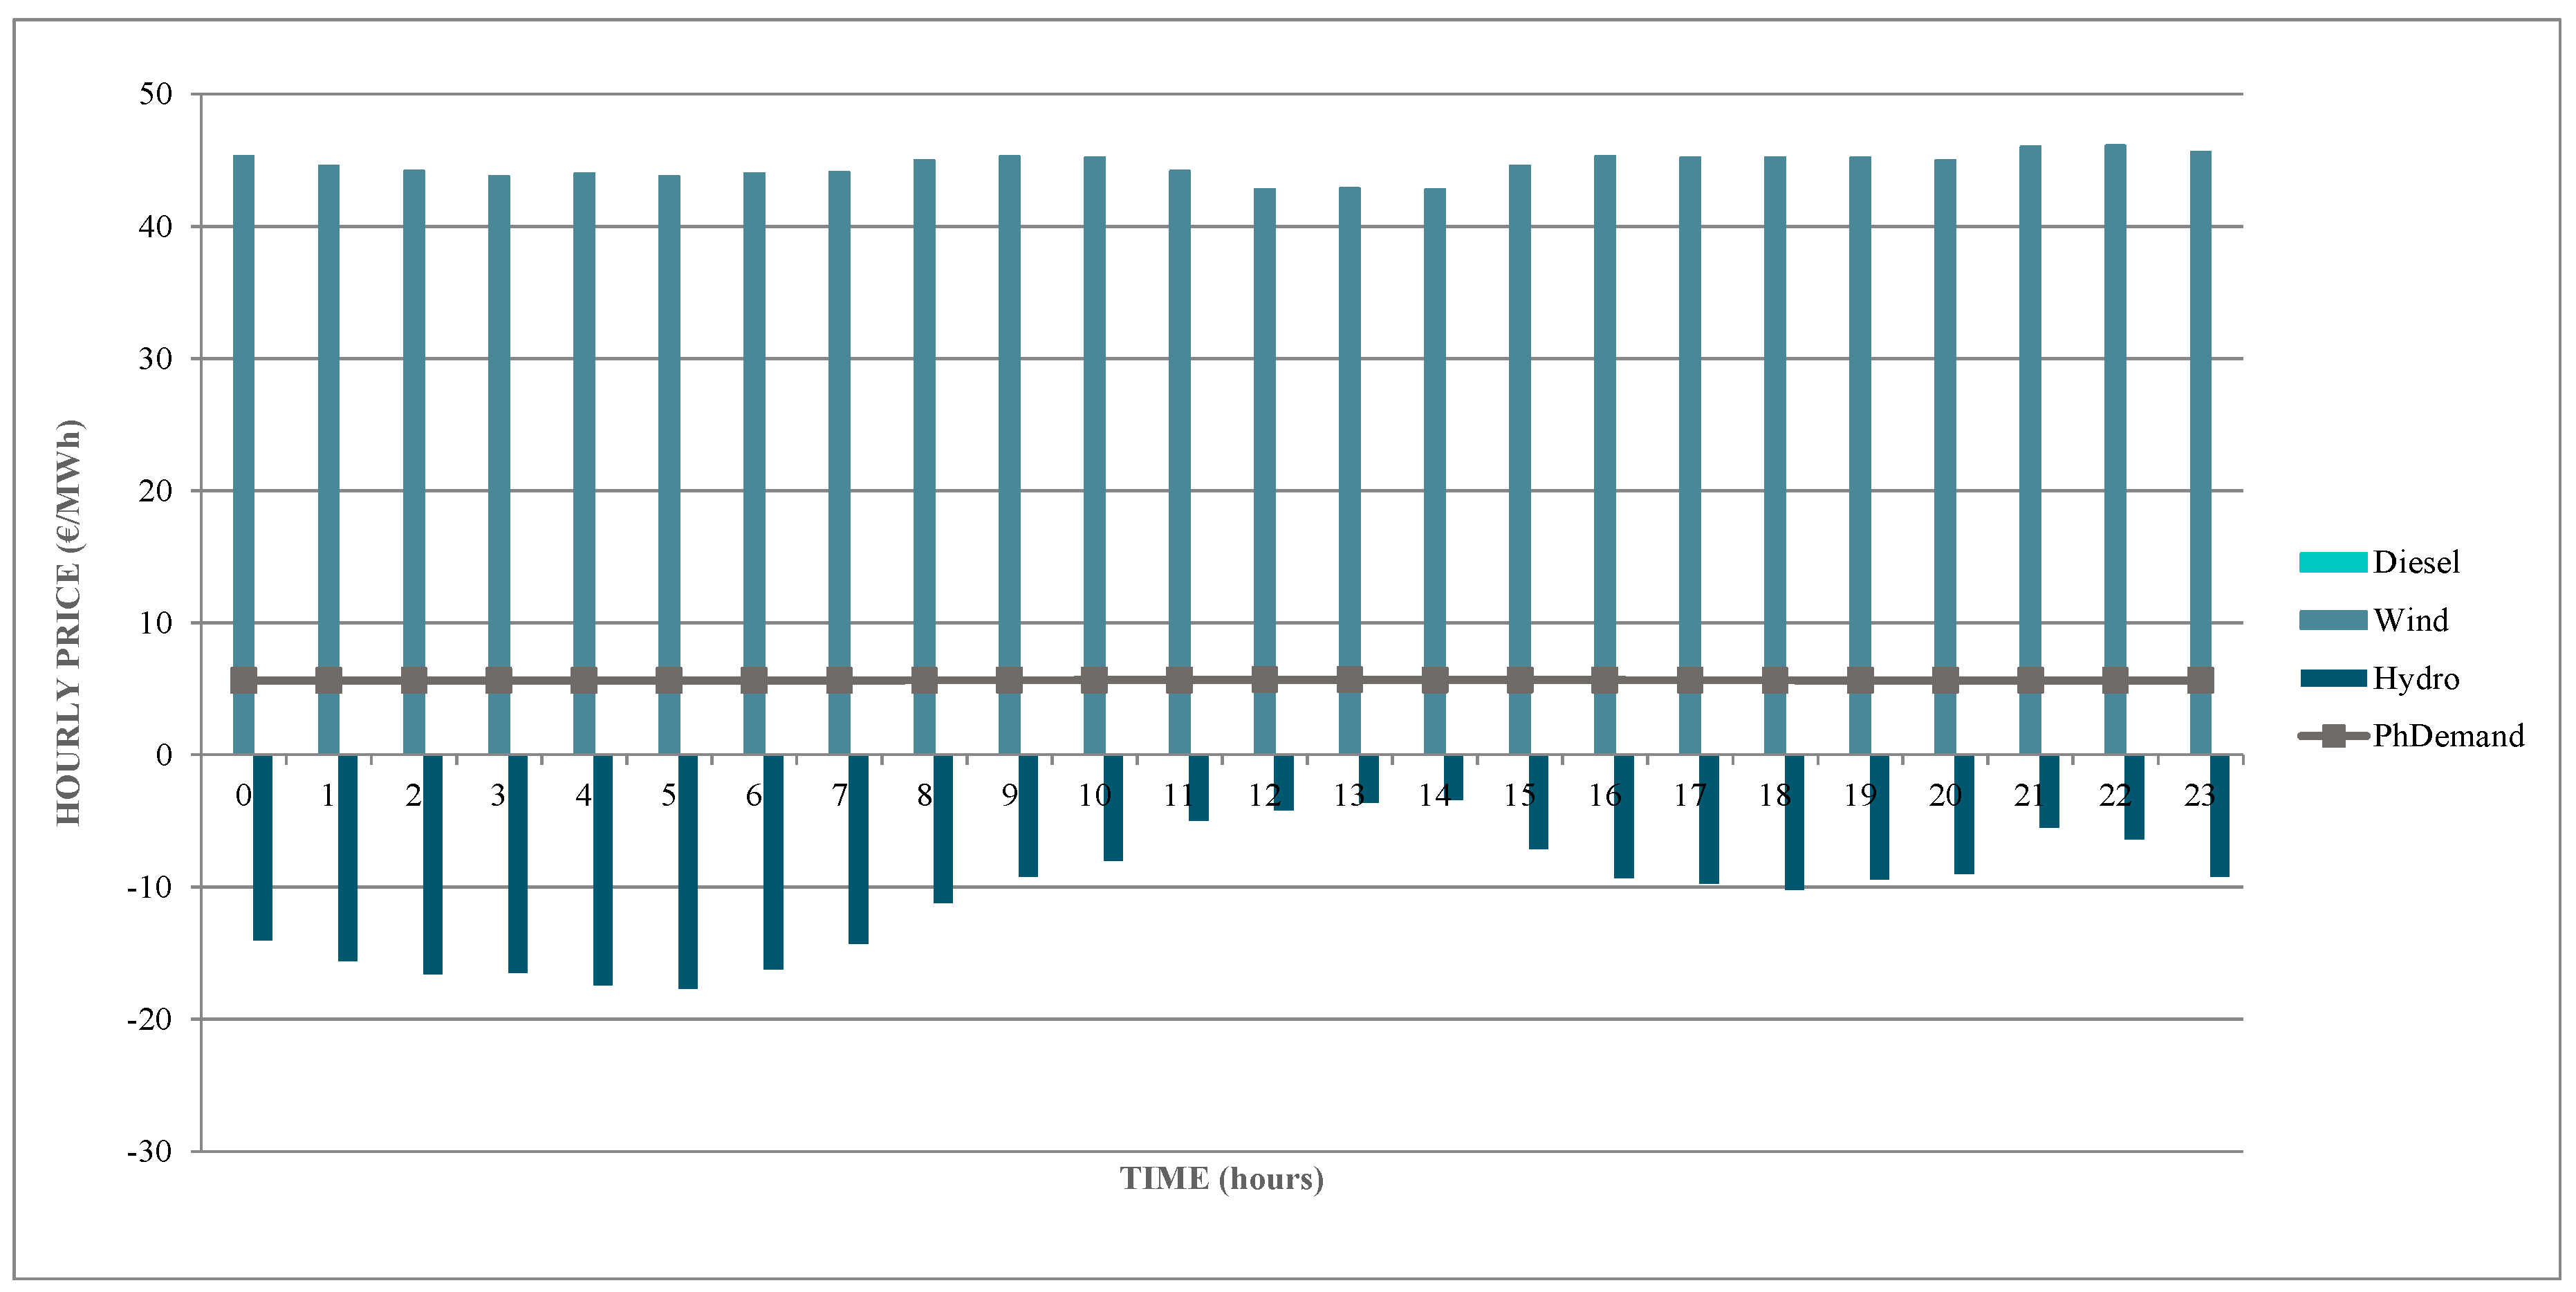
Lastly, in order to show in detail the influence of generation from the wind-pumped hydro plant, we have studied two days (10/August/2016 in Figure 10 and 16/August/2016 in Figure 11) with different energy source mixes, representing the technologies and the resulting price. As expected, the more wind-power energy generated, the lower the price in the subsystem.
Figure 11 illustrates that when wind-powered generation completely covers the demand, the purchase price is minimum. Thus, if Gorona del Viento did not exist, the generation cost on El Hierro would be substantially higher than the current cost, as can be confirmed in the historical series provided by the system operator.
4.5. The Self-Consumption Regime and Renewable Energy Market in Isolated Power Systems
The concept of self-consumption covers a wide range of energy consumption patterns generated locally from generation facilities connected inside the consumer network or through a direct line, either with a total consumption of that energy or with the existence of surpluses of the production facility that could be injected into the networks. Dehler et al. [33] explain that, to foster self-consumption, the national legal framework should be revisited. In this sense, Aragonés et al. [34] analyzed this regulation in Spain, and it is especially relevant to do the same in non-mainland subsystems, because there are many possibilities to implement self-consumption with renewable technology in the Canary Islands. Several specific examples of optimizing renewable energy self-consumption are explained in references [35,36,37]. Moreover, Kästel and Gilroy-Scott [38] explain that, when grid parity is achieved, high self-consumption levels cannot only be a source of cheaper electricity but can also protect the consumer against energy price inflation. This is a factor to be taken into account in the Canary Islands’ subsystems.
It is well known that, in Spain, the activity of electric power production has been characterized by a centralized generation scheme, which is unidirectional and complemented with measures of incentives and control of the performance of demand [39]. However, in recent years, the emergence of new concepts, developments, and systems of generation and control [40] are allowing the gradual evolution from this model to another where the generation of distributed electricity, usually small power, begins to integrate in the network as an element of efficiency, production, and management, and not just as a simple connection for the delivery of the electric energy produced [41].
In addition, this development is particularly attractive from an economic point of view in the NMSs, since the cost of generation is several times higher than in the mainland. Implementation of these facilities would likely reduce the cost of generation in those systems.
5. Discussion
A recent MIT study [42] reflects the need to understand how the greater penetration of self-consumption will affect regulation and current business models in the global electricity sector. It is shown that it is possible to reduce costs through a better use of the self-consumption regime. However, there is a need for an efficient implementation of the regulatory framework that regulates the electricity sector in the various regions of the country, which makes the correct implementation of these principles possible. In the case of renewable energies, as the MIT study concludes [42], the value of self-consumption, as the generation of photovoltaic origin and batteries, depends greatly on the geographical location of the facilities. That is why it is not possible to set a standard value for all distributed resources. In this sense, regulatory initiatives of the “Value of Solar” style are erroneous.
The RD 900/2015 for self-consumption, therefore, seeks to move towards a system of distributed generation through the sale of surplus mechanisms and instantaneous self-consumption to boost the individual production of energy in small power plants, for consumption in the same location, in those cases that are efficient for the entire electrical system. However, if we extrapolate studies that support that photovoltaic and battery installations are more efficient if they are developed on a large scale, the small scale is not always the best option and, therefore, these facilities may not be economically viable.
If we focus on the isolated systems of this study, we can observe how there are several conflicting points for the efficient development of the self-consumption regime. First, the specific regulation of self-consumption, in its fourth article, establishes the condition that the contracted power must be greater than or equal to the installed power of generation. In principle, this does not seem to give rise to storage, as it also limits certain types of facilities and their development, such as cogeneration or waste biodigesters that see their main activity constrained by this condition. Secondly, it is also unclear how the economic regime is related to the self-consumption grid, with specific regulatory regimes for these systems [30,31]. In this sense, it is necessary to develop specific regulations for NMSs beyond the one that exists for the mainland. Regarding the dispatch operations of wind-diesel hybrid generation systems, the MIT study [42] has to be taken into account. The results presented by Hu et al. [43], show that the proposed method has a better overall performance than the existing predefined dispatch strategies for practical implementations.
6. Conclusions
It is clearly necessary to encourage further studies that raise awareness of how important it is to support renewable energy technology, especially in these isolated environments where it is not easy to assure the security of supply. As other authors suggest, it is essential to transcend political barriers and vested interests regarding the electricity pool and its market. As an example of such problems, in the Canary Islands, the so-called Canary Energy Plan [44] has shown to be a conjunct of great challenges and good proposals, but it falls short of achieving its main objectives.
Due to the enforcement of this new legal framework, a new virtual market has been created for each isolated system, taking into consideration the prices of the moving year on the mainland and the generation costs. The new demand-matching method in the NMSs is reducing the volatility in the market and lowering risk, since 50% of the buying price composition is already known. The configuration of the prices in any buying modality must consider the system’s power-mix. Thus, prices should be configured according to the system where the energy is consumed. The uncoupling of the energy acquisition price from the hourly price bids in the OMIE could cause the commercializing companies a lack of liquidity when covering prices in future markets, hence, the risk premiums included in the contracts might be raised.
Those systems with more diverse generation technologies will create a wide monthly price variation, leading to greater uncertainty. Analyzing exclusively the month of September, it is observed that the subsystem that passes through the widest variations in its generation costs is El Hierro due to the impact of its power mix in relation to the demand to be met.
It is necessary to improve the regulatory framework in which the distribution companies operate, allowing new, more efficient, and innovative business models to be implemented. For example, incentives to improve quality, reduction of losses in networks (so important in isolated systems given their geographical peculiarities), interconnection times, and innovative aspects in R+D are key measures in this regard. Moreover, a review of the structure of the electricity sector should be carried out in order to minimize the appearance of potential conflicts of interest.
Regarding the energy pool market, in order to better integrate self-consumption and to reward flexibility by creating a level playing field for all technologies, it is necessary to propose an improvement in the design of the wholesale market—one that takes into account the flexibility of resources, the format of new needs, and, therefore, of new offers. Additionally, the connection of self-consumption systems, new intelligent applications (such as smart grids), and the greater complexity of the electricity markets reinforce the importance of having adequate information security systems. In other words, it is a question of reaching a framework that enables the electrical system to evolve efficiently in the isolated systems, in such a way as to facilitate the integration of all existing natural resources to contribute to an efficient supply of electricity.
Author Contributions
Both authors have participated directly in performing this research. M.U.-S., as a doctoral student in Industrial Management, has been responsible for gathering the relevant data, processing these data, and writing the original draft. C.R.-M., as his thesis director, has been responsible for the design of the research project and the supervision of its development.
Funding
There was no financial founding to support this research.
Conflicts of Interest
The authors declare no conflict of interest.
Abbreviations
| NMS | Non-Mainland Electricity System |
| ENP | Energy not provided |
| PENP | Percentage of energy not provided |
| REE | Red Eléctrica de España |
| OMIE | Operator of the Iberian Energy market |
| ATI | Average Time of Interruption |
| NFD | New demand forecast |
| SO | System Operator |
References
- Guerrero-Lemus, R.; González-Díaz, B.; Ríos, G.; Dib, R.N. Study of the new Spanish legislation applied to an insular system that has achieved grid parity on PV and wind energy. Renew. Sustain. Energy Rev. 2015, 49, 426–436. [Google Scholar] [CrossRef]
- Marrero, G.A.; Ramos-Real, F.J. Electricity generation cost in isolated systems: The complementarities of natural gas and renewables in the Canary Islands. Renew. Sustain. Energy Rev. 2010, 14, 2808–2818. [Google Scholar] [CrossRef]
- Mendoza-Vizcaino, J.; Sumper, A.; Sudria-Andreu, A.; Ramirez, J.M. Renewable technologies for generation systems in islands and their application to Cozumel Island, Mexico. Renew. Sustain. Energy Rev. 2016, 64, 348–361. [Google Scholar] [CrossRef]
- Fokaides, P.A.; Kulili, A. Toward grid parity in insular energy systems: The case of photovoltaics (PV) in Cyprus. Energy Policy 2013, 65, 223–228. [Google Scholar] [CrossRef]
- Kuang, Y.; Zhang, Y.; Zhou, B.; Li, C.; Cao, Y.; Li, L.; Zeng, L. A review of renewable energy utilization in islands. Renew. Sustain. Energy Rev. 2016, 59, 504–513. [Google Scholar] [CrossRef]
- Díaz, A.R.; Ramos-Real, F.J.; Marrero, G.A.; Perez, Y. Impact of Electric Vehicles as Distributed Energy Storage in Isolated Systems: The Case of Tenerife. Sustainability 2015, 7, 15152–15178. [Google Scholar] [CrossRef] [Green Version]
- Ley 24/2013, de 26 de Diciembre, del Sector Eléctrico. Boletín Oficial del Estado No. 310; de 27 de Diciembre de 2013. BOE-A-2013-13645. Available online: http://www.boe.es/boe/dias/2013/12/27/pdfs/BOE-A-2013-13645.pdf (accessed on 15 January 2016).
- Instituto Nacional de Estadística. Anuario Estadístico de España. 2007. Available online: http://www.ine.es/prodyser/pubweb/anuarios_mnu.htm (accessed on 10 May 2017).
- Rodríguez, M. Los sistemas eléctricos no peninsulares. Cuadernos de Energía 2014, 42, 5–12. [Google Scholar]
- Consejería de Economía, Industria, Comercio y Conocimiento. Anuario Energético de Canarias 2015. Gobierno de Canarias (2016). Available online: http://www.gobiernodecanarias.org/ceic/energia/doc/Publicaciones/AnuarioEnergeticoCanarias/ANUARIO-ENERGETICO-CANARIAS-2016.pdf (accessed on 26 June 2018).
- Ministerio de Industria, Energía y Turismo. Planificación Energética. Plan de Desarrollo de la red de Transporte de Energía 2015–2020 del Gobierno de España. 2015. Available online: http://www.mincotur.gob.es/energia/planificacion/Planificacionelectricidadygas/desarrollo2015-2020/Documents/Planificaci%C3%B3n%202015_2020%20%202016_11_28%20VPublicaci%C3%B3n.pdf (accessed on 8 December 2017).
- Merino, J.; Venganzones, C.; Sánchez, J.A.; Martínez, S.; Platero, C.A. Power system stability of a small sized isolated network supplied by a combined wind-pumped storage generation system: A case study in the Canary Islands. Energies 2012, 5, 2351–2369. [Google Scholar] [CrossRef] [Green Version]
- Gils, H.C.; Simon, S. Carbon neutral archipelago—100% renewable energy supply for the Canary Islands. Energy Procedia 2017, 188, 342–355. [Google Scholar] [CrossRef]
- Schallenberg-Rodríguez, J.; García Montesdeoca, N. Spatial planning to estimate the offshore wind energy potential in coastal regions and islands. Practical case: The Canary Islands. Energy 2018, 143, 91–103. [Google Scholar] [CrossRef]
- Guerrero-Lemus, R.; González-Díaz, B.; De la Nuez, I. Rebuttal letter to the article entitled: “Spatial planning to estimate the offshore wind energy potential in coastal regions and islands. Practical case: The Canary Islands”. Energy 2018, 153, 12–16. [Google Scholar] [CrossRef]
- Red Eléctrica de España, S.A. Estadísticas e Informes del Sistema Eléctrico. Available online: http://www.ree.es/es/estadisticas-del-sistema-electrico-espanol/informe-anual (accessed on 12 April 2018).
- Noussan, M.; Roberto, R.; Nastasi, B. Performance Indicators of Electricity Generation at Country Level—The Case of Italy. Energies 2018, 11, 650. [Google Scholar] [CrossRef]
- Ministry of Industries and Innovation. The Icelandic National Renewable Energy Action Plan for the Promotion of the Use of Energy from Renewable Sources in Accordance with Directive 2009/28/EC and the Commission Decision of 30 June 2009 on a Template for the National Renewable Energy Action Plans; Ministry of Industries and Innovation: Reykjavík, Iceland, 2014.
- European Union. Directive 96/92/EC of the European Parliament and of the Council of 19 December 1996 Concerning Common Rules for the Internal Market in Electricity; Official Journal of the European Union 30/01/1997; OJ L027:20; European Union: Brussels, Belgium, 1996. [Google Scholar]
- Leiva, J.; Palacios, A.; Aguado, J.A. Smart metering trends, implications and necessities: A policy review. Renew. Sustain. Energy Rev. 2016, 55, 227–233. [Google Scholar] [CrossRef]
- Ciarreta, A.; Espinosa, M.P.; Pizarro-Irizar, C. Is green energy expensive? Empirical evidence from the Spanish electricity market. Energy Policy 2014, 69, 205–215. [Google Scholar] [CrossRef]
- Ciarreta, A.; Nasirov, S.; Silva, C. The development of market power in the Spanish power generation sector: Perspectives after market liberalization. Energy Policy 2016, 96, 700–710. [Google Scholar] [CrossRef]
- Ley 54/1997, de 27 de Noviembre, del Sector Eléctrico. Boletín Oficial del Estado No. 285; de 28 de Noviembre de 1997. BOE-A-1997-25340. Available online: http://www.boe.es/boe/dias/1997/11/28/pdfs/A35097-35126.pdf (accessed on 15 January 2018).
- Real Decreto-Ley 13/2012, de 30 de Marzo, por el que se Transponen Directivas en Materia de Mercados Interiores de Electricidad y gas y en Materia de Comunicaciones Electrónicas, y por el que se Adoptan Medidas para la Corrección de las Desviaciones por Desajustes entre los costes e Ingresos de los Sectores Eléctrico y Gasista. Boletín Oficial del Estado No. 78; de 31 de Marzo de 2012. BOE-A-2012-4442. Available online: http://www.boe.es/boe/dias/2012/03/31/pdfs/BOE-A-2012-4442.pdf (accessed on 30 June 2018).
- European Union. Directive 2009/72/EC of the European Parliament and of the Council of 13 July 2009 Concerning Common Rules for the Internal Market in Electricity and Repealing Directive 2003/54/EC; Official Journal of the European Union 14/11/2012; OJ L315:1; European Union: Brussels, Belgium, 2009. [Google Scholar]
- Real Decreto-Ley 20/2012, de 13 de julio, de Medidas para Garantizar la Estabilidad Presupuestaria y de Fomento de la Competitividad. Boletín Oficial del Estado No. 168; de 14 de Julio de 2012. BOE-A-2012-9364. Available online: http://www.boe.es/boe/dias/2012/07/14/pdfs/BOE-A-2012-9364.pdf (accessed on 25 June 2018).
- Real Decreto-Ley 1/2012, de 27 de Enero, por el que se Procede a la Suspensión de los Procedimientos de Preasignación de Remuneración y a la Supresión de los Incentivos Económicos para Nuevas Instalaciones de Producción de Energía Eléctrica a partir de Cogeneración, Fuentes de Energía Renovables y Residuos. BOE-A-2012-1310. Available online: https://www.boe.es/diario_boe/verifica.php?c=BOE-A-2012-1310&acc=Verificar&fix_bug_chrome=foo.pdf (accessed on 30 June 2018).
- Ley 17/2013, de 30 de Octubre de 2013, para la Garantía del Suministro e Incremento de la Competencia en los Sistemas Eléctricos Insulares y Extrapeninsulares. Boletín Oficial del Estado No. 260; de 30 de Octubre de 2013. BOE-A-2013-11332. Available online: http://www.boe.es/boe/dias/2013/10/30/pdfs/BOE-A-2013-11332.pdf (accessed on 20 May 2018).
- Real Decreto-Ley 9/2013, de 12 de Julio, por el que se Adoptan Medidas Urgentes para Garantizar la Estabilidad Financiera del Sistema Eléctrico. Boletín Oficial del Estado No. 167, de 13 de Julio de 2013. BOE-A-2013-7705. Available online: http://www.boe.es/boe/dias/2013/07/13/pdfs/BOE-A-2013-7705.pdf (accessed on 20 May 2018).
- Real Decreto 413/2014, de 6 de junio, por el que se Regula la Actividad de Producción de Energía Eléctrica a Partir de Fuentes de Energía Renovables, Cogeneración y Residuos. Boletín Oficial del Estado No. 140; de 10 de Junio de 2014. BOE-A-2014-6123. Available online: http://www.boe.es/boe/dias/2014/06/10/pdfs/BOE-A-2014-6123.pdf (accessed on 30 June 2018).
- Real Decreto 738/2015, de 31 de Julio, por el que se Regula la Actividad de Producción de Energía Eléctrica y el Procedimiento de Despacho en los Sistemas Eléctricos de los Territorios no Peninsulares. Boletín Oficial del Estado No. 183; de 1 de agosto de 2015. BOE-A-2015-8646. Available online: http://www.boe.es/boe/dias/2015/08/01/pdfs/BOE-A-2015-8646.pdf (accessed on 30 June 2018).
- European Union. Directive 2012/27/EU of the European Parliament and of the Council of 25 October 2012 on Energy Efficiency, Amending Directives 2009/125/EC and 2010/30/EU and Repealing Directives 2004/8/EC and 2006/32/EC; Official Journal of the European Union 14/11/2012; OJ L315:1; European Union: Brussels, Belgium, 2012. [Google Scholar]
- Dehler, J.; Keles, D.; Telsnig, T.; Fleischer, B.; Baumann, M.; Fraboulet, D.; Faure-Schuyer, A.; Fichtner, W. Chapter 27—Self-Consumption of electricity from renewable sources. In Europe’s Energy Transition. Insights for Policy Making; Academic Press: Cambridge, MA, USA, 2017; pp. 225–236. [Google Scholar]
- Aragonés, V.; Barquín, J.; Alba, J. The new Spanish self-consumption regulation. Energy Procedia 2016, 106, 245–257. [Google Scholar] [CrossRef]
- Martín-Chivelet, N.; Montero-Gómez, D. Optimizing photovoltaic self-consumption in office buildings. Energy Build. 2017, 150, 71–80. [Google Scholar] [CrossRef]
- Calpa, M.; Castillo-Cagigal, M.; Matallanas, E.; Caamaño-Martín, E.; Gutiérrez, A. Effects of large-scale PV self-consumption on the aggregated consumption. Procedia Comput. Sci. 2016, 83, 816–823. [Google Scholar] [CrossRef] [Green Version]
- Lang, T.; Ammann, D.; Girod, B. Profitability in absence of subsidies: A techno-economic analysis of rooftop photovoltaic self-consumption in residential and commercial buildings. Renew. Energy 2016, 87, 77–87. [Google Scholar] [CrossRef]
- Kästel, P.; Gilroy-Scott, B. Economics of pooling small local electricity prosumers-LCOE & self-consumption. Renew. Sustain. Energy Rev. 2015, 51, 718–729. [Google Scholar]
- Real Decreto 900/2015, de 9 de Octubre, por el que se Regulan las Condiciones Administrativas, Técnicas y Económicas de las Modalidades de Suministro de Energía Eléctrica con Autoconsumo y de Producción con Autoconsumo. Boletín Oficial del Estado No. 243; de 10 de Octubre de 2014. BOE-A-2015-10927. Available online: http://www.boe.es/boe/dias/2015/10/10/pdfs/BOE-A-2015-10927.pdf (accessed on 30 June 2018).
- Thornton, A.; Rodríguez Monroy, C. Distributed power generation in the United States. Renew. Sustain. Energy Rev. 2011, 15, 4809–4817. [Google Scholar] [CrossRef] [Green Version]
- David, V.; Yanosek, K. The Next Energy Revolution. Foreign Affairs, 24 June 2017. [Google Scholar]
- MIT. Utility of the Future. An MIT Energy Initiative Response to an Industry in Transition; MIT: Cambridge, MA, USA, 2016. [Google Scholar]
- Hu, Y.; Morales, J.M.; Pineda, S.; Sánchez, M.J.; Solana, P. Dynamic multi-stage dispatch of isolated wind–diesel power systems. Energy Convers. Manag. 2015, 103, 605–615. [Google Scholar] [CrossRef]
- Revisión PECAN 2006–2015. Dirección General de Industria del Gobierno de Canarias. Las Palmas de Gran Canaria. 2012. Available online: http://www.gobiernodecanarias.org/ceic/energia/doc/planificacion/pecan/DOCUMENTO_REVISION_PECAN2006.pdf (accessed on 30 June 2018).
Figure 1.
Location of thermal power plants in the Canary Islands [10].
Figure 1.
Location of thermal power plants in the Canary Islands [10].

Figure 2.
Generation costs of the Iberian system vs. the Canary Islands [Source: authors].

Figure 3.
Demand curves based on diverse configurations [Source: authors].

Figure 4.
Technological structure for power generation in the Canary NMS [10].
Figure 4.
Technological structure for power generation in the Canary NMS [10].

Figure 5.
Percentage participation of different electrical energy sources in the European context [10].
Figure 5.
Percentage participation of different electrical energy sources in the European context [10].

Figure 6.
Time points of periodical prices using Royal Decree [Source: authors].

Figure 7.
Fluctuation in the PhDemand in El Hierro vs. the mainland [Source: authors].

Figure 8.
Fluctuation in Phsale in El Hierro vs. that on the mainland [Source: authors].

Figure 9.
Average PhDemand fluctuations on El Hierro vs. Tenerife [Source: authors].

Figure 10.
Hourly price fluctuations vs. demand according to energy source mix 10/August/2016 [Source: authors].
Figure 10.
Hourly price fluctuations vs. demand according to energy source mix 10/August/2016 [Source: authors].

Figure 11.
Hourly price fluctuations with the Gorona del Viento plant in operation: 16/August/2016 [Source: authors].
Figure 11.
Hourly price fluctuations with the Gorona del Viento plant in operation: 16/August/2016 [Source: authors].


Table 1.
Installed capacity and power plants in each electrical power subsystem [9].
Table 1.
Installed capacity and power plants in each electrical power subsystem [9].
| Subsystem | Installed Capacity (MW) | Number of Plants | Average Size (MW) |
|---|---|---|---|
| Melilla | 94 | 8 | 12 |
| Ceuta | 98 | 10 | 10 |
| La Palma | 105 | 11 | 10 |
| El Hierro | 15 | 9 | 2 |
| La Gomera | 21 | 10 | 2 |
| Tenerife | 1046 | 23 | 46 |
| Gran Canaria | 999 | 20 | 50 |
| Lanzarote–Fuerteventura | 419 | 25 | 17 |
| Mallorca–Menorca | 1944 | 32 | 61 |
| Ibiza–Formentera | 331 | 16 | 21 |
| Total NMS | 5074 | 164 | 31 |
| Total Mainland | 54,692 | 190 | 336 |
Table 2.
Objective reserve margins [11].
Table 2.
Objective reserve margins [11].
| Subsystem | Reserve Margin (%) | CI |
|---|---|---|
| Melilla | 90 | 1.90 |
| Ceuta | 80 | 1.80 |
| La Palma | 80 | 1.80 |
| El Hierro | 80 | 1.80 |
| La Gomera | 80 | 1.80 |
| Tenerife | 50 | 1.50 |
| Gran Canaria | 50 | 1.50 |
| Lanzarote | 60 | 1.60 |
| Fuerteventura | 70 | 1.70 |
| Mallorca | 40 | 1.40 |
| Menorca | 80 | 1.80 |
| Ibiza–Formentera | 50 | 1.50 |
| Mainland | 10 | 1.10 |
Table 3.
Contribution of different power sources to the Canary non-mainland system (NMS) (MW) [10].
Table 3.
Contribution of different power sources to the Canary non-mainland system (NMS) (MW) [10].
| Primary Energy Sources | Gran Canaria | Tenerife | Lanzarote | Fuerteventura | La Palma | La Gomera | El Hierro | Canary Islands | % of Total |
|---|---|---|---|---|---|---|---|---|---|
| Petroleum Derivatives | |||||||||
| Thermal power stations | 999.2 | 1046.5 | 232.3 | 187.0 | 105.3 | 21.2 | 14.9 | 2606.4 | 85.1 |
| Refinery | - | 25.9 | - | - | - | - | - | 25.9 | 0.80 |
| Cogeneration | 24.9 | 39.2 | - | - | - | - | - | 64.1 | 2.10 |
| Total oil derivatives | 1024.1 | 1111.6 | 232.3 | 187.0 | 105.3 | 21.2 | 14.9 | 2696.4 | 88.0 |
| Renewable Sources | |||||||||
| Wind | 88.1 | 36.7 | 13.4 | 13.1 | 7.0 | 0.4 | - | 158.6 | 5.18 |
| Photovoltaic | 40.0 | 115.0 | 7.8 | 13.1 | 4.6 | 0.04 | 0.03 | 180.5 | 5.90 |
| Small-scale Hydro | - | 1.2 | - | - | 0.8 | - | - | 2.0 | 0.07 |
| Hydro-wind | - | - | - | - | - | - | 22.8 | 22.8 | 0.75 |
| Biogas (landfill) | - | 1.6 | 2.1 | - | - | - | - | 3.7 | 0.10 |
| Total renewable sources | 128.1 | 154.5 | 23.3 | 26.2 | 12.4 | 0.4 | 22.9 | 367.7 | 12.0 |
| Total | 1152.2 | 1266.1 | 255.6 | 213.2 | 117.7 | 21.6 | 37.8 | 3064.0 | 100 |
Table 4.
Quality of the electricity transportation network [16]. Abbreviations: ENP: energy not provided; PENP: percentage of the energy not provided; ATI: average time of interruption.
Table 4.
Quality of the electricity transportation network [16]. Abbreviations: ENP: energy not provided; PENP: percentage of the energy not provided; ATI: average time of interruption.
| Mainland | Balearic I. | Canary I. | Mainland | Balearic I. | Canary I. | |
|---|---|---|---|---|---|---|
| ENP (MWh)|PENP (%) | ATI (min) | |||||
| 2012 | 133|2.21 | 7|1.93 | 224|1.09 | 0.28 | 0.68 | 13.25 |
| 2013 | 1156|1.80 | 81|2.03 | 72|1.70 | 2.47 | 7.50 | 4.38 |
| 2014 | 204|1.81 | 13|1.99 | 148|1.63 | 0.44 | 1.21 | 9.04 |
| 2015 | 53|2.06 | 29|3.12 | 150|3.26 | 0.11 | 2.66 | 9.08 |
| 2016 | 78|1.67 | 0.3|3.07 | 457|1.93 | 0.16 | 0.03 | 27.45 |
Table 5.
Regulatory modifications of the regulatory framework of the NMSs in Spain.
| Date | Legislation | Status | Modified Aspects in the NMS | Ref |
|---|---|---|---|---|
| 27/Nov/1997 | L 54/1997 | A | Recognizes the necessity of a singular regulation according to location | [23] |
| 01/Jan/2012 | RDL 1/2012 | C | Freezes the premium for new installations in the special regime | [27] |
| 30/Mar/2012 | RDL 13/2012 | C | Correction of the remuneration of the generation activity | [24] |
| 13/July/2012 | RDL 20/2012 | C | Establishment of costs of generation in the ordinary regime | [26] |
| 29/Oct/2013 | L 17/2013 | C | Mechanism suspension of costs compensation | [28] |
| 13/July/2013 | L 9/2013 | C | Finance of the extra cost of generation | [29] |
| 26/Dec/2013 | L 24/2013 | C | Recognition of the extra cost connected to singularity | [7] |
| 06/June/2014 | RD 413/2014 | C | Renewable energies, cogeneration, and wastes | [30] |
| 31/July/2015 | RD 738/2015 | C | Regulation of the production and dispatch of electric energy | [31] |
C: current; A: abolished; L: law; RDL: Royal Decree-Law; RD: Royal Decree.
Table 6.
Average purchase price of demand during September 2015 [Source: authors].
| System | Average Price in €/MWh |
|---|---|
| Mainland | 55.01 |
| NMS | 52.06 |
| Subsystems | |
| Gran Canaria | 54.15 |
| Tenerife | 52.31 |
| Lanzarote–Fuerteventura | 50.55 |
| La Palma | 53.78 |
| La Gomera | 55.10 |
| El Hierro | 51.29 |
| Mallorca–Menorca | 49.98 |
| Ibiza–Formentera | 49.90 |
| Ceuta | 52.08 |
| Melilla | 51.50 |
Table 7.
Energy purchase price variation in the Canary Islands, €/MWh [13].
Table 7.
Energy purchase price variation in the Canary Islands, €/MWh [13].
| Average Ph Demand | Price Year Mobile Mainland | Pool Mainland | ||||||
|---|---|---|---|---|---|---|---|---|
| GC | LF | HI | GOM | LP | TF | |||
| 15 September | 54.15 | 50.55 | 51.29 | 55.10 | 53.78 | 52.31 | 56.54 | 55.85 |
| 15 October | 55.76 | 51.59 | 56.45 | 55.09 | 56.01 | 55.14 | 55.89 | 55.20 |
| 15 November | 54.87 | 51.85 | 47.53 | 54.89 | 52.18 | 52.18 | 55.32 | 56.78 |
| 15 December | 48.85 | 48.85 | 51.25 | 50.89 | 48.21 | 46.79 | 55.50 | 57.62 |
| 16 January | 44.39 | 40.61 | 46.64 | 47.33 | 42.81 | 42.61 | 55.72 | 42.40 |
| 16 February | 42.80 | 39.92 | 27.97 | 46.46 | 39.74 | 42.07 | 54.31 | 32.98 |
| 16 March | 43.44 | 41.05 | 35.51 | 46.83 | 41.43 | 43.10 | 52.88 | 33.16 |
| 16 April | 44.42 | 41.40 | 40.53 | 45.87 | 42.62 | 43.21 | 51.46 | 28.91 |
| 16 May | 43.50 | 40.28 | 49.68 | 45.44 | 40.85 | 44.06 | 49.60 | 31.15 |
| 16 June | 42.00 | 39.00 | 30.37 | 44.45 | 40.55 | 41.44 | 48.03 | 41.80 |
| 16 July | 40.08 | 42.39 | 26.78 | 46.59 | 43.61 | 41.40 | 46.64 | 43.22 |
| 16 August | 41.49 | 46.27 | 34.92 | 45.85 | 44.74 | 43.32 | 44.71 | 44.10 |
| 16 September | 41.79 | 48.25 | 32.85 | 44.10 | 43.74 | 44.06 | 43.32 | 46.89 |
Table 8.
Selling price variation in the Canary Islands, €/MWh [16].
Table 8.
Selling price variation in the Canary Islands, €/MWh [16].
| Average Ph Sale | Pmov-yr-Mainland | ||||||
|---|---|---|---|---|---|---|---|
| GC | LF | HI | GOM | LP | TF | ||
| 15 October | 51.06 | 47.24 | 51.69 | 50.45 | 51.29 | 50.49 | 51.18 |
| 15 November | 50.31 | 47.54 | 43.59 | 50.33 | 47.84 | 47.85 | 50.73 |
| 15 December | 44.97 | 40.98 | 47.17 | 46.84 | 44.38 | 43.07 | 51.08 |
| 16 January | 41.06 | 37.51 | 42.16 | 43.79 | 39.60 | 39.42 | 51.56 |
| 16 February | 39.55 | 36.89 | 25.84 | 42.92 | 36.72 | 38.87 | 50.18 |
| 16 March | 39.99 | 37.79 | 32.68 | 43.11 | 38.13 | 39.67 | 48.67 |
| 16 April | 40.82 | 38.04 | 37.24 | 42.16 | 39.16 | 39.71 | 47.29 |
| 16 May | 39.95 | 37.00 | 45.63 | 41.73 | 37.52 | 40.47 | 45.55 |
| 16 June | 38.50 | 35.75 | 27.84 | 40.75 | 37.17 | 37.99 | 44.03 |
| 16 July | 3671 | 38.82 | 24.53 | 42.67 | 39.94 | 37.92 | 42.72 |
| 16 August | 37.97 | 42.36 | 31.97 | 41.96 | 40.95 | 39.65 | 40.92 |
| 16 September | 38.28 | 44.19 | 30.08 | 40.39 | 40.07 | 40.36 | 39.67 |
© 2018 by the authors. Licensee MDPI, Basel, Switzerland. This article is an open access article distributed under the terms and conditions of the Creative Commons Attribution (CC BY) license (http://creativecommons.org/licenses/by/4.0/).
Share and Cite
MDPI and ACS Style
Uche-Soria, M.; Rodríguez-Monroy, C. Special Regulation of Isolated Power Systems: The Canary Islands, Spain. Sustainability 2018, 10, 2572. https://doi.org/10.3390/su10072572
AMA Style
Uche-Soria M, Rodríguez-Monroy C. Special Regulation of Isolated Power Systems: The Canary Islands, Spain. Sustainability. 2018; 10(7):2572. https://doi.org/10.3390/su10072572
Chicago/Turabian StyleUche-Soria, Manuel, and Carlos Rodríguez-Monroy. 2018. "Special Regulation of Isolated Power Systems: The Canary Islands, Spain" Sustainability 10, no. 7: 2572. https://doi.org/10.3390/su10072572
Note that from the first issue of 2016, this journal uses article numbers instead of page numbers. See further details here.