1. Introduction
The speeding-up of economic development and urbanization processes in China, beginning from reforming and opening up, have not only improved domestic people’s living standards, but also brought about critical environmental pollution and resources depletion [
1,
2], especially the air pollution including haze and fog weather, which has become a frequently occurring and pressing matter in recent years [
3,
4]. From 2012 spring, many regions in the north and east of China have suffered from serious haze and fog weather. Taking Beijing, Tianjin, and Hebei as examples, according to the data on China air quality on-line monitoring platforms [
5], for about half of the year from 2013–2017, these three regions were under haze and fog, and the air quality for half of the year was not up to standard. The primary constituent of such haze and fog pollutants is particle matter, of which the diameter is less than 2.5 μm (PM
2.5). Since PM
2.5 can easily be inhaled into the lungs and can persist in the atmosphere and move to other regions blown by wind, PM
2.5 has caused an enormous threat to human health, as well as exerted a profound influence on the global climate [
6,
7]. In 2014, the annual average of PM
2.5 concentrations of Hebei, Beijing, Tianjin, Henan, Hubei, and Jiangsu were 91.8 μg/m
3, 84.5 μg/m
3, 85.8 μg/m
3, 80.1 μg/m
3, 84.1 μg/m
3, and 63.3 μg/m
3 [
5]. According to the ‘Technical Regulation on Ambient Air Quality Index’ of national environmental protection standard of China in 2012 [
8] and Air Quality Guidelines issued by World Health Organization (WHO) in 2005 [
9], the standards of the annual average PM
2.5 concentrations set in the above two documents are 35 μg/m
3 and 10 μg/m
3, respectively. By aiming to reduce PM
2.5 pollution, all provincial governments actively implemented industrial restructuring, increasing the use of clean energy, and traffic pollution controlling to achieve the ‘transition period’ standard stipulated by WHO that the average annual PM
2.5 concentration decreases to 35 μg/m
3 in 2030. In order to realize this goal, it is significant to explore the impacts of anthropogenic driving forces on PM
2.5 [
10,
11,
12]. However, currently few studies quantify the influences of socio-economic forces containing economic development, industrial progress, energy consumption, and urbanization on PM
2.5 demonstrating that the relationships among these socio-economic forces and PM
2.5 of China are poorly comprehended [
13]. Better understanding the complicated relationships among these variables is significant for policy makers in order to draw up effective policies to curb atmospheric pollution.
Since China began to monitor PM
2.5 concentrations data in real time in most regions from 2013, the lack of large-scale and long-range data for PM
2.5 concentrations has restricted the studies on investigating the relationships among socio-economic forces and PM
2.5 concentrations. Estimating large scale PM
2.5 concentrations via remote sensing is an effective approach to solve this issue [
14]. Through integrating the data of satellite PM
2.5 concentrations and significant socio-economic factors, the long-run nexus among PM
2.5 concentrations and significant socio-economic forces are examined, for the first time to our best knowledge, employing the auto-regressive distributed lag (ARDL) methodological framework, and the environmental Kuznets curve (EKC) nexus between PM
2.5 concentrations and GDP per capita is also tested from 1998 to 2016. By further analyzing the complicated nexus between PM
2.5 concentrations and socio-economic forces, policy implications based on empirical analysis results are obtained, which can provide valuable references for policy makers.
The remaining sections of this paper are divided into six primary parts.
Section 2 summarizes the previous literature on EKC and PM
2.5 concentrations. The following section explains the selection of explanatory variables and sources of socio-economic factors’ data and PM
2.5 concentrations data. The methodological framework is elaborated in
Section 4. Empirical analysis is conducted in
Section 5.
Section 6 discusses empirical results and puts forward several policy recommendations.
Section 7 summarizes conclusions.
2. Literature Review
A large amount of research on the nexus between economic progress and environmental pollution has come forth since the 1990s. Some empirical studies employed EKC to describe the inverse U-shape relevance between environmental pollution and economic progress, which is deemed as an empirical hypothesis proposed by Grossman and Krueger [
15,
16]. Generally, in the earlier phase of economic growth, the pollution increased, then after reaching the turning point, the pollution began to reduce and the environmental quality started to improve with the growth of economy. Since the 1990s, many studies have employed EKC to research the existence of inverse U-shape nexus between economic progress and carbon dioxide (CO
2) emissions [
17,
18,
19,
20,
21,
22,
23], between economic growth and sulfur oxide (SO
2) emissions [
24,
25,
26], and between economic growth and nitrous oxides (NO
x) emissions [
27,
28]. Additionally, the EKC hypothesis was also employed in studies for hazardous waste, water pollution, and particulate matter [
29,
30,
31]. Kasman and Duman [
17] researched the causality between CO
2 emissions, energy consumption, economic development, urbanization process, and trade openness based on panel data model for new European union members from 1992–2010. The primary results supported the EKC hypothesis that there exists an inverted U-shape nexus between the environment and people’s income for selected countries. Wang et al. [
22] utilized a semi-parametric panel regression model along with the STIRPAT approach to research the complicated nexus among industrial CO
2 emissions, economic progress, and urbanization rate in China. Results proved that an inverted U-shape nexus between CO
2 emissions and economic growth exists in the electricity and heat generation sector. Huang [
26] established the panel spatial Durbin models researching on the nexus among SO
2 emissions, gross regional product (GRP) per capita, investment, and economic structure of China. Results illustrated that an N-shape nexus exists between SO
2 emissions and GDP per capita. Although the number of empirical studies employing EKC is growing rapidly, the investigations on the nexus between PM
2.5 concentrations and socio-economic factors are still rare. Xu et al. [
32] explored the critical driving forces of PM
2.5 from a regional perspective using Chinese provincial data based on co-integration analysis. Yu et al. [
33] empirically analyzed the socio-economic forces of urban PM
2.5 emissions for China according to the data of PM
2.5 of 73 cities in China in 2013 and verified the inverse U-shape EKC between PM
2.5 and GDP per capita. Li et al. [
12] investigated the primary anthropogenic driving forces contributing to making PM
2.5 concentrations increase in China, integrating the panel data approach and econometric models.
The reasons for the shortage of studies investigating the contributions of various socio-economic factors to PM2.5 are twofold. First, compared with traditional atmospheric pollutants such as SO2, CO2, and NOx, PM2.5 is not a threatening environmental problem in developed countries which have finished their industrialization process and technologies have achieved a high level, therefore the public attention on PM2.5 is not remarkable. Second, although PM2.5 greatly threatens the environment and humans’ health in developing countries, governments only began collecting data of PM2.5 in recent years, therefore the large scale and long-term data of PM2.5 concentrations are unavailable. Seeing that China is frequently threatened by haze and fog, of which the primary component is PM2.5, investigating the relationship between significant socio-economic factors and PM2.5 concentrations is of great importance for policy makers. Therefore, PM2.5 is selected as the primary research object in this paper.
Previously, spatial panel data model and co-integration theory were always employed to investigate the relationship between atmospheric pollutants and their driving forces. Magazzino’s research on the nexus among economic progress, energy consumption, and CO
2 emissions for six ASEAN (Association of South East Asian Nations) countries from 1971 to 2007 [
34] and 19 APEC (Asia-Pacific Economic Cooperation) countries from 1960 to 2013 [
35], was based on the panel VAR (vector auto-regression) technique. Results implied that a long-term equilibrium nexus exists between these variables. Guo et al. [
36] established a novel method on the basis of vector auto-regression researching the nexus among SO
2 emissions, freight turnover, GDP, and urban population of Beijing. Results indicated that the expansion of logistic services exerts the greatest influence on air pollution. Wang et al. [
37] explored the influences of democracy, urbanization process, and political globalization on PM
2.5 concentrations of G20 countries, based on panel quantile regression. Results illustrated that the impact of democracy on PM
2.5 concentrations is significant and positive for countries with higher emissions. Saidi [
38] investigated the causality nexus among CO
2 emissions, energy consumption, and economic progress for three North-African countries based on the panel co-integration model from 1980–2012. José [
39] investigated the relationships among primary energy consumption and economic development of Portugal, Greece, Spain, Italy, and Turkey based on an ARDL bounds examination method. Abdul and Syed [
40] explored the long-term nexus among CO
2 emissions, residents’ income, energy consumption, and foreign trade of China, utilizing the EKC theory and ARDL methodology based on the data from 1975 to 2005. Results demonstrated that CO
2 emissions are primarily determined by residents’ income and energy consumption. For traditional co-integration theory, they need to test for the stability of time series and make them stable by differencing which would interfere with long-term analysis. Since ARDL methodology can be utilized in spite of whether the time series is stable at level or after first differenced form and is suitable for energy related problems [
39,
40], this investigation, for the first time to our best knowledge, utilized ARDL methodology to analyze the long-term equilibrium nexus between PM
2.5 concentrations and significant socio-economic driving forces on the basis of the general-to-specific simulating technology [
41,
42,
43,
44].
The primary contributions of this paper contain: (1) through employing satellite PM2.5 concentrations data, the EKC nexus of PM2.5 concentrations and economic progress of China is tested for the first time from country level; (2) the long-term relationship among PM2.5 concentrations and significant socio-economic forces containing economic development, industrial process, energy consumption, urbanization process, and vehicles amount are examined from 1998 to 2016 utilizing ARDL methodological framework; (3) effective and practicable policy implications are obtained through further analyzing the complicated nexus of PM2.5 concentrations and socio-economic forces which can provide valuable references for policy makers.
3. Variables Selection and Data Sources
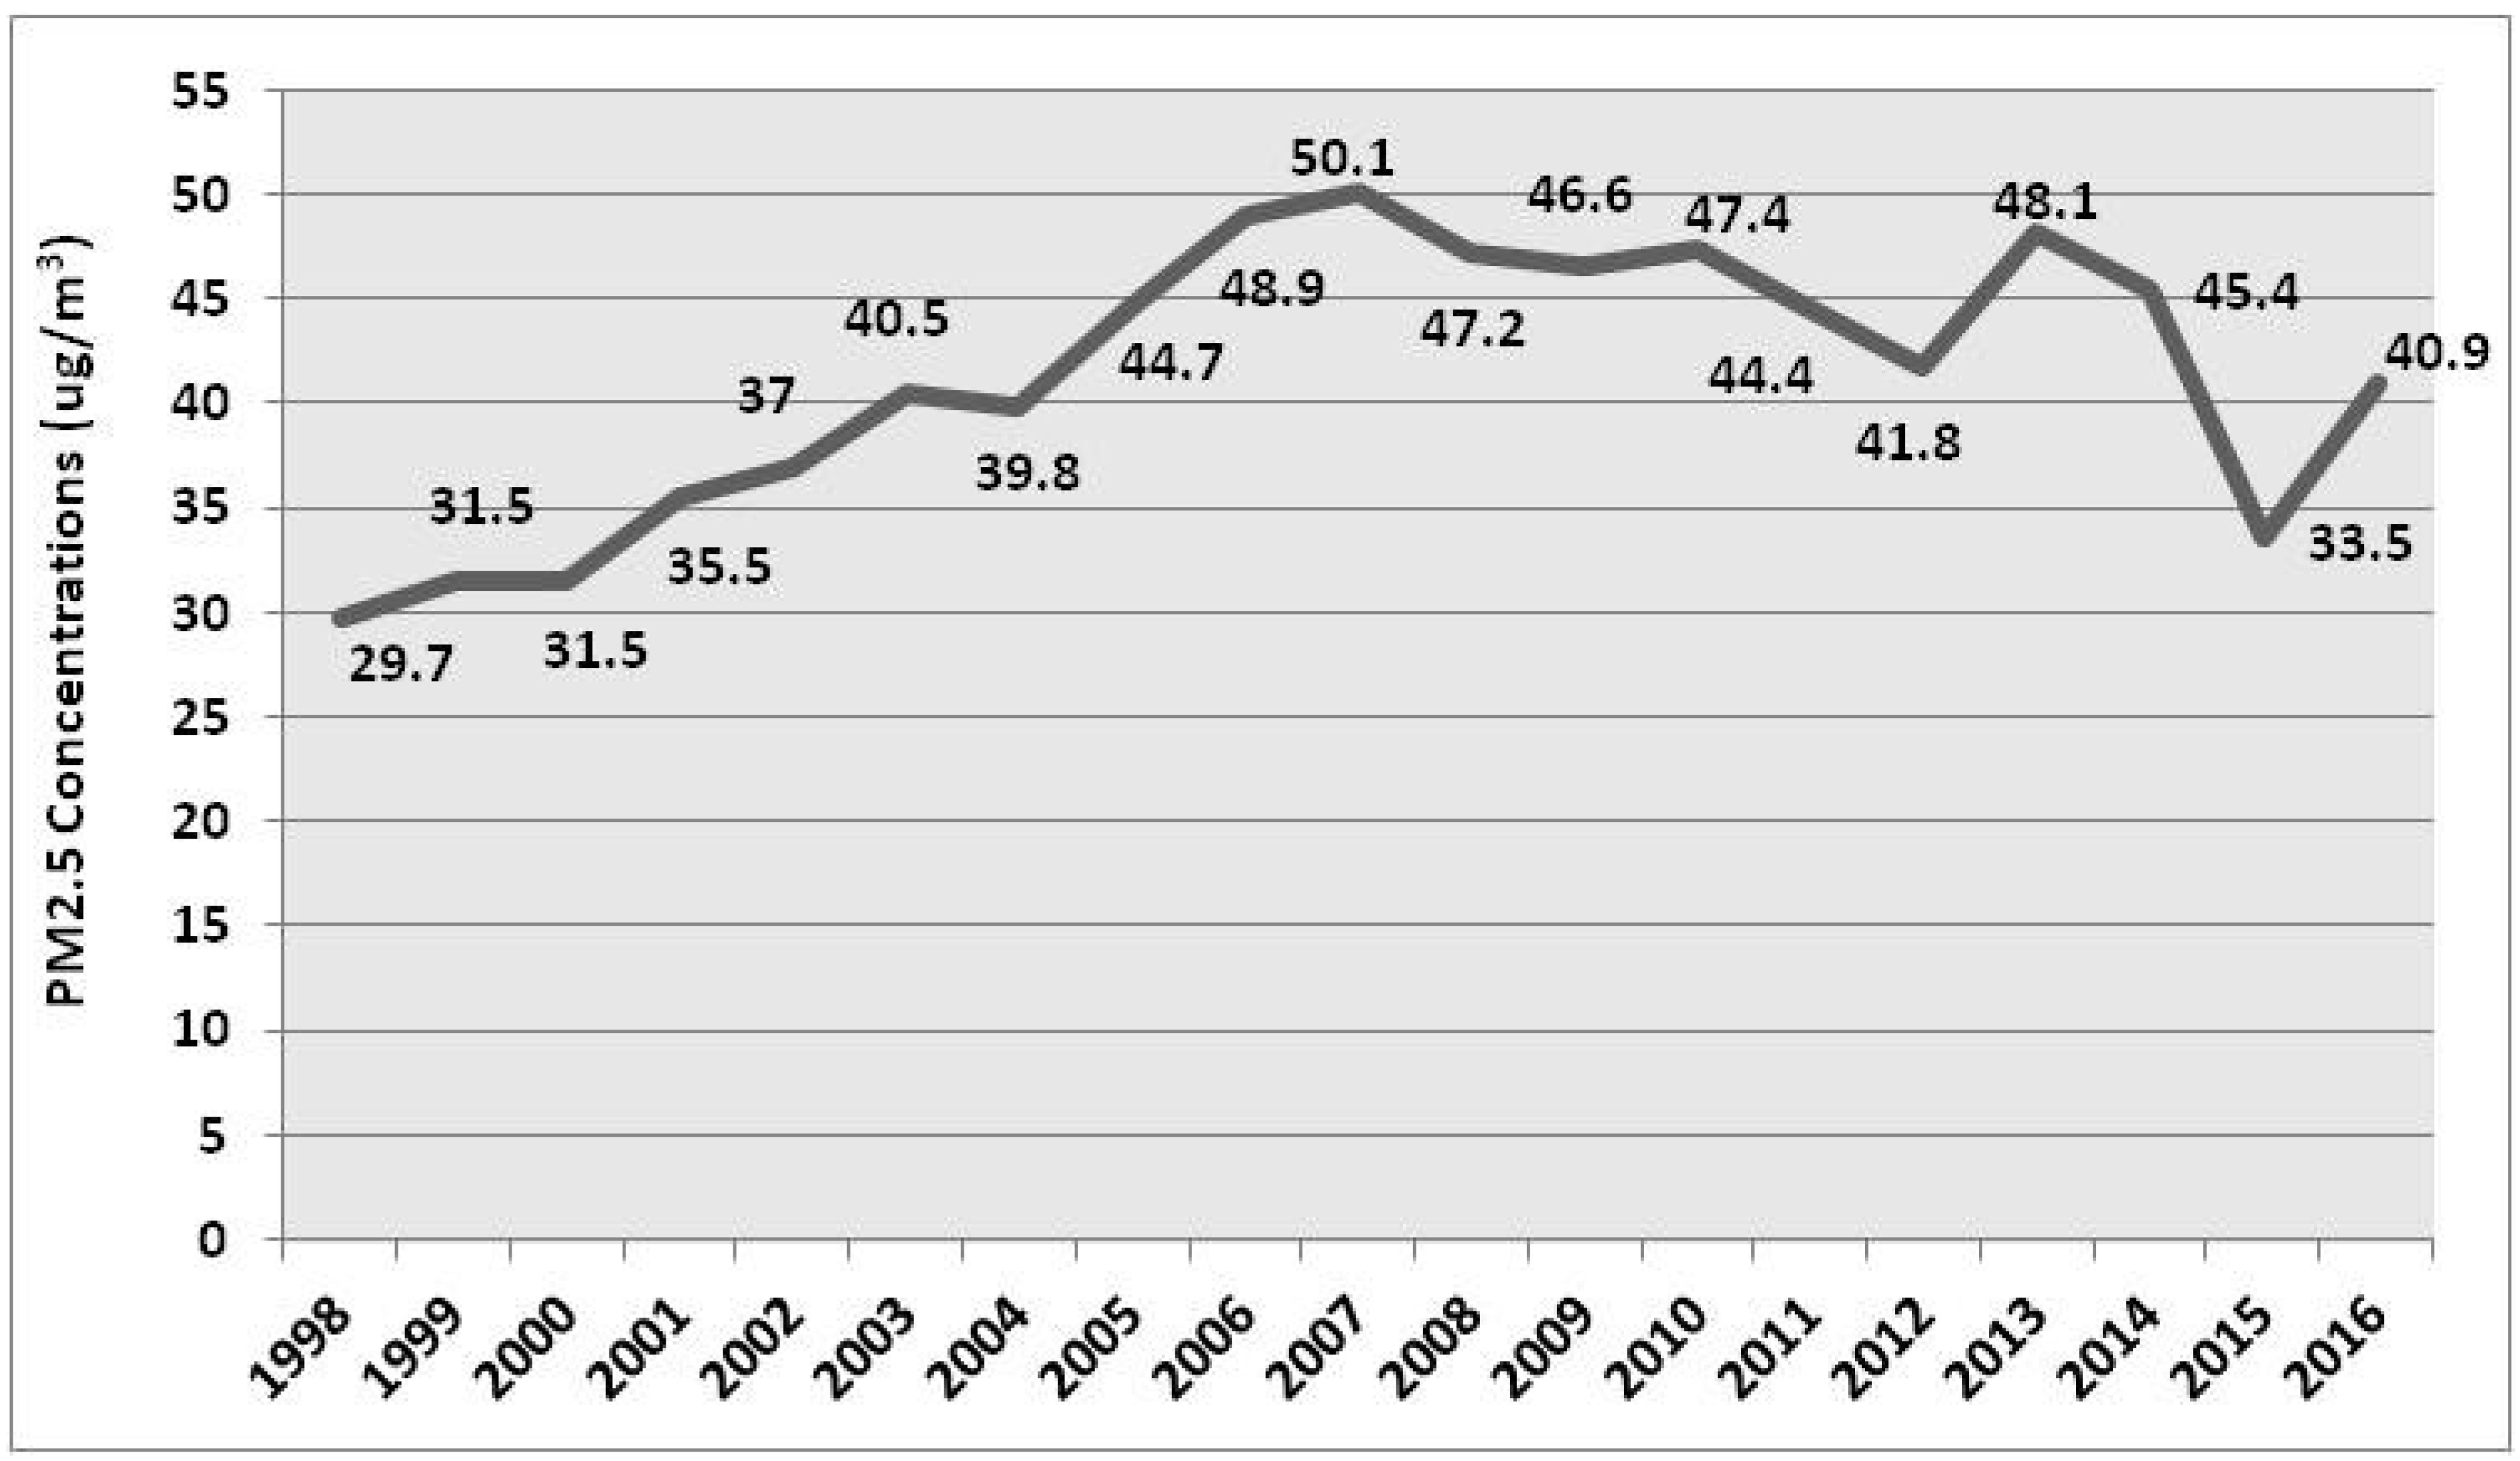
Annual PM
2.5 concentrations data for China in the scope of 1998–2016 are collected from remote sensing data monitored by Aaron van Donkelaar Professor from Dalhousie University of Canada. Ground–level PM
2.5 data are estimated through integrating Aerosol Optical Depth (AOD) and then correct to ground-based observations throughout the world of PM
2.5 data employing Geographically Weighted Regression (GWR), elaborated in References [
41,
42,
43]. According to the statistics, the tendency of PM
2.5 concentrations in China during the period of 1998–2016 is displayed in
Figure 1. It can be seen that from 2001, the annual PM
2.5 concentrations are all more than 35 μg/m
3. In 2007, it arrived at the peak with 50.1 μg/m
3. In order to achieve the ‘transition period’ standard set by WHO that the average annual PM
2.5 concentrations decrease to 35 μg/m
3 in 2030, considering the current emissions level of PM
2.5, we need to investigate the driving factors of PM
2.5 and the contributions of them to PM
2.5; this analysis will, therefore, enable us to formulate effective policies to curb the increase of PM
2.5.
The significant driving forces of PM
2.5 concentrations are selected as explanatory variables based on grey correlation degree analysis. The fundamental theory of grey correlation degree analysis can be referred to in the literature [
44]. Some social-economic factors are employed to analyze the correlation degree with PM
2.5 concentrations and the factors with relatively high correlation degree (higher than 0.80) are selected as the significant variables affecting PM
2.5 concentrations utilized to establish the ARDL model in order to analyze the long-term equilibrium nexus between PM
2.5 concentrations and these factors. Results of grey correlation degree are illustrated in
Table 1. As indicated in
Table 1, GDP per capita, total energy consumption amount, the proportion of population amount of urban areas in the total population, the proportion of secondary industry added value in GDP, and the amount of possession of civil vehicles are highly correlated with PM
2.5 concentrations. Therefore, this paper has chosen GDP per capita, total energy consumption amount, urbanization process represented by the proportion of population amount of urban areas in the total population, industrial process represented by the proportion of secondary industry added value in GDP, and the amount of possession of civil vehicles as independent variables, the data of which were collected from China Statistic Year Book [
45].
For GDP per capita, in accordance with the research results in previous studies on the influences of socio-economic forces on environmental pollutions, we can discover that the emissions or concentrations of pollutions are highly correlated with the average income [
22,
23,
26,
31]. Considering the reality that the haze and fog weather has occurred in several developed countries during the industrialization process, it is very likely that the emergence of such weather is an inevitable phase for China to undergo through the development of the economy. If this hypothesis is verified, the nexus between GDP per capita and PM
2.5 should also be an inverse U-shape. To examine this hypothesis, GDP per capita is taken as a critical factor, and the squared component of GDP per capita is also employed to testify whether there exists a nonlinear nexus between PM
2.5 concentrations and GDP per capita. The data of GDP per capita from 1998 to 2016 are converted into the constant price, taking the year 2000 as the basic period.
For the industrialization process, since the secondary industry contains energy intensive industries and pollutant emissions intensive industries, it greatly contributes different pollutants discharging which significantly threaten the environmental quality. Hence, relative scale of secondary industry exerts critical impact on atmospheric quality. Thus, we employ the proportion of secondary industry added value in GDP to represent economic structure and this is deemed as an independent variable.
For the amount of possession of civil vehicles, scientific studies have verified that the vehicle exhaust emits organic hydrocarbons, black carbon, NO
x, as well as various kinds of pollutants that are the primary resources of PM
2.5 [
46]. Thus, the number of vehicles can exert great influence on PM
2.5 concentrations. Therefore, the amount of possession of civil vehicles is also employed as an independent variable.
For energy consumption, the consuming of energy, especially the combustion of fossil fuel energy, has a significant influence on the environment. The emissions of smoke, fog, sulfide, and NOx primarily originated from the use of energy are the major components of PM2.5. Therefore, the total amount of energy consumption is also treated as an independent variable.
For the urbanization process, urbanization has been shown to have a great impact on the eco-environment [
47]. The existing literature has discovered that greenhouse gas emissions and PM
2.5 concentrations will increase with the rapid process of urbanization [
31,
48,
49,
50]. Therefore, this research also treats the urbanization process as an independent variable, which is represented by the share of population in urban areas in the total population.
Table 2 lists the detailed description of PM
2.5 concentrations and five explanatory variables.
5. Empirical Analysis
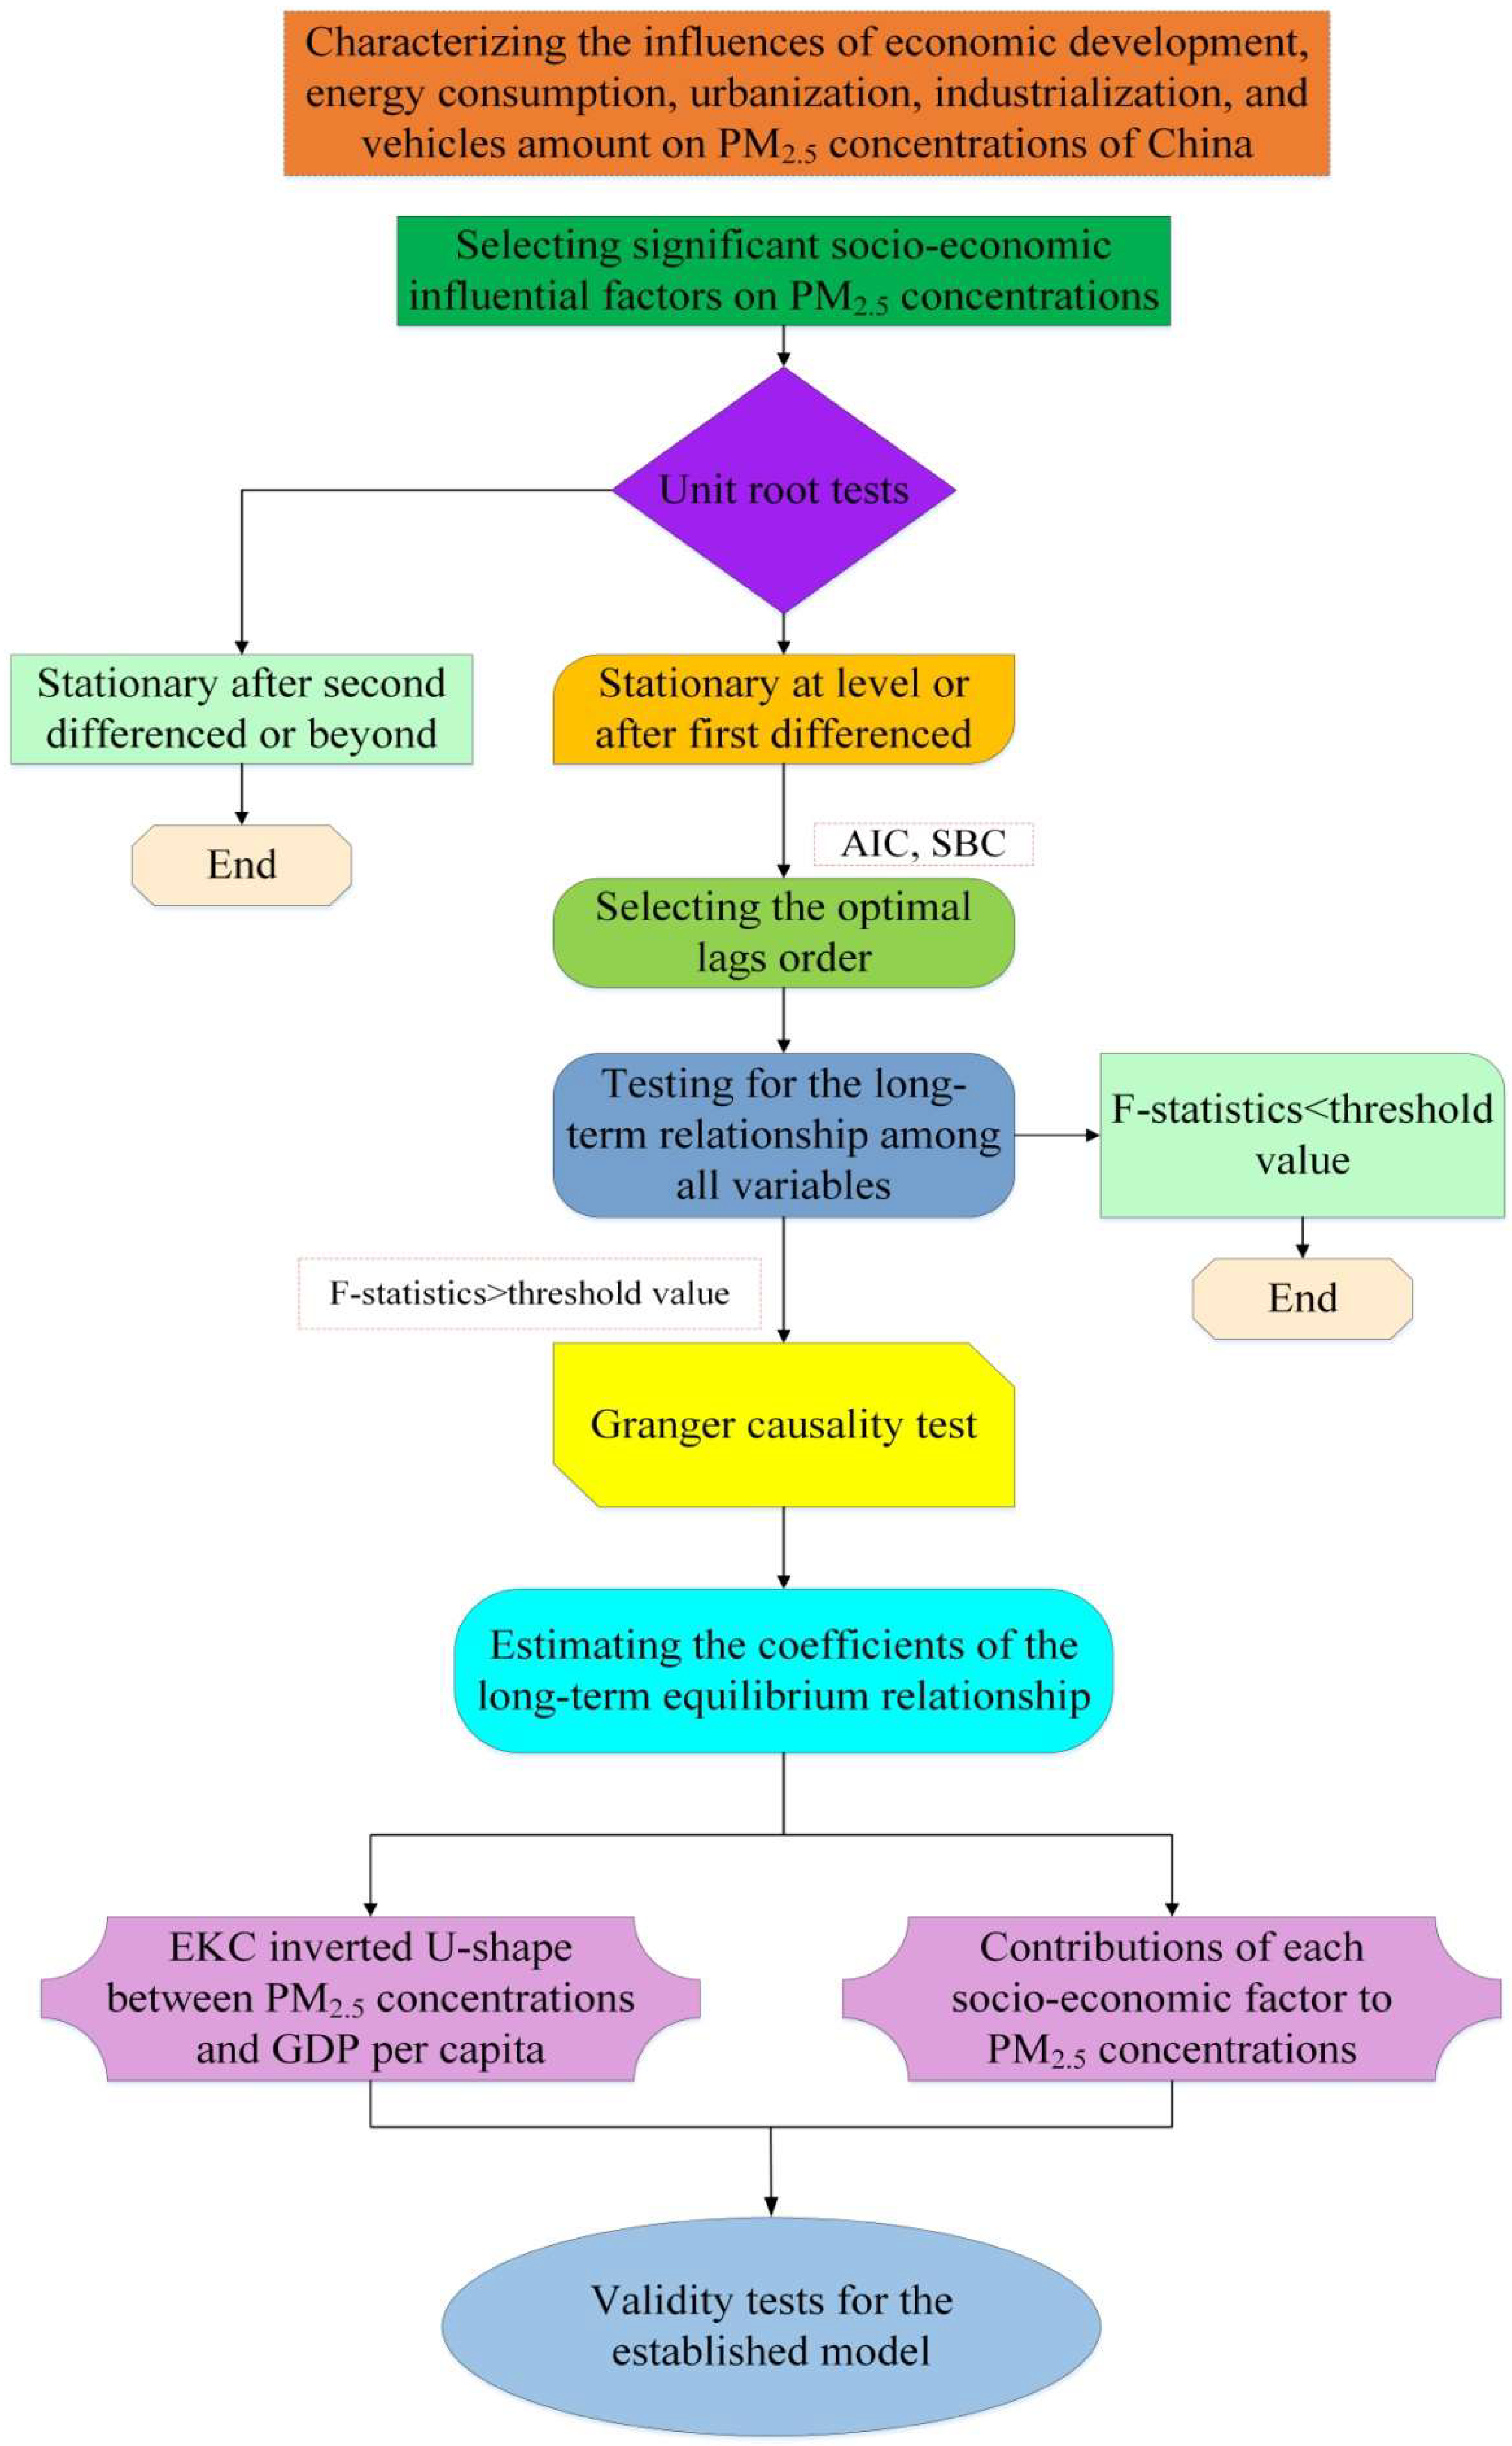
Our research focuses on exploring the long-term nexus of PM2.5 concentrations and significant socio-economic factors of China. The ARDL method is employed to examine the co-integration relationship among all of the variables taken into account. Considering the critical steps required by the ARDL approach, the empirical analysis is conducted as follows:
Since the bound test of the ARDL approach assumed that the variables should be stable at level or after first differenced, we need to carry out unit root test to guarantee that none of the variables are stable after second differenced or beyond to ensure the validity of
F-statistics. To verify this, we utilized the traditional Augmented Dickey Fuller (ADF) test for unit root examination. The examination results are shown in
Table 3. As the results illustrated, none of the variables is stationary after second differenced or beyond. All variables are unstable at level at 10% significance level, but all data series are stationary after first differenced at 10% significance level. Therefore, all the selected variables satisfy the basic assumption of ARDL approach.
After identifying that all data series are stable after first differenced, the ARDL co-integration procedure should step to choose the optimum lags length. At this step, AIC and SBC statistics are applied to choose the optimum lags order of ARDL approach. The results are illustrated in
Table 4. We need to choose a high enough lags order to guarantee that the optimum lags order cannot be higher than it. We set the maximum lag length to be 3, and according to the results of AIC and SBC criteria, the optimum lag length should be 1.
Based on the above two steps, the long-term nexus among all variables should be examined employing bounds test. Equation (2) will be estimated employing ordinary least square (OLS) approach and the
F-statistics for the joint indication of lag levels for data series will be calculated. The calculated
F-statistics for lag 1 order is 5.569. Critical values can be referred to the literature [
44] which is 5.06 at 1% significance level. Therefore, it is confirmed that a strong long-term equilibrium nexus exists among all variables.
Before estimating the long-term relationship among all variables, we need to verify whether there exists a causality nexus between the dependent variable PM
2.5 concentrations and each of the independent variables. This research employed the Granger Causality examination approach to test the causality nexus between variables. The results are displayed as
Table 5. It is found that there exists bi-directional causality nexus between PM
2.5 concentrations and GDP per capita, PM
2.5 concentrations and the squared component of GDP per capita, PM
2.5 concentrations and total energy consumption as well as PM
2.5 concentrations and urbanization process. This indicates that the changes of GDP per capita, total energy consumption and urbanization process will have great influences on PM
2.5 concentrations, and the change of PM
2.5 concentrations will also have great impacts on these socio-economic factors. The increase of GDP per capita, total energy consumption, and urbanization rate will bring about the increase of PM
2.5 concentrations, and the decrease of PM
2.5 concentrations will conversely lead to the decrease of GDP per capita, total energy consumption, and urbanization rate. There exists uni-directional causal nexus between PM
2.5 concentrations and industrialization process as well as PM
2.5 concentrations and the amount of possession of civil vehicles. Additionally, the uni-directional causal nexus all run from the socio-economic factors to PM
2.5 concentrations, which demonstrate that the variety of these socio-economic factors will shock the amount of PM
2.5 concentrations, while the change of PM
2.5 concentrations will take no effect on these socio-economic factors. That indicates the increase of the ratio of secondary industry added value in GDP and the amount of possession of civil vehicles will result in the increase of PM
2.5 concentrations, while if the increase of PM
2.5 concentrations is controlled, it will have no impacts on the development of industrialization process and the increase of the amount of possession of civil vehicles.
Based on the ARDL co-integration approach, the long-term equilibrium relationship in Equation (2) can be estimated. The AIC and SBC criterion, Hannan Quinn criterion are employed to find the coefficients of the variables at level. Since SBC is a parsimonious method selecting the least possible lag order and minimizing the loss of freedom degree, here we illustrate the results of the model selected by SBC. The coefficients are displayed in
Table 6. As the results demonstrated, the coefficients for GDP per capita in constant price, total energy consumption, urbanization process, industrialization process, and the amount of possession of civil vehicles are all positive and significant at 5% significance level according to
t-statistics and
P-values. Based on the coefficients, 1% increases of GDP per capita in the constant price, total energy consumption, urbanization process, industrialization process, and the amount of possession of civil vehicles will lead to 0.762%, 0.745%, 0.597%, 0.501%, and 0.468% increases of PM
2.5 concentrations, respectively. Therefore, GDP per capita makes the greatest contributions to PM
2.5, followed with total energy consumption, urbanization, industrialization process, and the amount of possession of civil vehicles.
The coefficient of the squared component of GDP per capita in constant price is negative and significant, which verifies the hypothesis of EKC that there exists an inverse U-shape between PM
2.5 concentrations and GDP per capita. According to the coefficients of ln
GDP and
(ln
GDP)2, we can estimate the turning point of GDP per capita in constant price when PM
2.5 concentrations achieve the peak, which turned out to be 39,471.47 yuan (based on the exchange rate between RMB yuan and dollar listed in the China Statistic Year Book [
45] in 2017, we transfer 39,471.47 yuan to 5942.44 dollar). Compared with the highest value of GDP per capita in constant price 30,933.12 yuan in 2016, based on the EKC assumption, the PM
2.5 concentrations will still increase until the GDP per capita in constant price reaches the inflection point, and then PM
2.5 concentrations will decrease with the growth of economy.
The above coefficients are for the long-term equilibrium relationship in Equation (2), considering that the ARDL methodology can also analyze ECM, hence this step analyzes the coefficients of error correction terms (which are the components with sum signs) in Equation (2). Results of the ECM estimation are illustrated in
Table 7. As indicated in
Table 7, all of the error correction components are significant at 1% significance level. The coefficient of
is also significant and correct with negative value, which demonstrates that approximately 19.87% imbalance in PM
2.5 concentrations of previous years’ variation adjust back to the long-term equilibrium of current years. The value of
illustrates the ECM is relatively good regression.
With the aim of verifying the validity of the established model, the diagnostic examinations including functional form, serial correlation, heteroskedasticity, and normality tests are conducted. Results of them are indicated in
Table 8. The results of all the diagnostic examinations demonstrate that there exist no serial correlation and heteroskedasticity. Additionally, the established model passed through the examinations of normality and functional form specification. Therefore, the established model has shown validity.
6. Discussion and Policy Implications
Previous literature has illustrated that the increase of PM
2.5 has been greatly influenced by socio-economic factors [
10]. On the purpose of discovering and better understanding the relationship between socio-economic factors and PM
2.5, this paper selected GDP per capita, total energy consumption, urbanization process, industrialization process, and the amount of possession of civil vehicles as the most significant socio-economic factors which have great influences on PM
2.5 concentrations based on grey correlation degree analysis results, and we assumed that the selected socio-economic factors can reflect the overall development trend and conditions for China’s socio-economic development. The empirical results have verified our assumption that these selected variables have high relativity with PM
2.5 concentrations and make great contributions to PM
2.5 concentrations increase.
From the results of long-term causality relationships between each independent variable and PM2.5 concentrations, we can conclude that if the development pattern of China remains unchanged, the control of PM2.5 concentrations will bring undesirable effects on economic development, energy consumption, and urbanization process, as there exist bi-directional causal nexus between these variables and PM2.5 concentrations. Contrarily, under present development pattern, the growth of economic development and the increase of energy consumption and urbanization process will result in the ascending of PM2.5 concentrations. Thus, policy makers should carefully balance the relationship between PM2.5 concentrations reduction and the increase of economic progress, energy consuming, and urbanization process when formulating policies to restrict PM2.5 concentrations under present development pattern.
For economic development, currently, economic growth is deemed as the most significant mission both for central and provincial governments. Chinese 13th Five Year Plan, as the critical document proposing development goals covering various economic, social, and environmental aspects in the period of 2016–2020, set an annual average growth ratio of 6.5% as the minimum requirement for economic growth [
57]. According to the empirical results, GDP per capita makes the greatest contribution to PM
2.5 concentrations and a bi-directional causal nexus exists between economic development and PM
2.5 concentrations. Hence, the close nexus between PM
2.5 concentrations and economic development demonstrates that a novel pathway is urgently required to decrease the impacts of economic development on PM
2.5 concentrations. Therefore, under the current situation, accelerating the adjustment of economic development mode transformed from the original rough mode consuming large amounts of energy and resources with insufficient economic growth and increased pollutants emissions to novel intensive mode depending on high level technologies with rapid economic growth and decreased pollutants emissions, is indispensable. Such conversion of economic development mode will greatly contribute to economic growth and pollutants reduction which can guarantee the sustainable development of China’s society and economy. Although the transformation of economic mode needs investment and time, it is an integral step to synchronously decrease PM
2.5 concentrations and guarantee the growth of economy.
For energy consuming and industrialization process, in accordance with the results of the Granger causality examination and coefficients of the established model, the present industrial development mode highly relies on energy intensive industries which results in large amount resources consuming and pollutants emissions. From the early 1990s, the economic development of China has been greatly prompted by heavy industries, especially the chemical industry and metal manufacturing industry [
58]. However, considering the serious overcapacity problem of heavy industries and the significance of sustainable development, the development of China’s economy will not depend on heavy industries in the predictable future and the industrial development mode need to be transformed. Although central governments and provincial governments have made great efforts to alter the industrial development mode, it is a tough and long way to realize industrial development conversion. The strategies below may help to accelerate the conversion process which will contribute to reducing PM
2.5 concentrations and promote sustainable development of industrial sectors: (1) the critical industrial development driving forces should be transformed from traditional energy consumption and resources to technological progress and innovation; (2) the backward generation capacity and heavy pollution enterprises should be eliminated gradually; (3) the economic structure should be adjusted by promoting the development of tertiary industries; (4) local governments should improve PM
2.5 emissions criterion appropriately considering the level of technological development and the ability of enterprises to control pollution which is a more direct strategy to decrease PM
2.5 concentrations.
For urbanization process, the empirical results indicate that there exists a bi-directional causality between PM
2.5 concentrations and urbanization process, moreover, according to the coefficients in the established model, the contribution of urbanization process to PM
2.5 concentrations ranks the third. Hence, the deceleration of urbanization process may benefit for decreasing PM
2.5 concentrations. However, since a high goal for achieving 60% urbanization rate in 2020 was set in the New-Type Urbanization Plan [
59] issued by central government, the urbanization process cannot be decelerated. Seeing that cities with high urbanization rate always have high PM
2.5 concentrations [
12], population mitigation into more intensive population urban regions should be restricted which is probably an effective measure to control PM
2.5 concentrations.
For the amount of possession of civil vehicles, Granger causality examination results and coefficients in the established model demonstrate that the amount of possession of civil vehicles is a significant factor of PM2.5 concentrations. The increase of the number of vehicles brings about not only the increase of PM2.5 concentrations, but also severe traffic pressures, especially in megacities such as Beijing and Shanghai. Therefore, governments should continue to promote the popularity of electric vehicles and restricting the successful rate for petrol car licenses.
7. Conclusions
Although the Chinese economy experienced rapid development, the mode of it was extensive, which heavily depended on energy and resources consuming and emitted large amounts of pollutants, especially atmospheric pollutant such as PM2.5, which has attracted more attention from the public due to its hazardous effects on human health. Since the increase of PM2.5 concentrations results from several socio-economic influential factors, this paper has aimed at exploring the relationship among significant socio-economic forces and PM2.5 concentrations so that effective strategies can be formulated to restrict PM2.5. GDP per capita, total energy consumption amount, urbanization process, industrialization structure, and the amount of possession of civil vehicles were selected as the independent variables which reflect the socio-economic development of China. The data of all variables from 1998–2016 were collected to establish the long-term equilibrium relationship based on ARDL method. According to the Granger causality test results, bi-directional causality nexus exist between PM2.5 concentrations and GDP per capita, PM2.5 concentrations and the squared component of GDP per capita, PM2.5 concentrations and total energy consumption as well as PM2.5 concentrations and urbanization process, and uni-directional causal nexus exist between PM2.5 concentrations and industrialization process as well as PM2.5 concentrations and the amount of possession of civil vehicles both of which run from the socio-economic factors to PM2.5 concentrations. Through estimating the coefficients in the long-run equilibrium nexus, we can obtain that an inverse U-shape nexus exists between PM2.5 concentrations and GDP per capita which verified EKC assumption and when the real GDP per capita reaches 39,471.47 yuan (5942.44 dollar), PM2.5 concentrations will achieve the peak. Based on the estimated coefficients, GDP per capita makes the greatest contributions to PM2.5 concentrations, followed by total energy consumption, urbanization, industrialization process, and the amount of possession of civil vehicles.
According to the empirical analysis, policy implications aimed at reducing PM2.5 concentrations and promoting the sustainable development of China’s society and economy are put forward based on the Granger causality relationship between various variables and PM2.5 concentrations as well as the contribution of different independent variables to PM2.5 concentrations. For GDP per capita, accelerating the adjustment of economic progress mode transformed from the original rough mode to novel intensive mode is an integral step to synchronously decrease PM2.5 concentrations and guarantee the growth of economy. For energy consumption and industrialization process, strategies below will help to accelerate the industrial conversion process to reduce PM2.5 concentrations: (1) the critical industrial development driving forces should be transformed from traditional energy consumption and resources to technological progress and innovation; (2) the backward generation capacity and heavy pollution enterprises should be eliminated gradually; (3) the economic structure should be adjusted by promoting the development of tertiary industries; (4) local governments should improve PM2.5 emissions criterion appropriately. For the urbanization process, population mitigation into more intensive population urban regions should be restricted. For the amount of possession of civil vehicles, governments should continue to promoting the popularity of electric vehicles and restricting the successful rate for petrol car licenses.
Above all, this paper is an initial study to investigate the nexus between social and economic forces and PM2.5 concentrations of China from a macro view. The purpose of this research is to encourage researchers to further explore the reasons for severe atmospheric pollution in China and provide validity and practicable policy recommendations for policy makers. Considering the data availability, in future research, panel data model analysis can be conducted to analyze the influences of various socio-economic forces on PM2.5 with regard to various provinces or regions in China as well as for developing countries based on high resolution data sources. Additionally, in terms of spatial spillover effects of PM2.5 concentrations, appropriate models should be established to be applied in researching the nexus between PM2.5 concentrations and influencing factors of various regions, such as Spatial Autoregressive Model. Meaning, then, that pertinent policy implications can be put forward considering the actual situation of different regions.


