1. Introduction
The current society, based on production and consumption, is mainly concerned with the effects generated by the production processes on the environment [
1], such as global warming and the extensive use of fossil fuels as well as identifying possibilities for replacing them by using renewable resources, the reduction of energy consumption, reducing carbon emissions, waste recycling and use of biotechnology. The evolution of production systems must meet the present requirements of sustainable development (SD) and contribute to the transformation of current economies based on the use of fossil fuels, to green economies based on the use of biomass, thus generating significant changes in the socio-economic, energy, technical and agricultural systems, by stimulating research and innovation, as well as the use of natural renewable resources [
2,
3]. To achieve the objectives of SD, the production of biomass energy can hold a significant role [
4,
5], as biomass can be used to generate gas, electricity, heat or liquid fuels that are easy to transport and store [
6,
7], energy being used throughout the supply chain, from manufacturing, processing, packaging, storage, product distribution to waste disposal [
8].
The use of the biogas installations (BI) to produce energy in the agro-industrial sector (AIS) involves the anaerobic processing of organic matter, namely manure, agricultural by-products, residues or certain crops specially designed for this purpose, and is an efficient method of processing and transforming these materials into energy, while the material remaining after anaerobic digestion (AD) processes can be used as a fertilizer [
9,
10]. In addition, the production of biogas has many advantages, not only for economic entities, but also for the environment and society, contributing significantly to the achievement of SD goals by: energy independence (by ensuring green energy production, reducing electricity consumption from the public grid and replacing fossil fuels), climate protection (by reducing greenhouse gases and eliminating unpleasant odors caused by organic compounds that are consumed by biogas producing bacteria [
11]), water sources protection (by reducing organic substances with eutrophication potential such as nitrogen and phosphorus and reducing emissions of nitrogen compounds, especially nitrates [
12]), human health and veterinary safety (by reducing microbiological pollution as a result of the almost complete elimination of bacteria and other pathogenic microorganisms contained in animal wastes [
12,
13]).
Biogas production is one of the suitable alternatives in efficient waste management and contributes to achieving European Union (EU) Renewable Energy Directive goals. The EU deals with enormous and increasing amounts of organic wastes (organic waste from the food industry, municipal organic waste, agricultural residues, manure and crops, etc.) that need neutralization and specific treatments [
9,
14,
15,
16,
17]. The potential of waste that could be used in AD processes in EU and information on raw materials used for biogas is often not easy to obtain, as this is not centrally registered; however, Kampman [
18] estimated the current feedstocks based on the 2014 biogas production from the EuroObserv’Er data as follows: energy crops (mainly maize) provide about half of the biogas production (318 PJ, 7.6 Mtoe), followed by landfill (114 PJ, 2.7 Mtoe), organic waste (including municipal waste) (86 PJ, 2.0 Mtoe), sewage sludge (57 PJ, 1.3 Mtoe) and manure (46 PJ, 1.1 Mtoe). In EU, the number of biogas plants has increased constantly, from 6227 to 17,662 plants between 2009 and 2016 [
19]. In addition, at EU level, gross electricity from biogas had an exponential growth in the last years from 27,665 GWh in 2009 to 60,922 GWh in 2015 [
19]. EBA (European Biogas Association) estimates that, by 2020, biogas has the potential to contribute >1.5% of the EU’s primary energy mix and 5% of the EU’s natural gas consumption (in energy equivalent terms). In addition, the potential for biogas production from AD is >30 bcm/year. Adding the potential from gasification, an estimate for the total production of biomethane is >50 bcm/year, equivalent to about 10% of EU’s current natural gas consumption [
19].
Although the biogas sector is underdeveloped at present, Romania has a huge potential for biogas production, considering the economic development that Romania has registered in the last years and the huge biomass potential [
20]. In the 1980s, Romania had a highly developed sector. After the 1973 energy crisis, a national program to increase investment in the research, development and construction of biogas plants was implemented. At the end of 1989, the estimated number of biogas plants used in rural areas for households and small communities was 5000 [
20]. After 1989, in the transition to a democratic society, most of the biogas plants were abandoned and disassembled. Recently, due to EU’ Directives, there has been an increase in the promotion and emphasis of the potential generated by biogas production, through legislative support and programs with European funding in the field [
20]. In 2016, 13 biogas plants were registered at national level, of which only three have a capacity of more than 1 MW [
18]. Most BIs use a mixture of raw materials: five use, among other things, energy crops, while most use manure and slurry, and one uses municipal waste [
18].
Even though, the use of BI is a viable solution for power supply, the high cost of building, as well as the human mentality, lack of information on financing possibilities, and the technologies that can be used, lead to a slow evolution of this sector in Romania [
18]. To meet EU standards, most Romanian farms need an upgrade and reorganization from point of view of hygiene, animal welfare, environmental protection and waste management [
21,
22,
23]. These upgrades can be funded through community funds that can also be used for investments in management of waste in AIS, such as biogas production [
20]. The legal framework on environmental issues in Romania is less developed than other EU countries [
24] and needs proper attention to encourage the biogas sector future development.
Organic waste, being a source of pollution (water and soil pollution in storage sites, unpleasant odors, greenhouse gas emissions during decomposition, pathogenic bacteria, etc.), is not only an environmental issue but also an economic loss. Given the emphasis on the issue of depletion of fossil fuels, it is necessary to find solutions for the problems related to the availability of energy sources [
25,
26]. Given these prospects, the conversion of organic waste into primary or secondary sources of raw materials used in energy technologies is the subject of many studies, which leads to the sustainable development of environment and society as well as the economy [
27,
28].
In our research, we approached the use of biogas for energy production in AIS from the economic point of view through an analysis of technical and economic parameters. The AIS includes primary branches such as: agriculture, zootechnics, forestry, fishing, and adjacent processing industries. In the case study, we analyzed a biogas plant in Romania attached to an economic entity from AIS which owns a chicken slaughterhouse. The rest of the paper is organized as follows:
Section 2 deals with the use of biogas for energy production in AIS.
Section 3 deals with materials and methods.
Section 4 presents the results and
Section 5 the conclusions.
2. The Use of Biogas for Energy Production in AIS
Biogas is the gaseous product obtained by AD, which is a biological process of decomposition using various types of anaerobic bacteria, in the absence of oxygen, of various organic substrates such as: biomass and vegetable waste, animal litter, organic waste, sewage system waste water, etc. [
29,
30]. The substrate subjected to AD can consist of a mixture of two or more raw materials (e.g., animal litter and organic residues in the food industry); the process thus becomes one of co-digestion, being the case in most biogas production installations [
31].
The technology of biogas involves the installation of a biogas production system that converts into electrical and/or thermal energy [
32,
33] the various organic products can be fermented by microorganisms, which become the raw material used in producing biogas under the conditions of an optimal environment for the development and activity of microorganisms for the digestion of the substrate, ultimately producing biogas [
31,
34,
35,
36] (see
Table 1).
The methane potential of different types of raw materials used in biogas plants is presented in
Table 2.
The implementation of BI on farms and entities forming the AIS can also generate various benefits, such as added value through waste recycling (AD of manure with reduction of bad odors and insects, use of separate fibers from litter or compost manure, and reduction of pathogenic germs and seed weeds from manure) [
12,
37], reduction of waste disposal costs [
38], reducing the greenhouse effect by reducing methane emissions, reducing water pollution [
8], the use of biogas to generate processing energy, and use of heat surplus produced by the power generator (the heat produced in addition to electricity can be used in the winter for heating and for cooling in the summer) [
12]. Moreover, waste treatment improves the environmental image of AIS [
37] and the recovery of organic manure can represent a possibility for increased income [
31].
Due to the many benefits of biogas, the study of the technological processes of obtaining and optimizing it, in various BI, is today a popular topic. In addition, the economic issues of BI interest various researchers in the field. In the international literature, there are various studies on the financial and economic viability of BI. Some are based on predictive models or various scenarios [
8,
39], others make comparisons between different support schemes and plant configurations [
14,
16,
40], and others refer to the investment criteria and costs of different types of BI (microalgae [
41], dairy sector [
42], etc.). Reviewing the scientific literature on BI that use poultry manure, we have discovered that there is a gap regarding the economic perspective of BI that uses poultry manure. There are studies regarding poultry BI from a technological point of view [
34,
43] or comparisons between different types of animal wastes used in biogas production [
44,
45,
46], which do not approach the financial and economic aspects.
3. Materials and Methods
In this study, to assess the quantification of the economic effects generated by using BI in AIS, we considered it necessary to carry out the analysis on a specific case, which is why the entity under consideration is a company with its headquarters in Romania whose main object of activity is slaughtering and processing of poultry meat. After the production processes, finished products are absorbed by domestic and foreign markets, processing companies of various animal by-products, but also a significant number of by-products not intended for human consumption, which must be neutralized by specialized entities. In this regard, a BI operates to neutralize the waste resulting from the slaughtering process and to neutralize waste from external sources, thus solving both the problem of environmentally friendly use of waste and the production of energy for self-consumption. This installation has been accredited by ANRE (Romanian Energy Regulatory Authority) [
47,
48] and benefits from a green certificate grant for the energy produced (1.92 certificates/MW).
Regarding the investigated system, the main technological flows of the BI are as follows (
Figure 1): (i) Fuel circuit involves the reception, preparation and storage of biogas (the total storage capacity of biogas is 111,354 m
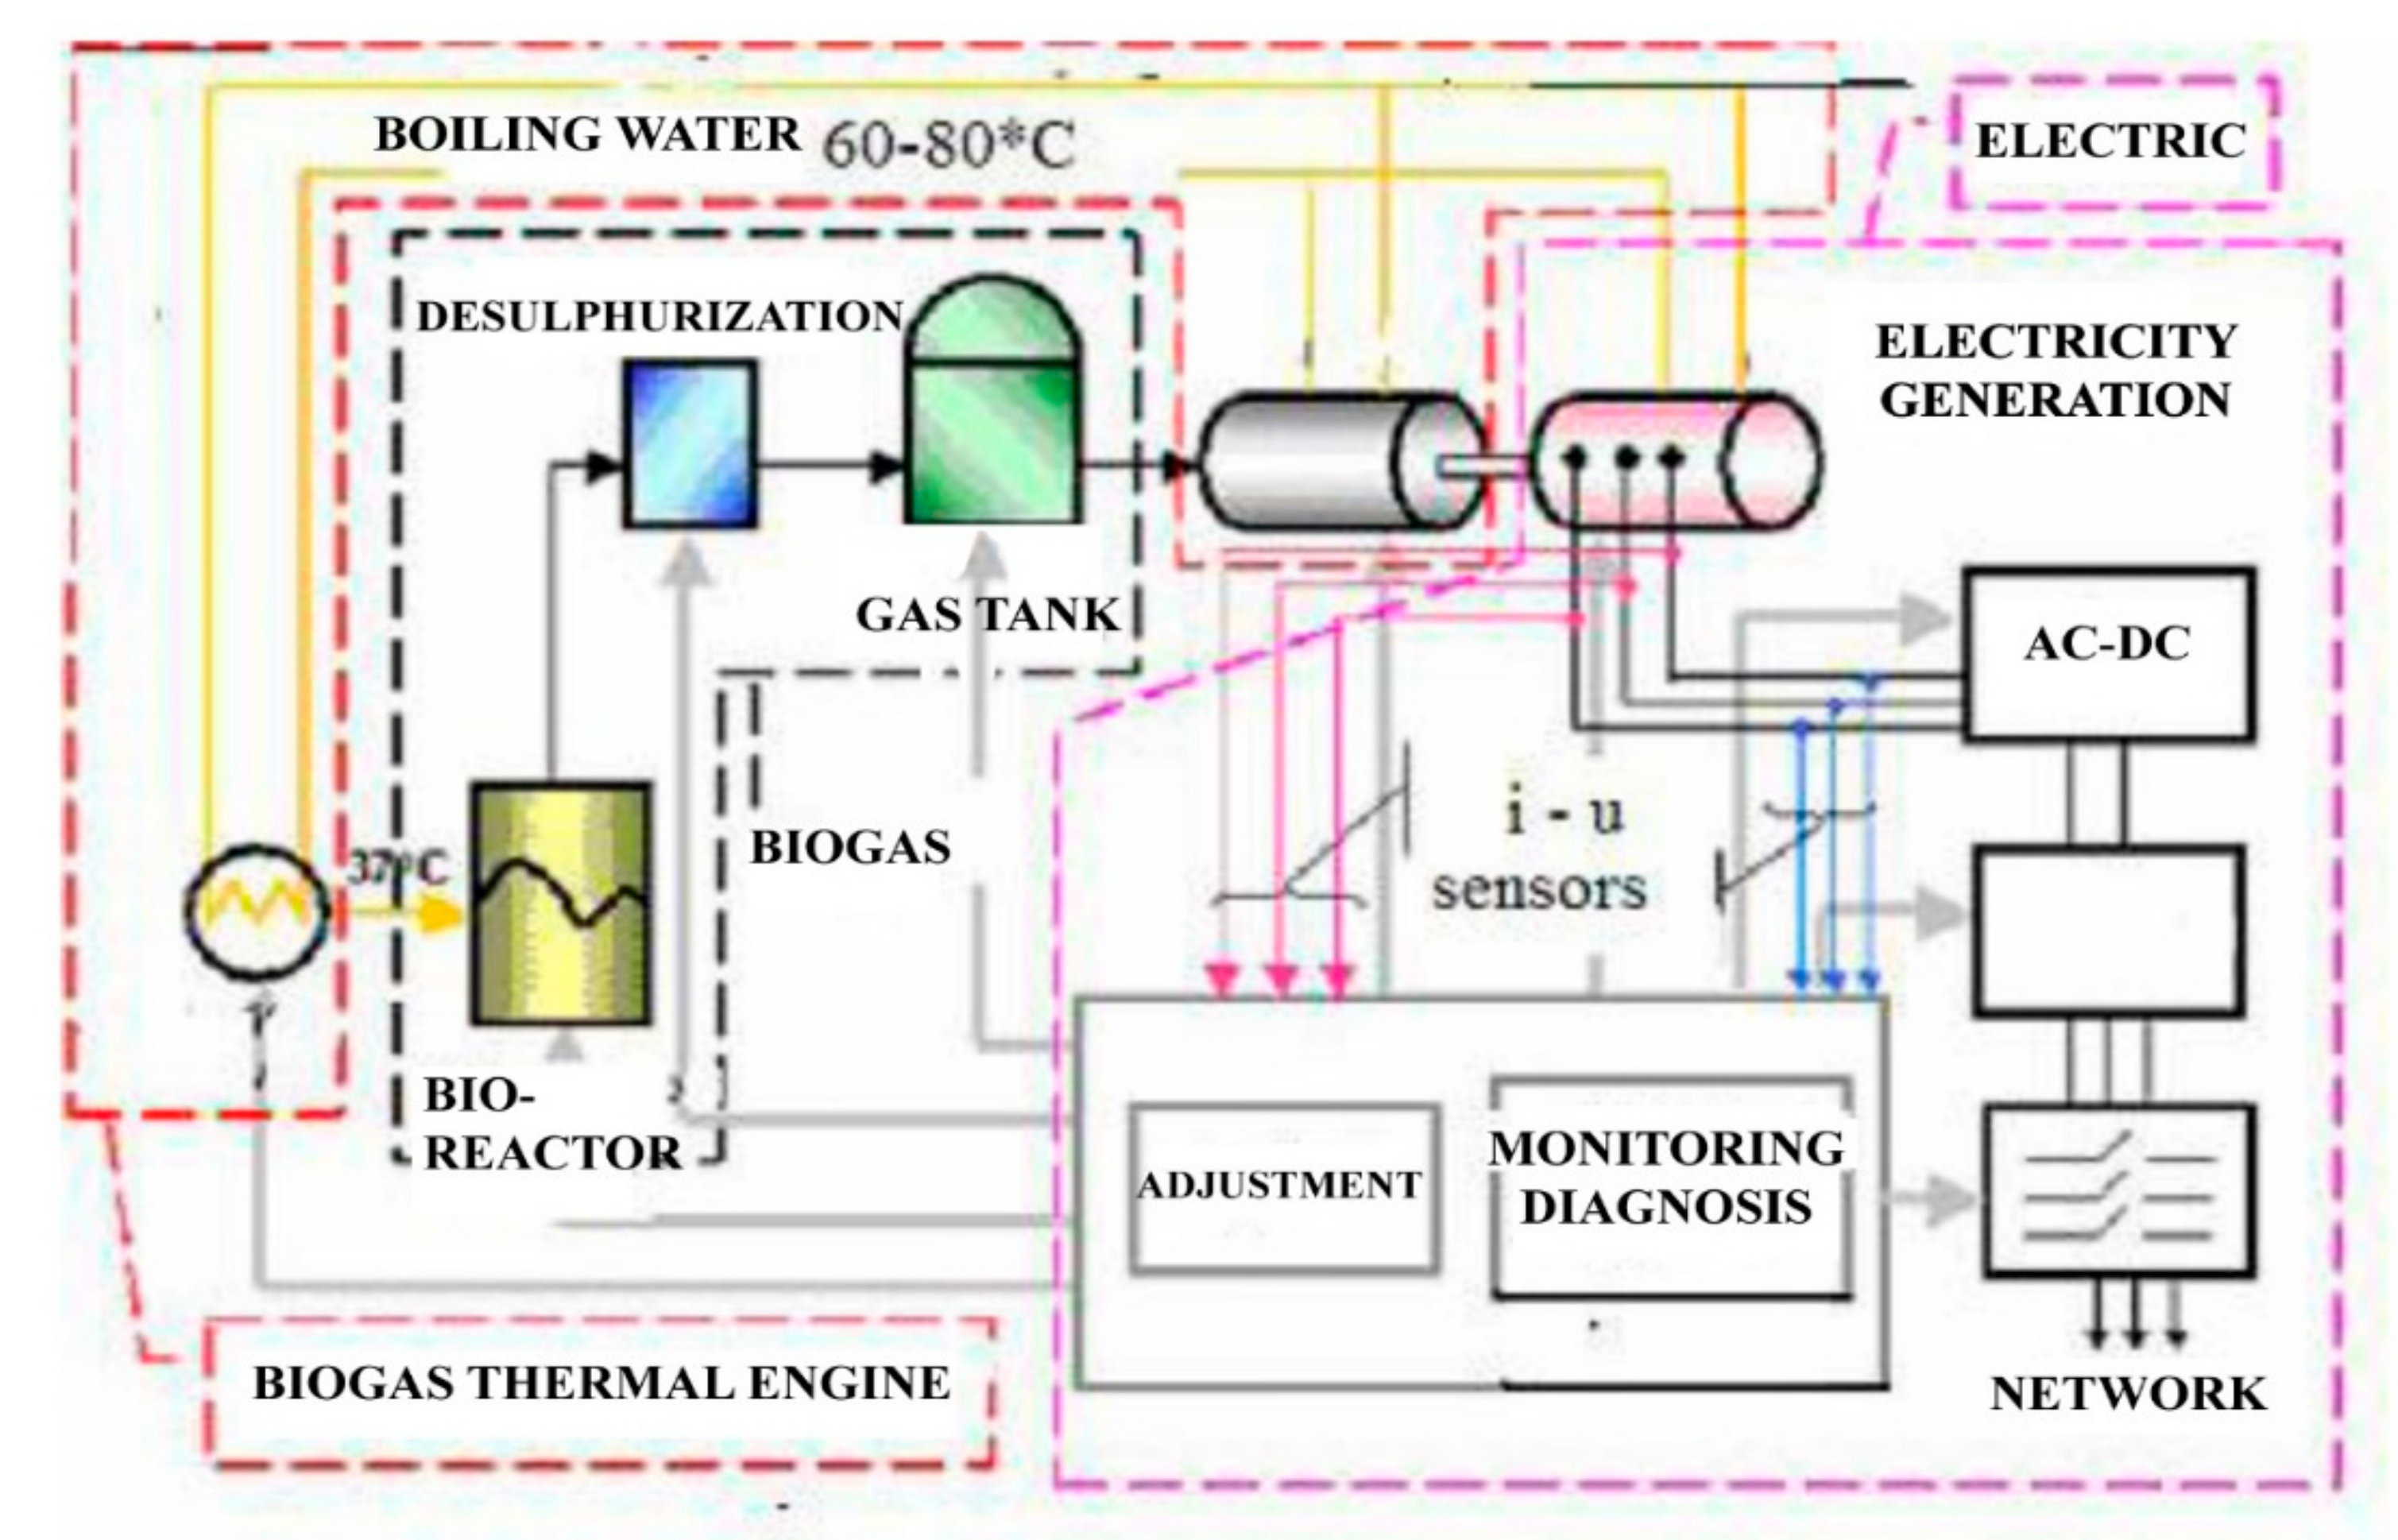
3, so that it guarantees the operation of the cogeneration plant). (ii) Thermal energy circuit: As a result of the biogas burning process, the resulting heat energy is used for the needs of the slaughterhouse (water is used in the slaughterhouse to produce the heat and processed water needed for the technological flow). (iii) Electrical energy circuit: The electric power is produced by the electric generator; part of the energy is consumed internally to provide electricity for the consumers, while part is exported to the National Power System (NPS), after increasing the voltage level in the lift transformer.
All these technological flows are supervised by a system based on logic controllers, real-time monitoring, control and diagnosis which is a real support for the maintenance personnel, as well as for the entity management.
The operation of the biogas plant involves the following steps:
The entry of viscosities and blood waste resulting from the slaughter process into the BI is carried out by a vacuum pipeline.
In the BI, the manure is taken up in two sterilizers with a capacity of 10 t each. Thus, 60 t of waste are being processed in 24 h. In the sterilizer, the waste is heated to a temperature of 130 °C for 21 min at a pressure of 3 bar. After the processing period, the sterilizer is discharged automatically, and enters in the digester.
The analyzed BI has three digestors with a capacity of 300 t/digester; the temperature in the digester in the mesophilic cycle is 38 °C; the pressure is between 1.8 and 3 bar.
Stirring is done with submersible mixers and high-pressure mixers. The energy efficiency for this type of process is 30%. At 3.5 bar, the pressure valve opens. It is necessary to dry, desulfurize and purify the biogas for powering the engines.
Biogas is taken and transported via a pipeline to the cogeneration installation (
Figure 2), where it is transformed into energy by two engines. Internal combustion engines use desulfurized biogas as fuel, and the heat produced after the combustion process is recovered and used to heat the digester or heat the production spaces. The mechanical energy produced is converted into electricity by a generator and delivered to the electrical grid after an electronic conditioning. The processing yield is 60–70% methane, 25–30% CO
2. The energy yield is: 1 m
3 of methane = 2–3.5 KWh of electricity. Heat power is 5–7.5 KWh.
The discharge from the digester is carried out by a pump system, separating the dry part (sludge) from the liquid part (wastewater) which is taken up by the wastewater installation for treatment.
Physico-chemical parameters of the resulted biogas are the following:
Physical properties: gas without color, with specific odor of flaky eggs (due to hydrogen sulfide), without taste
The approximate composition: methane (60–62%), carbon dioxide (36–38%), hydrogen sulfide (max 2%), small quantities of other elements (hydrogen, nitrogen, oxygen, etc.)
Calorific value: 5400–7200 Kcal/m3
Density (CH4, 60%; CO2, 38%; others, 2%): 1.21 kg/m3
Wobbe Index (CH4, 60%; CO2, 38%; others, 2%):19.5 MJ/m3
Maximum firing rate (CH4, 60%; CO2, 38%; others, 2%): 0.25 m/s
Theoretically required air (CH4, 60%; CO2, 38%; others, 2%): 5.71 m3 air/m3 gas
Maximum CO2 concentration in the fuel gas (CH4, 60%; CO2, 38%; others, 2%): 17.80%
The fixed assets of the BI, from an economic point of view, are presented in
Table 3. The total investment value for the BI was EUR 5,458,774.00.
The opportunity to develop biogas production is mainly related to the availability of the raw material needed to produce biogas, so the biogas potential depends on the quantity of slaughtered chickens and the resulting by-products destined for neutralization by AD. The use of biogas as renewable energy is considered an alternative to the use of traditional fuels, resulting in a reduction of energy dependency, increasing sustainability and stimulating economic growth. Thus, the approach of the research aims to validate or invalidate the following hypothesis: The implementation of a BI can contribute to the profitability of the economic entity.
As part of the research, based on the financial-accounting and technical information of the BI presented above, the net result was determined and analyzed over a period of three years. Quantification of the economic effect generated by the BI in poultry processing units, by producing cost–benefit analysis that highlights the net result obtained, helps the decisional architecture and the justification of the investment decision at the entity level.
4. Results
The quantity of poultry processed by the slaughterhouse during the analyzed timeframe depends on the variation in the demand for products in the market, being perishable products that are sold fresh, requiring a rapid distribution. The amount of slaughterhouse waste resulting from the technological processes on the production stream is directly related to its production. When the slaughterhouse production capacity is close to the maximum, large quantities of waste are generated that the BI cannot retrieve and process at the same time with the increased production rate. Thus, the quantity that can be neither processed immediately nor stored (on the grounds of rapid deterioration) is sold to another BI with a higher processing capacity. In the analysis, technical and economic indicators were considered based on the results generated by the BI for the period January 2015–December 2017.
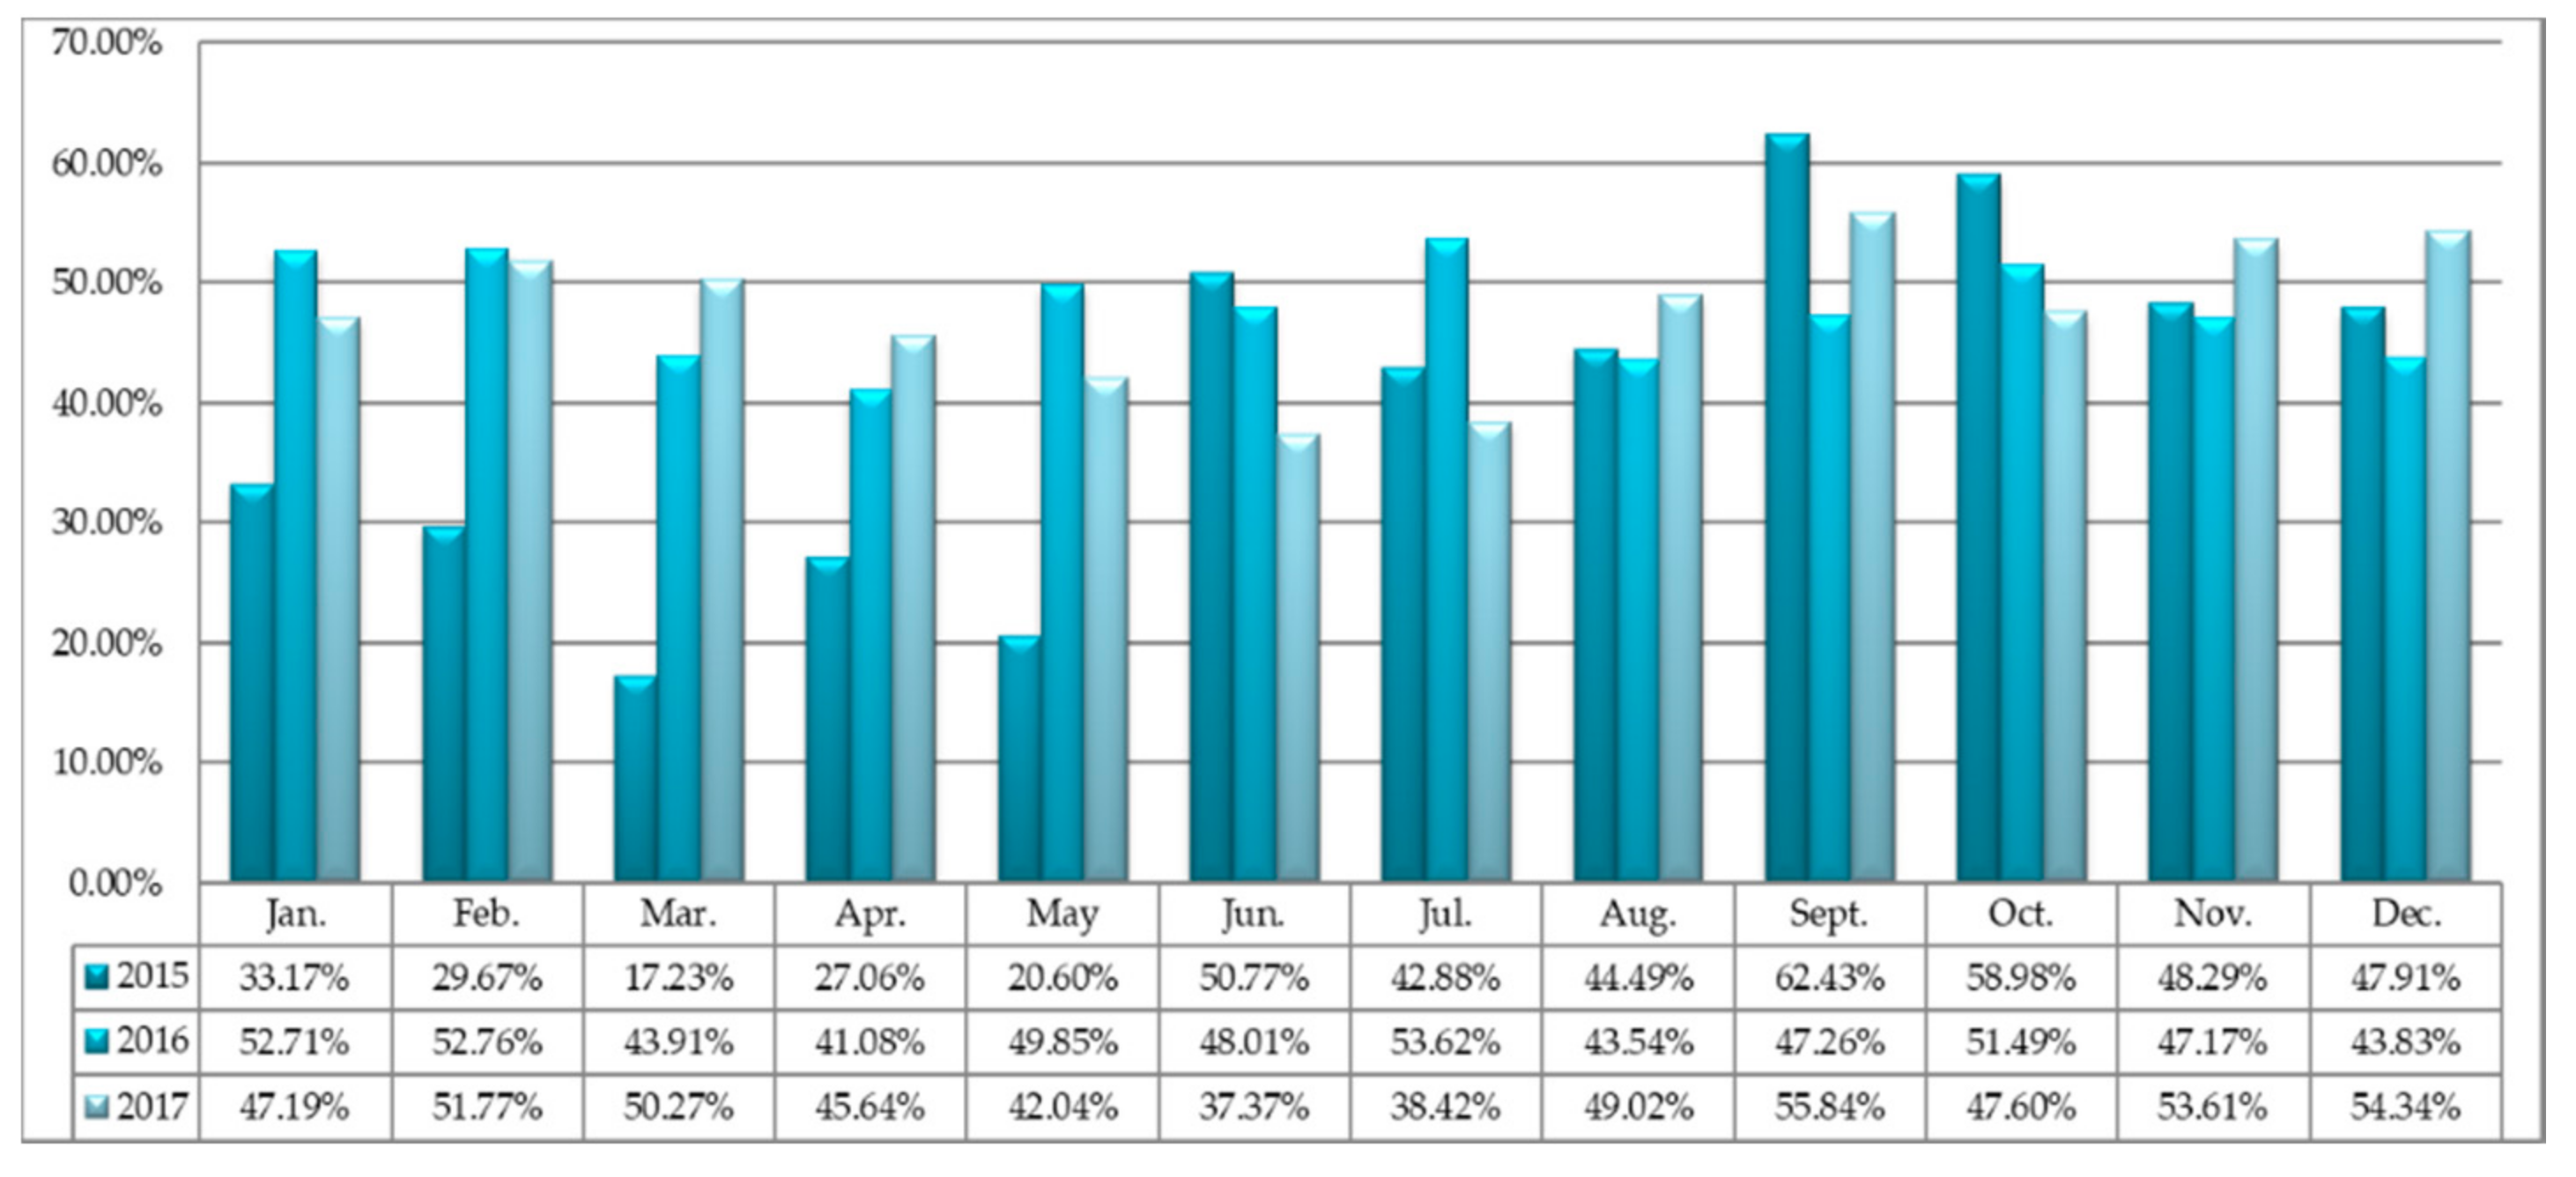
The main quantitative input and output indicators that were considered are the following: variation in the degree of processing of the waste (
Figure 3) and changes in the amount of electricity (
Figure 3).
The degree of processing of the waste (D
pw) is calculated using the following formulas:
where A
pw is the amount of processed slaughterhouse waste (ton); T
w is the total slaughterhouse waste; and
where A
sls is the amount of slaughterhouse sold (ton).
From the analysis made on the degree of processing the waste in the BI, we can see that the annual average of processing is slightly increasing. The average values are presented also in Table 9 (41.77% in 2015 to 47.70% in 2017).
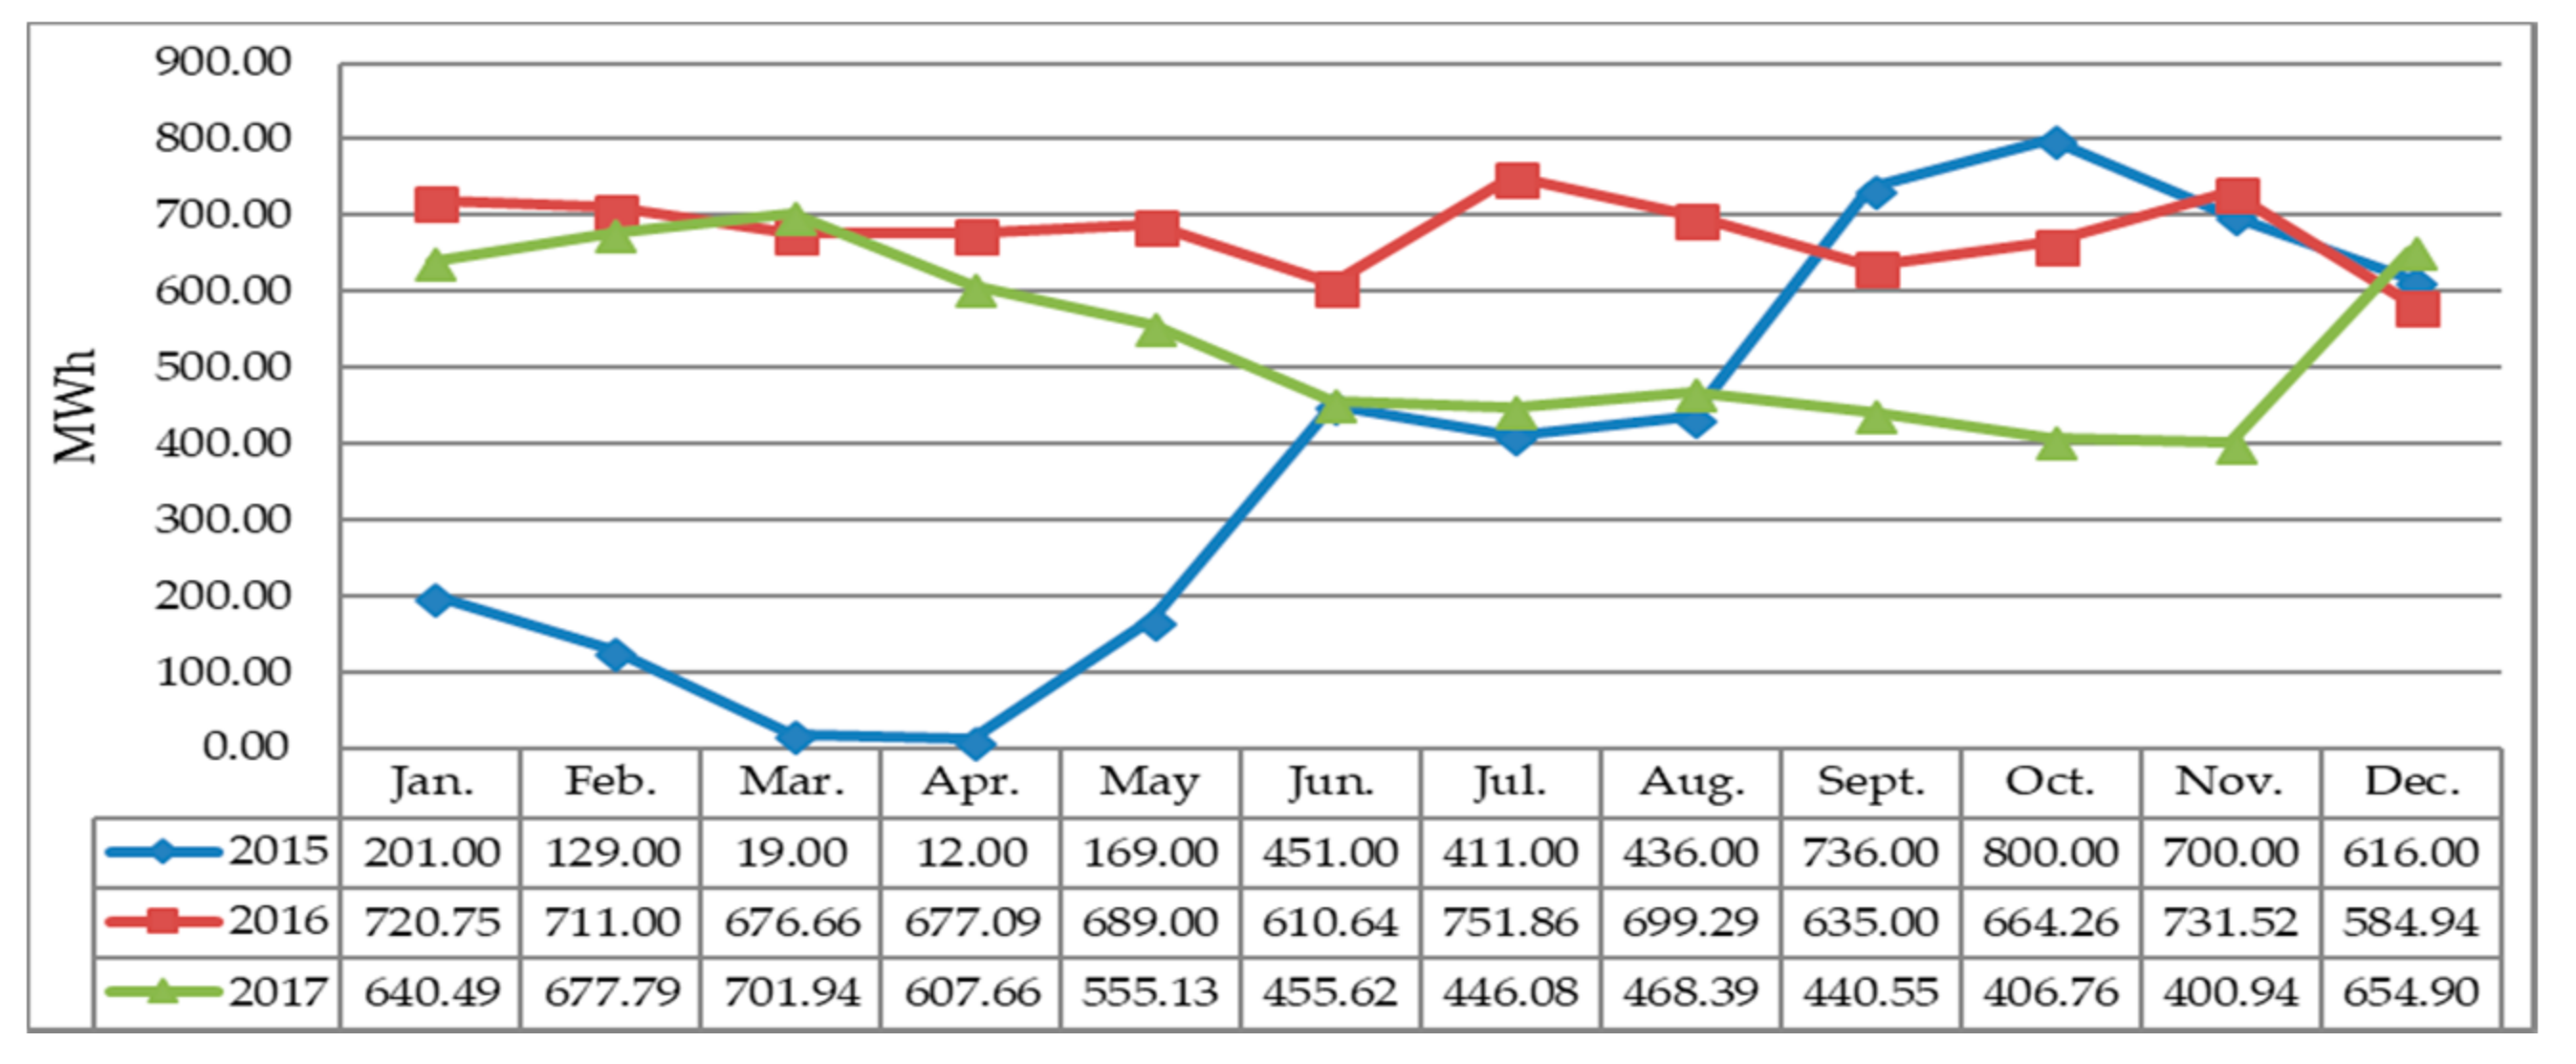
The analysis of the amount of electricity generated by BI processes allows us to note that there are variations monthly (
Figure 4) and on the annual averages (4680 MWh in 2015, 8152 MWh in 2016 and 6456 MWh in 2017), as presented in Table 9. According to the monthly energy obtained from the biogas installation, green certificates (1.92 certificates/MWh) were obtained, which, through valorization, allowed extra revenues.
In the first part of 2015, as technical and technological improvements were made to the biogas installation, the quantities of processed waste were considerably reduced compared to the other analyzed periods, and the electricity production was also affected. Clogging of the digestors occurred due to significant deposition of solid matter, which caused the digestion processes to slow down. Thus, fixing the problem generated a cost of EUR 60,000, a 45-day execution time, and required three months for the activity to return to normal. Before this intervention, they worked alongside the viscera, blood and claws. Chicken claws contributed to the deposition of bone in the digestor and, following the intervention, the management of the economic entity together with the contracted expert team decided that the claws would not be processed in the biogas installation, but would be sold separately.
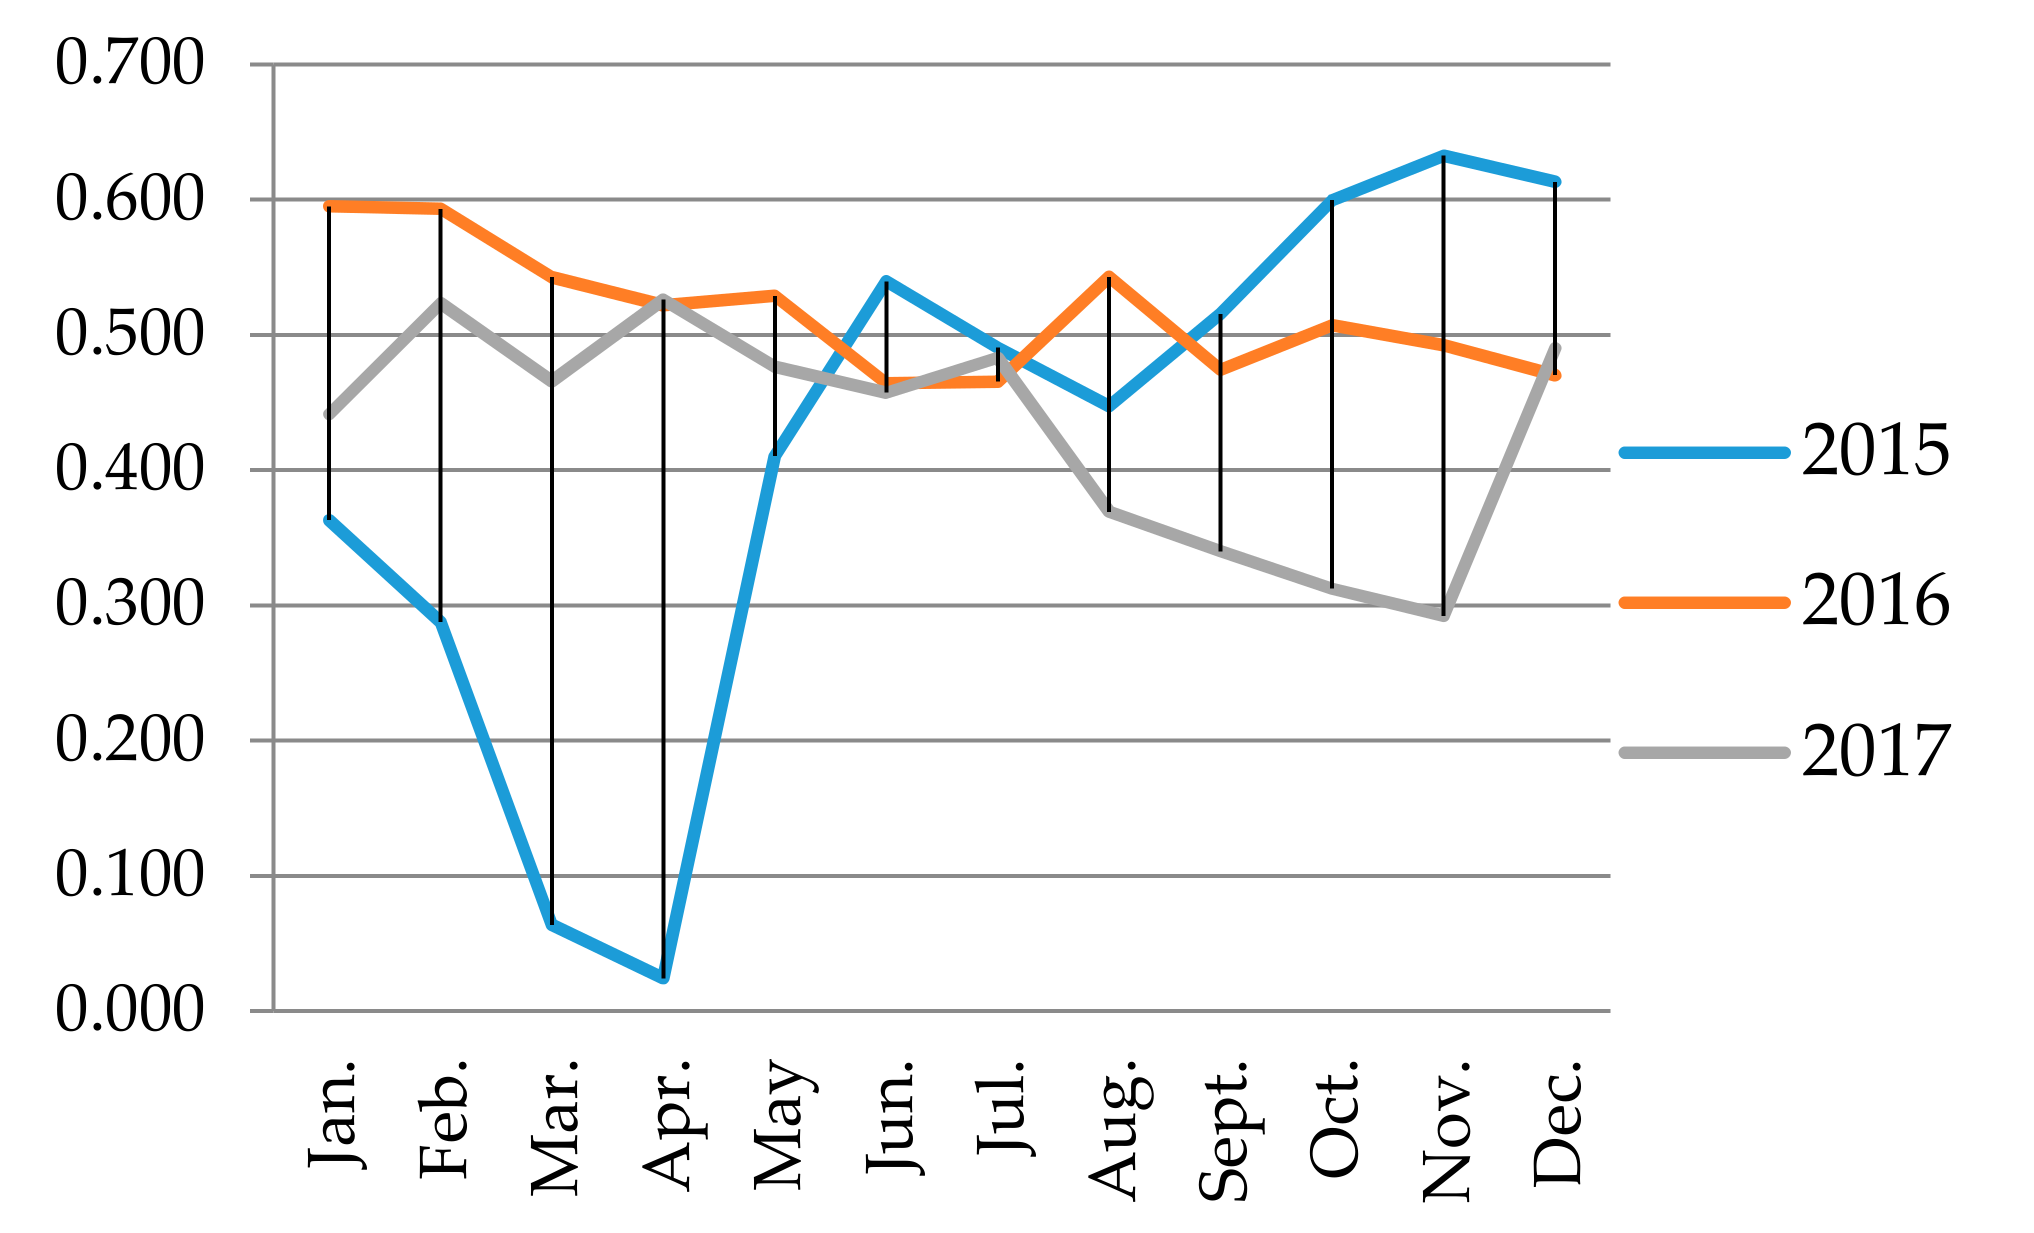
The average monthly productivity of processed waste, expressed in electricity, per ton of waste processed (MWh/ton processed waste) in the analyzed period, was 0.454 and the peak productivity of 0.633 MWh/ton was recorded in November 2015 (
Figure 5).
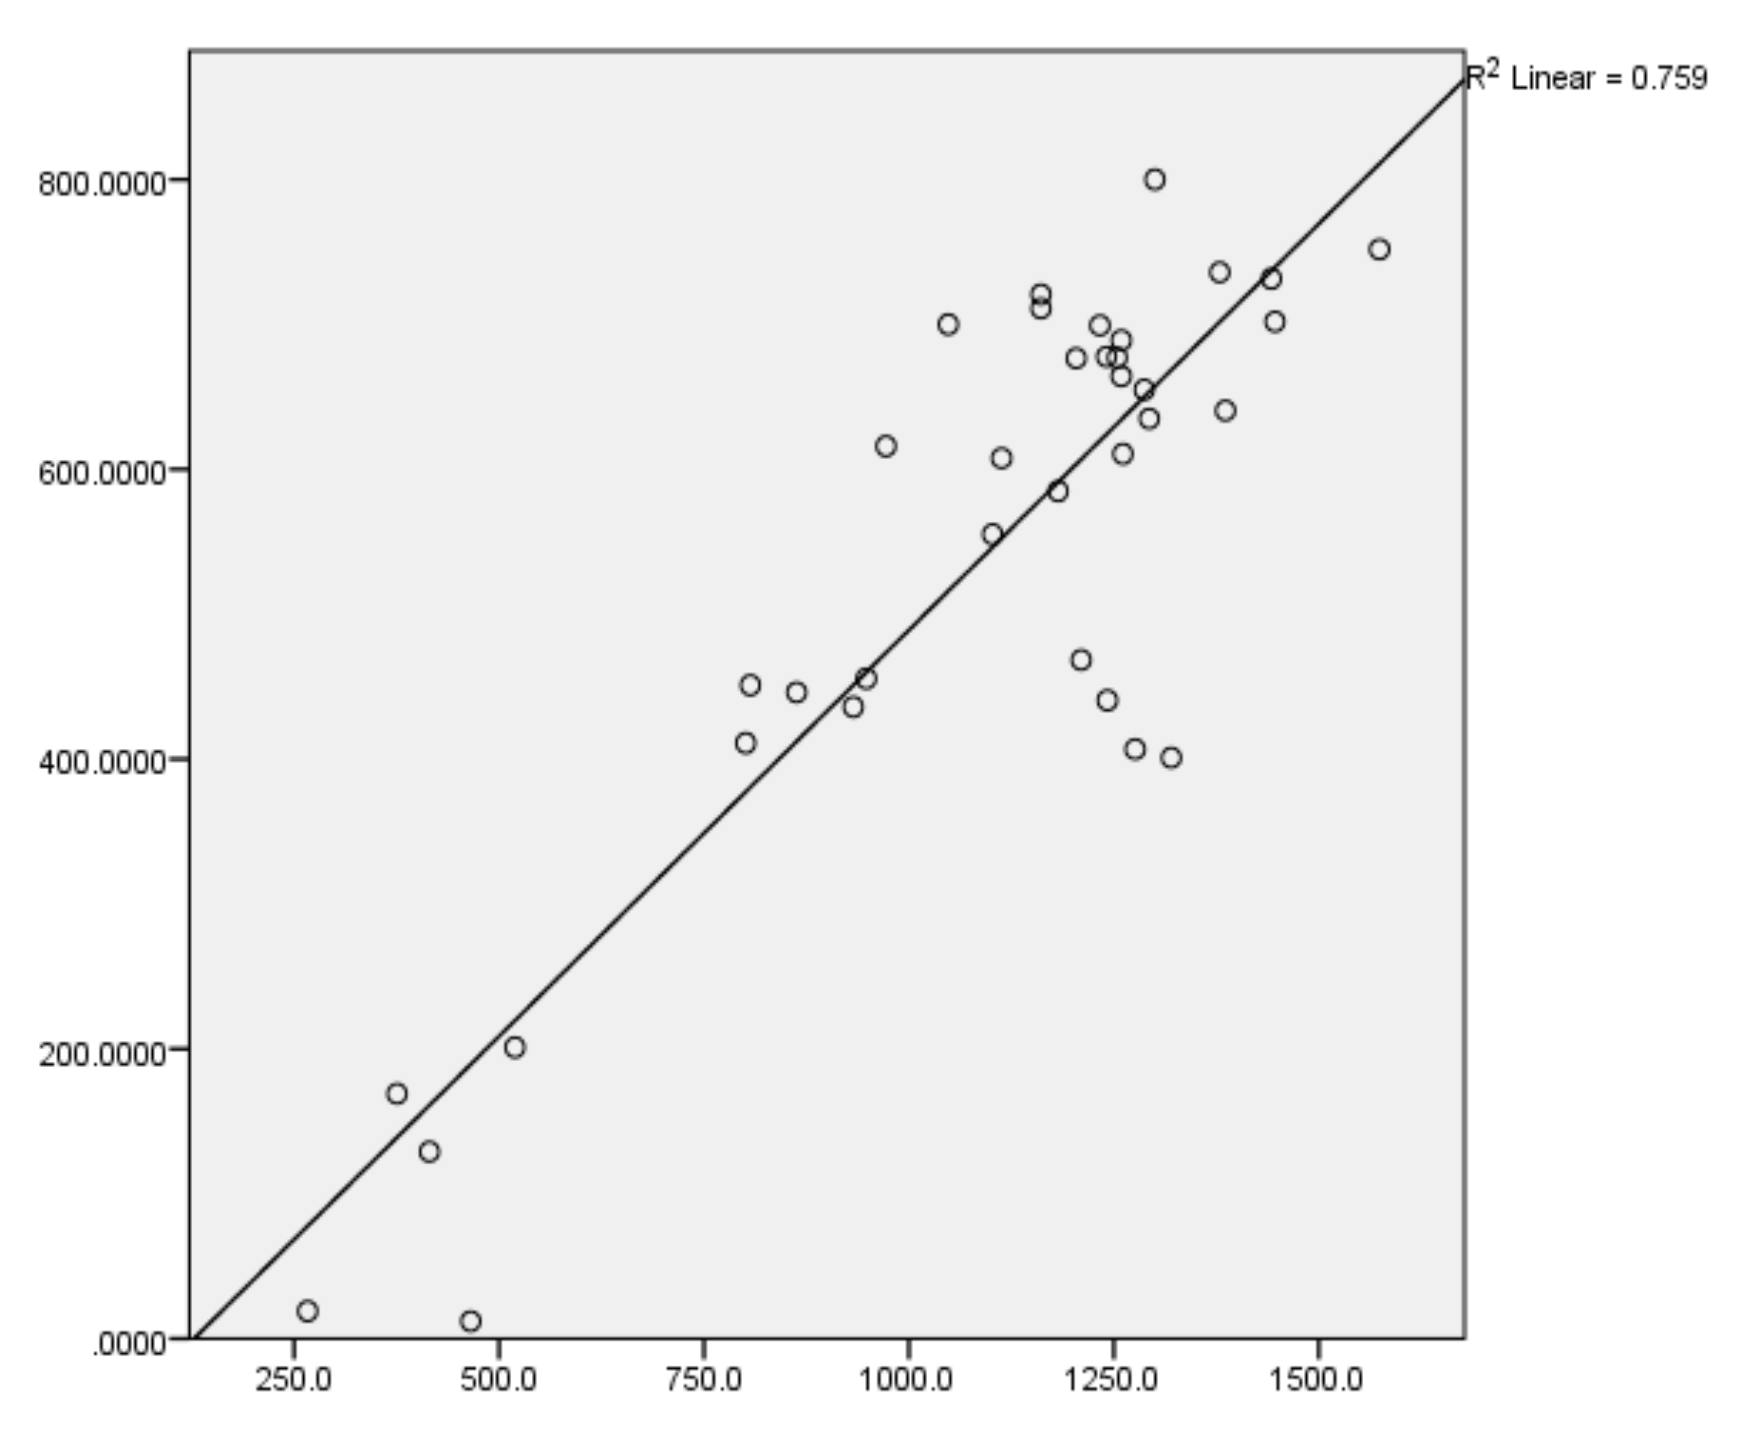
The analysis in SPSS of the link between the amount of waste processed and the amount of electricity obtained reveals the information presented in
Figure 6 and
Table 4 and
Table 5.
From the analysis, we can see a direct link between the quantities of waste processed and the quantities of electricity obtained. The regression equation that highlights the relationship between the two variables is illustrated in
Table 6,
Table 7 and
Table 8. Based on the information provided by SPSS, the regression equation is:
At the same time, under the given circumstances, we cannot omit the properties and conditions of the raw materials, which also influence the quality, quantity and properties of the result obtained from the biogas production process, reflected in the productivity of the processed waste, which also presents variations.
Typical exploitation of BI is integrated into existing businesses, such as farms, industrial companies or waste companies. The type of business influences the main objectives of the BI, as well as the possible options for using electric and thermal energy. In the example under consideration, the main objective of the BI is to neutralize chicken waste from slaughtering processes. To sum up, over a period of three years (2015–2017), the main economic indicators of the BI are presented in
Table 9.
The net result was influenced by the interference between the technical issues (2015) and the instability of the green certificates market (2016 and 2017, respectively). The digestate is not included in the determination of net result, as it was eliminated in the reference period as waste taken at the municipal landfill. To eliminate this unfavorable aspect, the investigated entity conducted specialized studies in collaboration with an authorized lab, and a fertilizer product was patented. Thus, according to the legislation in force, the quantity of fertilizer checked in the lab must be verified and applied on experimental lots for three years. Starting with the autumn of 2018, the fertilizer can be used at industrial scale, but the economic entity must invest in a maturing platform valued at 40,000−70,000 EUR.
At the same time, the average value of green certificates recorded on income in 2015 was 43.32 EUR/certificates, a value established through OPCOM (the company Operatorul Pietei de Energie Electrica si Gaze Naturale “OPCOM” S.A. fulfills the role of the electricity market administrator) [
49]. In 2016, the value of green certificates decreased significantly, thus between January and April it was 43.32 EUR/certificate, and in May−December it was 29.06 EUR/certificates (the minimum value set by OPCOM). In 2017, between January and March, the value of green certificates was 28.54 EUR/certificate. Starting from 31 March 2017, the “Government Emergency Ordinance No. 24/2017 came into force amending and completing Law No. 220/2008 establishing the system for promoting the production of energy from renewable energy sources”, based on which green certificates are no longer recognized as income at the time of receipt, the bookkeeping of which is carried out on an unrecoverable basis. This has caused a market failure. The income lost due to the legislative change was 243,097 EUR, which is equivalent to 8,517 green certificates that could be traded at 28.54 EUR/certificate.
The revenues obtained are closely related to the amount of energy obtained, but they also depend on the income obtained from the use of green certificates, which is not constant, varying especially from the conditions of market intervention. The installation costs are also dependent on the production process and the actual use of the BI. Although the initial purpose of implementing the BI was to ensure waste management, we can assume that it can also contribute to the profitability of the economic entity, which leads us to validate the hypothesis of this research.
5. Conclusions
The results obtained in our analyzed case study lead us to conclude that the utilization of the BI in an entity of AIS, especially from poultry industry, is economically feasible, as an important amount of revenues was obtained and the net result was positive. The research has revealed that the BI contributes to the profitability of the economic entity, even if its main purpose was to ensure waste management from the slaughterhouse. Thus, we consider that the quantification of the economic effect generated from BI fully justify the initial investment decision from the economic point of view. Further, the management of the economic results generated by the BI will support decision-making.
In conclusion, biogas production has beneficial economic effects and can solve waste problems resulting from AIS. However, BI are still not receiving due attention In Romania, as the implementation of such BI projects involves numerous technical and technological costs and skills. Thus, educating and raising awareness of the management of the entities form AIS regarding the extra income obtained by transforming manure from its own production into energy and the various related benefits must be a basic premise in the application of biogas technology in the Romanian AIS. We can affirm that the analyzed BI for poultry wastes treatment represents a success of the implementation of biogas technologies in Romania. At the same time, this can also be a good practice case for other AIS entities, and to encourage them to implement biogas technologies, as Romania has a great potential for raw material for biogas generation.
As recommendations, the main aspects that can influence the economic efficiency of the future poultry BI are the following: the processing capacity needs to be carefully adapted to the amount of waste that needs to be treated; its own need of electricity and heat can be integrally ensured by the valorization of biogas obtained from animal wastes, or supplementary income can be obtained from selling electric energy to the NPS; and the valorization of green certificates obtained is closely related to the evolution of the green certificates market.
Considering that there is never enough information on the economic viability of BI, especially at national level from chicken slaughterhouses, we believe that our research is a starting point for encouraging the development of the biogas sector at national level, and that our research contributes favorably to the enrichment of the biogas literature.


 ,
, 


