Impact of Land Input on Economic Growth at Different Stages of Development in Chinese Cities and Regions


Guangdong Provincial Key Laboratory of Urbanization and Geo-simulation, School of Geography and Planning, Sun Yat-Sen University, Guangzhou 510275, China
*
Author to whom correspondence should be addressed.
Sustainability 2018, 10(8), 2847; https://doi.org/10.3390/su10082847
Submission received: 14 July 2018
/
Revised: 5 August 2018
/
Accepted: 8 August 2018
/
Published: 10 August 2018
Abstract
:Regional industrial structure and land use patterns differ between the different stages of development, and the impact of land input on economic growth may vary. On the basis of land supply data obtained from http://www.landchina.com/ for 2010–2015, this study used an econometric model to explore the impact of land input on the economic growth of Chinese cities and regions at the different stages of development. Empirical results show that the development of 352 cities and regions in China in 2015 can be divided into five stages; namely, primary production stage (PPS), primary industrialization stage (PIS), middle industrialization stage (MIS), later industrialization stage (LIS), and developed stage (DS). The economic growth of cities and regions at the LIS or DS was significantly dependent on capital and labor input rather than land input. The land input of cities and regions at PPS, PIS, and MIS significantly promoted economic growth. This article enriches the study of regional economic growth and is beneficial to further understanding of the impact of land input on the economic growth of China.
1. Introduction
In the past 40 years, the economy of China has rapidly developed and has emerged as the second largest economy worldwide measured by gross domestic product (GDP), the largest global factory (with an unparalleled scale of industrial output), and the first-ranked exporter in the world [1]. The rapid growth of this economy has resulted in the extensive consumption of arable land, and urban construction land has experienced rapid expansion. From the beginning of the 21st century, urban construction land area in China has increased from 22,114 km2 in 2000 to 52,761 km2 in 2016, an increase of 138.59% [2]. In 2011, Chinese cities provided jobs and settlements for more than 50% of residents in the entire country [3]. Urban land expanded by 3% when GDP increased by 10% during the late 1980s and 1990s [4]. Therefore, land input is considered a crucial factor in maintaining the rapid economic growth in China [5].
Because of the rapid industrialization and urbanization in China, the demand for land is increasing, and the scarcity of land resources caused by economic and social development is becoming increasingly severe. In 2003, the central government explicitly proposed the adjustment of macroeconomic allocation by adjusting the allocation of land resources [6,7]. Therefore, land and land management are considered a factor of production and a macrocontrol policy tool, respectively, in China. The central government can effectively regulate economic growth by controlling the land supply to adjust the scale and direction of investment. Local government transfers land use rights to users, obtains land leasing fees, and then transfers part of the land leasing revenue to infrastructure construction for promoting economic growth [8,9,10]. Under the guidance of regional competition, some local governments even lease land at lower prices to attract foreign investment and stimulate economic growth [1,11,12]. Therefore, land input may promote economic growth in China. However, the rapid expansion of urban land has great pressure on the protection of cultivated land and sustainable development of 2035 km2 of cultivated land were converted to construction land every year from 1997–2005, of which high-quality cultivated land accounts for nearly one-third [13]. Tremendous land use changes have caused various issues such as land degradation and erosion, landscape land area reduction, and carbon sequestration capacity shrinkage of ecosystems in China [13,14,15]. The growth of China’s population and the rapid decline of cultivated land have raised concerns about the Chinese people’s ability to feed themselves and the possible impact on global food security [16,17]. Hence, in the face of the diminishing arable land resources and increasing food demand due to population growth, it is more important for cities and regions at different stages of development to formulate reasonable land management policies to coordinate economic sustainable growth and arable land protection.
This paper used the land supply results bulletin of the China land market in 2010–2015 to explore the impact of land input on the economic growth of cities and regions at the different stages of development and analyze the impact of economic growth mode on land use at different stages of development for proposing relevant policy recommendations for coordinating the protection of cultivated land resources and sustainable economic development in China. The land input used by previous studies primarily referred to urban developed areas or urban construction land. In this paper, the real-time results of land transactions between local governments and individuals, enterprises, and other organizations in the primary land market of China was used as the land input, which reflected the real-time demand for the state-owned construction land due to economic growth. Although studies have explored the differences between the impacts of land input on the economic growth of China in different regions, these studies primarily discussed the effects of land input on economic growth in eastern, central, and western China. Moreover, these studies may do not accurately reflect the impact of regional land inputs on economic growth at the different stages of development. Therefore, we identified the economic development stages of 352 Chinese cities and regions (These cities include 4 municipalities directly under central government, 282 prefecture-level cities, 30 autonomous prefectures, 8 regions, 3 leagues, and 25 counties directly managed by the provinces. The administrative scope of these cities includes municipal district (shixiaqu) and non-municipal district (feishixiaqu)) based on the per capita GDP and industrial structure. In theory, the development stages of each city and region could change during the study period. To ensure the comparability of findings, the development stage of each city and region was identified based on the per capita GDP and industrial structure in 2015. This study shows that the imbalance of regional economic development in China was reduced from 2010 to 2015. Compared with cities and regions at other development stages, the imbalance of the economic development of cities and regions at the middle stage of industrialization was more significant; however, it was rapidly reduced. In the process of upgrading the regional development stage, the demand for construction land was increasing because of economic development. The key driving force of the economic growth of China from 2010 to 2015 was investment, which may be related to the “4 trillion investment plan” launched by the central government at the end of 2008. The economic growth of cities and regions at later industrialization stage (LIS) or developed stage (DS) depended on the input of labor and capital rather than land.
This paper is structured as follows: first, the impact of land input on economic growth in China is reviewed; second, the economic growth and land input of cities and regions are analyzed at the different stages of development; and third, the impact of land input on regional economic growth at the different stages of development is examined. Finally, the primary results are summarized, and policy implications are discussed.
2. Previous Literature
Land is the basic carrier of all human production and living activities. Economic activities do not occur without land. Land investment typically contributes to an increase in national wealth [11]. Neoclassical growth theory indicates that land input has a marginal effect on economic growth and may even have a negative effect with the constant input in technology and other factors of production [18]. Some views indicate that most of time in growth regressions, land inputs show up as a curse to economic growth [19,20].
At present, the unique urban and rural dual land property rights system has been established in China. The land in urban areas is owned by the state. Rural and suburban land is collectively owned by peasants except for those owned by the state as stipulated by law. Local governments usually requisition the land from villagers for the development of non-agricultural industries at a lower price. The land use rights are then transferred to the developer primarily through allocation (huabo), granting (churang), and lease (zulin). In this process, the ownership, the right to use, and the functions of the requisitioned land are all changed, and the local government will obtain more land lease fees from the developers. In addition, some state-owned construction land with inefficient use will be requisitioned by local governments during urban renewal process. The use rights of these lands will be traded on the land market. In short, the Chinese government is the actual controller of land market transactions. Therefore, some studies argue that land in China is a crucial tool for local governments to attract investment and promote economic growth [21]. Under the current land management system, because local governments are the only land suppliers, they can lease industrial land at lower prices to attract investors [9,11,22] or earn large revenues by leasing land to finance infrastructure and urbanization [23,24,25,26,27,28]. Therefore, the frequent leasing of the land by local governments reflects increasing investment and promotes large-scale economic growth [29].
Land input is a crucial strategy for local governments to compete for economic growth under the current personnel control system, in which local economic performance is the most crucial indicator of local government officials [30]. To compete for attracting enterprises, local governments follow each other and establish various development zones [12,31,32], which may lead to the availability of more land in neighboring cities to support infrastructure construction and attract enterprises [9,11,33]. The establishment of various development zones has generated a significant negative economic spillover effect because of the fierce competition for attracting investment [11]. By contrast, an increase in regional transportation land may have improved inter-regional transportation networks, thus benefiting economic growth in neighboring cities [11].
Local government-led land supply has undoubtedly contributed to the industrial development, infrastructure construction, and urban expansion of China in the past 40 years [34]. Some studies have introduced developed urban areas or urban construction land into urban economic growth models to explore the necessity of land input in the economic growth of China. These studies have revealed different findings, perhaps because of the difference in the land input data and socio-economic development environment in China during the study period. For example, a study indicated that the contribution of land factors to the national economic growth during 1992–2000 was 13.93% and 26.07% during 2001–2009 [35]. Other studies have indicated that the industrial land input in China has significantly promoted gross domestic product (GDP) growth from 2000 to 2006; however, its contribution has gradually declined over time, and the contribution of technology, manpower, and capital has continually increased [36]. Therefore, some researchers have argued that with the rapid development of science and technology, technological progress can reduce the dependence of human production activities on natural resource inputs, and it can replace land input to promote economic growth [37,38,39]. For example, with its high technological advancement, the economic growth of Shanghai was less dependent on land resources in 1997–2002, and the contribution of technological progress to economic growth was higher than 90% [40]. Although land input has been crucial in promoting the economic growth of China, it was less crucial than labor input between 1996 and 2003 [5]. Some researchers argued that land input had the least impact on economic growth among the three primary factors of production, namely land, labor, and capital, from 2003 to 2012 [41].
Because of the scarcity of regional land resources and the imbalance of economic development level, the impacts of land input on economic growth differ significantly between regions. Land input in the economically intensive coastal region in China has significantly promoted economic growth from 1996 to 2003 [5]. In central and western China, because of inefficient land use or rich land resources, economic growth depends on capital and labor rather than land [5]. However, some research findings differ considerably from this conclusion. Some researchers argued that, compared with economically developed eastern China, the capital, labor, and other factors of production in less economically developed central and western China are relatively lacking, and the scientific technology and management were less developed in 1999–2008 [7]. Therefore, the contribution of land input to economic growth is significant, particularly in western China. In addition, some researchers argued that the contribution of land input to economic growth is highest in central China and lowest in eastern China from 2003 to 2012 [41].
3. Methodology and Data
3.1. Methodology
3.1.1. Theil Statistics
To reflect the imbalance of regional economic development in China, this study adopted the Theil index, which is based on the concept of entropy in information theory [42]. Compared with other imbalance indices, the Theil index generally has less stringent data requirements, which are beneficial when group data are more easily accessible than individual survey data [43]. Moreover, one of the crucial features of Theil index is its decomposability, which enables inequality to be decomposed into the sum of a between-group (TB) and within-group (TW) component if a population can be divided into subgroups [44]. The formula is as follows: T = TB + TW.
The between-group component of Theil index can be expressed as follows:
where () is the nonagricultural industry added value weight for the ith group; that is, the share of the nonagricultural-industry added value of the ith group in the total nonagricultural-industry added value of all groups. () is the share of the population of the ith group in the total population.
is also called the Theil element for the ith group.
The within-group component of the Theil index can be expressed as follows:
where () is the share of the nonagricultural-industry added value of the ith subgroup of the jth group in the total nonagricultural-industry added value of the jth group, and is the share of population of ith subgroup of the jth group in the total population of the jth group.
3.1.2. Economic Model
From the perspective of marginal utility school, production activity is a practical re-creation activity that includes the creative activities of not only tangible substances, but also intangible substances, such as services [45]. These activities are based on a certain input of production factors. A particular relation exists between factor inputs and outputs (products of utility recreation), which are generally expressed as production functions:
where x represents output; and y1, y2, and y3 represent the inputs of different production factors.
In 1928, Cobb and Douglas proposed a production function based on the manufactured industrial output (Y), labor volume (L), and fixed capital (K) from 1899 to 1922 in the United States [46]. The basic formula of the C–D production function is as follows:
where a and b are constants that are greater than zero such that a + b = 1.
The C–D production function is a classical model for analyzing urban economic growth. In this study, land (S) was introduced as an independent factor into the C–D production function, and the impact of land input on regional economic growth was analyzed at the different stages of development in China.
To reduce the heteroscedasticity and ensure the stability of data, the formula was logarithmized, and a normal panel data regression model was established.
where Y, K, L, and S represent the nonagricultural-industry added value (The ownership of land referred to in this article belongs to the state rather than the village collective. State-owned construction land is concentrated in towns and cities. Therefore, the indicator of economic growth is measured by nonagricultural value added.) (based on the price in 2010), capital investment, labor force scale, and land input, respectively. , , and represent the estimation coefficient of capital investment, labor force scale, and land input, respectively. represents an error term. i and t denote the city (region) and year, respectively. Labor force and land input are represented by the number of employees in secondary and tertiary industries and land supply scale, respectively.
Capital input is expressed as the stock of capital. The calculation method of capital stock is as follows [47,48]:
First, the total social capital stock of each city and region in 2010 was calculated according to Equation (8).
where is the fixed asset investment of city (region) i in 2010; is the nominal per capita GDP growth rate of city (region) i for 2010–2011; and δ is the depreciation rate, with a unified adoption of 9.6%.
The nominal capital stock of each city and region in 2011–2015 was then calculated according to Equation (9).
where is the total fixed asset investment of city (region) i in year t, and the depreciation rate δ remains at 9.6%.
The annual nominal capital stock of each city and region for 2010–2015 was finally converted into the actual capital stock at the 2010 price on the basis of GDP reduction index of provinces in which cities and regions were located.
3.2. Data
The land input data used in this study were obtained from the China Land Market Network (http://www.landchina.com/) from 2010 to 2015. These data were adopted primarily because of the accuracy of land supply results and the impact of land input on economic growth during the twelfth five-year plan period (2011–2015). The China Land Market Network was founded in October 2003. However, most local land departments did not publish land supply results on this website at that time. Therefore, the early data were incomplete. In early 2010, the Ministry of Land and Resources issued a document requesting the departments of land and resources in cities and counties to publish the information on the results of land supply on the aforementioned website. The announcement must clearly clarify the electronic supervision number, administrative region, location, area, land use, supply model (leasing or allocation), land use period, transaction price, and contract signing date of the supplied land parcels. Therefore, we used the Python programming language to capture 1,146,278 transaction records from 2010–2015. Based on the unique electronic monitoring number of each parcel and the land use, duplicate records and nonconstruction land (e.g., reservoir) were eliminated, and 1,062,958 records were retained. Because the boundaries of some prefectural administrative regions in China changed from 2010 to 2015, they were amended to the Chinese prefecture-level administrative regions in 2014 according to the locations of the parcels. From 2010 to 2015, 352 cities and regions across the country released land supply results online through the China Land Market Network; however, cities and regions in Tibet did not publish their land supply results.
The nonagricultural-industry added value and fixed asset investment were obtained from the statistical yearbooks of provinces. The numbers of employees in secondary and tertiary industries were obtained from the China City Statistical Yearbook and the statistical yearbooks of each province.
4. Economic Growth of Cities and Regions at Different Stages of Development
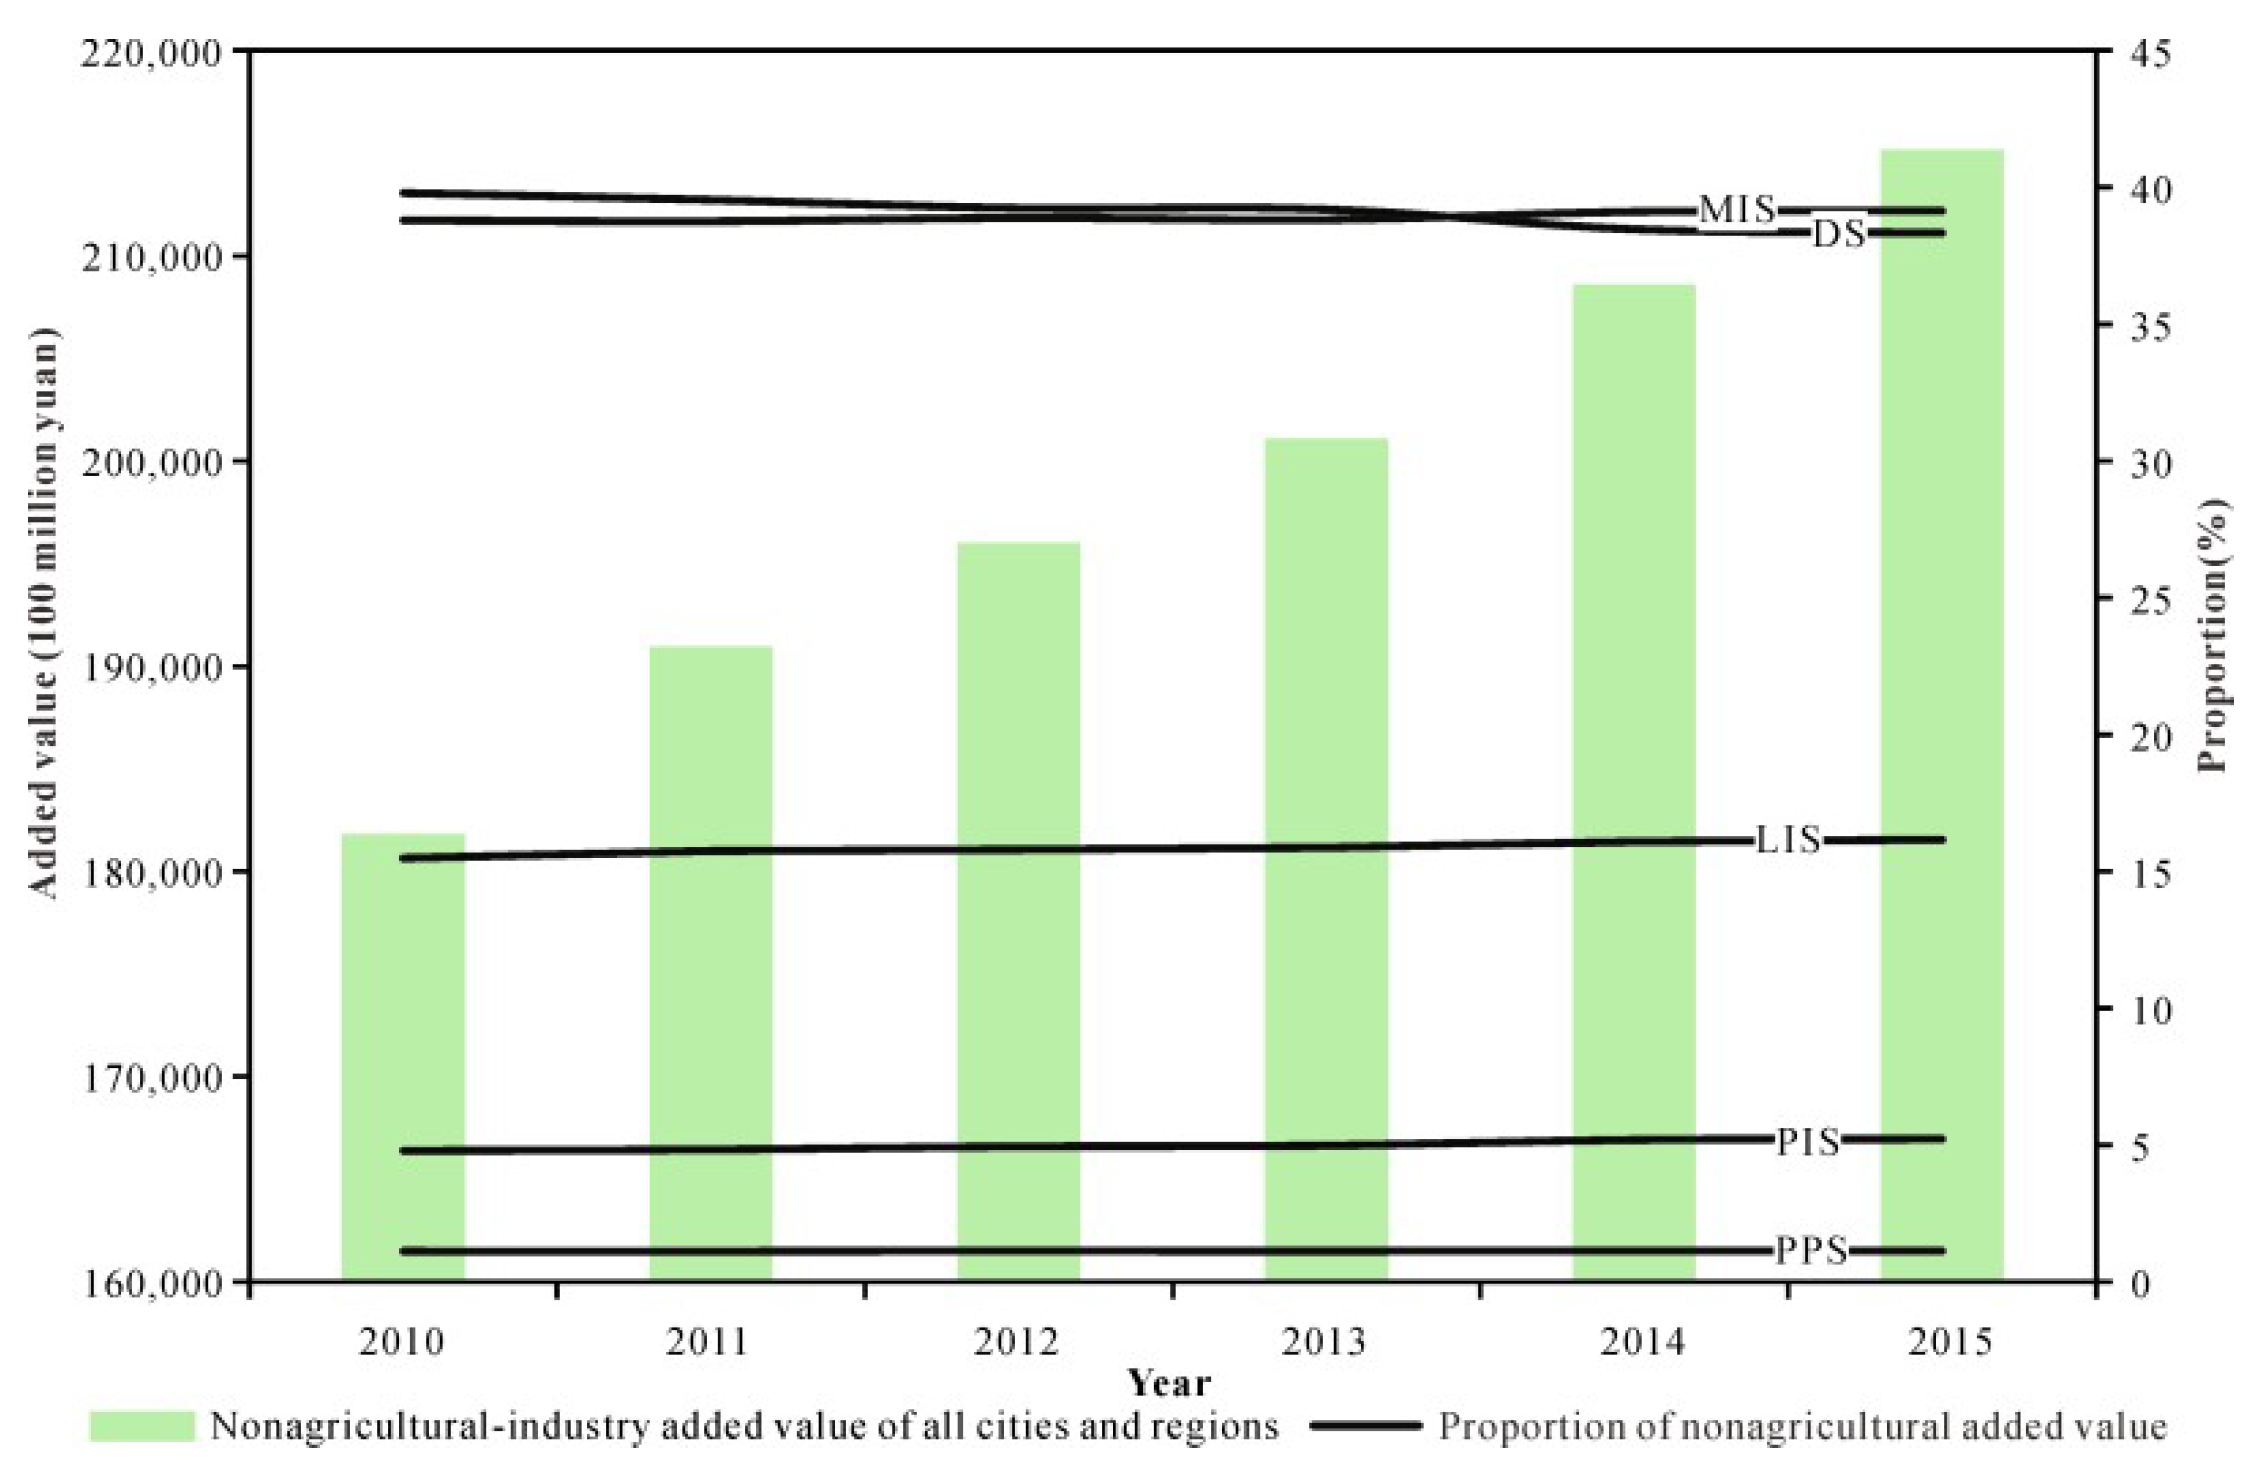
From 2010 to 2015, the added value of nonagricultural industries in all cities and regions continued to grow from 18.18 trillion yuan in 2010 to 21.52 trillion yuan in 2015, with an average annual growth rate of 3.43% (Figure 1). In 2015, the cities and regions with high nonagricultural-industry added value in China were primarily distributed in Jiangsu, Shandong, Zhejiang, Beijing, Tianjin, and Guangdong (Figure 2). The nonagricultural-industry added value per unit area was generally high in coastal areas, particularly in the Yangtze River Delta, the Pearl River Delta, Beijing, and Tianjin. By contrast, the nonagricultural-industry added value per unit area of inland cities and regions was generally low, that is, less than 1000 million yuan/km2 in 2015, which indicates a substantial imbalance in the regional economic development of China.
To accurately reflect the imbalance of economic development in Chinese cities and regions, the identification methods of relevant studies were used to identify the stage of development of each city and region based on the per capita GDP and industrial structure in 2015 [49,50]. The final dataset had 32 cities and regions in the primary production stage (PPS), primarily in northeast China; 57 cities and regions in the PIS, which were concentrated in Western China; 215 cities and regions in the middle industrialization stage (MIS), which were widely distributed across the entire country; and 27 and 21 cities and regions in the later industrialization stage (LIS) and developed stage (DS), respectively, primarily located in the coastal provinces. The spatial distribution of the five stages of economic development illustrates the regional variation in economic development in China (Figure 3). The proportion of population size of each city and region in the country in 2015 and its population density are shown in Appendix A.
Although the nonagricultural-industry added value has been continually increasing in all industrial stages, the proportion of nonagricultural-industry added value of cities and regions at the DS has slowly declined. This indicates that, compared with the cities and regions at other industrialization stages, the economic growth of cities and regions at the DS have slowed down. The economic growth of cities and regions at the LIS rapidly increased, and the proportion of nonagricultural added value significantly increased (Figure 1). Moreover, the imbalance in the economic development of China has been narrowing, and the Theil index has dropped from 0.2325 in 2010 to 0.1987 in 2015 (Figure 4). Furthermore, the Theil index within cities and regions at each stage of development was decreasing, which indicates that the imbalance of economic development within each development stage is narrowing (Figure 4 and Figure 5). Compared with cities and regions at PPS or PIS, the imbalance of economic development of cities and regions at the MIS was more significant; however, it narrowed faster, and TW reduced by 0.0137. After the international financial crisis in 2008, the central government in China has focused on the transformation and upgrading of economy. During the twelfth five-year plan, the degree of transformation and upgrading of regional industries at different stages of development may be different, causing significant fluctuations in the imbalance between cities and regions at various stages of development. For example, TB first increased and then decreased from 2010 to 2015.
In 2015, the average added values of nonagricultural industry of cities and regions at each stage of development were 7.59 billion yuan, 19.71 billion yuan, 39.17 billion yuan, 128.84 billion yuan, and 392.83 billion yuan, and the values of nonagricultural output per unit area were 0.20 ha/km2, 0.64 ha/km2, 1.88 ha/km2, 10.44 ha/km2, and 48.13 ha/km2. If the regional development stage was high, the output of nonagricultural industries within the unit area were higher (Figure 6).
5. Land Input of Cities and Regions at Different Stages of Development
From 2010 to 2015, the cities and regions with large total land supply in China were primarily distributed in Xinjiang, Beijing, Tianjin, Shanghai, Chongqing, Shandong, Anhui, Jiangsu, Zhejiang, and Jiangxi. The total land supply in these provinces reached 12,868.31 km2, corresponding to 38.14% of the total land supply of the country (Figure 7). In terms of land supply scale per unit area, the land supply intensity of cities and regions in coastal areas is generally high, particularly in Tianjin, Shanghai, Shenzhen, Dongguan, Ningbo, and Qingdao. This intensity may be because coastal areas are the earliest open areas in the reform and opening up of China, and the economic agglomeration effect is significant. Therefore, the demand for the construction land is relatively high during industrialization. Most cities and regions in the interior regions have weak economic foundations and the low levels of economic development. Therefore, land supply within a unit area is generally less than 1 ha/km2.
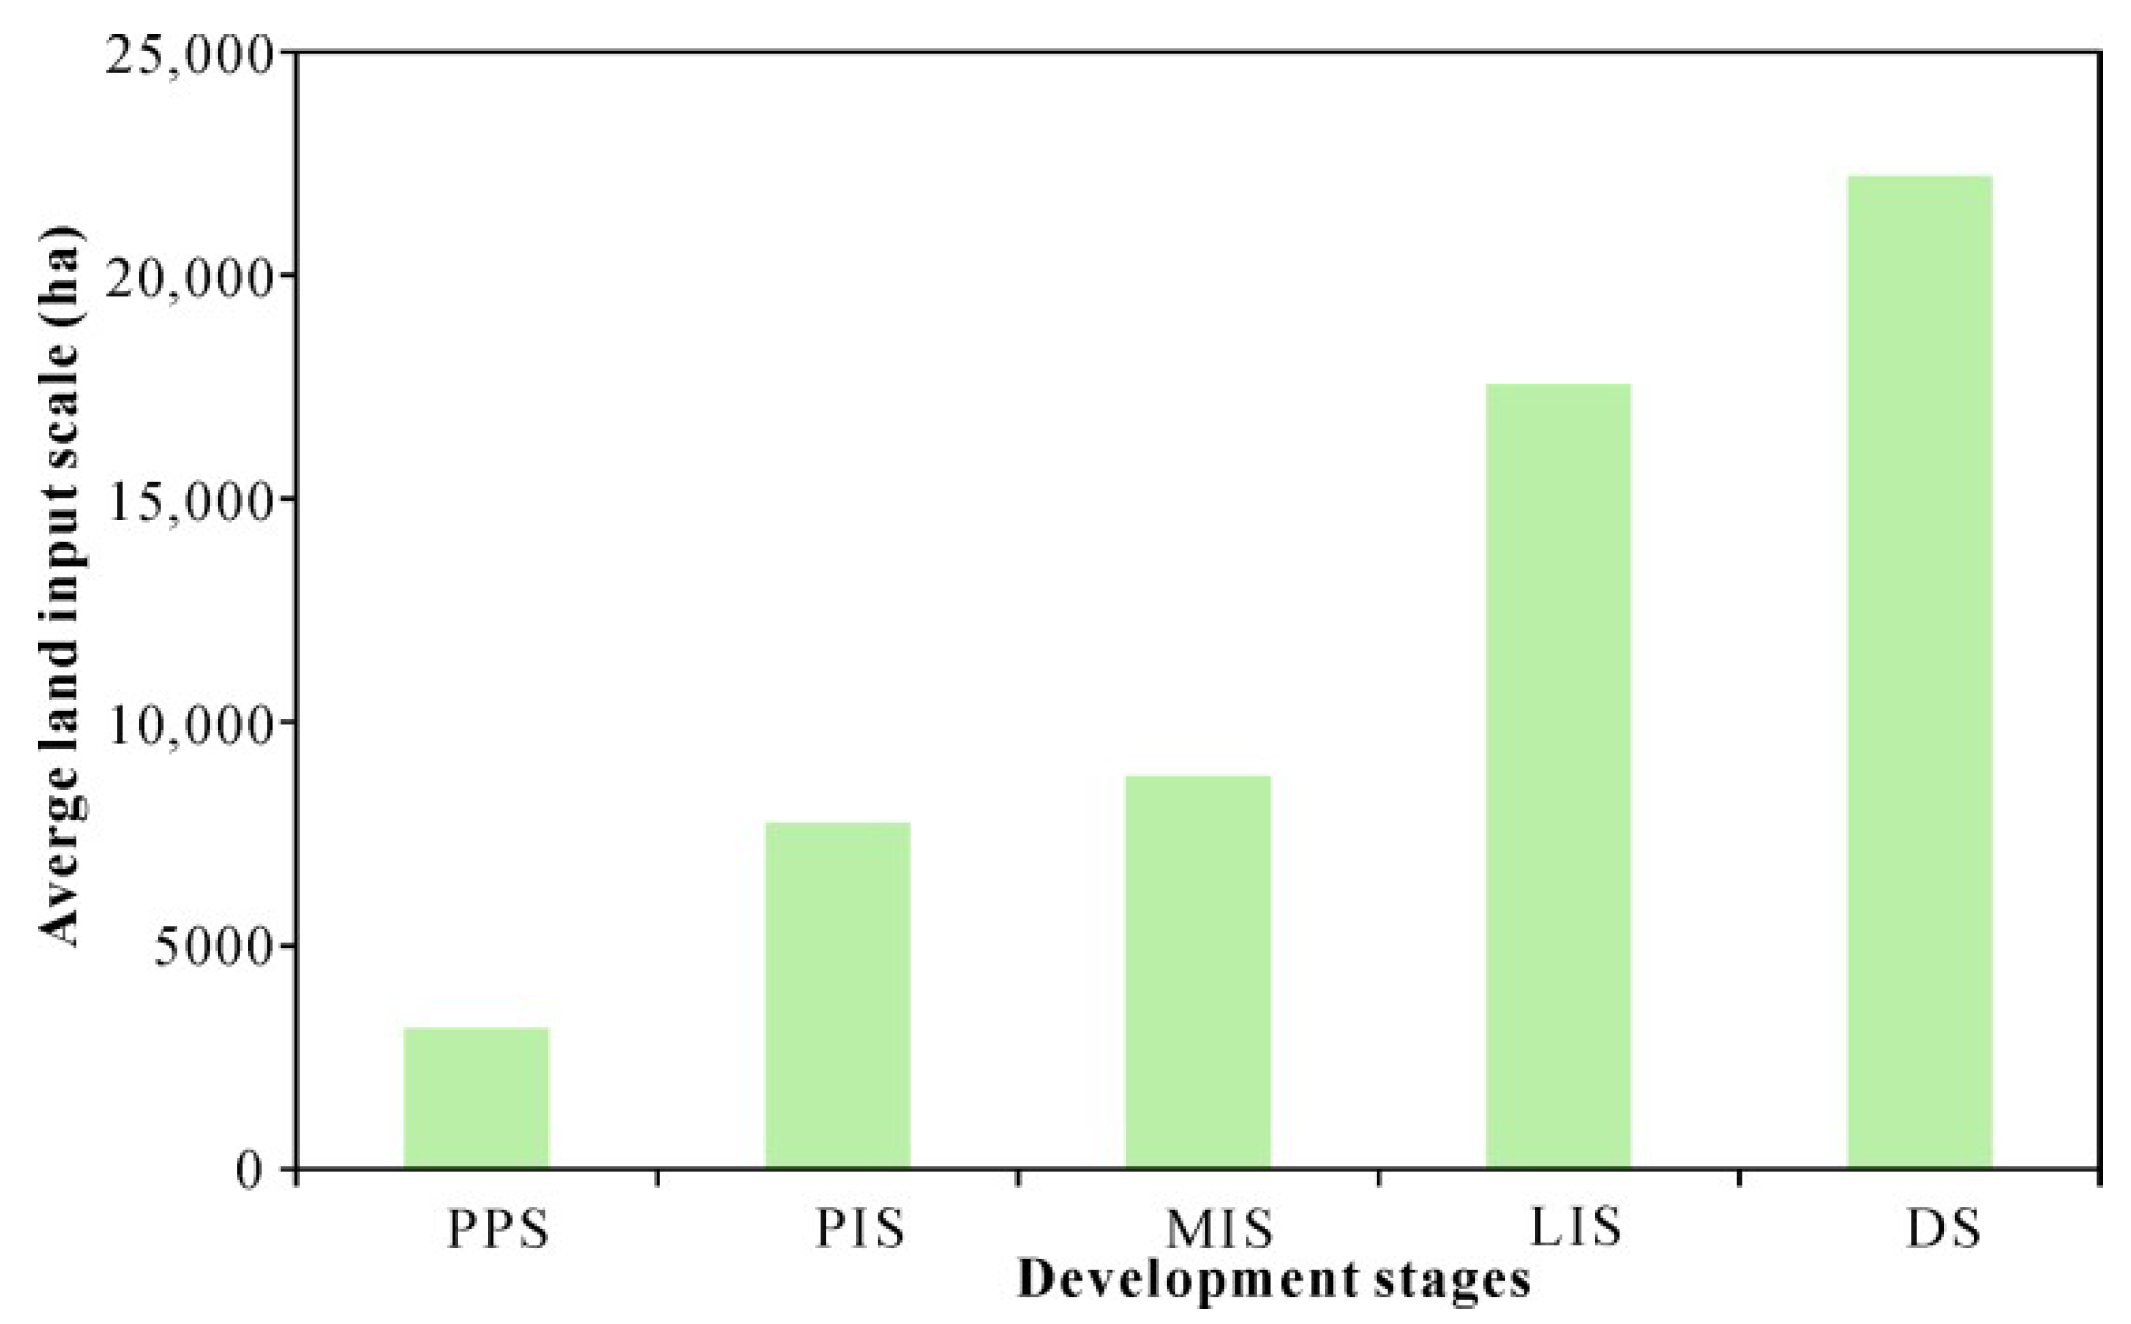
Although the added value of nonagricultural industry increased continually from 2010 to 2015, the land supply scale of cities and regions at various stages of development has been first increased and then decreased (Figure 8). The land supply scale of cities and regions reached maximum at the MIS or DS in 2013, at the PPS in 2011, and at the other two development stages in 2012. The aforementioned phenomenon indicates that the scale of agricultural land consumed by the national regional economic development decreased after 2013, and the speed of urban spatial expansion was decreasing. The average scale of land supply of cities and regions during the PPS, PIS, MIS, LIS, and DS were 3157.45 ha, 7749.74 ha, 8793.90 ha, 17,548.61 ha, and 22,218.23 ha, respectively, from 2010 to 2015. With the advanced stage of regional development, the demand for land for economic development was also higher (Figure 9).
6. Impact of Land Input of Cities and Regions on Economic Growth at Different Stages of Development
On the basis of the C–D production function, the control variables were gradually added in the panel model to obtain the optimal estimation results. Table 1 and Table 2 show that we should use fixed-effects models to explain the impact of land input on economic growth. After adding the control variables (the number of nonagricultural-industry employees and capital stocks), the model R2 in Table 1 increased to 0.9196, and the impact of land input on national economic growth was significant and positive. In Model 3, the positive effect of land input on the economic growth of all cities and regions was weaker than that of the other influencing factors, with an estimated coefficient of only 0.0921. The positive effect of capital stock on the economic growth of all cities and regions is the strongest, with an estimated coefficient of 0.7567. These effects indicate that investment was the primary driver of economic growth in China from 2010 to 2015, which may be related to the economic development of China during the study period. After the international financial crisis in 2008, and the occurrence of problems such as excess capacity, weak demand, and high unemployment, the central government in China formulated a series of monetary and fiscal policies to maintain economic growth and create job opportunities. For example, the “4 trillion investment plan” is anticipated to drive social investment and stabilize the economy.
The regression results indicate the significant differences in the impact of regional land input on economic growth at different stages of development (Table 2). The estimation coefficients of land input of cities and regions at the PPS (Model 4), PIS (Model 5), and MIS (Model 6) were significantly positive and estimated to be 0.1483, 0.0930, and 0.1086, respectively. These coefficients indicate that the land input of cities and regions at these three stages of development can significantly promote economic growth. In particular, the cities and regions at the PPS exhibit rich land resources, a lack of capital and labor, and undeveloped technology. Local governments in these cities and regions lease land at lower prices to attract enterprises and maintain economic growth through the large-scale construction of new towns and development zones. For example, the per capita cultivated land in Ordos City at the MIS was 2039.66 m2 in 2013, which was 2.28 times that of the national level [51,52]. The size of population with university education accounted for 11.66% of its total population, which was lower than Shanghai (21.95%) and Shenzhen (17.18%) with the higher economic development level [53,54,55]. From the beginning of the 21st century, the Ordos City government has cooperated with enterprises to establish an investment company to develop and construct the Kangbash New City and Dongsheng Economic Development Zone. The construction funds of new cities (xincheng) and development areas were primarily obtained from land leasing fees.
Although land input is a crucial factor for maintaining the rapid growth of economy in China, the industrial structure level of cities and regions at the LIS (Model 7) or DS (Model 8) is higher, and regional economic growth may primarily rely on high-quality personnel and capital, not land. The land resources of cities and regions at these two stages of development are limited, and local governments expect to generate higher economic value with less land input. Therefore, high-tech manufacturing and modern service industries have been encouraged by local governments. For example, the land development intensity of Shenzhen at the DS has approached 50% in 2013, which exceeded the present international warning line (30%) [56]. In the case of the shortage of land resources, Shenzhen expects to satisfy the land use demand of advanced manufacturing and the modern service industry through vigorous urban renewal. Advanced manufacturing added value corresponds to 73.4% of the industries above designated size in Shenzhen in 2015, which was higher than that of Guangdong province (47.9%), and the total social research and development (R&D) investment exceeded 90 billion yuan, accounting for 4.13% of its GDP in 2017, second only to Israel and South Korea. In addition, the number of patent-cooperation-treaty (PTC) international patent applications exceeded 20,000 in 2017, corresponding to 43.1% of the entire country. The number of invention patents per 10,000 people was 85.5, which was nine times the national average, and the number of national high-tech enterprises ranked second in the national cities [57,58].
7. Conclusions and Policy Implications
According to the 2016–2017 Global Competitiveness Report, China is in an efficiency-driven development phase rather than a factor-driven development phase [59]. Our research indicates that from 2010 to 2015, the economic growth of China significantly relied on capital investment and not on land.
Although the imbalance of regional economic development in China has been decreasing in recent years, the regional economic development level was still significantly different because of the differences in regional conditions. The development stages of primary cities and regions in China in 2015 were divided into five types, namely the PPS (32 units), PIS (57 units), MIS (215 units), LIS (27 units), and DS (21 units). Compared with the cities and regions at other four stages of development, the imbalance within the cities and regions at the MIS was significant; however, it narrowed faster. Significant differences are observed in the industrial structure and the scientific and technological advancement of cities and regions at different stages of development. Moreover, the impact of land input in different cities and regions on economic growth is different. The cities and regions at the PPS, PIS, or MIS with the low levels of science and technology are rich in land resources, but lack capital and labor. Land has become a crucial advantage for local governments in these stages of development to attract enterprises. This phenomenon is consistent with the results of relevant studies [36]. The scarcity of land resources of cities and regions at the LIS or DS is significant. The technological progress may reduce the dependence of the production activities of these cities and regions on land input, and the economic growth is significantly dependent on labor and capital investment rather than land. This finding is inconsistent with the previous findings [5]. This inconsistency may be attributed to the land input data adopted by our research and different social and economic development environment in China during the study period. Moreover, the impact of land input on economic growth of cities and regions at different stages of development is theoretically related to the Environmental Kuznets Curve (EKC). The aforementioned results help us understand the impact of land input on the economic growth of China and.
At present, China’s economic development is evolving from the middle stage of industrialization to the advanced stage [50]. The demand for construction land will increase, and the resource and environment constrained economic growth will be increasingly significant [60]. The evolution of economic development stage not only promotes the efficient use of land in China, but also puts forward higher requirements for the mode of economic growth and the transformation of land use patterns. Coordinating farmland protection and sustainable economic growth is one of the important tasks of China’s land management in the future. In addition, as we have found, the economic growth of cities and regions at a lower economic development stage is significantly dependent on land input, and when economic development reaches a higher stage, economic growth will no longer be significantly dependent on land input. Technological progress and advanced land management can improve land use efficiency and protect the ecological environment, and perhaps make the sustainable development of wealthy cities and regions more progress. If the zero-growth policy of construction land is enforced in cities and regions with lower economic development stages, it will inevitably hinder economic growth and even affect the stability of society. Hence, the differentiated land management strategies and performance appraisal methods should be implemented for cities and regions at different stages of development. Cities and regions at the low-level industrialization stage should strive to control urban sprawl, and land supply should be for high-value-added industries. When controlling the rapid urban expansion, cities and regions at the stage of advanced industrialization should focus on the redevelopment of inefficient inner-city land to satisfy the land use demand of modern service industries and high-tech manufacturing development. In terms of cultivated land protection target, the key cities and regions that have undertaken the main tasks of economic growth should appropriately reduce the target of farmland protection. The growth of non-agricultural output should not become the main content of these local governments performance assessment. In highly developed cities and regions, we should encourage the implementation of a “mutual benefit” development strategy for arable land protection and economic growth. In addition, whether it is for economically developed cities and regions or relatively backward cities and regions, the fundamental way to coordinate the protection of cultivated land and economic growth relies on the transformation of growth mode and technological progress and efficiency improvement rather than the expansion of reproduction to achieve rapid economic growth [60]. In addition, the local governments in China should absorb the concept of urban rational growth and encourage high-density, that is, vertical rather than horizontal growth, in order to reduce land demand and protect green space in planning urban spatial growth [61].
Author Contributions
W.J. developed the main ideas of the study, gathered the data, performed the models construction and estimation, and wrote the manuscript. C.Z. participated in revising the manuscript and proofreading the article. L.L. helped to collect and process data. All authors read and approved the final manuscript.
Funding
This work was supported by the National Social Science Foundation of China (17BRK010).
Acknowledgments
The authors would like to thank Hui Fang and Le Chen for their technical support.
Conflicts of Interest
The authors declare no conflict of interest.
Appendix A

Table A1.
Population size and population density of each city and region in 2015.
| City/Region | Area (10,000 km2) | Size (10,000 Persons) | Density (Person/km2) | Proportion (%) | City/Region | Area (10,000 km2) | Size (10,000 Persons) | Density (Person/km2) | Proportion (%) |
|---|---|---|---|---|---|---|---|---|---|
| Aba | 8.11 | 93.01 | 11.47 | 0.07 | Luoyang | 1.44 | 674.30 | 466.95 | 0.49 |
| Akesu | 11.74 | 260.34 | 22.17 | 0.19 | Luzhou | 1.22 | 432.50 | 355.33 | 0.31 |
| Alaer | 0.59 | 21.92 | 36.85 | 0.02 | Lvliang | 2.00 | 383.22 | 191.62 | 0.28 |
| Alashan | 22.44 | 24.35 | 1.09 | 0.02 | Maanshan | 0.16 | 226.22 | 1413.98 | 0.16 |
| Ankang | 2.25 | 265.00 | 117.96 | 0.19 | Maoming | 1.24 | 608.08 | 488.73 | 0.44 |
| Anqing | 1.57 | 540.73 | 345.05 | 0.39 | Meishan | 0.74 | 300.13 | 407.23 | 0.22 |
| Anshan | 0.88 | 347.10 | 394.46 | 0.25 | Meizhou | 1.66 | 434.08 | 261.65 | 0.32 |
| Anshun | 0.94 | 231.35 | 245.08 | 0.17 | Mianyang | 2.00 | 477.19 | 238.81 | 0.35 |
| Anyang | 0.70 | 511.70 | 731.17 | 0.37 | Mudangjiang | 3.61 | 262.04 | 72.65 | 0.19 |
| Baicheng | 2.38 | 196.67 | 82.65 | 0.14 | Nanchang | 0.77 | 530.29 | 687.22 | 0.39 |
| Baise | 3.83 | 359.67 | 93.87 | 0.26 | Nanchong | 1.23 | 636.40 | 517.53 | 0.46 |
| Baisha | 0.25 | 17.10 | 69.01 | 0.01 | Nanjing | 0.67 | 823.59 | 1227.90 | 0.60 |
| Baishan | 1.61 | 125.37 | 77.76 | 0.09 | Nanning | 2.40 | 698.61 | 291.21 | 0.51 |
| Baiyin | 1.94 | 173.69 | 89.56 | 0.13 | Nanping | 2.67 | 266.76 | 100.05 | 0.19 |
| Baoding | 2.09 | 1155.24 | 552.18 | 0.84 | Nantong | 0.82 | 730.00 | 893.08 | 0.53 |
| Baoji | 1.77 | 376.33 | 212.65 | 0.27 | Nanyang | 2.64 | 1002.12 | 379.88 | 0.73 |
| Baoshan | 2.06 | 258.10 | 125.13 | 0.19 | Neijiang | 0.55 | 373.97 | 684.89 | 0.27 |
| Baoting | 0.13 | 15.02 | 112.77 | 0.01 | Ningbo | 0.83 | 782.50 | 945.06 | 0.57 |
| Baotou | 2.58 | 282.93 | 109.80 | 0.21 | Ningde | 1.32 | 287.00 | 217.95 | 0.21 |
| Bayanzhuoe | 5.98 | 167.73 | 28.06 | 0.12 | Nujiang | 1.40 | 54.20 | 38.78 | 0.04 |
| Bayinguole | 44.45 | 146.32 | 3.29 | 0.11 | Ordos | 8.09 | 204.51 | 25.29 | 0.15 |
| Bazhong | 1.19 | 332.86 | 279.79 | 0.24 | Panjin | 0.28 | 126.70 | 451.35 | 0.09 |
| Beihai | 0.36 | 162.57 | 454.84 | 0.12 | Panzhihua | 0.75 | 123.81 | 166.15 | 0.09 |
| Beijing | 1.53 | 2170.50 | 1421.65 | 1.58 | Pingdingshan | 0.76 | 496.34 | 652.22 | 0.36 |
| Bengbu | 0.56 | 329.14 | 589.81 | 0.24 | Pingliang | 1.05 | 209.80 | 200.13 | 0.15 |
| Benxi | 0.76 | 151.60 | 199.22 | 0.11 | Pingxiang | 0.41 | 190.11 | 467.86 | 0.14 |
| Bijie | 2.72 | 660.61 | 242.47 | 0.48 | Puer | 4.73 | 260.50 | 55.06 | 0.19 |
| Binzhou | 0.81 | 385.90 | 477.80 | 0.28 | Putian | 0.43 | 287.00 | 675.25 | 0.21 |
| Boer | 2.36 | 49.74 | 21.10 | 0.04 | Puyang | 0.37 | 361.00 | 970.72 | 0.26 |
| Bozhou | 0.86 | 504.69 | 585.67 | 0.37 | Qiandongnan | 3.12 | 350.48 | 112.36 | 0.25 |
| Cangzhou | 1.30 | 744.30 | 574.64 | 0.54 | Qianjiang | 0.20 | 95.80 | 478.89 | 0.07 |
| Chande | 1.88 | 584.39 | 311.09 | 0.43 | Qiannan | 2.74 | 325.22 | 118.60 | 0.24 |
| Changchun | 1.88 | 779.30 | 414.75 | 0.57 | Qianxinan | 1.84 | 284.26 | 154.39 | 0.21 |
| Changji | 6.98 | 142.02 | 20.36 | 0.10 | Qingdao | 1.03 | 909.70 | 886.92 | 0.66 |
| Changjiang | 0.17 | 22.92 | 135.76 | 0.02 | Qingyang | 2.58 | 223.05 | 86.52 | 0.16 |
| Changsha | 1.17 | 743.18 | 635.05 | 0.54 | Qingyuan | 2.00 | 383.45 | 191.48 | 0.28 |
| Changzhi | 1.31 | 342.04 | 261.85 | 0.25 | Qinhuangdao | 0.71 | 307.32 | 434.37 | 0.22 |
| Changzhou | 0.43 | 470.14 | 1087.60 | 0.34 | Qinzhou | 1.16 | 320.93 | 276.46 | 0.23 |
| Chaozhou | 0.33 | 272.87 | 835.07 | 0.20 | Qionghai | 0.20 | 50.25 | 252.05 | 0.04 |
| Chengde | 3.68 | 353.01 | 96.02 | 0.26 | Qiongzhong | 0.28 | 17.72 | 62.24 | 0.01 |
| Chengdu | 1.20 | 1465.80 | 1220.61 | 1.07 | Qiqihaer | 3.90 | 549.39 | 140.79 | 0.40 |
| Chengmai | 0.24 | 48.39 | 204.73 | 0.04 | Qitaihe | 0.55 | 91.27 | 165.15 | 0.07 |
| Chenzhou | 2.04 | 473.02 | 231.79 | 0.34 | Quanzhou | 1.15 | 851.00 | 737.02 | 0.62 |
| Chifeng | 8.06 | 429.95 | 53.34 | 0.31 | Qujing | 3.00 | 604.70 | 201.55 | 0.44 |
| Chizhou | 0.84 | 143.63 | 171.46 | 0.10 | Quzhou | 0.93 | 213.30 | 229.91 | 0.16 |
| Chongqing | 8.11 | 3016.55 | 371.75 | 2.19 | Rizhao | 0.49 | 288.00 | 589.98 | 0.21 |
| Chongzuo | 1.90 | 205.45 | 107.90 | 0.15 | Sanmenxia | 0.95 | 225.31 | 238.32 | 0.16 |
| Chuxiong | 3.03 | 273.30 | 90.22 | 0.20 | Sanming | 2.37 | 253.00 | 106.79 | 0.18 |
| Chuzhou | 1.34 | 401.71 | 299.55 | 0.29 | Sanya | 0.23 | 74.89 | 323.05 | 0.05 |
| Dali | 2.96 | 354.40 | 119.90 | 0.26 | Shanghai | 0.62 | 2415.27 | 3924.80 | 1.76 |
| Dalian | 1.14 | 593.90 | 520.08 | 0.43 | Shangluo | 1.89 | 235.74 | 124.73 | 0.17 |
| Dandong | 1.31 | 238.80 | 182.31 | 0.17 | Shangqiu | 1.01 | 727.39 | 721.29 | 0.53 |
| Danzhou | 0.34 | 97.77 | 285.92 | 0.07 | Shangrao | 2.28 | 671.51 | 293.96 | 0.49 |
| Daqing | 1.92 | 277.48 | 144.50 | 0.20 | Shantou | 0.23 | 555.21 | 2462.22 | 0.40 |
| Datong | 1.33 | 340.64 | 256.77 | 0.25 | Shanwei | 0.53 | 302.16 | 571.09 | 0.22 |
| Daxingan | 5.94 | 47.24 | 7.95 | 0.03 | Shaoguan | 1.93 | 293.15 | 151.50 | 0.21 |
| Dazhou | 1.63 | 556.76 | 340.71 | 0.41 | Shaoxin | 0.81 | 496.80 | 614.12 | 0.36 |
| Dehong | 1.21 | 127.90 | 105.27 | 0.09 | Shaoyang | 2.11 | 726.17 | 343.55 | 0.53 |
| Deyang | 0.60 | 351.30 | 589.84 | 0.26 | Shennongjia | 0.32 | 7.68 | 24.09 | 0.01 |
| Dezhou | 1.02 | 574.23 | 562.90 | 0.42 | Shenyang | 1.19 | 730.60 | 615.57 | 0.53 |
| Dingan | 0.14 | 29.14 | 211.66 | 0.02 | Shenzhen | 0.21 | 1137.87 | 5375.70 | 0.83 |
| Dingxi | 1.89 | 277.83 | 146.83 | 0.20 | Shihezi | 0.05 | 65.18 | 1442.39 | 0.05 |
| Diqing | 2.41 | 40.80 | 16.93 | 0.03 | Shijiazhuang | 1.34 | 1070.16 | 799.09 | 0.78 |
| Dongfang | 0.25 | 42.01 | 168.33 | 0.03 | Shiyan | 2.33 | 338.30 | 144.97 | 0.25 |
| Dongguan | 0.24 | 825.41 | 3427.65 | 0.60 | Shizuishan | 0.36 | 78.80 | 218.08 | 0.06 |
| Dongying | 0.59 | 211.06 | 359.23 | 0.15 | Shuangyashan | 1.98 | 147.43 | 74.31 | 0.11 |
| Enshi | 2.46 | 332.70 | 135.16 | 0.24 | Shuozhou | 1.03 | 176.22 | 171.69 | 0.13 |
| Ezhou | 0.15 | 105.95 | 721.55 | 0.08 | Siping | 1.35 | 326.41 | 241.17 | 0.24 |
| Fangcheng | 0.65 | 91.84 | 141.37 | 0.07 | Songyuan | 1.96 | 278.07 | 142.13 | 0.20 |
| Foshan | 0.41 | 743.06 | 1798.33 | 0.54 | Suihua | 3.15 | 548.51 | 174.12 | 0.40 |
| Fushun | 1.05 | 216.60 | 205.36 | 0.16 | Suining | 0.53 | 329.00 | 620.88 | 0.24 |
| Fuxin | 1.00 | 190.20 | 190.29 | 0.14 | Suizhou | 0.93 | 219.08 | 236.71 | 0.16 |
| Fuyang | 1.01 | 790.15 | 783.29 | 0.57 | Suqian | 0.88 | 485.38 | 552.00 | 0.35 |
| Fuyun | 0.81 | 246.05 | 303.56 | 0.18 | Suzhou3 | 0.95 | 554.12 | 581.86 | 0.40 |
| Fuzhou1 | 1.87 | 399.28 | 213.56 | 0.29 | Suzhou4 | 0.80 | 1061.60 | 1334.78 | 0.77 |
| Fuzhou2 | 1.22 | 750.00 | 615.10 | 0.55 | Taian | 0.74 | 560.08 | 752.24 | 0.41 |
| Gannan | 3.52 | 70.50 | 20.05 | 0.05 | Taiyuan | 0.67 | 431.87 | 647.71 | 0.31 |
| Ganzhou | 4.12 | 854.71 | 207.28 | 0.62 | Taizhou5 | 0.93 | 610.40 | 656.67 | 0.44 |
| Ganzi | 14.51 | 116.49 | 8.03 | 0.08 | Taizhou6 | 0.56 | 464.16 | 829.16 | 0.34 |
| Gouluo | 7.48 | 19.43 | 2.60 | 0.01 | Tangshan | 1.19 | 780.12 | 656.84 | 0.57 |
| Guangan | 0.63 | 324.66 | 516.61 | 0.24 | Tian | 1.09 | 1546.95 | 1415.19 | 1.13 |
| Guangyuan | 1.57 | 263.00 | 167.57 | 0.19 | Tianmen | 0.29 | 129.20 | 449.68 | 0.09 |
| Guangzhou | 0.80 | 1350.11 | 1693.44 | 0.98 | Tianshui | 1.32 | 331.17 | 250.31 | 0.24 |
| Guigang | 1.16 | 429.37 | 369.92 | 0.31 | Tieling | 1.21 | 299.00 | 246.84 | 0.22 |
| Guilin | 2.86 | 496.16 | 173.75 | 0.36 | Tongchuan | 0.37 | 84.62 | 228.09 | 0.06 |
| Guiyang | 0.80 | 462.18 | 580.74 | 0.34 | Tonghua | 1.46 | 221.10 | 151.63 | 0.16 |
| Guyuan | 0.95 | 131.59 | 138.17 | 0.10 | Tongliao | 5.47 | 312.08 | 57.09 | 0.23 |
| Haerbin | 4.85 | 961.37 | 198.29 | 0.70 | Tonglin | 0.11 | 73.98 | 675.64 | 0.05 |
| Haibei | 3.31 | 30.06 | 9.08 | 0.02 | Tongren | 1.81 | 312.24 | 172.48 | 0.23 |
| Haidong | 1.23 | 174.40 | 141.32 | 0.13 | Tulufan | 6.38 | 66.33 | 10.39 | 0.05 |
| Haikou | 0.24 | 222.30 | 932.17 | 0.16 | Tumukesu | 0.22 | 17.59 | 78.68 | 0.01 |
| Hainan | 4.10 | 47.81 | 11.67 | 0.03 | Tunchang | 0.14 | 26.36 | 184.12 | 0.02 |
| Haixi | 30.94 | 41.67 | 1.35 | 0.03 | Wanning | 0.21 | 56.47 | 265.57 | 0.04 |
| Hami | 12.71 | 62.54 | 4.92 | 0.05 | Weifang | 1.49 | 927.72 | 622.49 | 0.67 |
| Handan | 1.17 | 943.30 | 807.12 | 0.69 | Weihai | 0.51 | 281.28 | 547.31 | 0.20 |
| Hangzhou | 1.68 | 901.80 | 536.22 | 0.66 | Weinan | 1.23 | 535.99 | 435.62 | 0.39 |
| Hanzhong | 2.63 | 343.81 | 130.94 | 0.25 | Wenchang | 0.28 | 55.49 | 199.99 | 0.04 |
| Hebi | 0.22 | 165.10 | 760.18 | 0.12 | Wenshan | 3.33 | 360.70 | 108.20 | 0.26 |
| Hechi | 3.44 | 347.68 | 101.07 | 0.25 | Wenzhou | 1.12 | 927.90 | 824.87 | 0.68 |
| Hefei | 1.65 | 778.95 | 471.49 | 0.57 | Wuhai | 0.16 | 55.58 | 341.42 | 0.04 |
| Hegang | 1.34 | 105.61 | 78.78 | 0.08 | Wuhan | 0.87 | 1060.77 | 1224.15 | 0.77 |
| Heihe | 6.27 | 167.94 | 26.80 | 0.12 | Wuhu | 0.33 | 365.45 | 1107.67 | 0.27 |
| Hengshui | 0.82 | 443.54 | 543.59 | 0.32 | Wujiaqu | 0.09 | 9.37 | 103.39 | 0.01 |
| Hengyang | 1.54 | 733.75 | 476.03 | 0.53 | Wulanchabu | 5.11 | 211.13 | 41.32 | 0.15 |
| Hetian | 23.58 | 221.67 | 9.40 | 0.16 | Wulumuqi | 0.95 | 270.89 | 285.00 | 0.20 |
| Heyuan | 1.64 | 307.35 | 187.39 | 0.22 | Wuwei | 3.12 | 182.73 | 58.54 | 0.13 |
| Heze | 1.19 | 850.03 | 713.88 | 0.62 | Wuxi | 0.46 | 651.10 | 1421.79 | 0.47 |
| Hezhou | 1.22 | 202.59 | 165.89 | 0.15 | Wuzhishan | 0.14 | 10.56 | 74.68 | 0.01 |
| Honghe | 3.55 | 465.00 | 130.85 | 0.34 | Wuzhong | 1.50 | 137.32 | 91.36 | 0.10 |
| Huaian | 0.90 | 487.20 | 541.10 | 0.35 | Wuzhou | 1.37 | 299.94 | 218.23 | 0.22 |
| Huaibei | 0.26 | 217.88 | 836.30 | 0.16 | Xiamen | 0.19 | 386.00 | 2084.46 | 0.28 |
| Huaihua | 2.80 | 490.16 | 175.18 | 0.36 | Xian | 0.98 | 870.56 | 884.00 | 0.63 |
| Huainan | 0.20 | 239.35 | 1197.70 | 0.17 | Xiangtan | 0.50 | 282.37 | 565.73 | 0.21 |
| Huanggang | 1.73 | 629.10 | 363.28 | 0.46 | Xiangxi | 1.58 | 263.45 | 166.97 | 0.19 |
| Huangnan | 1.73 | 27.89 | 16.11 | 0.02 | Xiangyang | 1.89 | 561.40 | 297.30 | 0.41 |
| Huangshan | 0.97 | 137.37 | 142.05 | 0.10 | Xianning | 1.00 | 250.70 | 251.29 | 0.18 |
| Huangshi | 0.43 | 245.80 | 575.93 | 0.18 | Xiantao | 0.25 | 119.18 | 475.77 | 0.09 |
| Huhehaote | 1.58 | 305.96 | 193.69 | 0.22 | Xianyang | 1.00 | 517.58 | 516.25 | 0.38 |
| Huizhou | 1.23 | 475.55 | 386.18 | 0.35 | Xiaogan | 0.90 | 487.80 | 542.23 | 0.35 |
| Huludao | 0.91 | 278.60 | 307.32 | 0.20 | Xinan | 4.93 | 159.91 | 32.42 | 0.12 |
| Hulunbeier | 23.58 | 252.65 | 10.71 | 0.18 | Xingtai | 1.18 | 729.44 | 615.70 | 0.53 |
| Huzhou | 0.59 | 295.00 | 502.88 | 0.21 | Xining | 0.71 | 205.02 | 287.55 | 0.15 |
| Jiamusi | 2.99 | 237.55 | 79.45 | 0.17 | Xinlinguole | 18.51 | 99.16 | 5.36 | 0.07 |
| Jian | 2.55 | 489.90 | 192.09 | 0.36 | Xinxiang | 0.82 | 572.10 | 700.42 | 0.42 |
| Jiangmen | 0.96 | 451.95 | 469.50 | 0.33 | Xinyang | 1.84 | 613.65 | 333.69 | 0.45 |
| Jiaozuo | 0.40 | 353.40 | 884.93 | 0.26 | Xinyu | 0.32 | 116.67 | 360.38 | 0.08 |
| Jiaxing | 0.40 | 458.50 | 1148.17 | 0.33 | Xinzhou | 2.36 | 314.13 | 133.29 | 0.23 |
| Jiayuguan | 0.22 | 24.39 | 112.79 | 0.02 | Sipsongpanna | 2.15 | 116.40 | 54.26 | 0.08 |
| Jieyang | 0.58 | 605.89 | 1050.87 | 0.44 | Xuancheng | 1.20 | 259.24 | 216.39 | 0.19 |
| Jilin | 2.59 | 426.24 | 164.30 | 0.31 | Xuchang | 0.50 | 434.15 | 868.96 | 0.32 |
| Jinan | 0.75 | 713.20 | 950.19 | 0.52 | Xuzhou | 1.08 | 866.90 | 803.15 | 0.63 |
| Jinchang | 0.70 | 47.05 | 67.62 | 0.03 | Yaan | 1.51 | 154.68 | 102.18 | 0.11 |
| Jincheng | 0.90 | 231.50 | 256.64 | 0.17 | Yanan | 3.50 | 223.13 | 63.80 | 0.16 |
| Jingdezhen | 0.53 | 164.05 | 310.29 | 0.12 | Yanbian | 4.03 | 216.63 | 53.75 | 0.16 |
| Jingmen | 1.22 | 289.63 | 236.95 | 0.21 | Yancheng | 1.46 | 722.85 | 494.93 | 0.53 |
| Jingzhou | 1.39 | 574.90 | 412.17 | 0.42 | Yangjiang | 0.88 | 251.12 | 286.08 | 0.18 |
| Jinhua | 1.11 | 545.40 | 493.02 | 0.40 | Yangquan | 0.42 | 139.83 | 329.17 | 0.10 |
| Jining | 1.11 | 829.92 | 745.97 | 0.60 | Yangzhou | 0.66 | 448.36 | 677.59 | 0.33 |
| Jinzhong | 1.55 | 333.57 | 215.21 | 0.24 | Yantai | 1.30 | 701.41 | 537.71 | 0.51 |
| Jinzhou | 0.87 | 303.90 | 350.24 | 0.22 | Yibin | 1.34 | 449.00 | 335.79 | 0.33 |
| Jiujiang | 1.89 | 482.58 | 254.94 | 0.35 | Yichang | 2.11 | 411.50 | 194.71 | 0.30 |
| Jiuquan | 13.59 | 111.54 | 8.21 | 0.08 | Yichun7 | 1.95 | 551.20 | 283.35 | 0.40 |
| Jixi | 2.02 | 181.17 | 89.60 | 0.13 | Yichun8 | 3.03 | 121.19 | 39.97 | 0.09 |
| Jiyuan | 0.19 | 72.90 | 377.96 | 0.05 | Yili | 24.98 | 484.74 | 19.40 | 0.35 |
| Kaifeng | 0.58 | 454.26 | 787.64 | 0.33 | Yinchuang | 0.69 | 216.41 | 311.89 | 0.16 |
| Kashi | 10.49 | 438.20 | 41.77 | 0.32 | Yingtan | 0.36 | 115.33 | 319.98 | 0.08 |
| Kelamayi | 0.67 | 30.14 | 45.07 | 0.02 | Yinkou | 0.51 | 232.00 | 453.98 | 0.17 |
| Kezilesu | 6.48 | 61.66 | 9.52 | 0.04 | Yiyang | 1.19 | 441.02 | 369.17 | 0.32 |
| Kunming | 2.15 | 667.70 | 310.14 | 0.49 | Yongzhou | 2.33 | 542.97 | 233.12 | 0.39 |
| Laibin | 1.46 | 218.20 | 149.54 | 0.16 | Yueyang | 1.56 | 562.92 | 360.37 | 0.41 |
| Laiwu | 0.20 | 135.16 | 672.30 | 0.10 | Yulin9 | 4.15 | 340.11 | 81.86 | 0.25 |
| Langfang | 0.59 | 456.32 | 773.63 | 0.33 | Yulin10 | 1.37 | 570.72 | 416.39 | 0.42 |
| Lanzhou | 1.22 | 369.31 | 302.64 | 0.27 | Yuncheng | 1.38 | 527.53 | 382.90 | 0.38 |
| Ledong | 0.32 | 47.30 | 149.72 | 0.03 | Yushu | 19.06 | 41.45 | 2.17 | 0.03 |
| Leshan | 1.31 | 326.05 | 249.54 | 0.24 | Yuxi | 1.55 | 236.20 | 152.86 | 0.17 |
| Liangshan | 6.11 | 465.50 | 76.24 | 0.34 | Zaoqing | 1.62 | 405.96 | 250.12 | 0.30 |
| Lianyungang | 0.73 | 447.37 | 614.87 | 0.33 | Zaozhuang | 0.43 | 387.80 | 907.35 | 0.28 |
| Liaocheng | 0.83 | 597.06 | 721.59 | 0.43 | Zhangjiajie | 0.95 | 152.40 | 159.67 | 0.11 |
| Chaoyang | 1.93 | 336.90 | 174.61 | 0.25 | Zhangjiakou | 3.46 | 442.17 | 127.79 | 0.32 |
| Liaoyang | 0.46 | 179.40 | 388.84 | 0.13 | Zhangye | 3.61 | 121.98 | 33.75 | 0.09 |
| Liaoyuan | 0.48 | 120.80 | 252.70 | 0.09 | Zhangzhou | 1.39 | 500.00 | 360.99 | 0.36 |
| Lijiang | 2.11 | 128.00 | 60.54 | 0.09 | Zhanjiang | 1.36 | 724.14 | 531.74 | 0.53 |
| Lincang | 2.50 | 250.90 | 100.36 | 0.18 | Zhaotong | 2.28 | 543.00 | 237.82 | 0.40 |
| Linfen | 1.94 | 443.57 | 228.70 | 0.32 | Zhenjiang | 0.36 | 317.65 | 893.20 | 0.23 |
| Lingao | 0.15 | 44.29 | 294.24 | 0.03 | Zhenzhou | 0.70 | 956.90 | 1367.21 | 0.70 |
| Lingshui | 0.14 | 32.78 | 230.08 | 0.02 | Zhongshan | 0.19 | 320.96 | 1698.42 | 0.23 |
| Linxia | 0.77 | 201.21 | 260.68 | 0.15 | Zhongwei | 1.27 | 114.16 | 89.86 | 0.08 |
| Linyi | 1.61 | 1031.16 | 639.74 | 0.75 | Zhoukou | 1.14 | 900.45 | 792.31 | 0.66 |
| Lishui | 1.73 | 213.90 | 123.87 | 0.16 | Zhoushan | 0.06 | 115.20 | 2042.85 | 0.08 |
| Liupanshui | 0.99 | 288.99 | 290.86 | 0.21 | Zhuhai | 0.18 | 163.41 | 932.80 | 0.12 |
| Liuzhou | 1.92 | 392.27 | 204.84 | 0.29 | Zhumadian | 1.47 | 695.55 | 471.95 | 0.51 |
| Longnan | 2.73 | 259.09 | 94.86 | 0.19 | Zhuzhou | 1.18 | 400.05 | 337.92 | 0.29 |
| Longyan | 2.02 | 261.00 | 129.43 | 0.19 | Zibo | 0.58 | 464.20 | 802.29 | 0.34 |
| Loudi | 0.82 | 387.18 | 472.73 | 0.28 | Zigong | 0.44 | 277.02 | 625.25 | 0.20 |
| Luan | 1.85 | 576.67 | 311.12 | 0.42 | Ziyang | 0.79 | 356.90 | 452.43 | 0.26 |
| Luohe | 0.25 | 262.50 | 1048.88 | 0.19 | Zunyi | 3.14 | 619.21 | 196.93 | 0.45 |
Notes: Fuzhou1 and Yichun7 are in Jiangxi. Fuzhou2 is in Fujian. Suzhou3 is in Anhui. Suzhou4 and Taizhou6 are in Jiangsu. Taizhou5 is in Zhejiang. Yichun8 is in Heilongjiang. Yulin9 is in Shanaxi. Yulin10 is in Guangxi.
References
- Liu, T.; Cao, G.Z.; Yan, Y.; Wang, R.Y. Urban land marketization in China: Central policy, local initiative, and market mechanism. Land Use Policy 2016, 57, 265–276. [Google Scholar] [CrossRef]
- National Bureau of Statistics of China. China Statistical Yearbook 2017; China Statistics Press: Beijing, China, 2017; pp. 805–836. (In Chinese) [Google Scholar]
- National Bureau of Statistics of China. China Statistical Yearbook 2012; China Statistics Press: Beijing, China, 2012; pp. 99–121. (In Chinese) [Google Scholar]
- Deng, X.Z.; Huang, J.K.; Rozelle, S.; Uchida, E. Economic growth and the expansion of urban land in China. Urban Stud. 2010, 47, 813–843. [Google Scholar] [CrossRef]
- Ding, C.R.; Lichtenberg, E. Land and urban economic growth in China. J. Reg. Sci. 2011, 51, 299–317. [Google Scholar] [CrossRef]
- Tian, L.; Ma, W. Government intervention in city development of China: A tool of land supply. Land Use Policy 2009, 26, 599–609. [Google Scholar] [CrossRef]
- Tan, S.K.; Rao, Y.X.; Zhu, X.B. Study on the influence of land investment on regional economic growth. China Popul. Resour. Environ. 2012, 22, 61–67. (In Chinese) [Google Scholar]
- Xu, J.; Yeh, A.G.O.; Wu, F.L. Land commodification: New land development and politics in China since the late 1990s. Int. J. Urban Reg. Res. 2009, 33, 890–913. [Google Scholar] [CrossRef]
- Tao, R.; Su, F.B.; Liu, M.X.; Cao, G.Z. Land leasing and local public finance in China’s regional development: Evidence from prefecture-level cities. Urban Stud. 2010, 47, 2217–2236. [Google Scholar] [CrossRef]
- Liu, T.; Lin, G.C.S. New geography of land commodification in Chinese cities: Uneven landscape of urban land development under market reforms and globalization. Appl. Geogr. 2014, 51, 118–130. [Google Scholar] [CrossRef]
- He, C.F.; Huang, Z.J.; Wang, R. Land use change and economic growth in urban China: A structural equation analysis. Urban Stud. 2014, 51, 2880–2898. [Google Scholar] [CrossRef]
- Huang, Z.J.; He, C.F.; Zhu, S.J. Do China’s economic development zones improve land use efficiency? The effects of selection, factor accumulation and agglomeration. Landsc. Urban Plan. 2017, 162, 145–156. [Google Scholar] [CrossRef]
- Xu, G.L.; Huang, X.J.; Zhong, T.Y.; Chen, Y.; Wu, C.Y.; Jin, Y.Z. Assessment on the effect of city arable land protection under the implementation of China’s National General Land Use Plan (2006–2020). Habitat Int. 2015, 49, 466–473. [Google Scholar] [CrossRef]
- Bai, Z.G.; Dent, D.L.; Olsson, L.; Schaepman, M.E. Proxy global assessment of land degradation. Soil Use Manag. 2008, 24, 223–234. [Google Scholar] [CrossRef] [Green Version]
- Liu, X.P.; Ou, J.P.; Wang, S.J.; Li, X.; Yan, Y.C.; Jiao, L.M.; Liu, Y.L. Estimating spatiotemporal variations of city-level energy-related CO2 emissions: An improved disaggregating model based on vegetation adjusted nighttime light data. J. Clean. Prod. 2018, 177, 101–114. [Google Scholar] [CrossRef]
- Lin, G.C.S.; Ho, S.P.S. China’s land resources and land-use change: Insights from the 1996 land survey. Land Use Policy 2003, 20, 87–107. [Google Scholar] [CrossRef]
- Ho, P. Who owns China’s land? Policies, property rights and deliberate institutional ambiguity. China Q. 2001, 166, 394–421. [Google Scholar] [CrossRef]
- Van der Veen, A.; Otter, H.S. Land use changes in regional economic theory. Environ. Model. Assess. 2001, 6, 145–150. [Google Scholar] [CrossRef]
- Nichols, D.A. Land and economic growth. Am. Econ. Rev. 1970, 60, 332–340. [Google Scholar]
- Sachs, J.D.; Warner, A.M. The curse of natural resources. Eur. Econ. Rev. 2001, 45, 827–838. [Google Scholar] [CrossRef]
- Huang, Z.H.; Du, X.J. Strategic interaction in local governments’ industrial land supply: Evidence from China. Urban Stud. 2017, 54, 1328–1346. [Google Scholar] [CrossRef]
- Ding, C.R.; Niu, Y.; Lichtenberg, E. Spending preferences of local officials with off-budget land revenues of Chinese cities. China Econ. Rev. 2014, 31, 265–276. [Google Scholar] [CrossRef]
- Jiang, M.; Xin, L.J.; Li, X.B.; Tan, M.H. Spatiotemporal variation of China’s state-owned construction land supply from 2003 to 2014. Sustainability 2016, 8, 1137. [Google Scholar] [CrossRef]
- Ping, Y.C. Explaining land use change in a Guangdong county: The supply side of the story. China Q. 2011, 207, 626–648. [Google Scholar] [CrossRef]
- Wang, D.; Zhang, L.; Zhang, Z.; Zhao, Z. Urban infrastructure financing in reform-era China. Urban Stud. 2011, 48, 2975–2998. [Google Scholar] [CrossRef]
- Zhan, J.V. Strategy for fiscal survival? Analysis of local extra-budgetary finance in China. J. Contemp. China 2012, 22, 185–203. [Google Scholar] [CrossRef]
- Li, J. Land sale venue and economic growth path: Evidence from China’s urban land market. Habitat Int. 2014, 41, 307–313. [Google Scholar] [CrossRef]
- Fan, X.W.; Zheng, D.; Shi, M.J. How does land development promote China’s urban economic growth? The mediating effect of public infrastructure. Sustainability 2016, 8, 279. [Google Scholar] [CrossRef]
- He, C.F.; Zhou, Y.; Huang, Z.J. Fiscal decentralization, political centralization, and land urbanization in China. Urban Geogr. 2016, 37, 436–457. [Google Scholar] [CrossRef]
- Wu, Q.; Li, Y.L.; Yan, S.Q. The incentives of China’s urban land finance. Land Use Policy 2015, 42, 432–442. [Google Scholar] [CrossRef]
- Wei, Y.D. Zone fever, project fever: Economic transition, development policy, and urban expansion in China. Geogr. Rev. 2015, 105, 156–177. [Google Scholar] [CrossRef]
- Zhou, T.; Zhao, R.; Zhou, Y. Factors influencing land development and redevelopment during China’s rapid urbanization: Evidence from Haikou city, 2003–2016. Sustainability 2017, 9, 2011. [Google Scholar] [CrossRef]
- Thun, E. Keeping up with the Jones’: Decentralization, policy imitation and industrial development in China. World Dev. 2004, 32, 1289–1308. [Google Scholar] [CrossRef]
- Ping, Y.C. Pseudo-urbanization? Competitive government behavior and urban sprawl in China. J. Contemp. China 2012, 21, 281–298. [Google Scholar] [CrossRef]
- Ye, J.P.; Ma, C.F.; Zhang, Q.H. Contribution of land to the economic growth of China: Based on spatial panel data model. Financ. Trade Econ. 2011, 4, 111–116. (In Chinese) [Google Scholar]
- Long, F.J.; Guo, M. Research on the impact of land supply on urban growth in China. Urban Stud. 2009, 16, 83–87. (In Chinese) [Google Scholar]
- Romer, P. Increasing returns and long-run growth. J. Polit. Econ. 1986, 94, 1002–1037. [Google Scholar] [CrossRef]
- Lucas, R.E. Making a miracle. Econometrica 1993, 61, 251–272. [Google Scholar] [CrossRef]
- Skonhoft, A.; Solem, H. Economic growth and land-use changes: The declining amount of wilderness land in Norway. Ecol. Econ. 2001, 37, 289–301. [Google Scholar] [CrossRef]
- Li, M.Y.; Hu, Z.Z. Empirical study on contribution rate of land to economic growth in Shanghai. Soft Sci. 2005, 19, 21–23. (In Chinese) [Google Scholar]
- Wang, J.K.; Gu, G.F. Study on contribution of land element to urban economic growth in China. China Popul. Resour. Environ. 2015, 25, 10–17. (In Chinese) [Google Scholar]
- Theil, H. Economics and Information Theory; North-Holland Publishing Company: Amsterdam, The Netherlands, 1967; pp. 90–135. [Google Scholar]
- Zhang, W.J.; Bao, S.M. Created unequal: China’s regional pay inequality and its relationship with mega-trend urbanization. Appl. Geogr. 2015, 61, 81–93. [Google Scholar] [CrossRef]
- Conceição, P.; Galbraith, J.K. Constructing long and dense time-series of inequality using the Theil Index. East. Econ. J. 2000, 26, 61–74. [Google Scholar] [CrossRef]
- Li, X.J.; Li, G.P.; Zeng, G.; Tan, C.L.; Zhang, W.Z. Economic Geography; Higher Education Press: Beijing, China, 2006; pp. 76–78. (In Chinese) [Google Scholar]
- Cobb, C.W.; Douglas, P.H. A theory of production. Am. Econ. Rev. 1928, 18, 139–165. [Google Scholar]
- Zhang, J.; Wu, G.Y.; Zhang, J.P. The estimation of China’s provincial capital stock: 1952–2000. Econ. Res. J. 2004, 10, 35–44. (In Chinese) [Google Scholar]
- Chen, L.; Li, X.; Yao, Y.; Chen, D.S. Effects of population agglomeration on urban economic growth in China. Acta Geogr. Sin. 2018, 73, 1107–1120. (In Chinese) [Google Scholar]
- Chenery, H.; Robinson, S.; Syrquin, M. Industrialization and Growth: A Comparative Study; Oxford University Press: New York, NY, USA, 1986; pp. 37–84. [Google Scholar]
- Qi, Y.J.; Yang, Y.; Jin, F.J. China’s economic development stage and its patio-temporal evolution: A prefectural-level analysis. J. Geogr. Sci. 2013, 23, 297–314. [Google Scholar] [CrossRef]
- Ba, T.E. Problems in the implementation of general land use planning in Erdos City. Inn. Mong. For. Investig. Des. 2015, 38, 113–134. (In Chinese) [Google Scholar]
- National Bureau of Statistics of China. China Statistical Yearbook 2014; China Statistics Press: Beijing, China, 2014; pp. 99–121. (In Chinese) [Google Scholar]
- Main Data Bulletin of Erdos’s Sixth National Census 2010. Available online: http://www.360doc.com/content/11/0601/10/983667_120899944.shtml (accessed on 21 May 2018).
- Main Data Bulletin of Shanghai’s Sixth National Census 2010. Available online: http://www.stats.gov.cn/tjsj/tjgb/rkpcgb/dfrkpcgb/201202/t20120228_30403.html (accessed on 21 May 2018).
- Main Data Bulletin of Shenzhen’s Sixth National Census 2010. Available online: https://max.book118.com/html/2017/0415/100480075.shtm (accessed on 21 May 2018).
- Efficient Land Use and Land Development Intensity Control in Pearl River Delta. Available online: http://www.xinhuanet.com/finance/2015-02/03/c_127453300.htm (accessed on 23 May 2018).
- Bureau of Statistics of Guangdong. Guangdong Province Statistical Yearbook 2016; China Statistics Press: Beijing, China, 2016; pp. 329–400. (In Chinese) [Google Scholar]
- Accelerateing the Construction of a Modern Industrial System Led by Innovation. Available online: http://sz.people.com.cn/n2/2018/0417/c202846-31469287.html (accessed on 23 May 2018).
- World Economic Forum (WEF). The Global Competitiveness Report 2016–2017; World Economic Forum (WEF) Publication: Geneva, Switzerland, 2016; pp. 35–38. [Google Scholar]
- Jiang, H.; Qu, F.T. Contribution and response of constructed land expansion to economic growth at different development stages: A case study for Jiangsu. China Popul. Resour. Environ. 2009, 19, 70–75. (In Chinese) [Google Scholar]
- Ding, C.R. Urban Spatial Planning: Theory, Method and Practice; Higher Education Press: Beijing, China, 2007; pp. 135–141. (In Chinese) [Google Scholar]
Figure 1.
Nonagricultural-industry added value of cities and regions in different stages of development in 2010–2015 (based on the price in 2010).
Figure 1.
Nonagricultural-industry added value of cities and regions in different stages of development in 2010–2015 (based on the price in 2010).

Figure 2.
Proportion of nonagricultural-industry added value and output per unit area in major cities and regions in 2015.
Figure 2.
Proportion of nonagricultural-industry added value and output per unit area in major cities and regions in 2015.
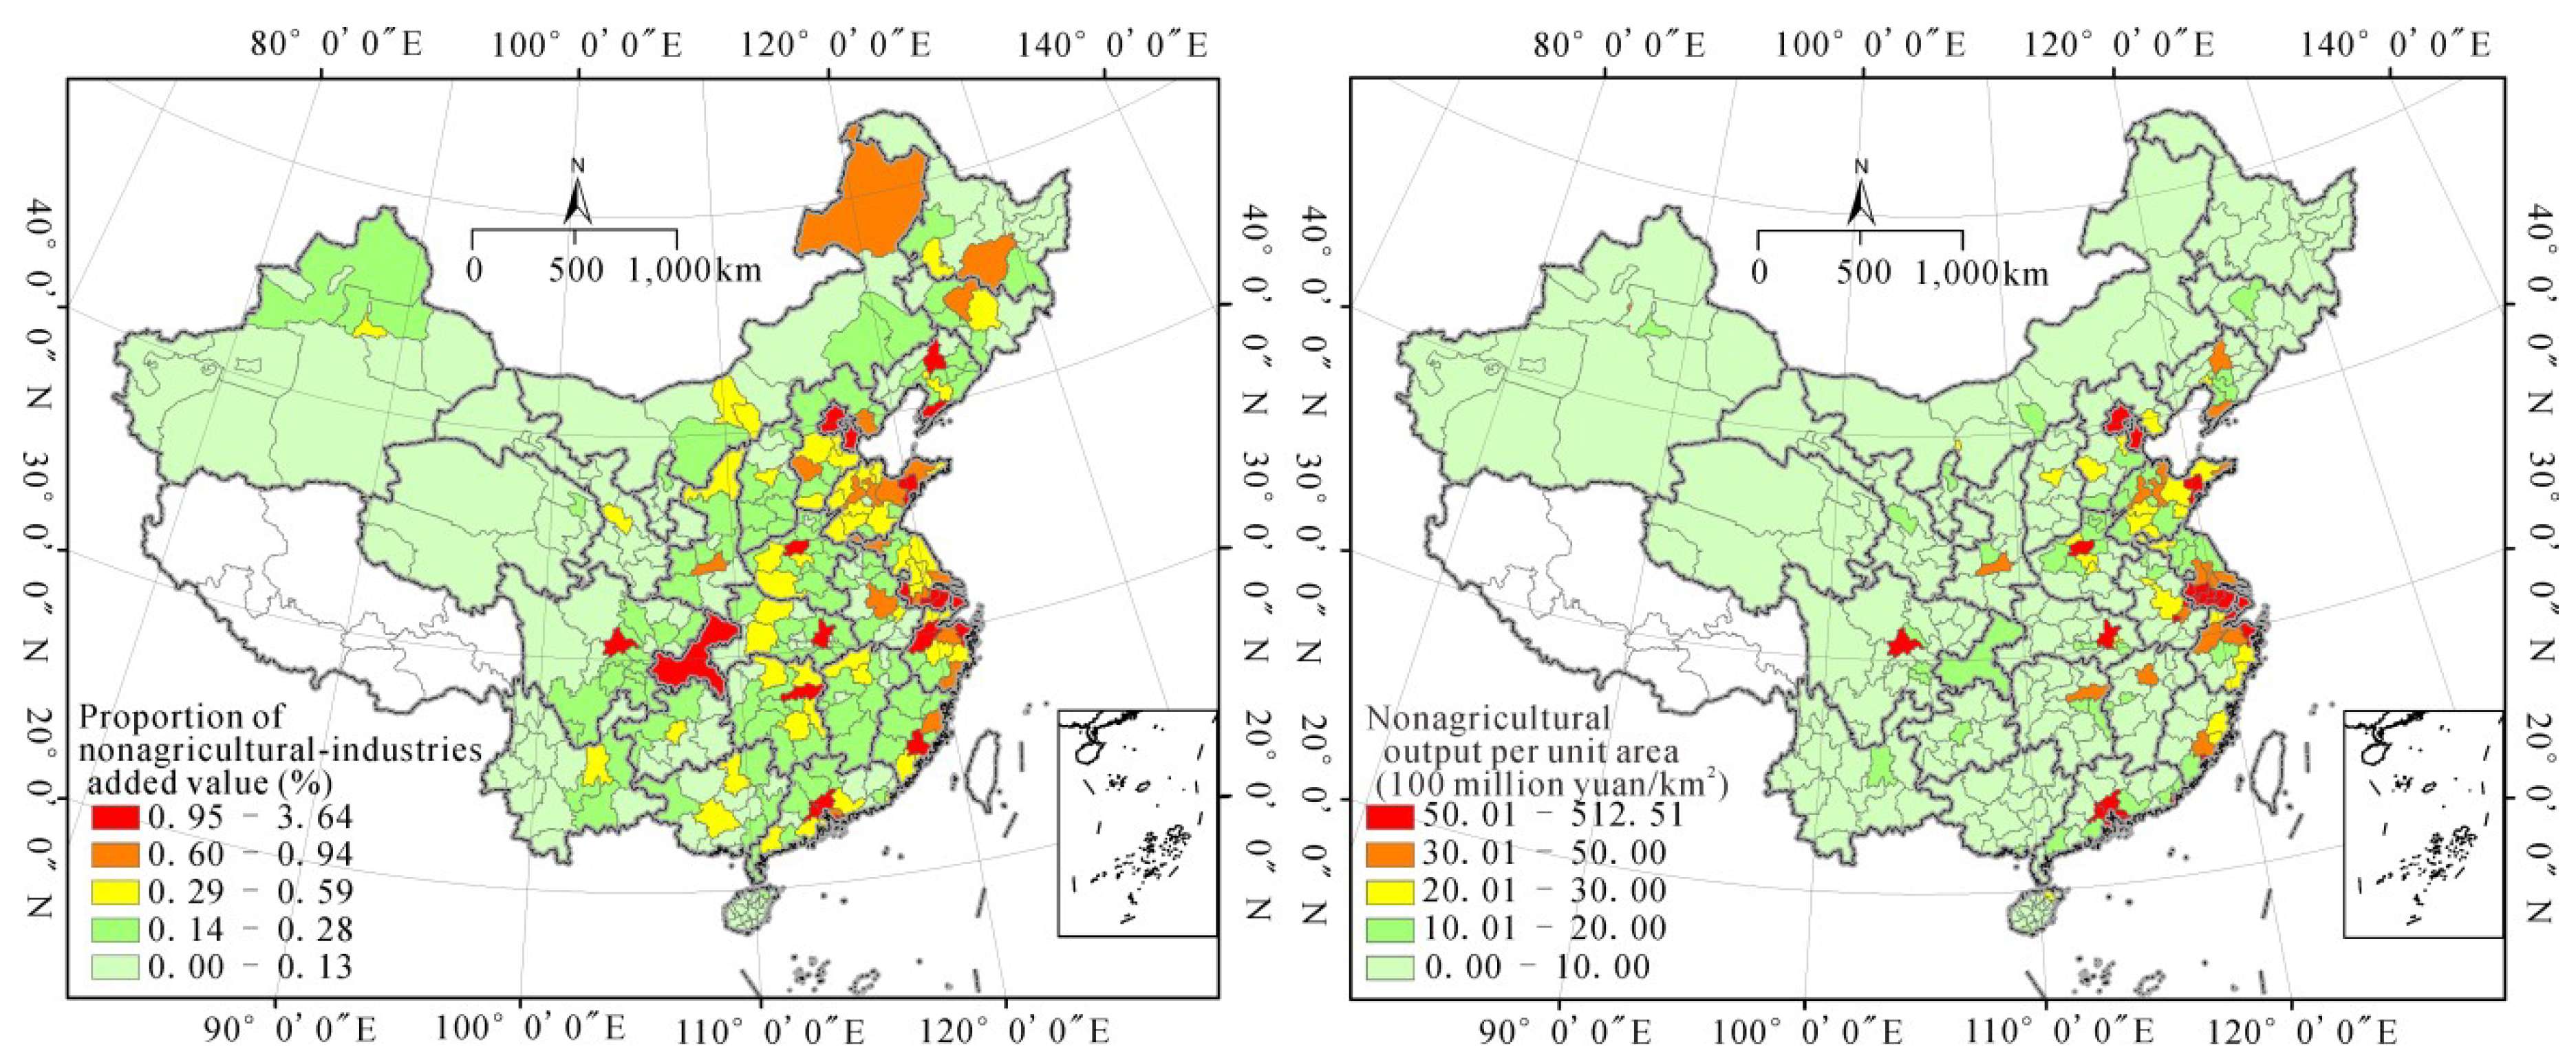
Figure 3.
Identification of the development stage of cities and regions in 2015.
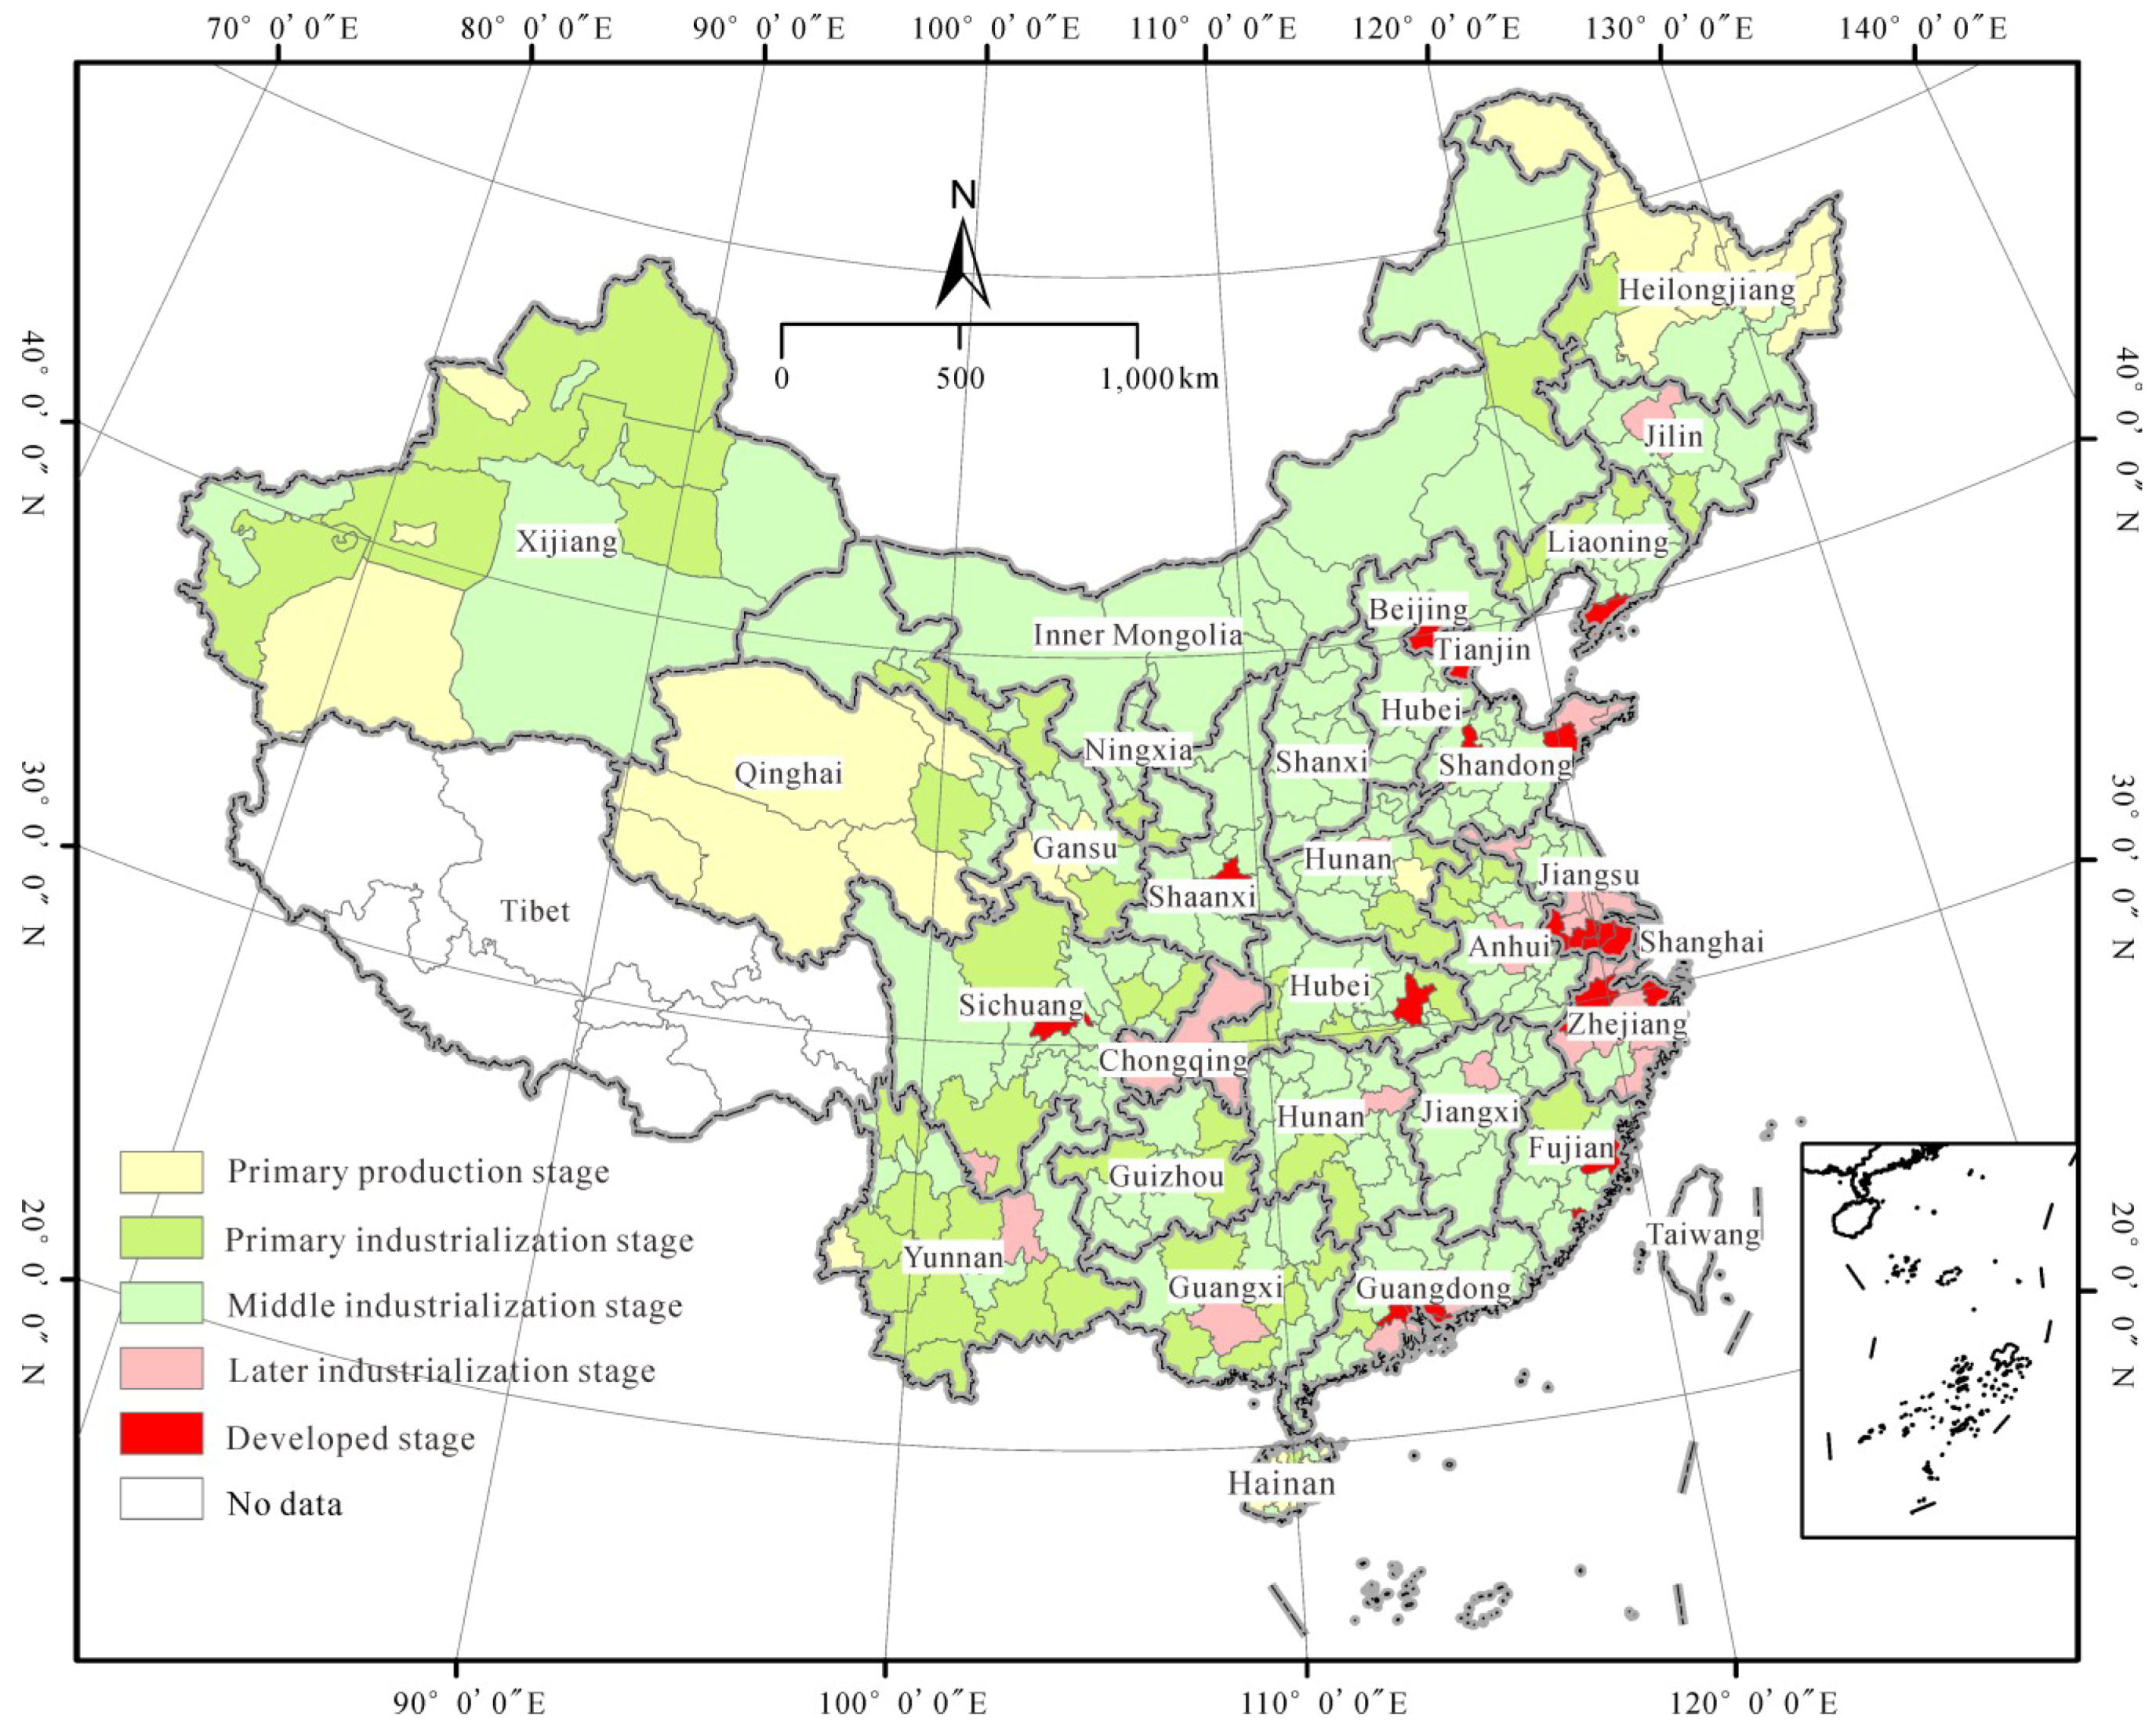
Figure 4.
Imbalance between and within 352 cities and regions in 2010–2015.
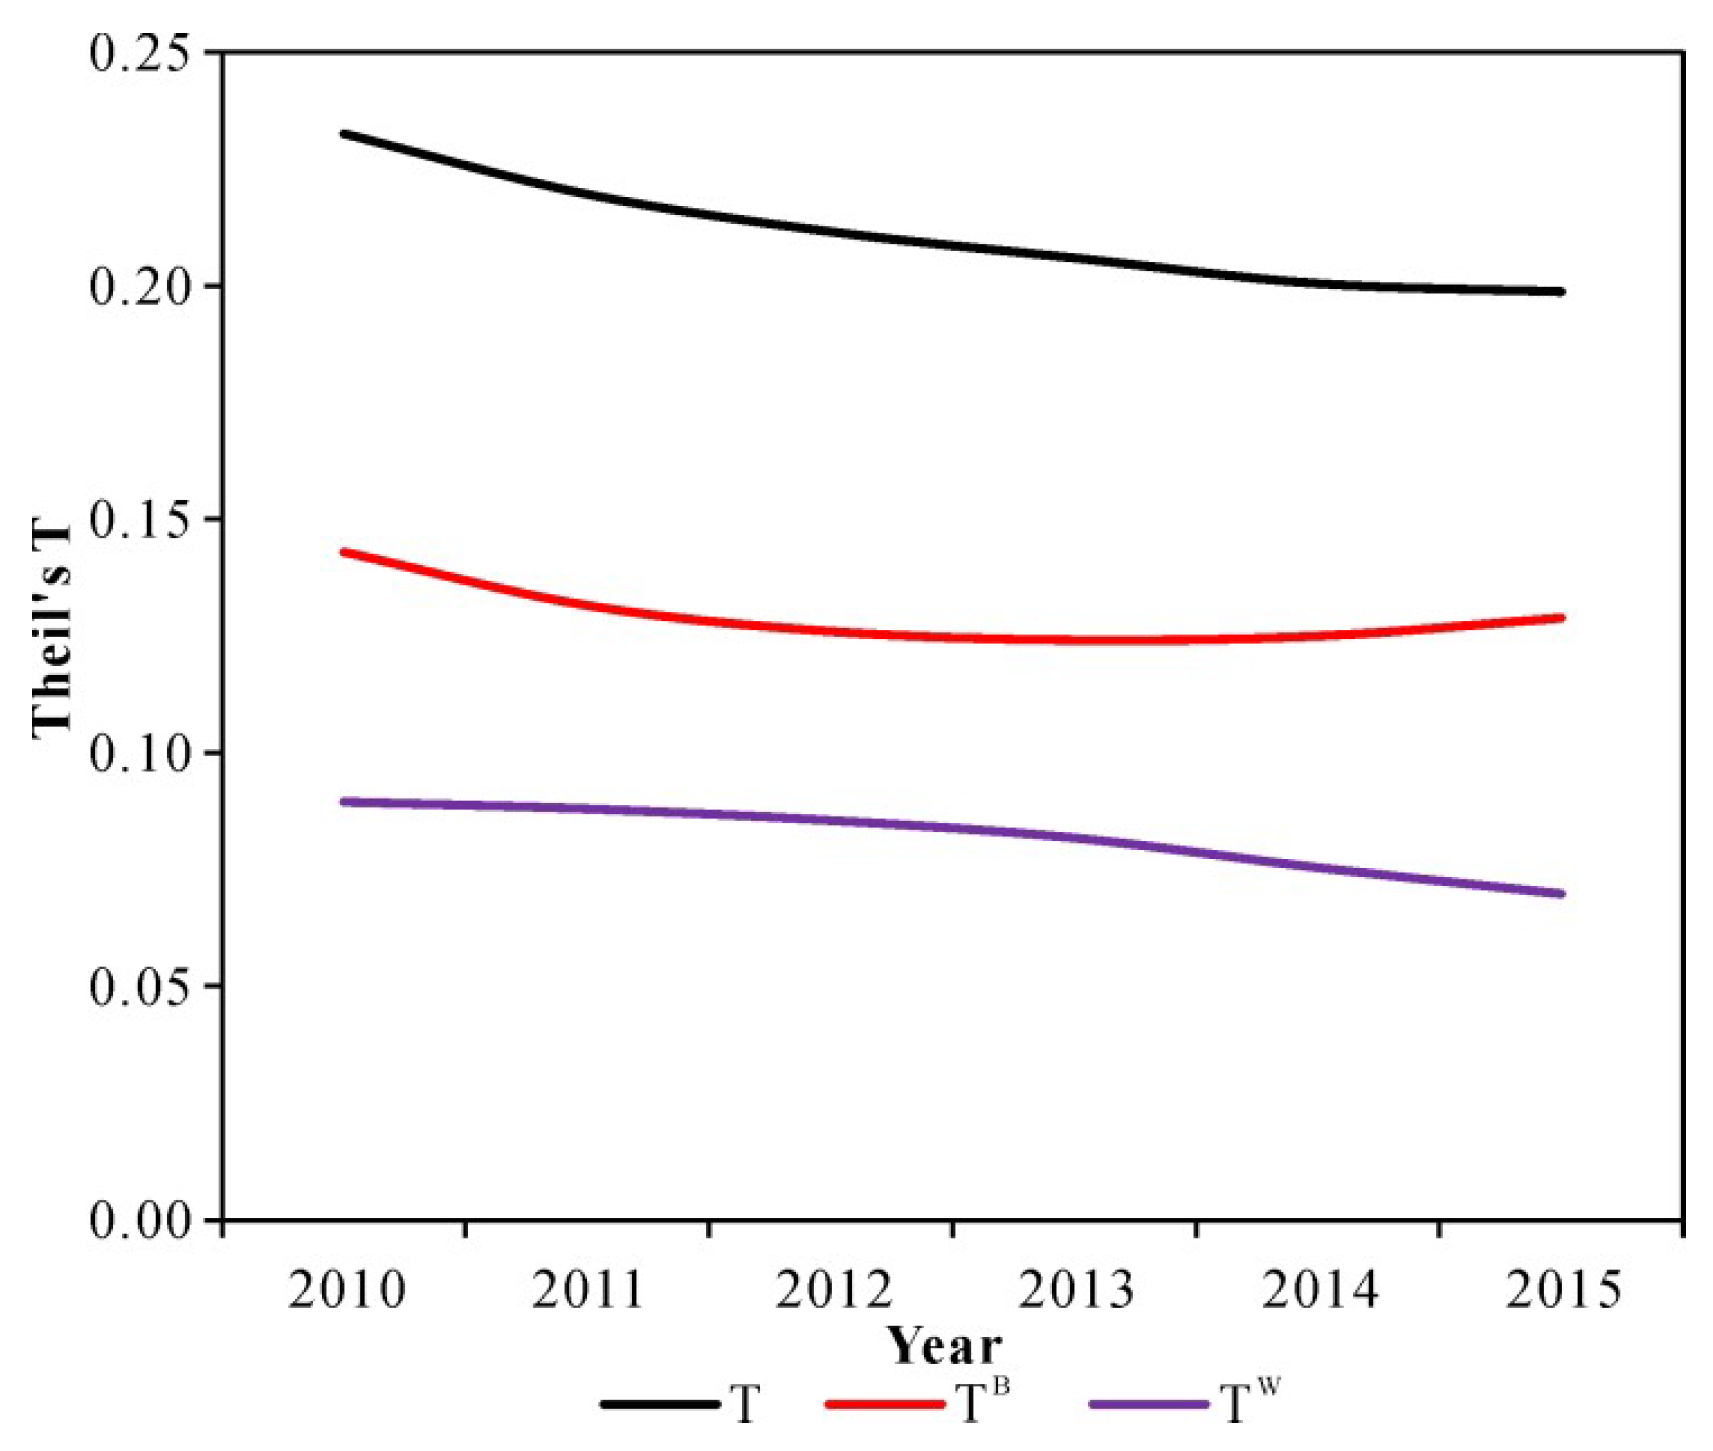
Figure 5.
Imbalance within five groups in 2010–2015. Primary production stage (PPS), primary industrialization stage (PIS), middle industrialization stage (MIS), later industrialization stage (LIS), developed stage (DS).
Figure 5.
Imbalance within five groups in 2010–2015. Primary production stage (PPS), primary industrialization stage (PIS), middle industrialization stage (MIS), later industrialization stage (LIS), developed stage (DS).
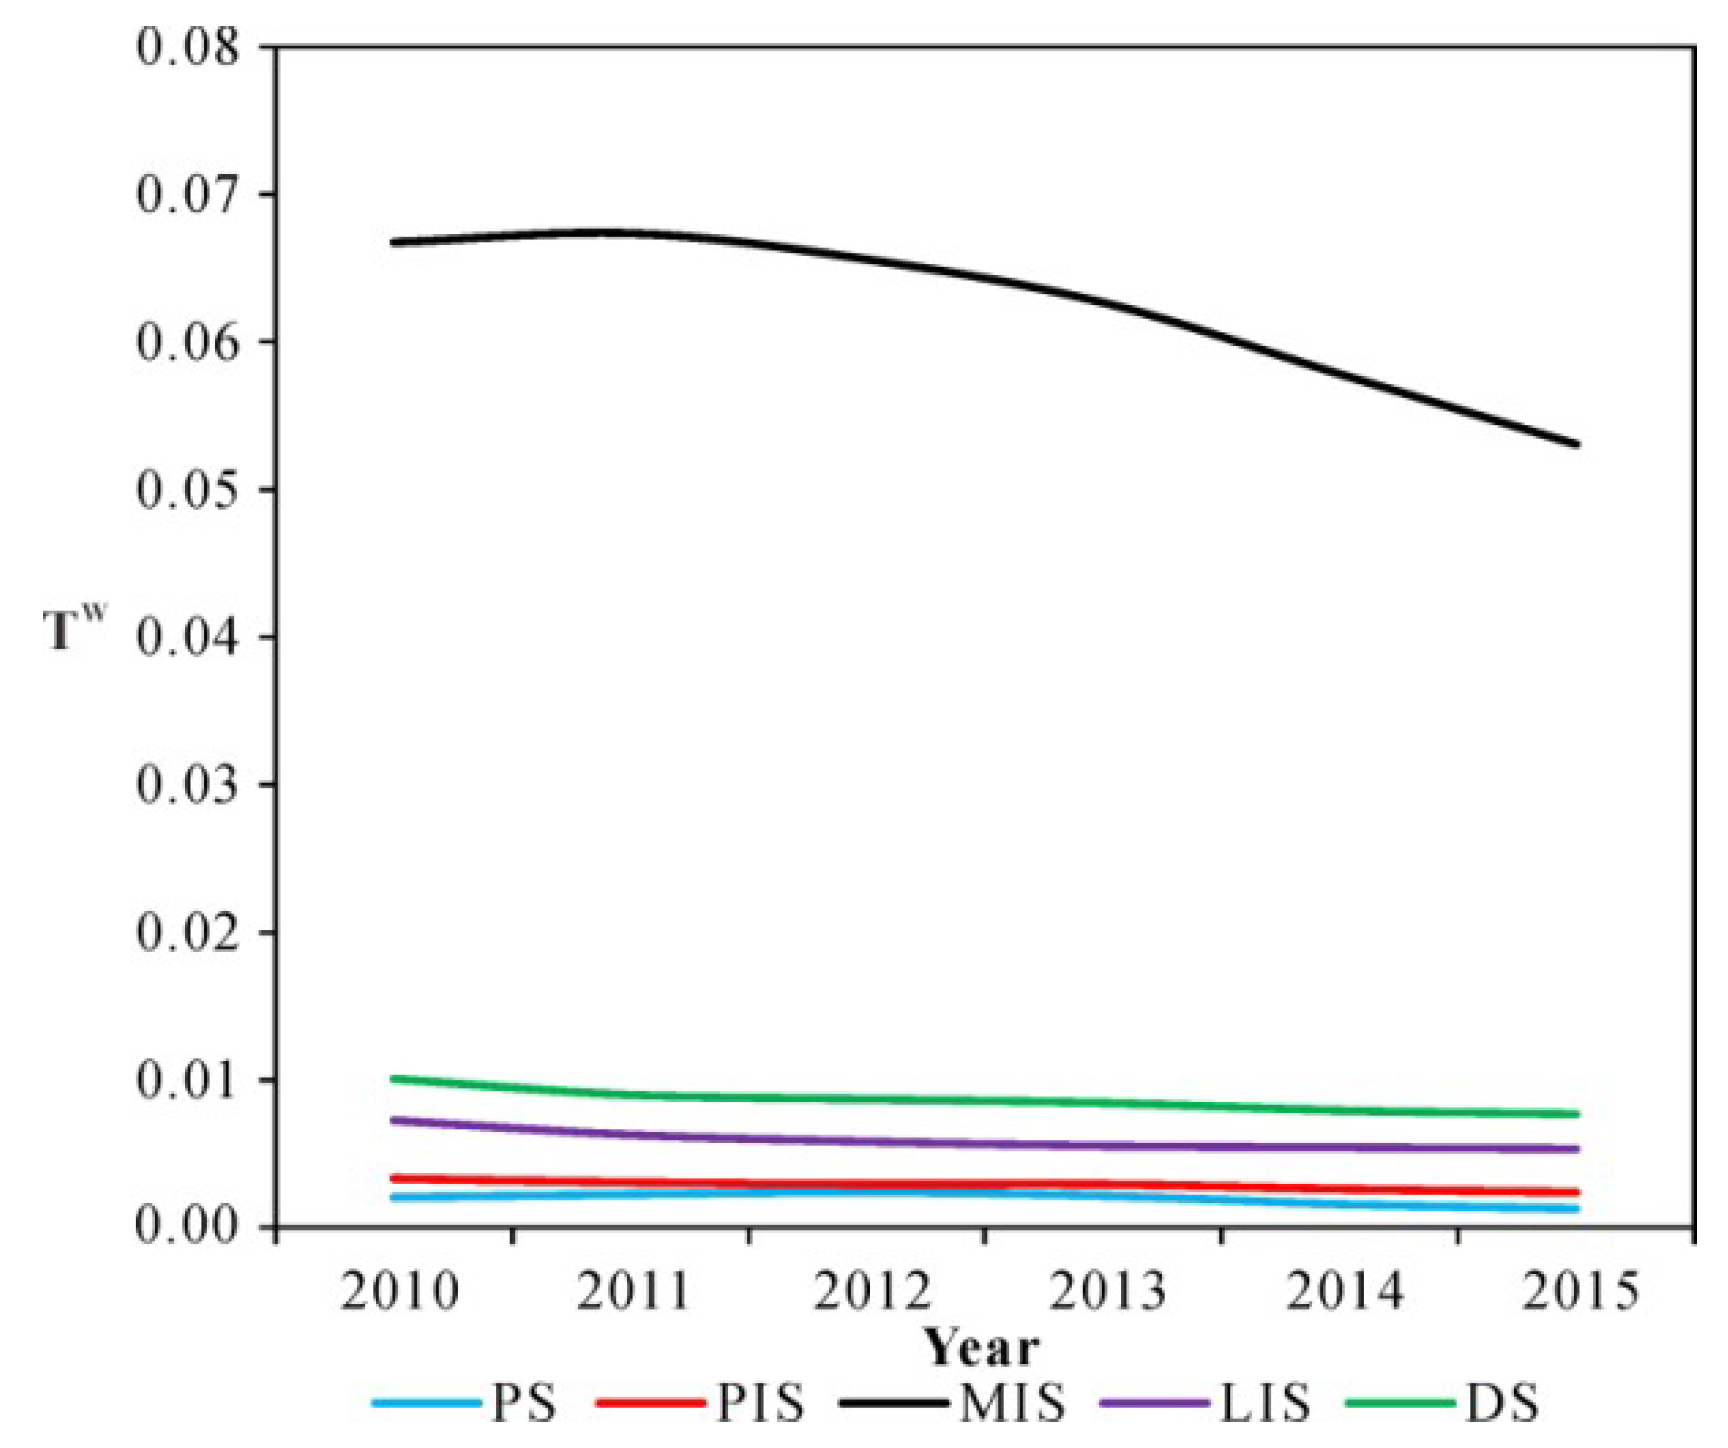
Figure 6.
Average nonagricultural-industry added value and nonagricultural industries output per unit area of cities and regions at different development stages in 2015.
Figure 6.
Average nonagricultural-industry added value and nonagricultural industries output per unit area of cities and regions at different development stages in 2015.
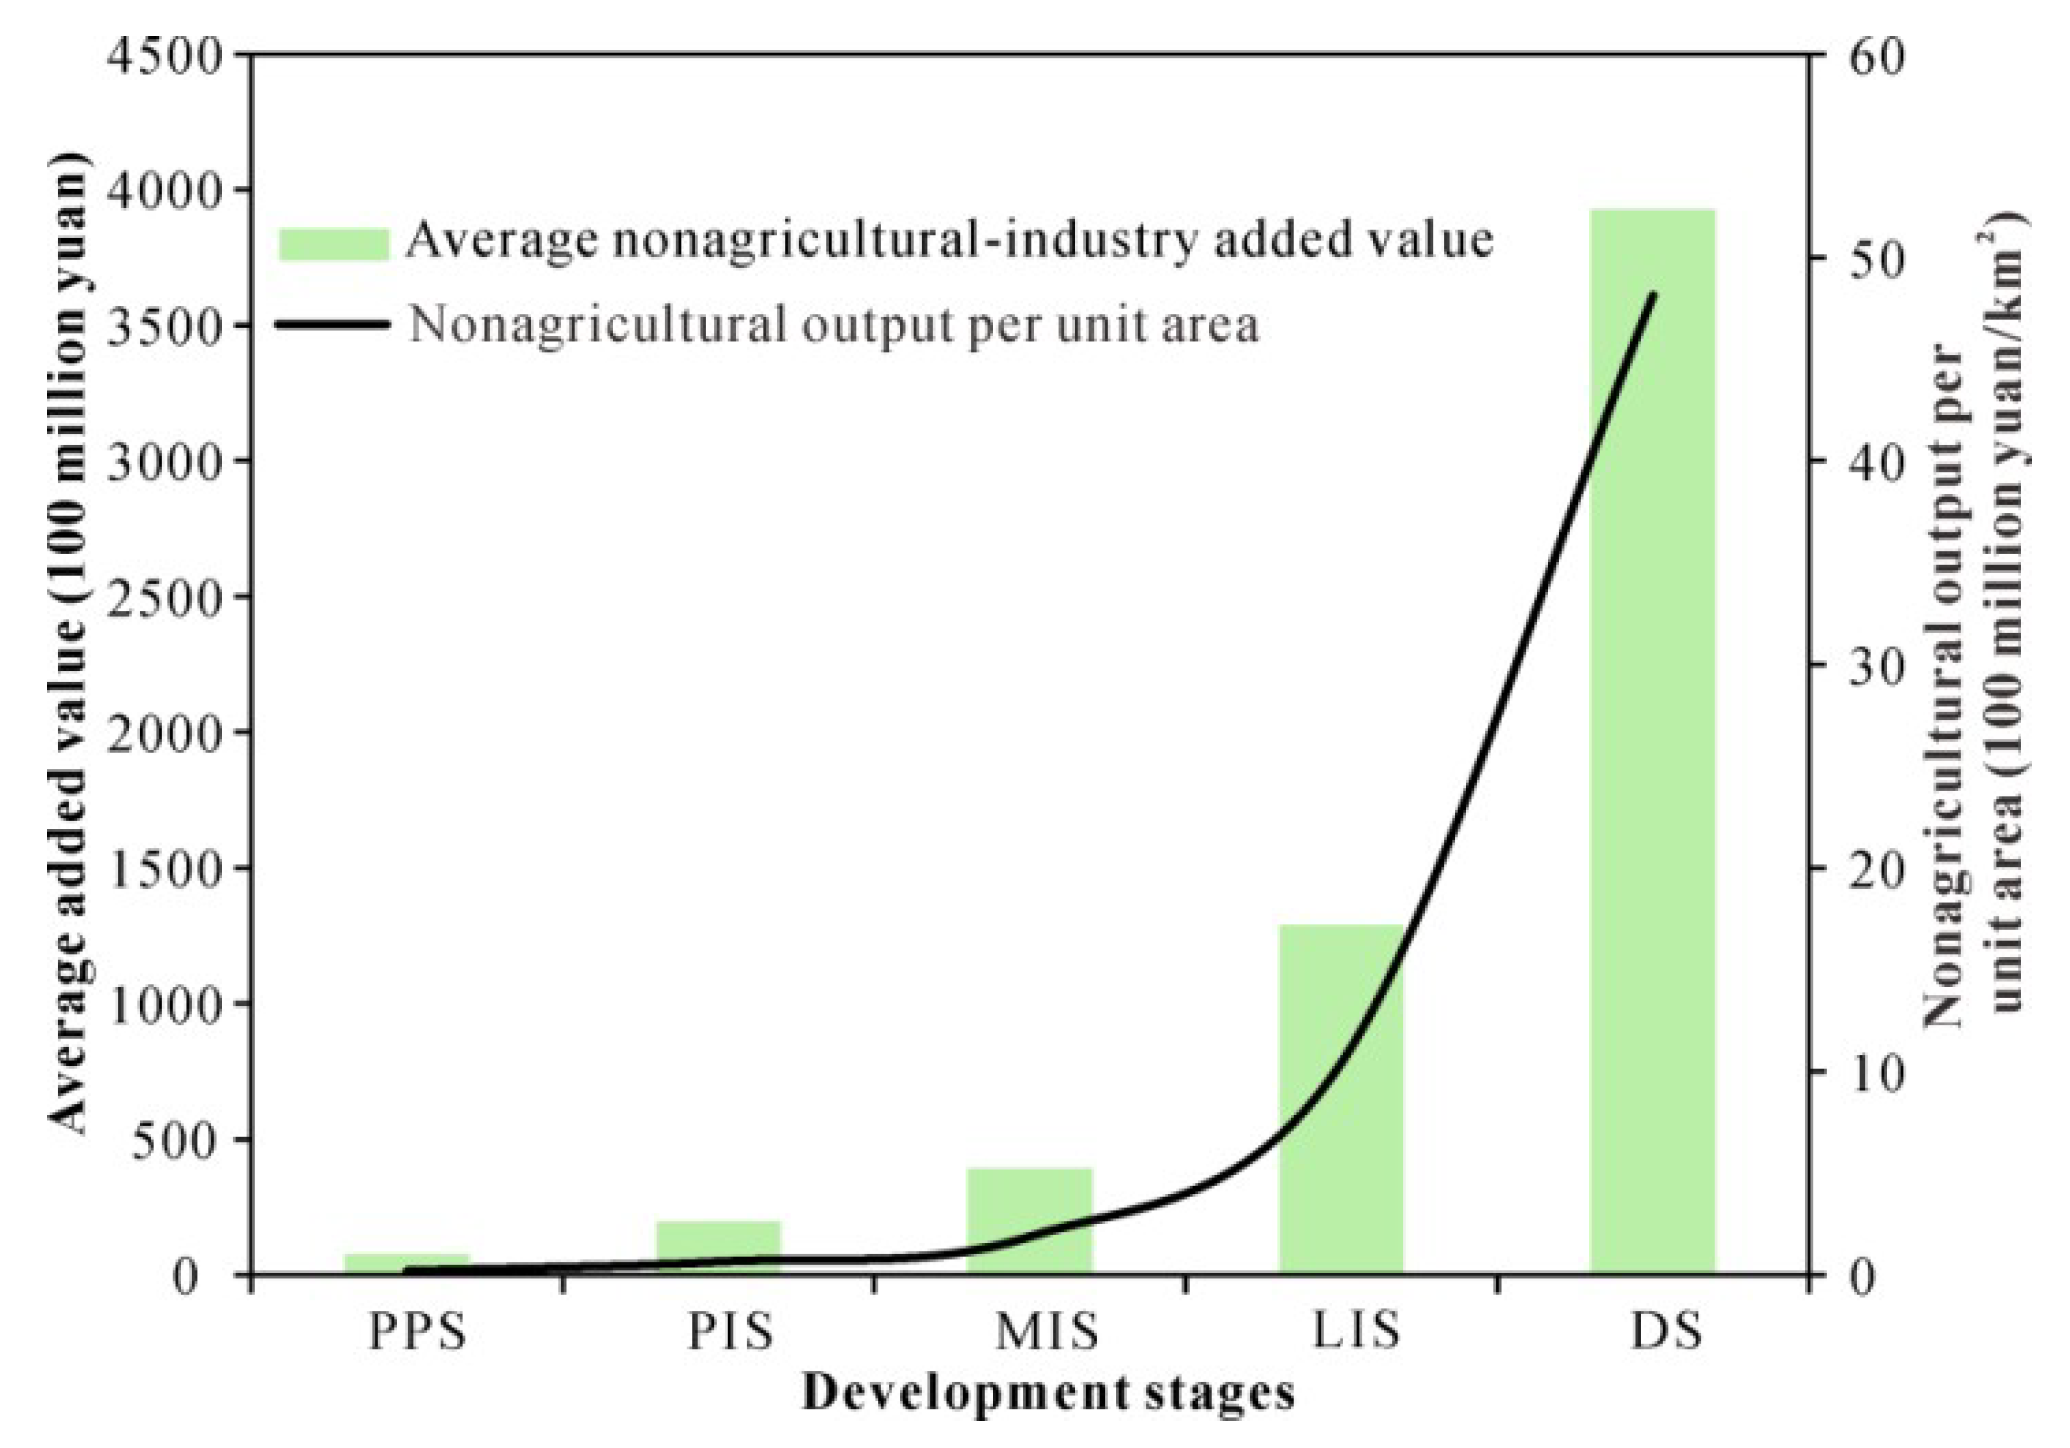
Figure 7.
Proportion and intensity of land input in major cities and regions in 2010–2015.
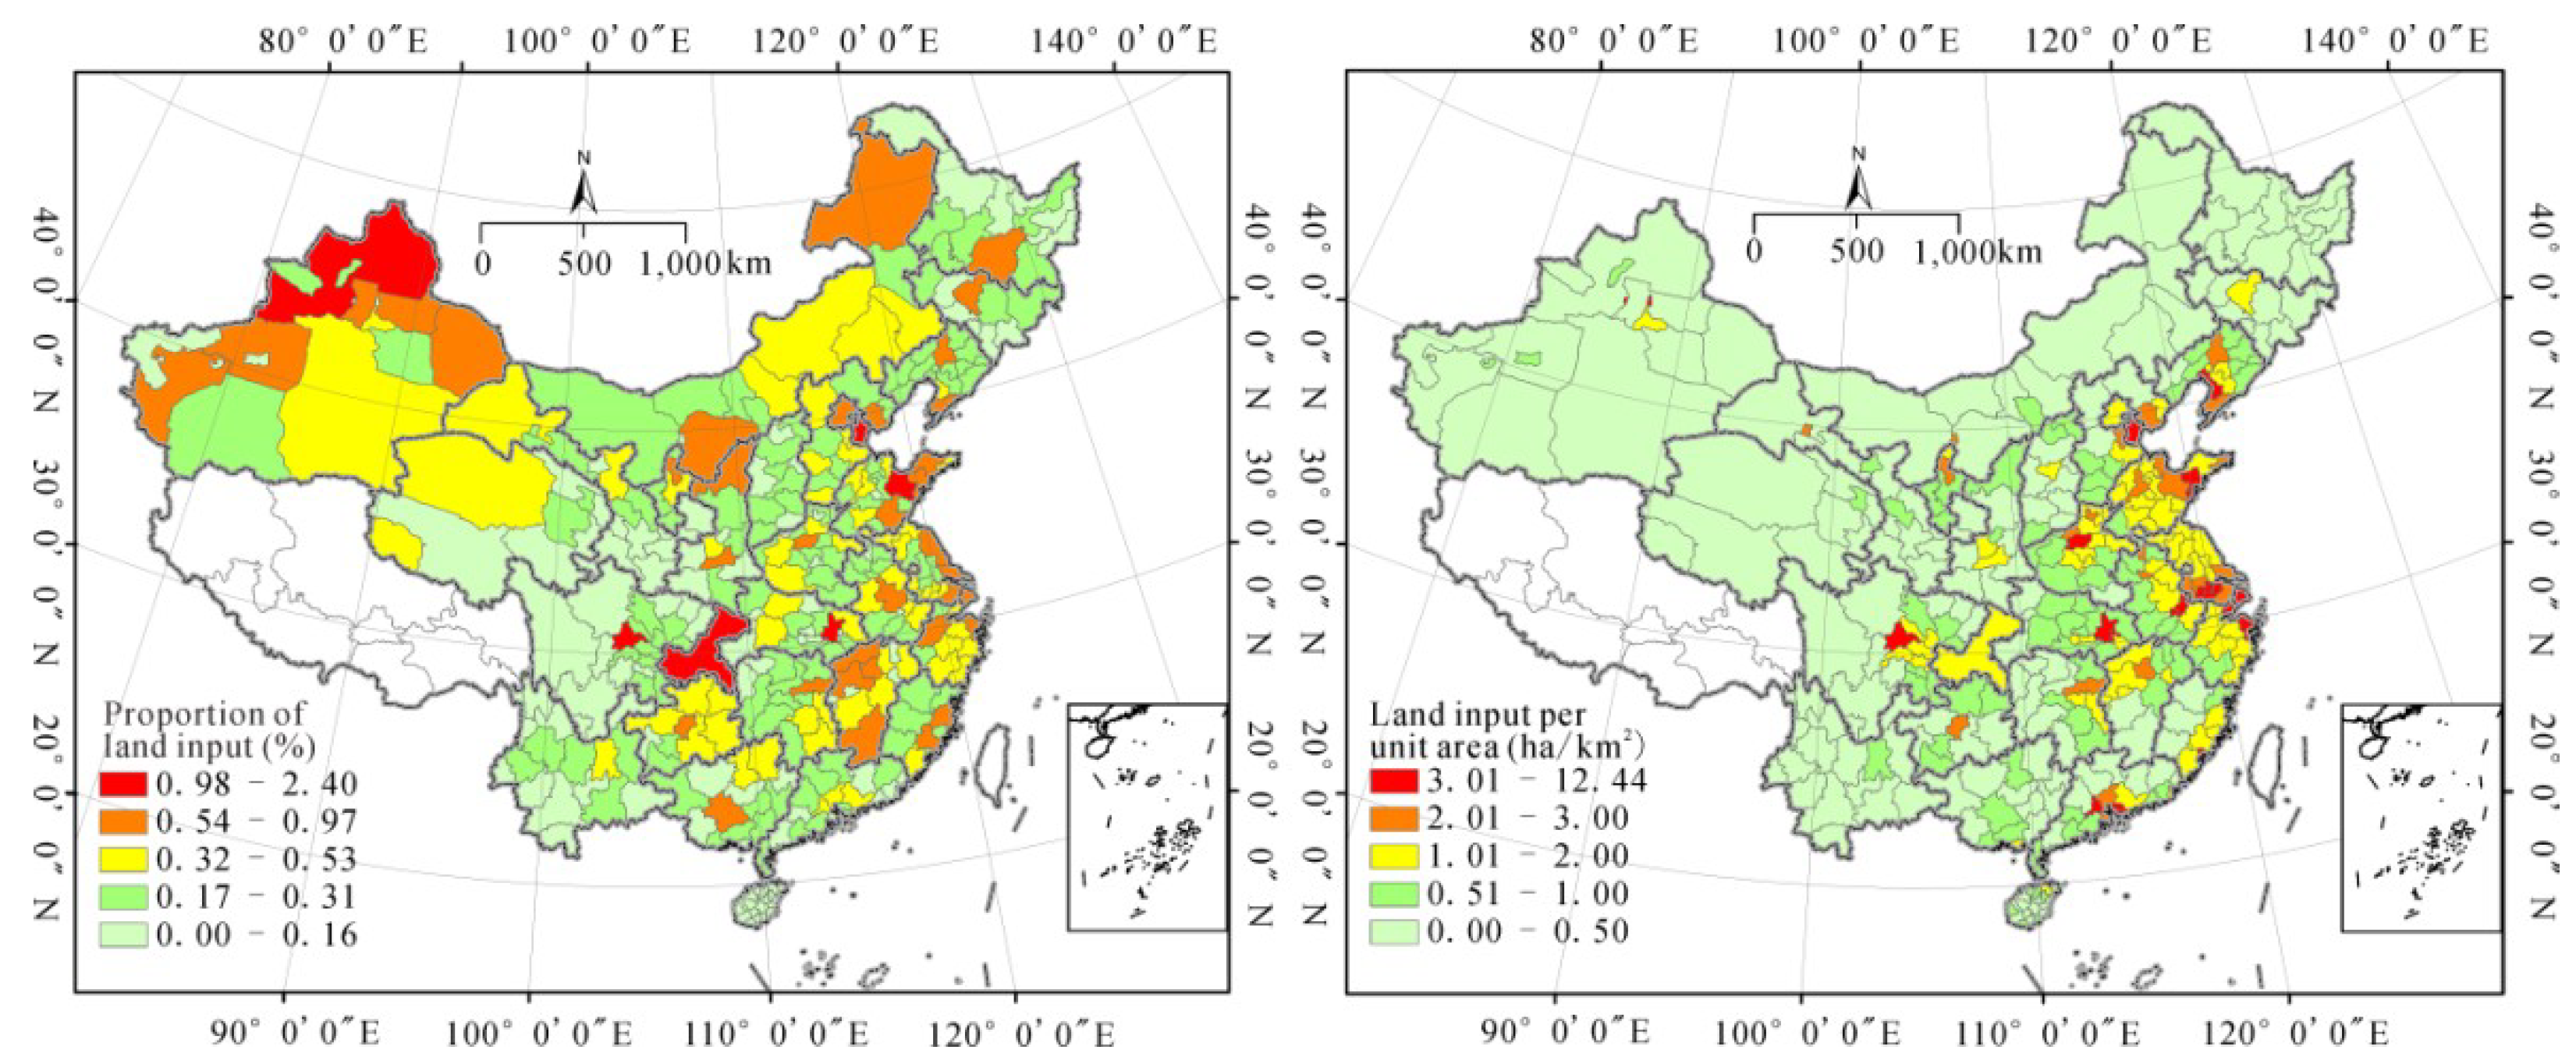
Figure 8.
Land input change of cities and regions at each stage of development in 2010–2015.
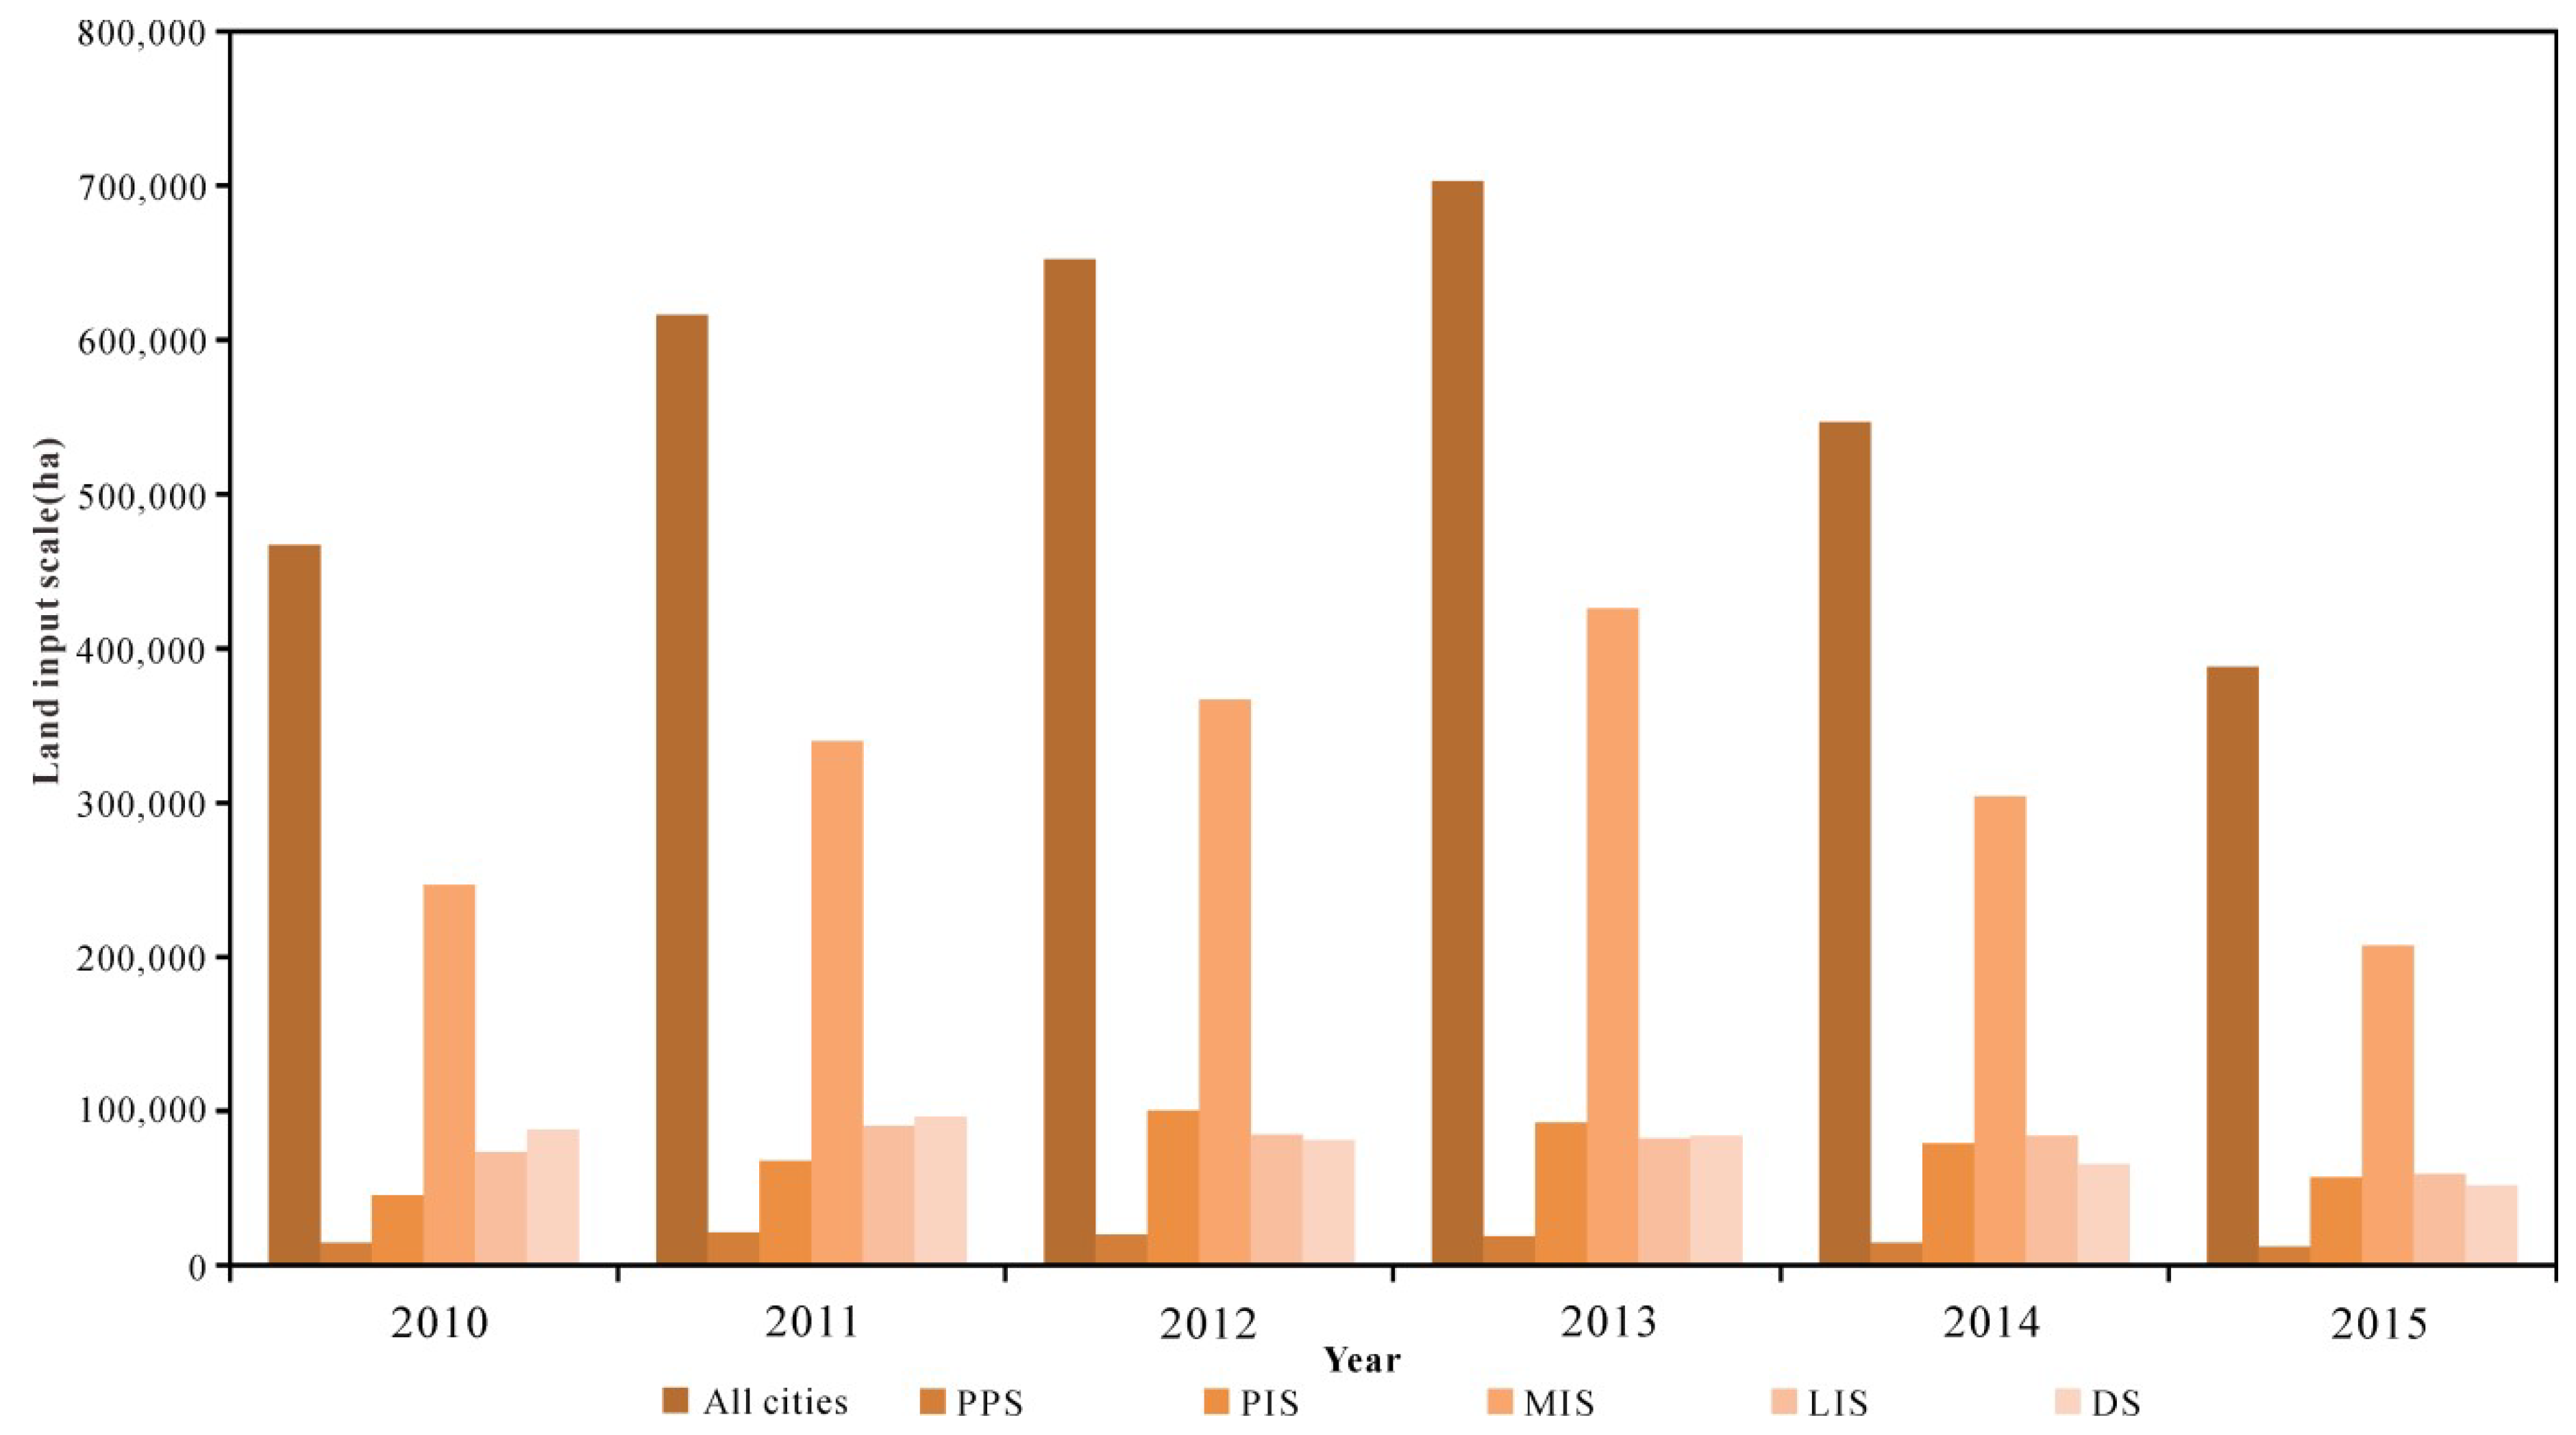
Figure 9.
Average land supply scale of cities and regions in different development stages in 2010–2015.
Figure 9.
Average land supply scale of cities and regions in different development stages in 2010–2015.

Table 1.
Estimation of the impact of land input on economic growth of all cities and regions.
| Model 1 | Model 2 | Model 3 | |
|---|---|---|---|
| Land Input | 0.8850 *** (51.8910) | 0.3027 *** (20.8830) | 0.0921 *** (8.3833) |
| Labor Force Scale | 0.8050 *** (58.4550) | 0.2563 *** (17.1387) | |
| Capital Stock | 0.7567 *** (47.6492) | ||
| Chis | 2612.9 *** | 139.51 *** | 2416.5 *** |
| F | 2692.63 *** | 5239.64 *** | 8017.68 *** |
| N | 2112 | 2112 | 2112 |
| R2 | 0.5612 | 0.8328 | 0.9196 |
Notes: The number in parentheses is the t value. *, **, and *** indicate significance at the 10%, 5%, and 1% levels, respectively.
Table 2.
Estimation of the impact of land input on economic growth at different stages of development.
Table 2.
Estimation of the impact of land input on economic growth at different stages of development.
| Model 4 (PPS) | Model 5 (PIS) | Model 6 (MIS) | Model 7 (LIS) | Model 8 (DS) | |
|---|---|---|---|---|---|
| Land Input | 0.1483 *** (5.986) | 0.0930 *** (5.2675) | 0.1086 *** (7.3096) | −0.0675 ** (−2.0374) | −0.0930 ** (−2.3843) |
| Labor Force Scale | 0.1067 * (1.9312) | 0.3397 *** (11.9650) | 0.2429 *** (14.1087) | 0.4634 *** (13.5288) | 0.7739 *** (16.6434) |
| Capital Stock | 0.7237 *** (12.1130) | 0.5084 *** (15.6691) | 0.6547 *** (32.4825) | 0.5099 *** (12.7760) | 0.4004 *** (7.0232) |
| Chis | 1540.4 *** | 288.63 *** | 5035.9 *** | 373.1 *** | 58.359 *** |
| F | 564.767 *** | 1273.18 *** | 1969.59 *** | 661.309 *** | 277.152 *** |
| N | 192 | 342 | 1290 | 162 | 126 |
| R2 | 0.9025 | 0.9198 | 0.8218 | 0.9284 | 0.8766 |
Notes: The number in parentheses is the t value. *, **, and *** indicate significance at 10%, 5%, and 1% levels, respectively. Primary production stage (PPS), primary industrialization stage (PIS), middle industrialization stage (MIS), later industrialization stage (LIS), developed stage (DS).
© 2018 by the authors. Licensee MDPI, Basel, Switzerland. This article is an open access article distributed under the terms and conditions of the Creative Commons Attribution (CC BY) license (http://creativecommons.org/licenses/by/4.0/).
Share and Cite
MDPI and ACS Style
Jin, W.; Zhou, C.; Luo, L. Impact of Land Input on Economic Growth at Different Stages of Development in Chinese Cities and Regions. Sustainability 2018, 10, 2847. https://doi.org/10.3390/su10082847
AMA Style
Jin W, Zhou C, Luo L. Impact of Land Input on Economic Growth at Different Stages of Development in Chinese Cities and Regions. Sustainability. 2018; 10(8):2847. https://doi.org/10.3390/su10082847
Chicago/Turabian StyleJin, Wanfu, Chunshan Zhou, and Lijia Luo. 2018. "Impact of Land Input on Economic Growth at Different Stages of Development in Chinese Cities and Regions" Sustainability 10, no. 8: 2847. https://doi.org/10.3390/su10082847
Note that from the first issue of 2016, this journal uses article numbers instead of page numbers. See further details here.