What Drives the Rise of Metro Developments in China? Evidence from Nantong


School of Architecture and Planning, Nanjing University, Nanjing 210093, China
*
Authors to whom correspondence should be addressed.
Sustainability 2018, 10(8), 2931; https://doi.org/10.3390/su10082931
Submission received: 16 July 2018
/
Revised: 10 August 2018
/
Accepted: 15 August 2018
/
Published: 17 August 2018
(This article belongs to the Section Sustainable Transportation)
Abstract
:This paper addresses to the rapid rise of metro developments in Chinese cities to reconsider the official justifications of such mega-projects and the underlying driving forces behind proposal and approval processes. Qualitative approaches were undertaken in this in-depth case study of Nantong’s metro project, through insights into planning documents and evidences gathered from interviews, together with relevant socioeconomic data. Our research findings reveal four major motivations to develop metro projects in China: the city’s expected improvements through the metro system, the local economic power as the essential requirement and source of confidence for project development, the inter-city competition as an invisible factor driving project proposals, and the changing domestic political economy as the direct cause of its approval. As a topic that is frequently studied in the relevant literature and often advocated by metro projects promoters, the local expected achievements in terms of modal shift to public transport, transit-oriented development, economic growth, and tax maximisation are highlighted in this case study. Additionally, in China, inter-city competition and economic-political reasons involved in initiating, promoting, and approving urban mega-projects are also vital to the whole process.
1. Background and Introduction
In many ways, transportation is a crucial component of the infrastructure in society [1]. Diverse interactions between transportation development and the city have been widely analysed from the perspectives of economic effects, urban planning, and policy-making [2,3,4,5,6,7,8]. Altschuler and Luberhoff’s research illustrated the strong role played by public investment in driving mega-project developments including urban transportation infrastructure projects in the US [9]. Furthermore, Flybjerg put forward technological, political, economic, and aesthetic drives to explain the increasing size and frequency of mega-projects in European cities [10]. Hirschman has described urban mega-projects as “the privileged particles of development process” that are designated to make ambitious changes [11] (p. VII).
Compared with other modes of urban transportation, metros are effective in many ways, in terms of being safer, punctual, quicker, cleaner, land-saving, and having a larger carrying capacity. On one hand, the proponents of metro projects often assert transformative changes brought by urban metro projects [4]. In both developing and developed countries, metro projects have been found to bring various beneficial changes, in terms of increasing land and property prices [3,12,13,14,15], producing local employment and wider economic growth [5,8,16,17,18,19,20], achieving local Transit-Oriented Development (TOD) [5,21,22,23], and encouraging local attractiveness to visitors and firms with higher local competitiveness [2,18], etc. On the other hand, over the last decade, the concept of urban policy mobility [24,25] has also been used to understand the peer-to-peer learning of similar projects and planning schemes [26,27,28], with local officials acting as leading players in transferring experience [29]. Inter-city competition is then regarded as an underlying but key factor that drives urban mega-project developments [30,31,32,33]. Within and through entrepreneurial urbanism, the local governments have been paying more attention and spending more resources on particular civic projects to attract inward investments [34,35,36]. Inter-city competition quickly emerged and motivated the introduction of some urban development projects, as described by Wood: “once one city demonstrates the achievements of best practice adoption, all cities follow” [26] (p. 205). Furthermore, in the Chinese context, due to fiscal decentralisation and localised urban governance, cities also behave in ways that seek revenue maximisation to compete in many aspects [37,38]. China has actively pursued infrastructure development and encouraged competition among its cities in bidding for and promoting local metro systems [39].
A key area of transportation mega-project literature concerns the debate about their performance as judged over time [40]. Some studies of certain cases suggested positive effects of metro development, especially in rising property prices (see for example [6,12]) and delivering TOD (see for example [22,23]), while other research findings, with statistical importance, suggested that mega-projects have been struggling to realise their ambitious goals. For example, Gonzalez-Navarro and Turner’s research, covering 138 cities with metro systems worldwide, found little or no effect on local population growth [41], which also supported Flyvbjerg′s findings of weak growth effects, extensively inflated demand forecasts, and cost overruns that were common in rail projects among 258 mega-projects developed between 1927 to 1998 worldwide [4]. The risks of being unprofitable and even unsustainable therefore indicate the necessity of further investigation into the true motivations behind proposing and pursuing these expensive urban metro projects.
Most metro projects in Chinese cities are funded by governments or public-private partnerships (known as PPPs) of local governments and state-owned companies. Following the global financial crisis and worsening domestic economy after 2008, a four-trillion (CNY) stimulus package was instituted by the Chinese central government, most of which was invested into infrastructure developments, including urban metro systems. The past decade has therefore witnessed the growing popularity of proposing and constructing metro systems in Chinese cities, with billions of dollars of investment coming in every year (see Table A1), reflecting an increasing focus on urban metro projects from the public, central state, and local authorities. To initiate an urban metro project, Chinese mainland cities were required to meet several requirements proposed by the National Development and Reform Commission (NDRC) in 2003 (in Document (2003) No. 81) [42]. This has been the policy basis for approving urban metro developments since its publication, and by the end of 2017, 43 mainland cities had already implemented or gained approval from the State Council and the NDRC to develop their own metro systems (see Table A2). Although 14 among the 43 cities did not meet one or more conditions set in the existing official criteria, 3976.9 km of urban metro lines have been in operation in 34 mainland cities so far [43].
The passion for metro development does not appear to be abating, as a growing number of cities are currently pursuing such projects of their own. A number of cities, especially those that failed to meet the existing official criteria in terms of population size, economic power, and ridership projections, have been actively planning, proposing, and carrying out their own metro projects, even though their ability to start construction and deliver metro projects has been questioned by the public. More specifically, issues such as slower population growth, smaller economic scales, and relatively lower predicted ridership all cast doubt on the possible delivery of a public good, which can bring a potentially heavy fiscal burden on the local state.
The present literature on metro development and other mega-transport projects in China mainly focuses on the aspects of engineering technology, financial patterns, cost-benefit analyses, and socioeconomic effects (see for example [5,8,14,16,18,19,20,22]), yet studies on the integrated motives and substantial dynamics that push urban metro projects forward are relatively limited to date. With this background, we investigate what motivates cities to embark on these mega-projects in the face of strong potential for failure as well as why certain cities are permitted to build urban metro projects. Delving into the motivations of transport infrastructure development in Chinese cities is relatively unique in the literature, and this study aims to study the recent rise of metro development from socioeconomic, environmental, and political aspects. We thus utilised a case study of Nantong, which is a typical Chinese prefectural-level city in the Yangtze River Delta, the 37th Chinese city officially permitted to build its metro project as well as one of the 14 cities permitted to start metro projects without matching all of the existing official criteria set by the NDRC.
This study’s original contribution lies on three fronts. Firstly, it unpacks the question of “why a city develops its metro project” into aspects of expected improvements, essential requirements, invisible driving forces, and direct causes of the development. Secondly, with empirical evidence and a critical analysis of the discourses of relevant policies, this study conceptualises why such mega-project developments in Chinese cities are so attractive to both central and local states, as well as how they are justified and motivated by policy-makers, contributing to urban policy framing literature and Chinese scholarship in urban transportation infrastructure development. Thirdly, by problematising the official discourse to promote the metro projects and highlighting the economic-political drivers of the decision-making process, our reconsideration of the recent rapid rise in infrastructure investments in China will also be applicable to the formulation of relevant urban policies and the delivery of sustainable transportation development, in not only Chinese cities but also other developing regions.
The rest of this paper is organised as follows. The next section illustrates the methods and data sources used in the case study. The third section presents and discusses the findings from relevant official documents and face-to-face interviews with local elite personnel. Conclusions are reached in the final section.
2. Methods and Materials
This exploratory study utilised the metro project in Nantong as the case to investigate the factors and rationales that motivate such expensive urban mega-project developments in Chinese cities. The research method consisted of reviews of relevant policy documents and official socioeconomic data as well as qualitative interviews conducted in a semi-structured manner.
Nantong’s metro proposal was selected to investigate the rationales and motivations for initiating urban mega-projects in the recent tide of metro development in Chinese cities. Nantong, situated at the mouth of the Yangtze River and on the north side of the river, is one of the 14 Coastal Development Areas set up in 1984 to open up Chinese cities to overseas investment. As a prefectural-level city, Nantong currently has about 7.3 million residents in total, 2.3 million of which live in main urban areas [44]. Its local fiscal revenue and Gross Domestic Product (GDP) ranked fourth among 13 cities in Jiangsu Province over the past 20 years, and 24th among all Chinese cities in 2016 [44]. The initial development plan of Nantong’s metro project was finished in 2010 [45]. In August 2014, the State Council and the NDRC approved the “Proposal Plan”, making Nantong the 37th city to be granted metro development approval in mainland China.
Official documents including the NDRC’s metro policy in 2003 [42], the metro project proposal plan [45], the local masterplan of 2011–2020 [46], and the traffic forecast report [47] were used to present the policy contexts of developing metro projects and to provide justifications for Nantong’s metro project. To help demonstrate the local economic and demographic situations of cities and the state, relevant socioeconomic data were collected from official publications, including the statistical bulletins for national economic and social development of Nantong of recent years [48], the statistic yearbooks of Nanjing, Suzhou, Wuxi, Changzhou, Xuzhou, and Nantong in specific years [49,50,51,52,53,54,55,56,57,58,59], and the domestic socioeconomic bulletins of recent years prepared by the National Bureau of Statistics of China [60].
As the major input of this study, a set of seven qualitative interviews were conducted in order to gain the perspectives and a more in-depth understanding of project motivations. These respondents from local government and expert group were influential in and well-informed about different parts of Nantong’s metro project development, including ex-ante research, network planning, proposal making, project financing, and project implementation (Table 1). The face-to-face interviews were conducted between May and July 2015, lasting 1.5 to 3 h, and were to a great extent open-ended, allowing the interviewees the freedom to provide more valuable information based on their knowledge and imagination. The interview questions were designed based on the reviews of relevant literature [1,2,3,4,5,6,7,8,12,13,14,15,16,17,18,19,20,21,22,23,30,31,32,33,39,40,41], relevant policy documents [42,45,46,47], and local socioeconomic data [48,49,50,51,52,53,54,55,56,57,58,59], and then tailored to each interviewee depending on their positions in social and administrative realms and their roles played in the whole process under four major themes:
- visions of the metro development, including their opinions on TOD and expected metro effects;
- evaluations on Nantong’s metro proposal;
- opinions on inter-city competition and learning urban strategies from other cities;
- and controversial issues about this project, such as gaining approval despite not fulfilling the existing official criteria and the delayed implementation.
3. Findings and Discussion
3.1. The Local Distinctiveness and Planning
The “Proposal Plan” characterises Nantong as a modernised international port city, an important economic centre north of Shanghai, and a livable cultural city [45]. In recent years, Nantong performed well in building a pleasant living environment compared to other Chinese cities. For example, it ranked eighth among China′s top 10 livable cities according to a recent survey by the National University of Singapore (the ranking was conducted by National University of Singapore based on indicators including economic revenue, social participation, social civilisation, ecological environment, and medical convenience amongst 289 cities in China) [61], and was named the National Civilised City in 2008 and the National Sanitary City of China in 2007 [62]. The Vice Mayor of Nantong expressed his pride of receiving such awards and a reputation for city development during the interview (China Interview: 15a0601). Nantong is also famous for its ecological environment, sports and education, and the longevity of its residents [63]. All of the elite interviewees believed that the metro development would promote local livability in terms of more completed, connected, accessible, and comfortable public transport network, as well as better the ecological environment by reducing air pollution in the main urban areas of Nantong (China Interview: 15a0601, 15a060, 15a0603, 15b0501, 15b0601, 15b0602, 15b0701).
Transportation is significant to local economic development. Previous research in China found a significant positive relationship between inter-city accessibility and local economic growth in terms of GDP. Moreover, the level of economic development is largely influenced by the distribution of the expressway and high-speed rail networks [8]. Nantong is an important gateway and harbor city connecting Shanghai and Jiangsu Province [47]. Despite its coastal and riverfront location, as Nantong is located at the very eastern extremity of the coast and separated from Shanghai by the Yangtze River, its railway network has limited extensions, directly influencing the accessibility of the city. One expert interviewed (China Interview: 15b0601) regarded the lack of labor migration and regional industrial incorporation caused by its poor inter-city transportation infrastructure as key reasons why Nantong had fallen behind Suzhou in terms of economic performance in recent decades. Twenty years ago, the economic development levels of Suzhou and Nantong were similar, but today, the local GDP is 1500 billion (CNY) in Suzhou and 580 billion (CNY) in Nantong. The amazing speed of economic growth in Suzhou is attributed to the Huning (Shanghai-Nanjing) high-speed rail project that passes through the city. Regarding the urban vision of transportation development, all of the interviewees, as well as the mainstream local forum, are looking forward to the future improvement after the establishment of the planned Shanghai-Nantong high-speed railway in the coming years, which is expected to include Nantong within the 1-h commuting circle of Shanghai.
In Chinese cities, both local leaders and the public believe that the development of a metro project could bring prosperity to the local economy [14]. From the interviews, it clearly emerged that Nantong has placed great faith in the metro project to deliver economic growth. The city plans to improve its core competitiveness by enhancing its local infrastructure. One of the administrative leaders interviewed noted: “The emphasis in the near future is to improve the transport environment in order to increase local livability, enhance our urban growth capacity, direct industrial distribution, and drive economic development…Yes, the metro project is the vital infrastructure project to achieve these objectives” (China Interview: 15a0603). The Chief Engineer highlighted that “the economy is always the most important part and the underlying objective for Chinese cities” (China Interview: 15b0701). As was summarised by the Vice Mayor (China Interview: 15a0601), Nantong requires this mega-project development to bring the city more opportunities for economic growth.
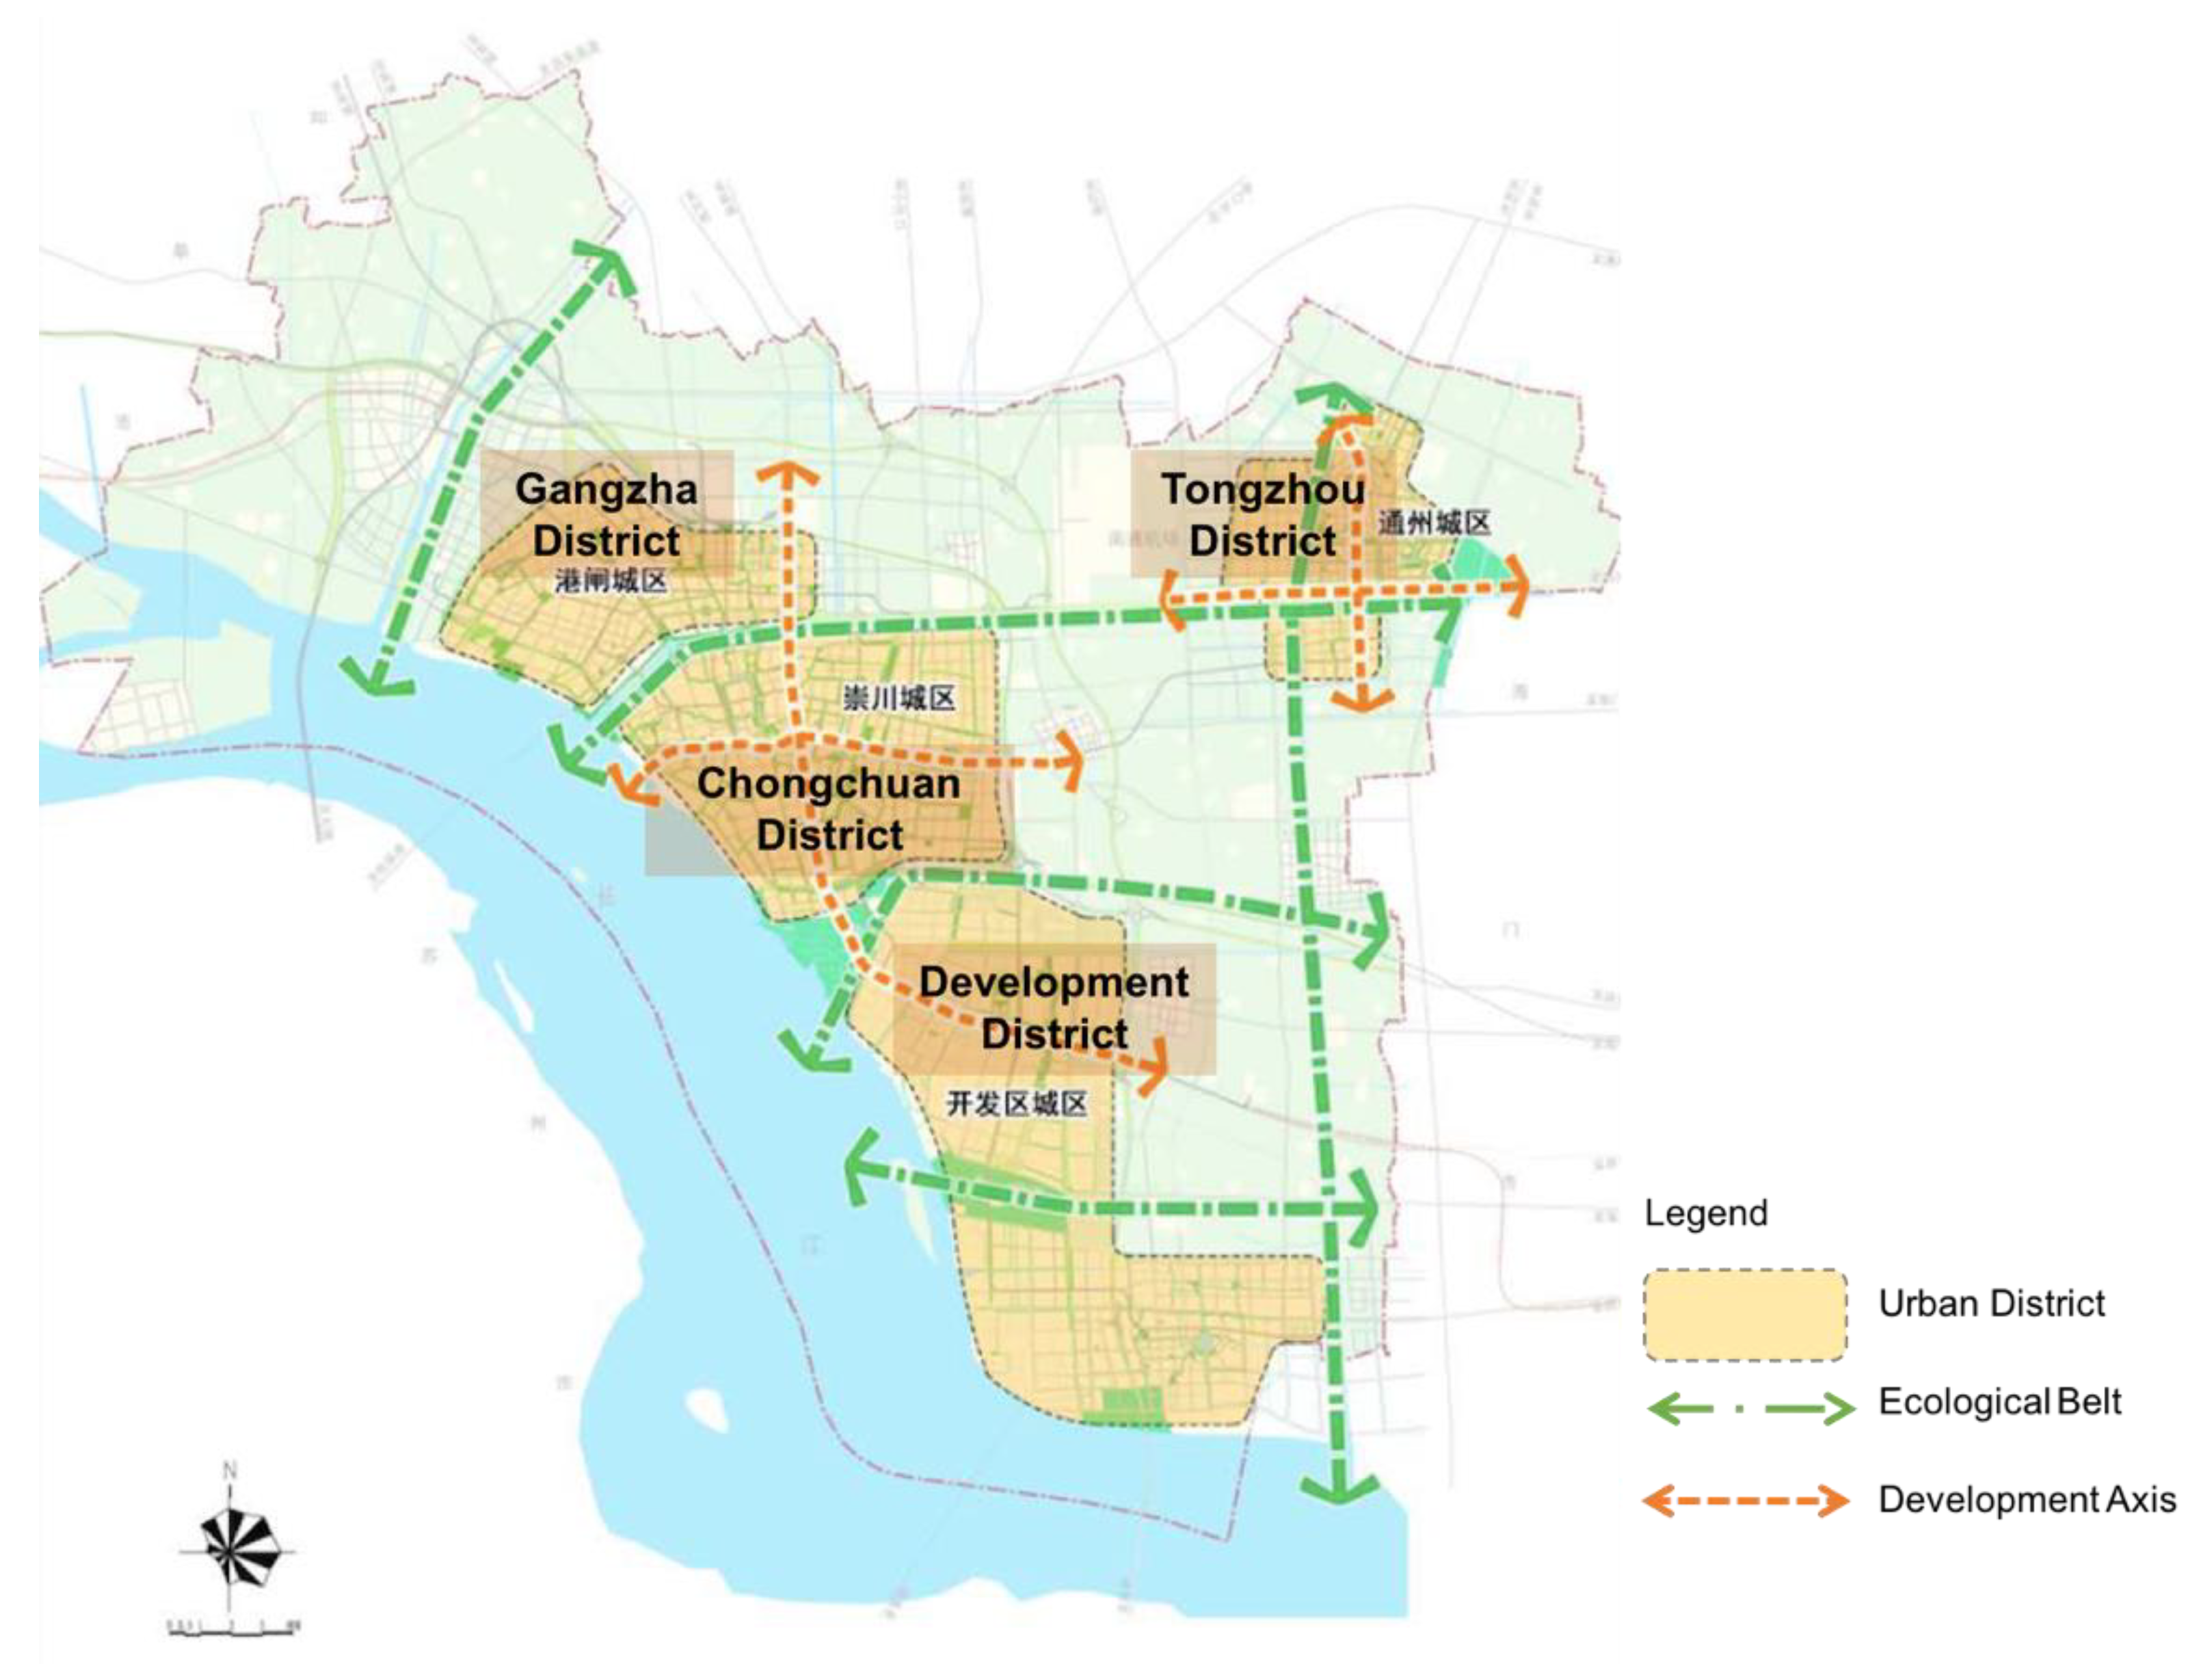
Local development plans are therefore made towards further economic growth through transformative influences on the urban form. With the geographically ribbon pattern along the Yangtze River, Nantong plans to extend the central functions of traditional city centre to the north, east, and south [45]. According to its “Masterplan”, the main urban areas of Nantong will develop a spatial form of “four axes—four districts—five belts” [46] (Figure 1), which also mainly reflects the proposed metro routes (Figure 2). The four axes refer to four major road transport corridors in the main urban areas that connect the business, administrative, cultural, commercial, and residential clusters; the four districts refer to the Chongchuan district in the traditional centre, the Gangzha district in the northern part, the Tongzhou district in the eastern part, and the Development district in the southern part, which constitute the central urban area of Nantong.
Different from the views that emerged from our interviews, economic growth is not emphasised as a crucial reason to start the project in its official plan. In the “Proposal Plan”, three key reasons are put forward to justify the development of this urban metro system:
- “To foster the expansion of the traditional city centre”: with the support of the metro, the land-use pattern, spatial form, and the urban resources will be controlled and directed more effectively;
- “To enhance the centralisation function of the traditional city centre”: the planned Urban Rail Transit Line No. 1 (first phase) and No. 2 (first phase) going through the Chongchuan District, Gangzha District, and the Development District will contribute to rapid inter-district transportation and strengthen the core position of Chongchuan District in the middle, as well as promote new development in the other two districts (Figure 2);
- “To facilitate the development of urban outskirts”: the metro system will encourage the relocation of residents and urban activities, help reduce air pollution in the city centre, and facilitate coordinated spatial development [45].
3.2. The City’s Expected Impovements
Regarding the expected changes made by the urban metro system, a modal shift to public transport, transit-oriented development, and the promotion of local economy were frequently mentioned by officials and experts interviewed in Nantong, whose opinions also echoed the present literature on metro effects [1,3,5,6,7,8,12,13,14,15,17,18,19,20,21,22,23].
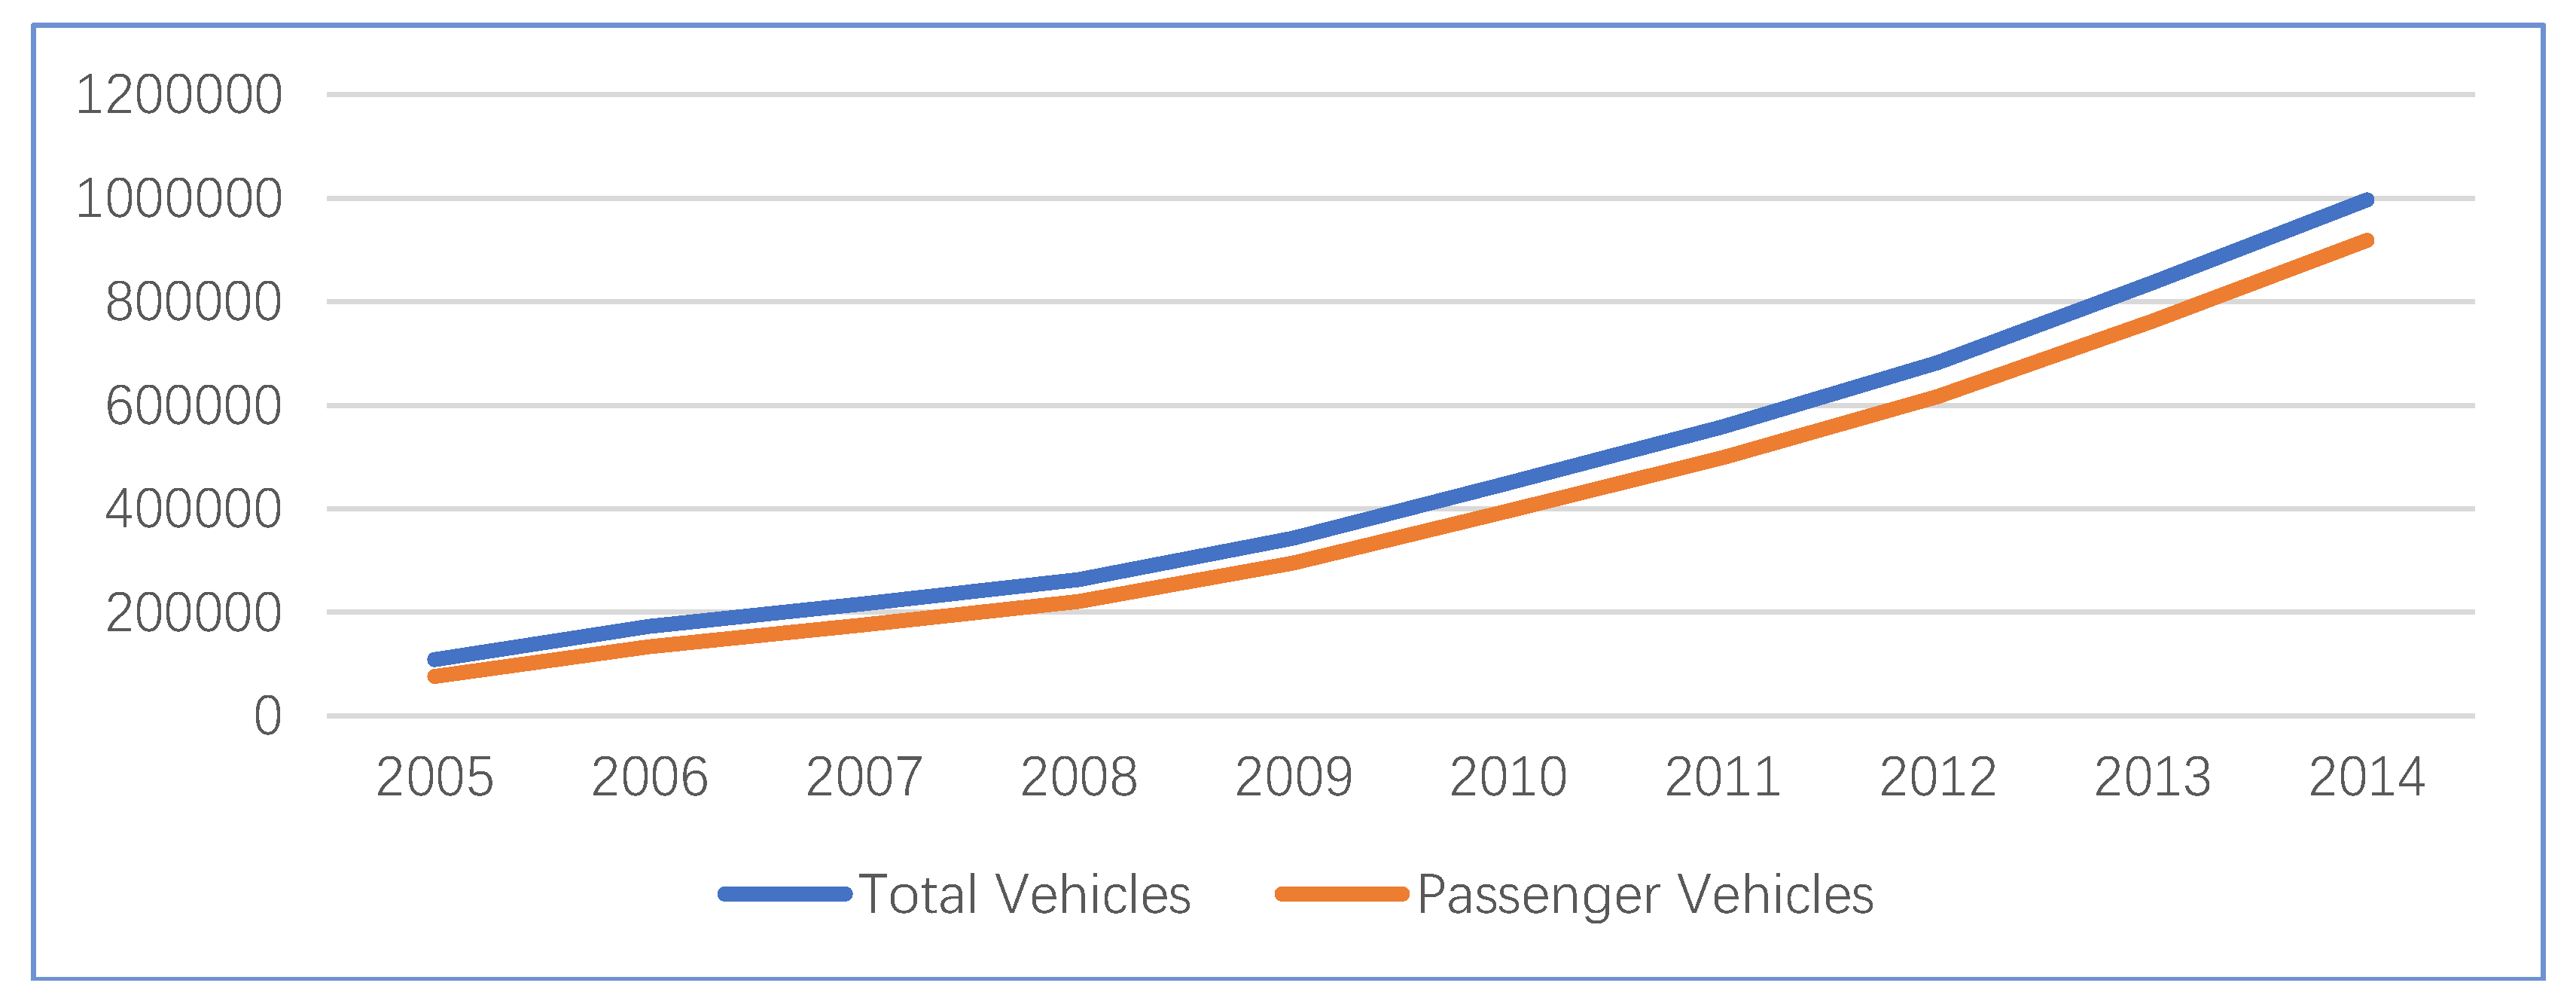
The past decade has witnessed rapid increases in the number of automobile vehicles in the city and private car ownership of urban households, exacerbating the congestion in the main urban areas of Nantong (Figure 3 and Figure 4). In 2014, the year when the NDRC approved Nantong’s metro proposal, the majority of local residents in Nantong were commuting by private transportation, particularly electronic bicycles (Table 2). A more recent online traffic survey conducted with 200 residents in main urban areas of Nantong found that 14% of the respondents travelled by private cars and 37% of the respondents viewed private car as the most convenient travel mode (the online questionnaire and report of resident traffic survey in Nantong conducted in June 2018 is available at: http://www.wjx.cn/report/3247378.aspx (accessed on 30 July 2018)). Since priority in public transportation development is an important approach to reduce traffic congestion and increase the utilisation efficiency of urban transport resources, the local government hoped to reduce congestion and chaotic road traffic by encouraging a sustainable mode of urban transit in advance [31]. The city aims to improve the public transport mode share in the main urban areas of Nantong from 11% in 2014 to 23% by the end of 2018 [63], and to 58.6%—including 23.4% in the urban metro system—by 2020 [45]. It was emphasised by a local administrative leader interviewed that even though developing a metro project is costly and often uneconomic, it would at least offer a “greener” choice of travel and contribute to the expected local modal shift from private to public modes of transportation (China Interview: 15a0603).
“Planning means making predictions and preparations for coming challenges and opportunities, but it also takes a long time to make changes”, as stated by one planning expert interviewed (China Interview: 15b0602). All three officials interviewed (China Interview: 15a0601, 15a0602, 15a0603) mentioned TOD as the current underlying ideology of urban planning and development in most Chinese cities, including Nantong. They regarded the metro as an important infrastructure to improve accessibility and to achieve TOD, by providing a “greener” travel mode and promoting both city centre regeneration and the development of new sub-centres. These perceptions agreed with the opinions reported in the present literature on TOD [5,17,21,22,23]. The Vice Mayor described his vision of Nantong with the metro system as follows: “The ideal development with the metro system is like a series of decentralised and compact urban clusters in the city, connected by the metro lines. People can live and work in these clusters within the city while the road traffic is not congested even during the peak time, because most people commute by mass public transit” (China Interview: 15a0601).
During the interviews, both the local government and a number of public media also expressed positive expectations concerning the increase of the property and land values incited by the metro project, and its further contributions to economic growth. All of the interviewees affirmed the potential value improvement of the land and property around the metro stops in Nantong, indicating a subsequent increase in the revenue of the local government to offset the deficit caused by the project construction and operation (China Interview: 15a0601, 15a0602, 15a0603, 15b0501, 15b0601, 15b0602, 15b0701). Some property websites also predicted the future rise in the real estate market influenced by the coming metro system. Furthermore, a reduction in travel costs for residents was expected to improve the attractiveness and core competitiveness in the location decisions of firms and inward investment (China Interview: 15a0602). Since the proposed metro network in Nantong was planned to cover both the developed urban areas and some of the undeveloped lands owned by the local government, the latter were expected to sell at higher prices to developers. One local government leader emphasised that: “If private residents and developers have already occupied all the valuable lands around all the planned metro stops, the benefits of the value increase due to the transport improvement will be gained by a small group of people. Instead, for the undeveloped lands, the benefit belongs to the government by selling the lands at higher prices, and will be utilised for local public welfare” (China Interview: 15a0603).
Despite the above changes expected by the local leaders interviewed, local conditions to develop this urban mega-project are also crucial for their realisation. The World Bank found that the significant positive impacts of a mega-transport project on investment, employment, household relocation, and economy only materialised under some specific conditions, specifically:
- the project removes the bottlenecks in the region with serious capacity problems;
- the new capacity affords considerable savings in the travel costs of households;
- and there is a combination of various types of investment [64].
In the case of Nantong’s metro project, the local planning experts were also pragmatic towards strong economic effects. The Chief Engineer commented, “It could be a crisis for the local economy if too much capital was invested into the land market of Nantong” because there would be no actual acceleration effect on the economy where the property investment rate is higher than the benefit rate generated by the metro itself (China Interview: 15b0701). In addition, since the average property price in Nantong is already much higher than those of cities at a similar level of development, the room for further value increase and consequently the attractiveness of investment can be questioned (China Interview: 15b0601, 15b0701).
3.3. Project Apporval with Some National Metro Development Criteria Mismatched
According to the urban metro development policy in China, to initiate an urban metro project, cities need to meet three quantifiable criteria. Cities are required to have:
- a local government finance of over 10 billion (CNY) and a local GDP of over 100 billion (CNY);
- a total population over 7 million (with over 3 million of these in the urban area);
- and a projected one-way peak-time ridership per hour over 30 thousand trips [42].
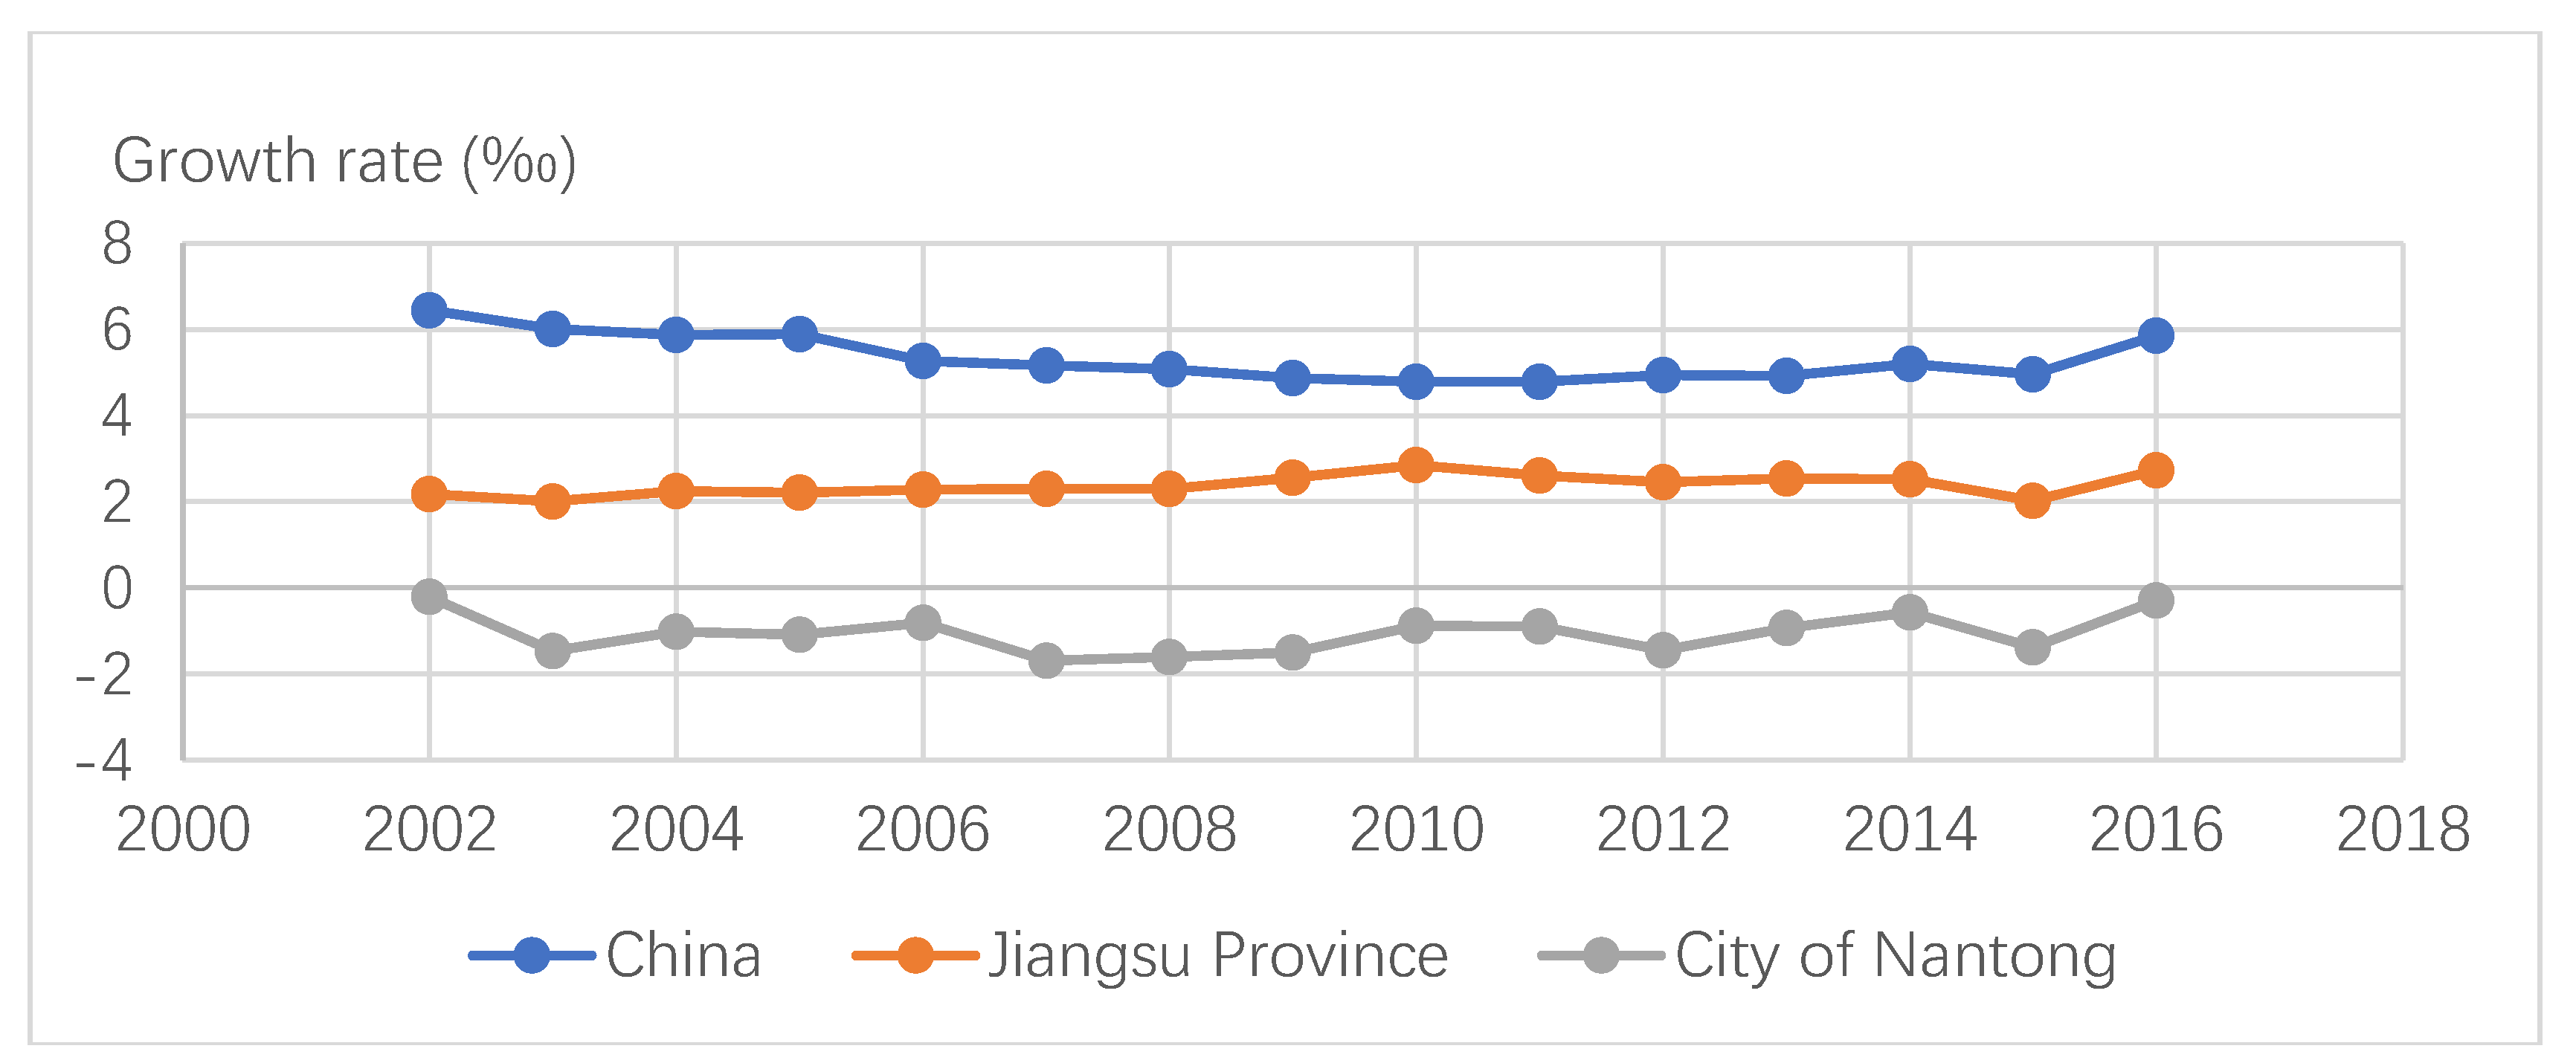
However, as projects progressed, it became clear that not all of the existing official criteria were strictly met, with the indicators of population and metro ridership frequently overestimated in order to gain the approval. Several Chinese cities with recently approved metro development proposals do not meet one or more requirements, including Nantong, even though these criteria were proposed in 2003. In the case of Nantong, according to the figures published in the local official reports and documents, only the economy-related figures successfully met the existing criteria (Table 3). In addition, both the negative trend in the natural population growth in Nantong [44] (Figure 5) and the relatively low level of bus transit ridership in 2014 [47] (Table 2) pointed to a likely low demand of the proposed metro system, and further challenged the population and ridership projections in the “Forecast Report” [47] and “Proposal Plan” [45].
Some experts we interviewed admitted that for Nantong’s metro proposal, evaluations of the population and projected ridership were certainly “soft” and “flexible”; instead, the local economic power was the major determining factor among all of the existing official criteria (China Interview: 15a0602, 15b0501, 15b0701). Due to varying definitions of what constituted the borders of the city (for example, the municipal territory, metropolitan area, main urban area, central urban area, planned urban area, etc.) and the rather blurry figures used for current and future population sizes and ridership projections when making the proposal, respondents tended to refer to the numbers as “tricky” (China Interview: 15a0602). In other words, one interviewee noted that numbers were interpreted in a rather vague manner as strict rules tended to lead to the denial of some proposals (China Interview: 15b0701).
Regarding such controversies, the Vice Mayor of Nantong explained that he regarded the metro proposal as a “proactive” plan for managing future travel and changing people’s travel preference “as early as possible”. He reasoned that once a city met the official criteria in terms of resident numbers and ridership figures, the construction of a metro would face larger costs and other challenges due to the larger population size and higher development density (China Interview: 15a0601). His justification for the metro development also resonated with the suggestion in another study of the World Bank on urban transport development, that cities should consider early investment in urban rail projects because the project implementation would be more difficult or nearly impossible if the decision was postponed until the economy developed more fully [65].
However, after being quite “proactive” in the project proposal, Nantong has been backward or prudent in its metro project implementation. After the “Proposal Plan” was approved in August 2014, the construction did not begin until December 2017. There have been several instances of unofficial websites announcing start dates, but none was realised or confirmed officially despite growing public expectation towards the metro. An article published in the Jiangsu Urban Forum (an unofficial online forum focusing on urban development in the 13 prefectural-level cities in Jiangsu that publishes news and comments about the planning and progress of urban policies and urban mega-projects in Jiangsu) commented that since Nantong had continuously invested in a number of mega-transport infrastructures (including the regional high-speed railway projects and local high-speed ring roads) over the years, the metro project might only be a symbol of urban development, and the actual construction still required some years to start [66]. Relevant officials and experts mentioned the undetermined modes of finance, operational strategies, detailed design and network pattern planning of the project, etc. to explain the reasons for the long delay before construction (China Interview: 15a0603, 15b0601, 15b0602). Therefore, the fact that the metro project requires further study in several important project aspects, despite being proposed and approved years ago, indicates an absence or insufficiency of comprehensive and credible ex-ante analysis in both the project-proposal and decision-making processes.
3.4. Urban Competition as an Invisible Driving Force
A social survey conducted by the Social Survey Centre of China Youth Daily in 2008 found that 84.5% of the 4702 respondents viewed the metro system as a key feature of modern cities and an obvious way to experience urban life. This survey covered 4702 respondents in seven Chinese cities with urban metro systems in operation or under construction in 2008, namely Beijing, Tianjin, Shanghai, Guangzhou, Nanjing, and Chongqing [67]. The public discourse echoed the relevant literature on metro development in China (see for example [68,69,70]). In our case study, the local officials also regarded the metro as a symbol of modernisation, and “this perception makes cities with and without metro projects different” (China Interview: 15a0601).
During the past decade, three other prefectural-level cities in Jiangsu Province—Wuxi (in 2008), Changzhou (in 2012), and Xuzhou (in 2013)—had been operating or been approved to develop their own metro systems. At the time that they obtained the metro development approvals, although all of these cities met the national requirement in terms of GDP to develop an urban metro project, Wuxi and Changzhou failed to meet the state’s criterion on local population. In terms of local economic power in recent years (for example, comparing the official economic data of GDP and GDP growth rate in these cities in 2016), Nantong economically performs as well as these cities (Table 4).
Cities compete in many ways [30]. Literature on policy learning and mobility suggests that policy circulation is contagious, in which “no city wants to be either the leader or the laggard” [26] (p. 205). Considering metro development as a brand of modern metropolis and a “best practice” for local growth, no city is willing to fall behind in the metro development. Regarding whether there was inter-city competition, the responses from the all of the local officials interviewed were vague (China Interview: 15a0601, 15a0602, 15a0603), yet affirmative from the experts (China Interview: 15b0501, 15b0601, 15b0602, 15b0701). There were no distinct inter-city competitions in metro proposal approvals, since the state’s approvals of one metro proposal would not cause the denial of others. However, the underlying inter-city completion would become noticeable when all other cities in the region had metros approved except Nantong, balancing out Nantong’s advantages in industry, economy, and location.
In an era of urban policy mobility [24,25,26,27,28,29] and in the context of localised urban governance towards revenue maximisation in Chinese cities [37,38], “monument complex” [4] and “unwillingness to lee” may have further motivated the initial pursuit of mega-project developments from the side of local leaders. An example was made to describe how this kind of comparison emerged: “The municipal leaders of Nantong might be asked by officials from other cities about why Nantong does not build a metro [when it has] such a high GDP?” (China Interview: 15b0602). Thus, as Wuxi, Changzhou, and Xuzhou were approved to develop their metro projects, it became more urgent for Nantong to put a proposal forward so as to avoid falling behind.
3.5. The Direct Motivation of the Rising Urban Metro Development
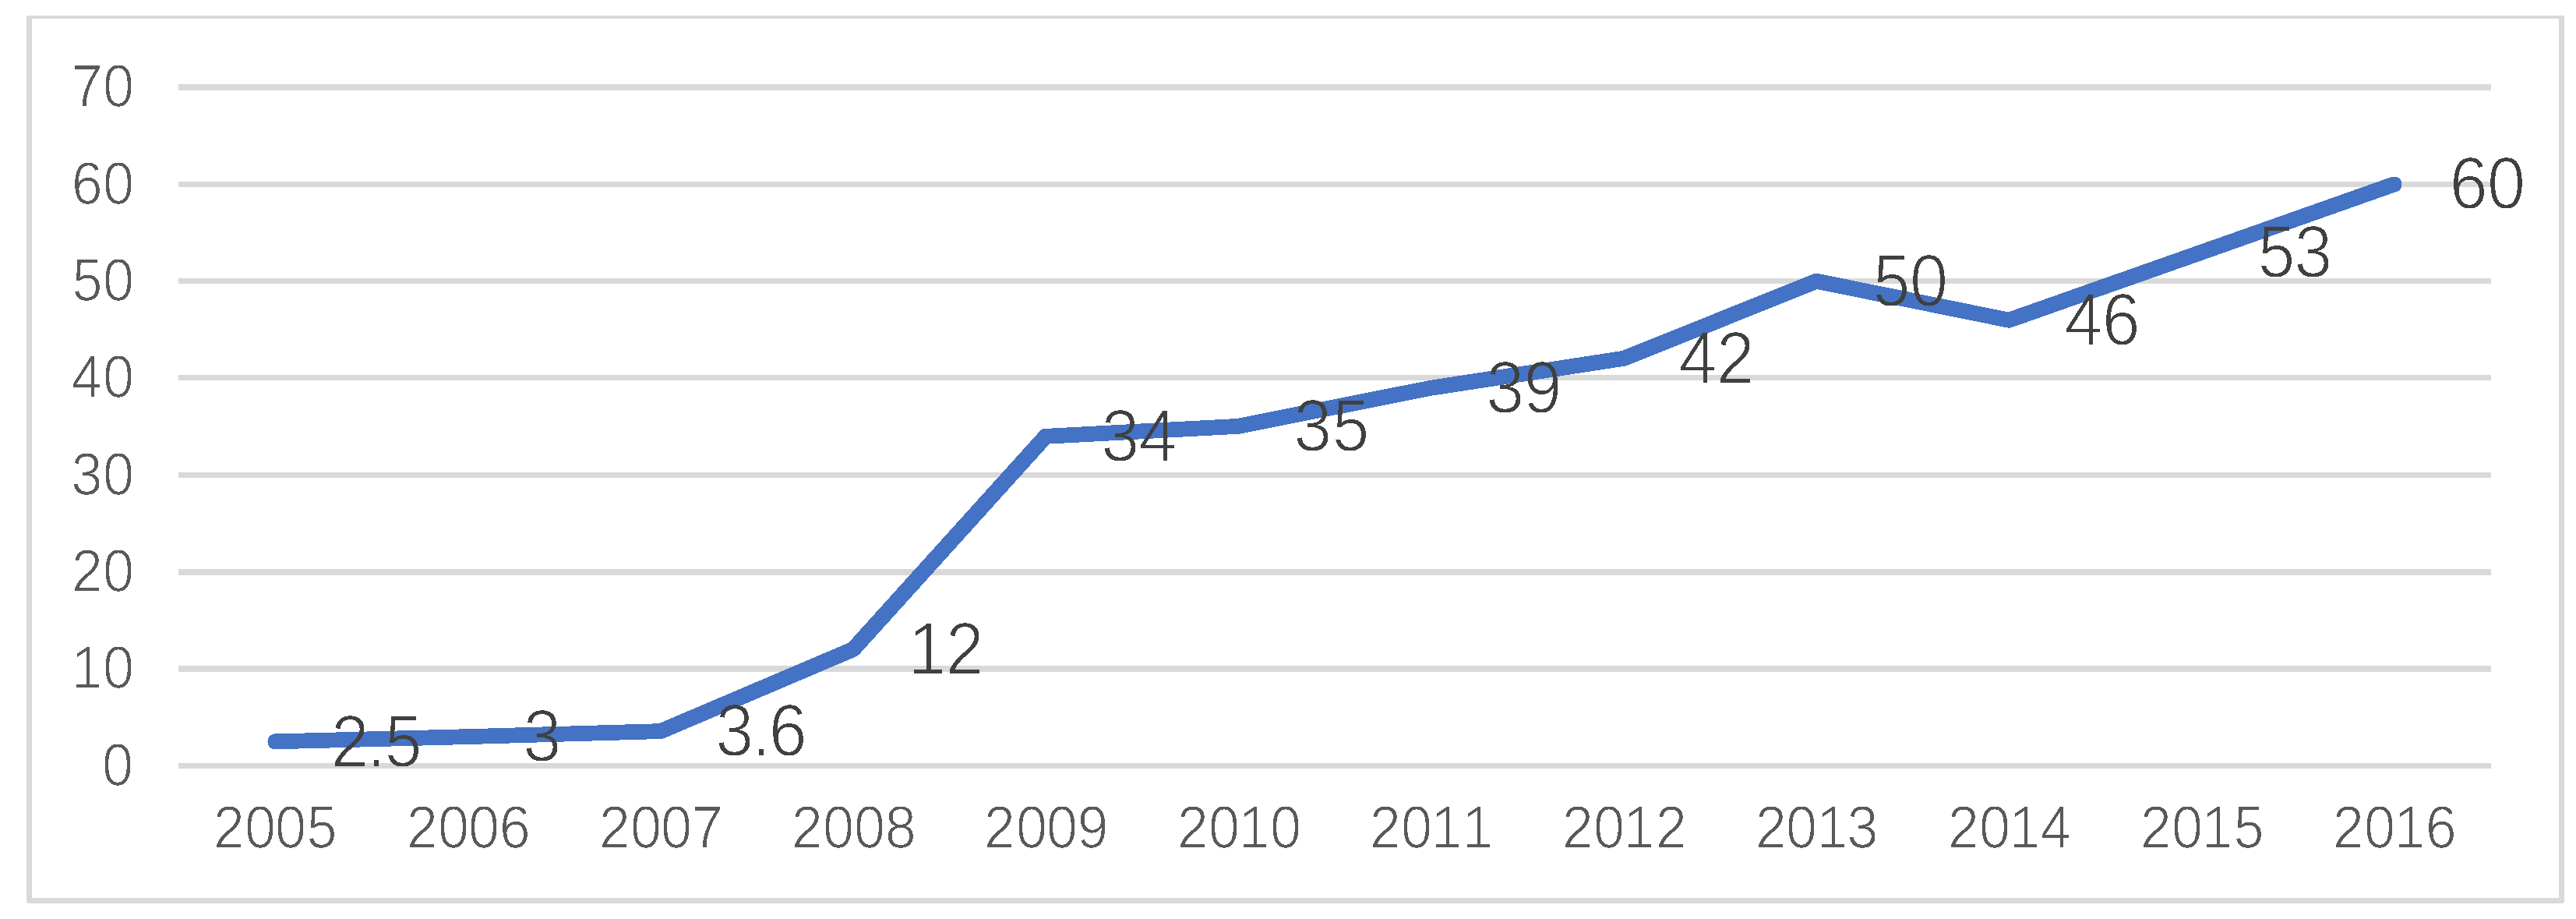
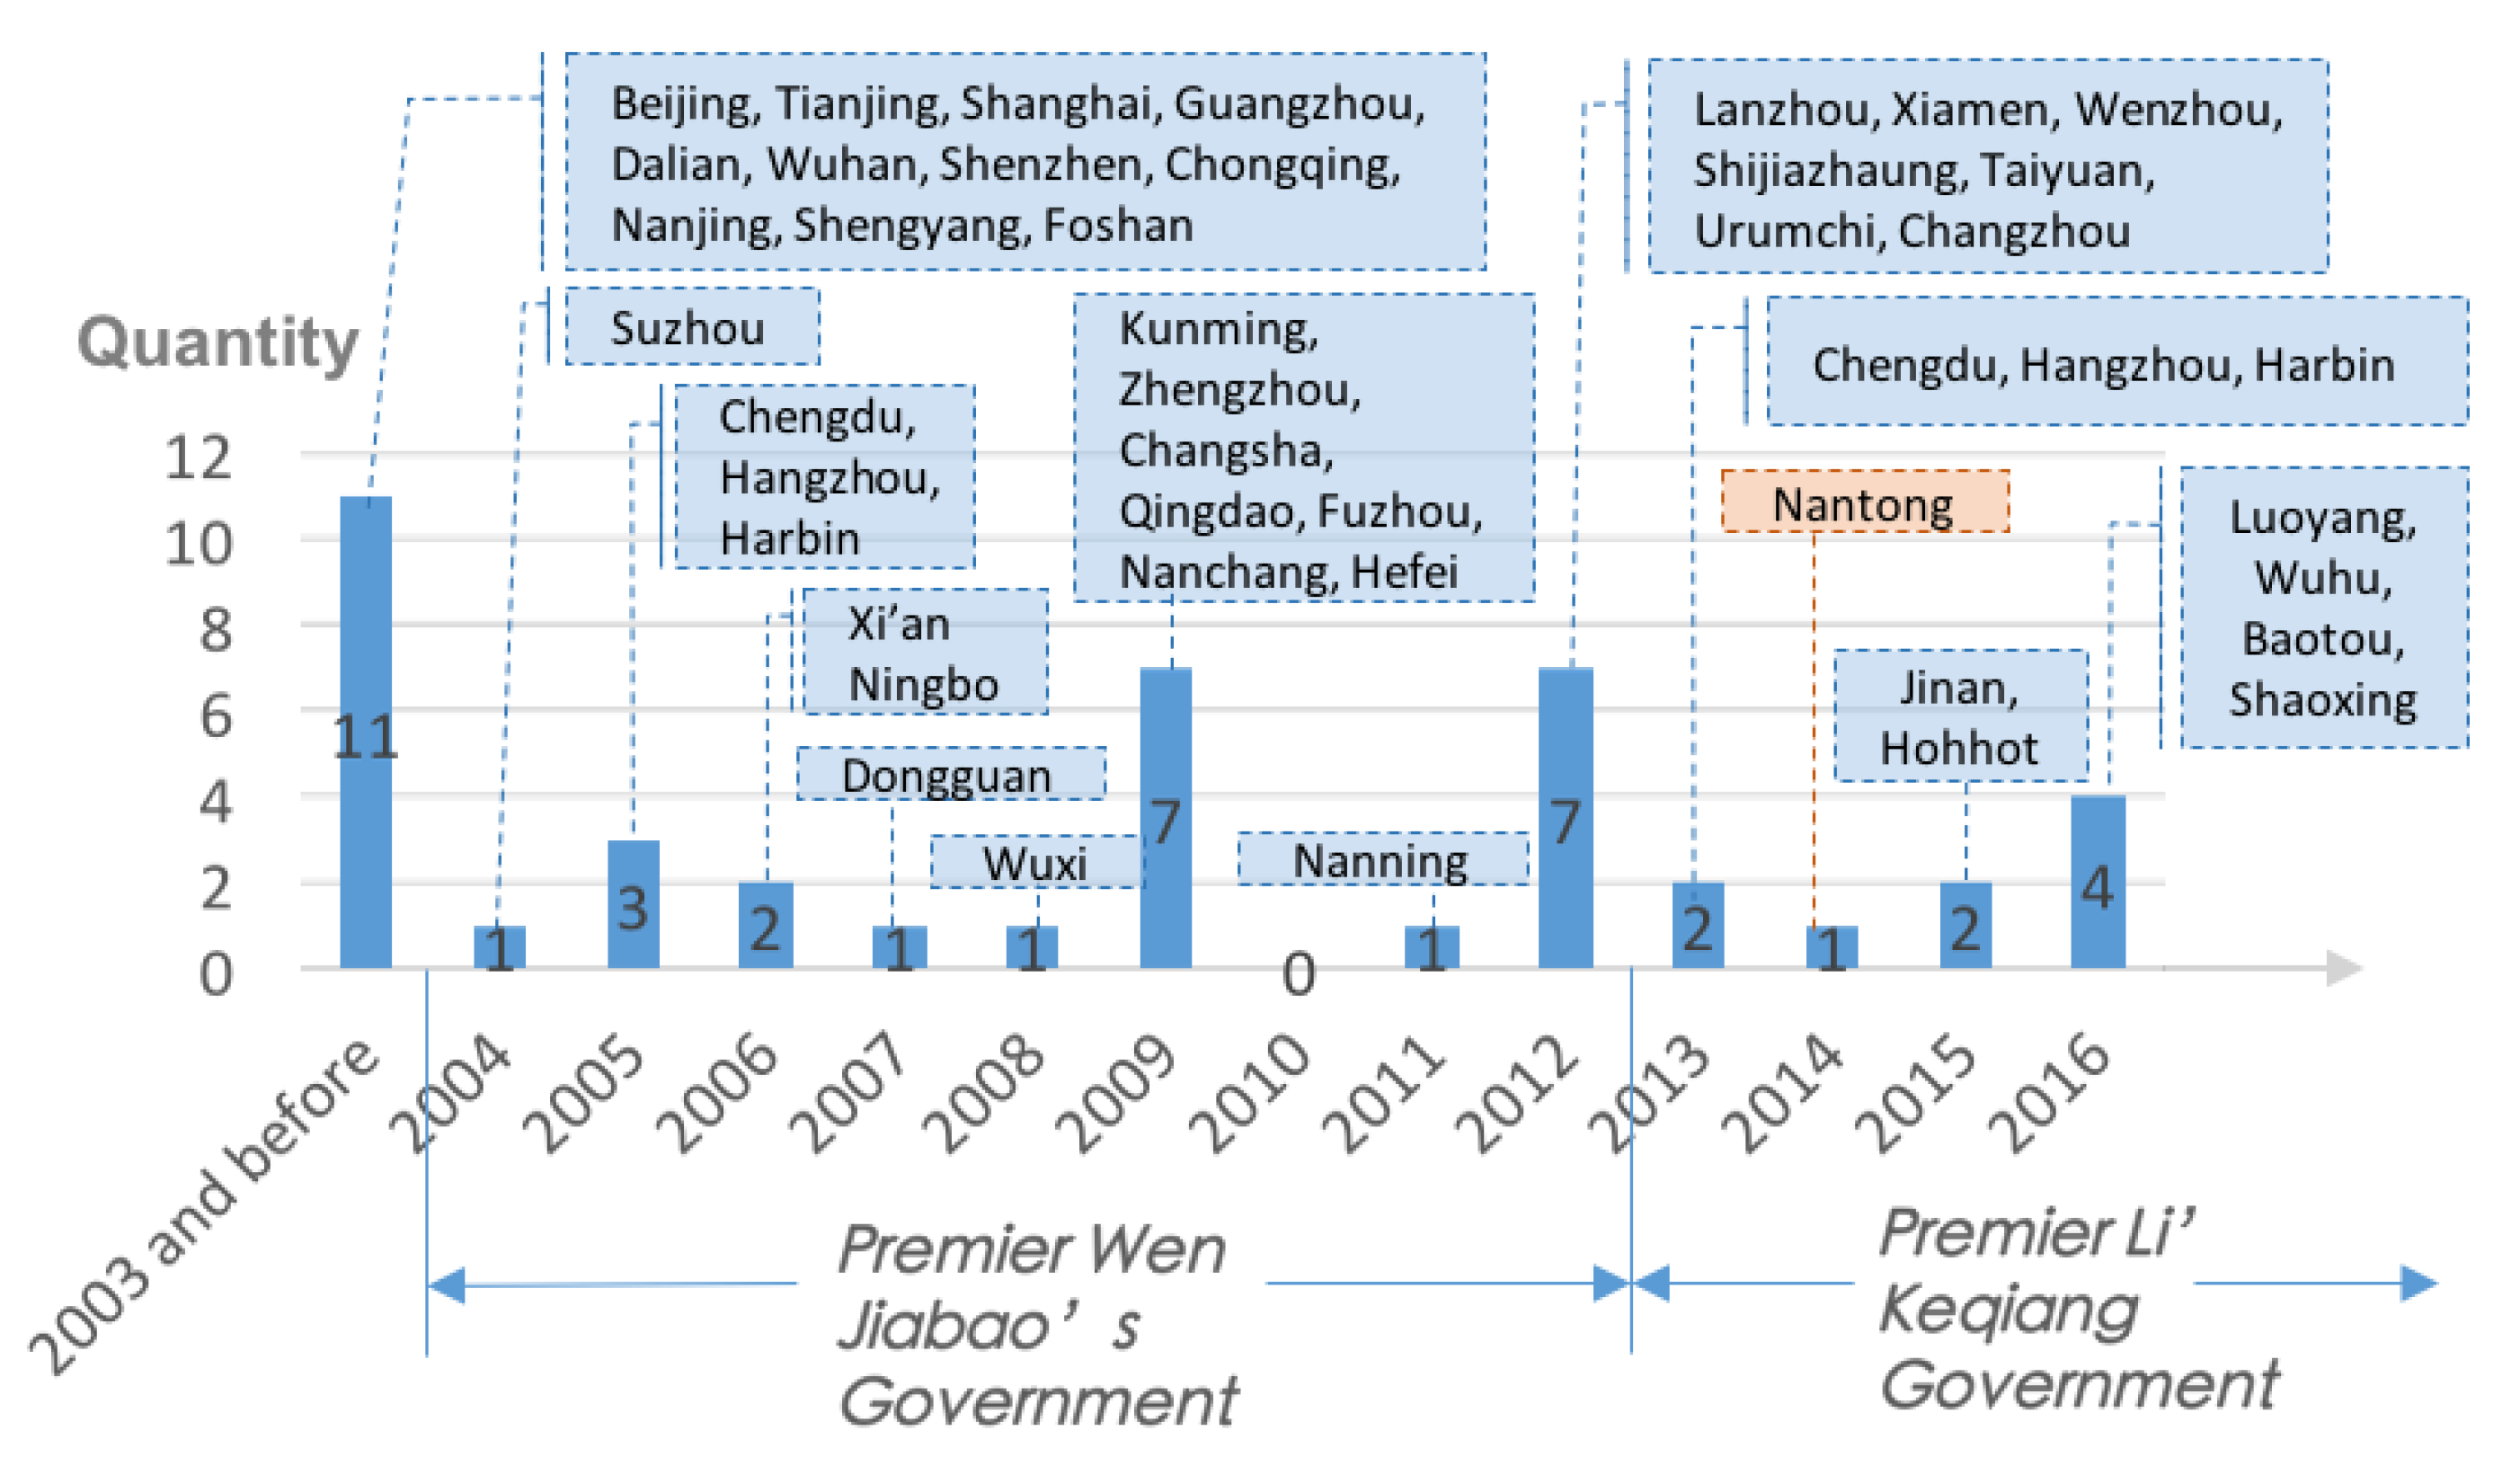
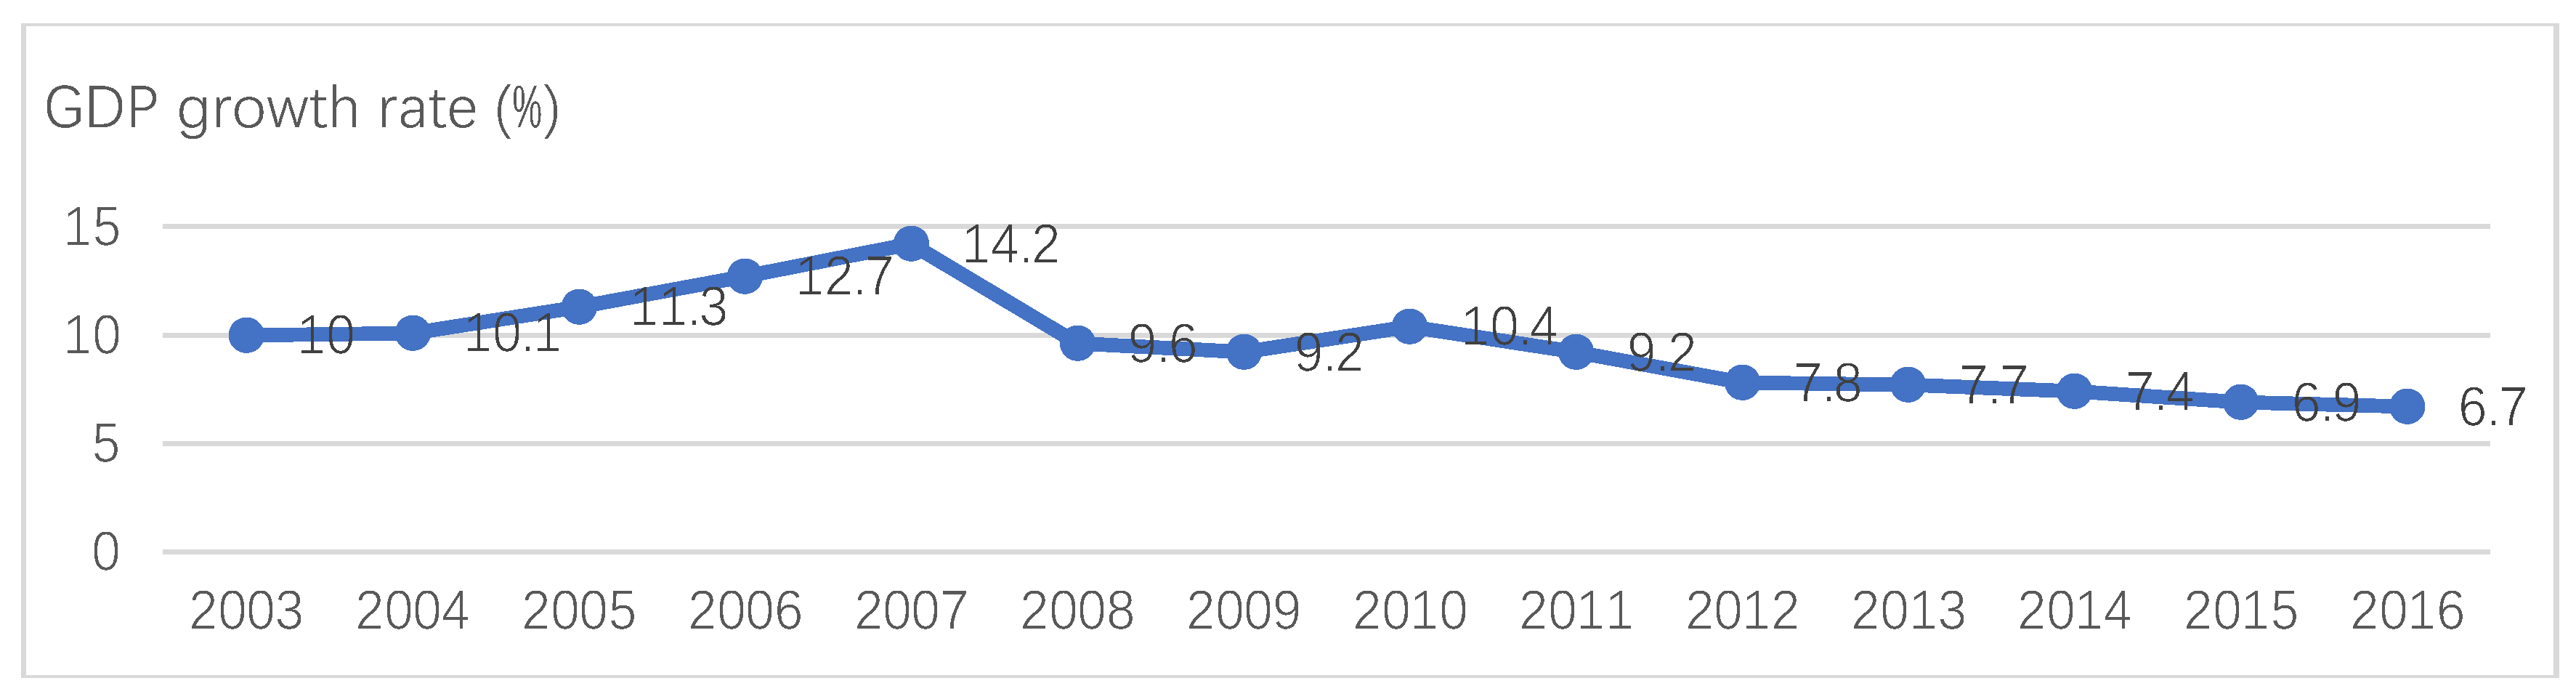
The changing macro-economic and political context was found to have direct influences on the decision-making process of mega-projects, which triggered the proposal and approval of Nantong’s metro project. Investment, consumption, and foreign trade are regarded as the three major driving forces of China’s economic growth, but domestic consumption is limited and foreign trade is largely dependent on the global economy. Facing the global financial crisis after 2008, the Premier Wen Jiabao’s government (2003–2012) was criticised for the overheated investments in mega-projects, which then led to delays in approving some of the local mega-project proposals after 2010. Then, after the political transition to the current government in 2013 (Figure 6), the state hoped to stimulate the domestic economy through investment in order to cope with the recent slowdown in the economy (China Interview: 15a0603) (Figure 7), indicating more opportunities for initiating locally financed mega-projects.
The planning experts we interviewed regarded the approval as predominantly political instead of complicated at the state level (China Interview: 15b0501, 15b0602, 15b0701). On one hand, China’s economy relies heavily on mega-infrastructure developments to generate huge amounts of jobs and opportunities in relevant industries. On the other hand, the local states finance the development and operation of urban metro projects instead of the central government. Once the city has the “resources and opportunities”, it will spare no effort to strive for favourable policies and approvals (China Interview: 15b0602). Thus, the timing of the proposal for the metro, China’s recent domestic economic slowdown, and the state’s political desire to “stabilise growth” all contributed to the final approval of Nantong’s metro proposal by the State Council and the NDRC.
4. Conclusions
In the background of the rise of mega-project developments in Chinese cities, our examination of the motivations to start urban metro projects through the review of local planning documents, relevant socioeconomic data comparisons, and in-depth interviews with elite figures—including both local decision-makers and planning experts in our case study—reveals four core themes. These can be essentially conceptualised as:
- the expected benefits that are supposedly achieved by developing urban metro systems in aspects of social, economic, and environmental improvements as well as urban developments;
- a strong local economy playing an essential role in providing the confidence to proceed with such major transport projects;
- inter-city competition as an always present invisible drive, pushing cities forward in their quest to secure funding and reputation;
- and the worsening domestic economic performance and changing political preference of Chinese government making the funding of more infrastructure projects irresistible.
Firstly, as we can see from the Nantong case, local officials, experts, and the public all indicated that they believed there would be strong, positive economic and environmental impacts that would emanate from the metro project. The metro system was justified as a way to promote TOD by alleviating road congestion, to encourage a modal shift to public transportation, and to guide the integrated development of the city centre, new sub-centres, and urban-rural fringes. All of these factors were discussed in the interviews and it is important to note that even without the required population size and ridership figures, the project promoters believed that the above benefits would overweigh costs that might be incurred. In particular, positive regional economic effects were expected in terms of land value appreciation, job creation, and the promotion of relevant industries. Within the current land finance mode of local urban development, the potential increases in government revenue by selling lands along the metro lines at higher prices in the future are also noticeable. We see that the development of such urban mega-projects often reflects entrepreneurial approaches to local urban governance that the long-term comprehensive benefits in the future are larger than the present huge investment.
Secondly, in terms of proving a local sense of confidence in embarking on a metro project, its local government finance and local economic powers are key. As an urban metro project relies heavily on local government finance, shifting the burden of failure from centre downwards, the local GDP and local fiscal budget revenue are the major supporting strengths, adding weight to the proposal and creating a strong sense of local and national confidence in the project development. Here, the amount of weight given to the economic indicators in the appraisal as opposed to the woollier statistics accepted for population and ridership can be seen as a clear evidence.
Thirdly, at the local level, it was also clear from our research that inter-city competition acted as an underlying but key driving force for desire amongst local leaders to bid for metro projects. Place-wars among cities in economic achievements, inward investments, and environment or infrastructure improvements are inevitable. Viewing metro development as an essential catalyst for increased economic growth, in which they do not want to fall behind, has made such projects more urgent for local politicians to follow.
Finally, and most importantly, the domestic political economy of transport investment has exerted direct influences on the birth of urban mega-project developments. The approval of Nantong’s metro proposal occurred when the economic growth rate continually declined in China and the government hoped to stimulate the economy by investing in mega-infrastructure projects with a relatively relaxed examination of proposals. Different from the official justifications of the project, the reasons of favourable macro-economy and political inclination directly contributed to the project proposal made by local government and approval decision-making at the state level.
The above four aspects illustrate how such urban mega-project developments were justified and motivated, and why they are so attractive to both central and local states. As an urban mega infrastructure project and an important public good, the metro proposal reflected a proactive characteristic of planning—to face higher urban density, development, and population size; to encourage a modal shift in transportation use; and to lead the future urban transformation in accordance with the local development objectives.
There are limitations in the range and design of this qualitative case study of Nantong’s metro project. Further studies on urban mega-project motivations, especially about the rise of metro developments in Chinese cities, will require more investigation into the future development of Nantong’s ongoing metro project, which includes more in-depth interviews with officials and experts from various fields, statistical analyses of more relevant socioeconomic data, and comparative analyses of other cases.
There is still a long way ahead for the development of urban mega-projects in China, as well as the deliberations for starting them. Justifications for such urban mega-projects are essential in project proposals and planning, while the local governments are required to recognise the challenges and uncertainties involved in these huge, long-term investments and development processes. Since urban metro projects in China are financed locally with national development approvals, for future project planning, proposals, and development, the local governments should be more cautious in analysing the local socioeconomic demands, predicted benefits, and potential failures rather than merely the current levels of local economic power.
Urban mega-projects are “the privileged particles of the development process” that are designated to make ambitious changes [11] (p. VII), and the rising metro developments in Chinese cities are no exception. By understanding the motivations behind mega-project investments in China, this case study contributes to the urban policy framing literature and Chinese scholarship in urban mega-project development. In the current contexts of rapid urban development, inter-city competition, and changing global and domestic economy, decision-makers at both the central and local levels ought to understand the economic-political reasons behind the idea of developing such urban mega-projects while evaluating their ambitious proposals, and strive to achieve lifecycle sustainability in such developments.
Author Contributions
S.Z. and G.Z. developed the original idea and contributed to the conceptual framework. S.Z. wrote the paper and was responsible for data collection as well as the research process and analysis. G.Z. and Y.S. provided constructive suggestions for revising and improving this paper. All authors have read and approved the submitted manuscript.
Funding
This research received no external funding
Acknowledgments
We would like to thank all of the interviewees from Nantong’s municipal government offices, the planning authority, the Urban Construction and Development Investment Group, and the railway institute for their readiness and time to share their perspectives on and experience in Nantong’s metro project. We would like to thank Dr. Nancy Holman of the London School of Economics and Miss Look Ziwei Hannah of the National University of Singapore for their help in proofreading this manuscript. We also would like to express our sincere thanks to the three anonymous reviewers for their constructive comments and suggestions on the earlier versions of this manuscript.
Conflicts of Interest
The authors declare no conflict of interest.
Appendix A

Table A1.
Investment in construction assets and transportation infrastructure in China during 2004–2016.
Table A1.
Investment in construction assets and transportation infrastructure in China during 2004–2016.
| Year | Construction Assets Investment (Billion CNY) | Transportation Infrastructure Investment (Billion CNY) |
|---|---|---|
| 2016 | 42310.72 | 5389.04 |
| 2015 | 38816.35 | 4920.00 |
| 2014 | 34978.91 | 4321.57 |
| 2013 | 29842.42 | 3679.01 |
| 2012 | 24361.75 | 3144.49 |
| 2011 | 20019.57 | 2829.17 |
| 2010 | 15558.05 | 3007.45 |
| 2009 | 13875.83 | 2497.47 |
| 2008 | 10495.89 | 1702.44 |
| 2007 | 8351.83 | 1415.40 |
| 2006 | 6677.58 | 1213.81 |
| 2005 | 5338.26 | 961.40 |
| 2004 | 4280.36 | 764.62 |
Note: the data was collected from statistical yearbooks of each year published by the National Bureau of Statistics of China.
Table A2.
Mainland Chinese cities with approval for metro systems and relevant socioeconomic data at the time of metro approval.
Table A2.
Mainland Chinese cities with approval for metro systems and relevant socioeconomic data at the time of metro approval.
| City | Time of Metro Approval | GDP (Billion CNY) | Local Government Finance (Billion CNY) | Local Total Population (Million) | Local Population in Main Urban Area (Million) | |
|---|---|---|---|---|---|---|
| 1 | Beijing 北京 | 1965 | ||||
| 2 | Tianjin 天津 | 1970 | ||||
| 3 | Shanghai 上海 | 1986 | ||||
| 4 | Guangzhou 广州 | 1993 | 71 | 6.24 | ||
| 5 | Nanjing 南京 | 1994 | ||||
| 6 | Shenzhen 深圳 | 1997 | ||||
| 7 | Wuhan 武汉 | 1999 | ||||
| 8 | Chongqing 重庆 | 2000 | 148.8 | 8.97 | 30.72 | |
| 9 | Shenyang 沈阳 | 2005 (1993) | 208.4 | 18.15 | 6.99 | 4.96 |
| 10 | Foshan 佛山 | 2005 | 238 | 5.8 | ||
| 11 | Chengdu 成都 | 2005 | 237.1 | 36.64 | 10.82 | 4.82 |
| 12 | Hangzhou 杭州 | 2005 | 294.27 | 25.05 | 6.6 | 4.1 |
| 13 | Harbin哈尔滨 | 2005 | 183.04 | 16.55 | 9.75 | 3.99 |
| 14 | Xi'an 西安 | 2006 | 145 | 8.59 | 7.53 | 5.41 |
| 15 | Suzhou 苏州 | 2007 | 570 | 54.18 | 6.24 | 2.35 |
| 16 | Dongguan 东莞 | 2007 | 315.1 | 18.65 | 1.71 | 1.71 |
| 17 | Ningbo 宁波 | 2008 | 396.41 | 39.04 | 5.68 | 2.2 |
| 18 | Wuxi 无锡 | 2008 | 441.95 | 36.54 | 4.64 | 2.37 |
| 19 | Dalian 大连 | 2009 | 441.77 | 40.02 | 6.17 | 2.2 |
| 20 | Kunming 昆明 | 2009 | 180.87 | 20.16 | 5.334 | 2.5 |
| 21 | Zhenzhou 郑州 | 2009 | 330.04 | 30.19 | 7.31 | 2.85 |
| 22 | Changsha 长沙 | 2009 | 374.48 | 24.63 | 6.52 | 2.41 |
| 23 | Qingdaoq 青岛 | 2009 | 489.03 | 37.7 | 7.63 | 2.75 |
| 24 | Fuzhou 福州 | 2009 | 252.43 | 32.54 | 6.38 | 1.87 |
| 25 | Nanchang 南昌 | 2009 | 183.75 | 11.59 | 4.97 | 2.23 |
| 26 | Hefei 合肥 | 2009 | 210.21 | 34.19 | 4.91 | 2.09 |
| 27 | Nanning 南宁 | 2011 | 221.15 | 18.63 | 7.12 | 2.73 |
| 28 | Lanzhou 兰州 | 2012 | 156.44 | 10.37 | 3.22 | 2.06 |
| 29 | Xiamen 厦门 | 2012 | 281.71 | 42.29 | 1.91 | 1.91 |
| 30 | Wenzhou 温州 | 2012 | 366.92 | 28.96 | 8.01 | 1.5 |
| 31 | Shijiazhuang 石家庄 | 2012 | 450.02 | 27.23 | 10.05 | 2.47 |
| 32 | Taiyuan 太原 | 2012 | 231.14 | 21.57 | 3.66 | 2.84 |
| 33 | Urumchi 乌鲁木齐 | 2012 | 206 | 25.2 | 2.58 | 2.52 |
| 34 | Changzhou 常州 | 2012 | 396.98 | 37.9 | 3.65 | 2.31 |
| 35 | Guiyang 贵阳 | 2013 | 208.54 | 27.72 | 3.79 | 2.28 |
| 36 | Xuzhou 徐州 | 2013 | 443.58 | 42.28 | 10.07 | 3.26 |
| 37 | Nantong 南通 | 2014 | 565.27 | 55 | 7.23 | 2.13 |
| 38 | Jinan 济南 | 2015 | 610.02 | 61.43 | 6.26 | 3.65 |
| 39 | Hohhot 呼和浩特 | 2015 | 309.05 | 24.74 | 2.39 | 1.3 |
| 40 | Wuhu 芜湖 | 2016 | 269.94 | 29.87 | 3.85 | 1.46 |
| 41 | Shaoxing绍兴 | 2016 | 471.02 | 39.03 | 4.43 | 2.18 |
| 42 | Luoyang 洛阳 | 2016 | 378.29 | 30.27 | 7.28 | 2.01 |
| 43 | Baotou 包头 | 2016 | 386.76 | 27.12 | 2.24 | 1.56 |
Note: data on the local population, GDP, and local government finance were collected from the statistical bulletin of each city from the approval year, published by local authorities. The definition of data of local government finance in Chengdu, Fuzhou, Hefei, Xiamen is different, as it contains the no-tax income. The time of metro approval for Guangzhou was defined as the starting date, and all other indicators refer to this date. The metro project of Shenyang was approved by the central government in 1993, but halted in 1995. Shenyang gained approval again in 2005.
References
- Freilich, R.H. The land-use implications of transit-oriented development: controlling the demand side of transportation congestion and urban sprawl. Urb. Lawyer 1998, 30, 547–572. [Google Scholar]
- Thomson, J.M. Great Cities and Their Traffic; Penguin Books Ltd.: Harmondsworth/Middlesex, UK, 1978; ISBN 0575021462. [Google Scholar]
- Benjamin, J.; Sirmans, G. Apartment rent: Rent control and other determinants. J. Prop. Res. 1994, 11, 27–50. [Google Scholar] [CrossRef]
- Flyvbjerg, B.; Nruzelius, N.; Rothengatter, W. Megaprojects and Risk: An Anatomy of Ambition; Cambridge University Press: Cambridge, UK, 2003. [Google Scholar]
- Zhang, H. The Socioeconomic effects of urban rail transit and influences on urban commercial pattern. Guizhou Soc. Sci. 2012, 10, 78–81. [Google Scholar] [CrossRef]
- Ahlfeldt, G.M. If we build, will they pay? Predicting property price effects of transport innovations. Environ. Plan. A 2013, 45, 1977–1994. [Google Scholar] [CrossRef] [Green Version]
- Ahlfeldt, G.M.; Moeller, K.; Wendland, N. Chicken or egg? The PVAR econometrics of transportation. J. Econ. Geogr. 2014, 15, 1169–1193. [Google Scholar] [CrossRef] [Green Version]
- Jiao, J.; Wang, J.; Jin, F.; Du, C. Understanding relationship between accessibility and economic growth: A case study from China (1990–2010). Chin. Geogr. Sci. 2016, 26, 803–816. [Google Scholar] [CrossRef]
- Altshuler, A.; Luberhoff, D. Mega-Projects: The Changing Politics of Urban Public Investment; Brookings Institute Press: Washington, DC, USA, 2003. [Google Scholar]
- Flyvbjerg, B. What you should know about mega-projects and why: An overview. Proj. Manag. J. 2014, 45.2, 6–19. [Google Scholar] [CrossRef]
- Hirschman, A.O. Development Projects Observed, Second Edition with a New Preface; Brookings Institution: Washington, DC, USA, 1995. [Google Scholar]
- Gatzlaff, D.H.; Smith, M.T. The impact of the Miami metro rail on the value of residences near station locations. L. Econ. 1993, 69, 54–66. [Google Scholar] [CrossRef]
- Gibbons, S.; Machin, S. Valuing rail access using transport innovations. J. Urb. Econ. 2004, 57, 148–169. [Google Scholar] [CrossRef]
- Qing, Z. The metro economy describes new vision of urban wealth.’ Preface. Urb. Insight 2012, 5, 1. [Google Scholar] [CrossRef]
- Shyr, O.; Andersson, D.E.; Wang, J.; Huang, T.; Liu, O. Where do home buyers pay most for relative transit accessibility? Hong Kong, Taipei and Kaohsiung compared. Urb. Stud. 2013, 50, 2553–2568. [Google Scholar] [CrossRef]
- China Research and Intelligence Co., Ltd. Research Report on Urban Tail Transit Industry, 2010–2020; Market Publishers: Beijing, China, 2015. [Google Scholar]
- Hall, P. Urban and Regional Planning, 3rd ed.; Routledge: London, UK, 1992. [Google Scholar]
- Xu, Z.; Li, Z. Metro economy, the new hotspot of economic growth in Shanghai. Shanghai Econ. Forum 2006, 6, 54–56. [Google Scholar]
- Lu, Y. Discussion on the development mode of metro economy. Econ. Outlook Bohai Sea 2013, 8, 42–43. [Google Scholar] [CrossRef]
- Yu, M. Analysis on the development of metro Economies in Changzhou. J. Harbin Finance Univ. 2014, 4, 43–48. [Google Scholar]
- Belzer, D.; Autler, G. Countering sprawl with transit-oriented development. Issues Sci. Technol. 2002, 19, 51–58. [Google Scholar] [CrossRef]
- Li, W.; Chen, J. Analysis of the TOD strategy of the metro development in Guangzhou. Trop. Geogr. 2008, 28, 363–368. [Google Scholar] [CrossRef]
- Yang, P.J. An Asian model of TOD—The planning integration and institutional tools in Singapore. In Transit-Oriented Dev.: Making It Happen.; Ashgate Publishing Ltd.: Farnham, UK, 2009; pp. 91–106. [Google Scholar]
- McCann, E.; Ward, K. (Eds.) Mobile Urbanism: Cities and Policymaking in the Global Age; University of Minnesota Press: Minneapolis, MN, USA, 2012; ISBN 0816656282. [Google Scholar]
- Cochrane, A.; Ward, K. Researching the geographies of policy mobility: Confronting the methodological challenges. Environ. Plan. A 2012, 44, 5–12. [Google Scholar] [CrossRef]
- Wood, A. Competing for knowledge: Leaders and laggards of bus rapid transit in South Africa. Urb. Forum 2015, 26, 203–221. [Google Scholar] [CrossRef]
- Guggenheim, M.; Söderström, O. (Eds.) Re-shaping Cities: How Global Mobility Transforms Architecture and Urban Form; Routledge: New York, NY, USA, 2010; ISBN 9780415492904. [Google Scholar]
- Robinson, J. The spaces of circulating knowledge: City strategies and global urban governmentality. In Mobile Urbanism: Cities and Policymaking in the Global Age; McCann, E., Ward, K., Eds.; University of Minnesota Press: Minneapolis, MN, USA, 2011; pp. 15–40. ISBN 0816656282. [Google Scholar]
- Marsden, G.; Frick, K.T.; May, A.D. How do cities approach policy innovation and policy learning? A study of 30 policies in Northern Europe and North America. Transp. Policy 2011, 18, 501–512. [Google Scholar] [CrossRef] [Green Version]
- Lever, W.F. Competition within the European urban system. Urb. Stud. 1993, 30, 935–948. [Google Scholar] [CrossRef]
- Gordon, I. Internationalisation and urban competition. Urb. Stud. 1999, 36, 1001–1016. [Google Scholar] [CrossRef]
- Turok, I. The distinctive city: Pitfalls in the pursuit of differential advantage. Environ. Plan. A 2009, 41, 13–30. [Google Scholar] [CrossRef]
- Renner, M.; Gardner, G. Global Competitiveness in the Rail and Transit Industry; Worldwatch Institute: Washington, DC, USA, 2010. [Google Scholar]
- Harvey, D. From managerialism to entrepreneurialism: The transformation of urban governance in late capitalism. Geografiska Annaler 1989, 71B, 3–17. [Google Scholar] [CrossRef]
- Hubbard, P.; Hall, T. The entrepreneurial city and the ‘New Urban Politics’. In The Entrepreneurial City: Geographies of Politics; Hall, T., Hubbard, P., Eds.; Regime and Representation; Wiley: London, UK, 1998; pp. 1–23. [Google Scholar]
- Ward, K. Entrepreneurial Urbanism, Policy Tourism, and the Making Mobile of Policies; Wiley-Blackwell: Hoboken, NJ, USA, 2017; pp. 726–737. [Google Scholar] [CrossRef]
- Wu, F. China’s changing economic governance: Administrative annexation and the reorganization of local governments in the Yangtze River Delta. Reg. Stud. 2006, 40, 3–21. [Google Scholar] [CrossRef]
- Wu, F. Planning centrality, market instruments: Governing Chinese urban transformation under state entrepreneurialism. Urb. Stud. 2017, 55, 1–17. [Google Scholar] [CrossRef]
- Deng, Y. Being Aware of the Great Leap of Urban Metro- People’s Tribune. People’s Tribune. 2011. Available online: http://paper.people.com.cn/rmlt/html/2011-09/01/content_918396.htm?div=-1 (accessed on 21 April 2017).
- Hall, P. Great Planning Disasters; Penguin Books: Harmondsworth, UK, 1980. [Google Scholar]
- Gonzalez-Navarro, M.; Turner, M.A. Subways and urban growth: Evidence from earth. In LSE Research Online Documents on Economics 66535; LSE Library: London, UK, 2016. [Google Scholar]
- National Development and Reform Commission. The Announcement of Strengthening the Development and Management of Urban Rapid Rail Transit Project, Document [2003] No.81; National Development and Reform Commission: Beijing, China, 2003. [Google Scholar]
- Ministry of Transport of the People’s Republic of China. Transportation Industry Development Statistics Bulletin 2017. Available online: http://zizhan.mot.gov.cn/zfxxgk/bnssj/zhghs/201803/t20180329_3005087.html (accessed on 1 April 2017).
- Municipal Statistic Bureau of Nantong. Statistic Yearbook of Nantong 2016; China Statistics Press: Beijing, China, 2016. [Google Scholar]
- City Council of Nantong. The Proposal Plan of Urban Rail Transit Development of Nantong 2014–2018; The Planning Authority of Nantong: Nantong, China, 2014. [Google Scholar]
- City Council of Nantong. The Masterplan of Nantong 2011–2020; The Planning Authority of Nantong: Nantong, China, 2011. [Google Scholar]
- Nanjing Urban and Transport Planning and Design Co., Ltd. The Traffic Demand Forecast Report of Urban Rail Transit Planning and Construction in Nantong; The Planning Authority of Nantong: Nantong, China, 2012. [Google Scholar]
- Municipal Statistic Bureau of Nantong. Statistical Bulletins for National Economic and Social Development 2002–2016. Available online: http://tjj.nantong.gov.cn/col/col11625/index.html (accessed on 2 April 2017).
- Municipal Statistic Bureau of Changzhou. Statistic Yearbooks of Changzhou 2012; China Statistics Press: Beijing, China, 2012. [Google Scholar]
- Municipal Statistic Bureau of Changzhou. Statistic Yearbook of Changzhou 2016; China Statistics Press: Beijing, China, 2016. [Google Scholar]
- Municipal Statistic Bureau of Nanjing. Statistic Yearbook of Nanjing 1999; China Statistics Press: Beijing, China, 1999. [Google Scholar]
- Municipal Statistic Bureau of Nanjing. Statistic Yearbook of Nanjing 2016; China Statistics Press: Beijing, China, 2016. [Google Scholar]
- Municipal Statistic Bureau of Nantong. Statistic Yearbook of Nantong 2014; China Statistics Press: Beijing, China, 2014. [Google Scholar]
- Municipal Statistic Bureau of Suzhou. Statistic Yearbook of Suzhou 2004; China Statistics Press: Beijing, China, 2004. [Google Scholar]
- Municipal Statistic Bureau of Suzhou. Statistic Yearbook of Suzhou 2016; China Statistics Press: Beijing, China, 2016. [Google Scholar]
- Municipal Statistic Bureau of Wuxi. Statistic Yearbook of Wuxi 2008; China Statistics Press: Beijing, China, 2008. [Google Scholar]
- Municipal Statistic Bureau of Wuxi. Statistic Yearbook of Wuxi 2016; China Statistics Press: Beijing, China, 2016. [Google Scholar]
- Municipal Statistic Bureau of Xuzhou. Statistic Yearbook of Xuzhou 2013; China Statistics Press: Beijing, China, 2013. [Google Scholar]
- Municipal Statistic Bureau of Xuzhou. Statistic Yearbook of Xuzhou 2016; China Statistics Press: Beijing, China, 2016. [Google Scholar]
- National Bureau of Statistics of China. National Socio-economic Statistics. 2018. Available online: http://data.stats.gov.cn/easyquery.htm?cn=C01 (accessed on 26 July 2018).
- China Daily. Nantong Ranks China’s Eighth Most Livable Cities. 2015a. Available online: http://www.chinadaily.com.cn/m/jiangsu/netda/2015-01/23/content_19388647.htm (accessed on 8 August 2015).
- China Daily. Nantong Impressions. 2015b. Available online: http://www.chinadaily.com.cn/m/jiangsu/netda/2012-07/13/content_15790962.htm (accessed on 9 August 2015).
- City Council of Nantong. Review of Transportation in Nantong (Local Government Report). Available online: http://www.nantong.gov.cn/ntsrmzf/cxjs/content/53cedbce-5690-45a3-87e8-cf7322a27714.html (accessed on 31 July 2018).
- The World Bank. World Development Report 1993. Available online: file:///C:/Users/mdpi/AppData/Local/Temp/9780195208900_fm.pdf (accessed on 16 August 2018).
- The World Bank. Study on urban transport development. Available online: file:///C:/Users/mdpi/AppData/Local/Temp/Urban_transport_development_asia-2000.pdf (accessed on 16 August 2018).
- Jiangsu Urban Forum (2015). Why the Implementation Has Not Started 1 Year after the Approval of Nantong’s Metro Proposal Plan? Available online: http://mp.weixin.qq.com/s?__biz=MjM5OTIzNDI4MQ==&mid=208141862&idx=1&sn=6add3cc5528ea7098b596d668b862fb3&key=dffc561732c22651dc079d285e2d8d6f0df15fd3b40f94e59c9f38b5d45d56359dcd8d4d9dce7678b9f9a91b42e4322f&ascene=0&uin=MjA1ODk1NzU1&devicetype=iMac+MacBookAir4%2C2+OSX+OSX+10.10.4+build(14E46)&version=11020012&pass_ticket=tW%2BpWsbJ4Az1ce%2BDs%2BvJDJrRT1IEIhHONMQ9k3XiQhs%3D (accessed on 30 June 2018).
- Chu, Q. Public survey confirmed metro system as a modernization symbol of cities. China Econ. Inf. 2008, 16, 69. [Google Scholar]
- Loo, B.P.Y.; Li, D.Y.N. Developing metro systems in the people’s republic of china: Policy and gaps. Transportation 2006, 33, 115–132. [Google Scholar] [CrossRef]
- Huang, J. Great development of rail traffic is the foundation of building a modern urban area. Beijing Obs. 2006, 3, 48–49. [Google Scholar] [CrossRef]
- Peng, P.; Liu, Y. The impact of metro development on urban modernization. Urb. Insight. 2012, 5, 24–31. [Google Scholar] [CrossRef]
- China Association of Metros. Mileage Statistics of China’s Urban Rail Transit Development 2016. Available online: http://mt.sohu.com/it/d20170325/130317609_180330.shtml (accessed on 28 March 2017).
Figure 1.
The spatial form of the main urban areas [46].
Figure 1.
The spatial form of the main urban areas [46].

Figure 2.
The map of the Urban Rail Transit Lines No. 1 (first phase) and No. 2 (first phase) in the “Proposal Plan” [45].
Figure 2.
The map of the Urban Rail Transit Lines No. 1 (first phase) and No. 2 (first phase) in the “Proposal Plan” [45].

Figure 3.
Total automobile vehicles and automobile vehicles for passengers in Nantong. Note: the data was collected from Reference [48].
Figure 3.
Total automobile vehicles and automobile vehicles for passengers in Nantong. Note: the data was collected from Reference [48].

Figure 4.
Private car ownerships per 100 urban households in Nantong (2005–2016). Note: the data was collected from Reference [48].
Figure 4.
Private car ownerships per 100 urban households in Nantong (2005–2016). Note: the data was collected from Reference [48].

Figure 5.
Comparison of the natural population growth rates of China, Jiangsu Province, and Nantong (2002–2016). Note: the data of population growth rates were collected from the Municipal Statistic Bureau of Nantong [44].
Figure 5.
Comparison of the natural population growth rates of China, Jiangsu Province, and Nantong (2002–2016). Note: the data of population growth rates were collected from the Municipal Statistic Bureau of Nantong [44].

Figure 6.
Cities approved to build urban metro systems in China each year during 2004–2016. Notes: the list of all mainland Chinese cities with approvals to build metro projects is shown in Table A2 in the Appendix.
Figure 6.
Cities approved to build urban metro systems in China each year during 2004–2016. Notes: the list of all mainland Chinese cities with approvals to build metro projects is shown in Table A2 in the Appendix.

Figure 7.
The change of the GDP growth rate in China (2003–2016). Note: data on the GDP of China during 2003 to 2016 was collected from the National Bureau of Statistics of China [60].
Figure 7.
The change of the GDP growth rate in China (2003–2016). Note: data on the GDP of China during 2003 to 2016 was collected from the National Bureau of Statistics of China [60].

Table 1.
Interviews and respondents in the interview study.
| Interview | Characterisation of Respondent(s) | Role of Respondent(s) | Main Responsibilities of Respondent(s) |
|---|---|---|---|
| No. 15a0601 | Local administrative leader | One of the Vice Mayors of Nantong municipal government | In charge of proposal making and takes part in project financing |
| No. 15a0602 | Local administrative leader | The Chief Executive of the Urban Construction and Development Investment Group | In charge of project financing and takes part in proposal making and project implementation |
| No. 15a0603 | Local administrative leader | The Director of Building and Construction Authority of Nantong (also the Secretary-General of the Government Office of Nantong) | In charge of network planning, project financing, and implementation, and takes part in ex-ante research and proposal making |
| No. 15a0501 | Expert | A division head of the Urban Rail Transit Planning and Development Department in the Planning Authority of Nantong | In charge of network planning, and takes part in ex-ante research, proposal making, and project financing |
| No. 15b0601 | Expert | The Director of the Nantong Branch of China Railway No.4 Survey and Design Institute | In charge of project implementation and takes part in ex-ante research and network planning |
| No. 15b0602 | Expert | The Manager of the Nantong Branch of China Railway No.4 Survey and Design Institute | In charge of ex-ante research, and takes part in network planning and project implementation |
| No. 15b0701 | Expert | The Chief Engineer in the Local Planning Authority of Nantong | In charge of ex-ante research and proposal making |
Notes: The main responsibilities of the respondents were recognized by respondents themselves during each interview.
Table 2.
The local traffic modal split of main urban areas of Nantong in 2014.
| Trip Mode | Walk | Bicycle | Electric Bicycle | Bus | Taxi | Motorcycle | Car | Other |
|---|---|---|---|---|---|---|---|---|
| Percentage | 16.93% | 14.80% | 42.10% | 10.35% | 1.52% | 4.33% | 8.83% | 2.34% |
Note: the data was collected from Reference [47].
Table 3.
Comparison of the existing official criteria in China and indicators in relevant local official documents in Nantong. (* In this case, the main urban areas of Nantong refer to the total area of the four urban districts of Nantong according to the local “Masterplan” (City Council, 2011)).
Table 3.
Comparison of the existing official criteria in China and indicators in relevant local official documents in Nantong. (* In this case, the main urban areas of Nantong refer to the total area of the four urban districts of Nantong according to the local “Masterplan” (City Council, 2011)).
| Reference | Local Economy | Population | One-Way Metro Ridership Projection During Peak-Time | ||
|---|---|---|---|---|---|
| Budget Revenue | Gross Domestic Product | Total Population | Main Urban Areas * | ||
| Document (2003) No. 81 [42] | 10 billion (CNY) | 100 billion CNY | 7 million | 3 million | 30 thousand trips per hour |
| Local Statistical Bulletin of Nantong [44] | 59 billion (CNY) (in 2016) | 676.8 billion (CNY) (in 2016) | 7.3 million (in 2016) | 2.3 million | Not available |
| The Forecast Report [47] | 37.4 billion (CNY) (in 2011) | 408 billion (CNY) (in 2011) | 7.29 million (in 2011) 8.7 million (by 2030) | 2.12 million (in 2011) 2.94 million (by 2030) | 23.6 thousand trips per hour (Line No. 1 by 2029); and 22 thousand trips per hour (Line No. 2 by 2030) |
| The Proposal Plan [45] | 48.6 billion (CNY) (in 2013) | 504 billion (CNY) (in 2013) | 7.29 million (in 2013) 8.7 million (by 2020) | 2.3 million (by 2030) 3.56 million (by 2050) | 23.4 thousand trips per hour (Line No. 1 by 2028); 21.6 thousand trips per hour (Line No. 2 by 2030) |
Table 4.
Comparison of major economic and population indicators for six cities being approved to develop metro projects in Jiangsu Province.
Table 4.
Comparison of major economic and population indicators for six cities being approved to develop metro projects in Jiangsu Province.
| City | Indicators | Approval of Metro Project Proposal | Current Situation (Data from 2016) | ||||||
|---|---|---|---|---|---|---|---|---|---|
| Time | Total Population (Million) | GDP (Billion CNY) | Planned Mileage (km) | Completed Mileage (km) | Total Population (Million) | GDP (Billion CNY) | GDP Growth Rate | ||
| Nanjing | 1999 | 5.37 | 93.79 | 626.28 | 232.35 | 8.270 | 1050.30 | 8% | |
| Suzhou | 2004 | 5.989 | 345.00 | 210.13 | 85.61 | 10.647 | 1547.51 | 7.5% | |
| Wuxi | 2008 | 6.107 | 446.06 | 114.46 | 55.70 | 6.529 | 921.00 | 7.5% | |
| Changzhou | 2012 | 4.687 | 396.99 | 53.54 | 0 | 4.708 | 577.39 | 8.5% | |
| Xuzhou | 2013 | 8.591 | 541.98 | 64.22 | 0 | 8.710 | 580.85 | 8.2% | |
| Nantong | 2014 | 7.298 | 565.27 | 59.55 | 0 | 7.302 | 676.82 | 9.3% | |
Notes: data on local population as well as economic power in the years when approval was gained to build a metro system and in 2016 were collected from the statistic yearbooks of Nanjing, Suzhou, Wuxi, Changzhou, Xuzhou, and Nantong, published by local authorities [49,50,51,52,53,54,55,56,57,58,59]; mileage data was collected from the Mileage Statistics of Urban Rail Transit Development of Chinese Cities 2016 [71].
© 2018 by the authors. Licensee MDPI, Basel, Switzerland. This article is an open access article distributed under the terms and conditions of the Creative Commons Attribution (CC BY) license (http://creativecommons.org/licenses/by/4.0/).
Share and Cite
MDPI and ACS Style
Zhou, S.; Zhai, G.; Shi, Y. What Drives the Rise of Metro Developments in China? Evidence from Nantong. Sustainability 2018, 10, 2931. https://doi.org/10.3390/su10082931
AMA Style
Zhou S, Zhai G, Shi Y. What Drives the Rise of Metro Developments in China? Evidence from Nantong. Sustainability. 2018; 10(8):2931. https://doi.org/10.3390/su10082931
Chicago/Turabian StyleZhou, Shutian, Guofang Zhai, and Yijun Shi. 2018. "What Drives the Rise of Metro Developments in China? Evidence from Nantong" Sustainability 10, no. 8: 2931. https://doi.org/10.3390/su10082931
Note that from the first issue of 2016, this journal uses article numbers instead of page numbers. See further details here.