Green Production Planning and Control Model with ABC under Industry 4.0 for the Paper Industry

Department of Business Administration, National Central University, Jhongli, Taoyuan 32001, Taiwan
*
Author to whom correspondence should be addressed.
Sustainability 2018, 10(8), 2932; https://doi.org/10.3390/su10082932
Submission received: 4 July 2018
/
Revised: 8 August 2018
/
Accepted: 10 August 2018
/
Published: 17 August 2018
(This article belongs to the Special Issue Modelling and Analysis of Sustainability Related Issues in New Era)
Abstract
:In the last 20 years, with the liberalization of the economy, and the trend of industrial globalization, people have gradually paid more attention to environmental protection. With the tremendous advances in information technology, enterprises facing such a severe impact on the business operations, business administrative models must be innovative and adaptable in order to survive and flourish. The paper industry is not only a highly polluting industry, but in the case of long-term overcapacity, the price of paper products is often suppressed, which lowers profitability. The purpose of this study, which is based on the production data of a paper company, is to pose a mathematical programming decision model which integrates green manufacturing technologies, activity-based costing (ABC), and the theory of constraint (TOC); this model should assist in preparing the best production plans, and achieve the optimal profitable product mix. In addition, this study also proposes that the most popular related technologies developed by Industry 4.0 be applied to production control in recent years in order to enhance production efficiency and quality. The findings of this study should contribute to the improvement of the competitiveness of the paper industry, and provide insights into the value of an integrated mathematical programming model applied for product-mix decision. At the same time, we have also applied the related technologies developed by Industry 4.0 to machine maintenance and quality control in manufacturing workshops. With its tremendous benefits, we can actively arouse the industry’s understanding of, and attention to, Industry 4.0, thereby increasing the interest in industrial 4.0-related technology investments.
1. Introduction
The development of the Internet of Things (IoT) and the Cyber-Physical System (CPS) technologies, after the new program of Industry 4.0 was launched in Germany at the Hannover Trade Fair in 2011, signified the opening of the fourth industrial revolution [1]. Since then, many manufacturing research institutes and companies around the world have studied this topic and are now emphasizing that Industry 4.0 manufacturing will involve the automated and intelligent interoperation of the exchange of information to control the production operation of the machine. With the characteristics of the Internet of Things (IoT) and the Cyber-Physical System (CPS), the related items of materials, sensors, machines, products, supply chain and customers can be interconnected to each other. Each machine can independently and autonomously exchange information and control behavior during the production process, making it possible for the product to control its own manufacturing process [2]. New IT technology has made the development of manufacturing technology undergo a new paradigm shift to the so-called Industry 4.0. Since then, the terminology of Industry 4.0 is one of the hottest manufacturing topics among the academia and industry globally. Taiwan is facing the same situation. In addition to research already started in the academia, the industry is actively involved in the use of related technologies developed by Industry 4.0 to enhance the competitiveness of enterprises.
Facing a highly competitive global market, the accuracy of product costs has become one of the major strategic issues for modern companies. Since the conventional cost accounting in product cost calculation mainly allocates the overhead cost by using the volume-related assignment basis (such as direct labor hours, machine hours, direct material cost, etc.). When the overhead comprises only a fraction of the product costs, this method has little effect on the accuracy of the product cost. However, in the present manufacturing environment, with the increasing automation and computerization of manufacturers, the overhead will increase rapidly (especially in the Industry 4.0 production environment). If conventional cost accounting is used, the product cost will be seriously distorted. In 1988, Cooper and Kaplan [3] recommended using ABC to increase the accuracy of product costs. On the other hand, product-mix design analysis is an important part of the cost allocation view of ABC. In the early days, ABC researchers seldom illustrated how to use ABC costing in the optimal product-mix. The ABC costing system had also been criticized because it did not apply to production-related decisions [4,5]. Therefore, this paper suggests a mathematical programming model to analyze product mix decisions under ABC that maximizes a firm’s profit with various constraints.
Furthermore, taking into account the increasing environmental protection awareness today, environmental protection issues will become an important key factor in supporting the sustainable development of enterprises. Some stakeholders have also begun to notice the companies’ environmental activities. For a long time, global climate warming has been worsening due to the concentration of CO2 in the atmosphere increasing by about 30% [6]. In response to this situation, the government has formulated a series of carbon reduction strategies [7,8,9]. Companies are also now treating environmental protection as an indicator of Corporate Social Responsibility (CSR) [10], emphasizing that business operations should consider not only their own operating and financial conditions, but also their impact on the natural environment and society. A major issue facing all countries in the world today is how to deal with the probable impact of carbon dioxide emission reduction on economic development [11]. Many countries have tried to adopt a “carbon tax” approach to increase the operating costs of high-energy-consuming companies to reduce carbon dioxide emissions. Sathre and Gustavsson [12] believe that environmental taxation can prove to be an innovative method that enables companies to both reduce their environmental impact and increase their economic efficiency. Therefore, this article considers the cost of carbon dioxide emissions to help the paper industry maximize their profits under the concept of environmental protection.
In light of this, the purpose of this paper is to use mathematical programming to incorporate carbon tax costs and TOC into the ABC product-mix decision model. Simultaneously, this paper plans to discuss the use of related technologies developed by Industry 4.0 in the production process control (shop floor control) to contribute to the profitability and market competitiveness of the paper industry. That is, the research question explored in this paper is how to determine product-mix to achieve the maximal profit under the various resource and carbon emission constraints by using the mathematical programming model in the production planning stage, and how to control the production and achieve the planning targets by using Industry 4.0 technologies in the production control stage. The remaining sections of this paper are as follows: the research background is described in Section 2; a green production planning decision model under ABC for the paper company is presented in Section 3; a numerical example is used to illustrate the application of the model is presented in Section 4; the shop floor control under Industry 4.0 in the paper industry is described in Section 5; the discussions and conclusions are presented in Section 6 and Section 7, respectively.
2. Research Background
2.1. Brief of Industry 4.0
In recent years, the European countries’ industries have been facing competition from developing countries and the threat of population aging. According to the Economic Policy Committee and the European Commission, the working-age population (24–60 years old) will be reduced by 16% to about 48 million [13]. In 2011, the share of industrial value in Western European countries fell by 25%. In contrast, the share of industrial value in developing countries (such as India, China, and Brazil) increased by 179% compared to 1990. Due to labor shortages and the need to shorten product development time and improve the effective use of resources, these issues have already driven the development of industrial technologies, including the Internet of Things (IoT) and the Cyber-Physical System (CPS). These are the two state-of-the-art technologies developed in the past few years. In the current factory, CPS is supported by information technology such as Manufacturing Execution System (MES), Programmable Logic Controller (PLC) and Remote Maintenance concepts. It combines various self-abilities to connect the virtual with the physical world. Therefore, the operation, monitoring, diagnosis, and troubleshooting functions of the automated production system are realized, which not only improves the level of automation, but also optimizes industrial and network efficiency and achieves the goal of smart factories.
2.2. The Application of Related Technologies Developed by Industry 4.0
Application of related technologies developed by Industry 4.0 mainly includes the following four aspects:
(1) Manufacturing aspects
In the production environment of Industry 4.0, the future factories will not only automatically connect and exchange information with manufacturing resources (such as sensors, machines, conveyors, robots, actuators, etc.), but the factories will also become conscious and smart enough to predict the current status of machines. On the other hand, the functions such as product design, production engineering, production planning, and control will be modeled as modular aspects and closely linked, which means that these functions are not only commanded by the decentralized system, but also controlled interdependently. Future factories with this mechanism are called Smart Factories [14].
(2) Business aspects
Industry 4.0 means a complete communication network, which exists among the production value chains of suppliers, companies, factories, logistics, customers, etc. It will optimize their configuration in real time according to the needs and status of relevant network departments. In addition, the reduction of costs, pollution, raw materials, and carbon dioxide emissions will bring maximum profits to the cooperative departments of all value chains [15].
(3) Products aspects
Because Industry 4.0 is embedded with sensors, identifiable components, and processors, these smart products can hold information and knowledge to measure product status and track products based on information analysis results. Moreover, a complete log of production information can be embedded into the products to help product developers achieve the optimal design, prediction, and maintenance [16].
(4) Customers aspects
Industry 4.0 allows customers to order any function and any number of products. Additionally, customers can not only change their orders at any time during the production free of charge, but also understand the product’s production information [17].
The Cyber-Physical System (CPS) is a key technology underlying Industry 4.0. It uses sensors, network technology, and computers to connect various devices, machines, and digital systems, enabling various machines to communicate and interact with each other, thereby realizing the seamless integration of the virtual and physical worlds. Many CPS-based researchers have deconstructed Industry 4.0 into five levels: Connection, Conversion, Cyber, Cognition, and configuration [18].
(1) Connection Level
The first stage in developing a CPS appliance is to acquire accurate and reliable data from the machine or its elements. Data can be directly acquired from the enterprise’s IT systems, such as ERP, MES, SCM, etc., or be measured by sensors.
(2) Conversion Level
Data analysis techniques must be used to transform raw data into useful information that brings self-awareness to the machines for use in prognostics and health management.
(3) Cyber Level
The cyber level plays the role of the Central Information hub in the CPS architecture; in order to better understand the status of each machine in the fleet, it uses specific analyses to extract additional information from the massive amount of information collected. These analyses provide the machine with the ability of self-comparison, to predict the future behavior of the machine.
(4) Cognition Level
At this level, you can gain insight into the systems being monitored and provide the right knowledge to make decisions, as you can get the available comparison information and the status of individual machines. Therefore, an expert user can make the right decision on the task priority of optimizing the maintenance process.
(5) Configuration Level
At the configuration level, due to its supervisory control function, the machine can be self-configured and self-adaptive. Therefore, the configuration level plays the role of an artificial intelligence in the network, which is considered as a future attribute of manufacturing.
This study applied the related technologies developed by Industry 4.0 to the field of production control, such as mechanical condition detection and process quality control. At the same time, various types of sensors are installed in the machine so that more accurate and reliable production data can be collected, which enhances the accuracy and immediacy of the ABC cost calculation.
2.3. Green Production and Environmental Protection in the Paper Industry
2.3.1. Green production
The deterioration of the environment is a serious threat to social development. Highly polluting products are the main source of environmental pollution in the manufacturing industry. Therefore, minimizing the impact on the environment stemming from production has become an important issue for all manufacturers [19,20]. The pursuit of green product manufacturing can reduce the burden on the environment. Green products are products that have little or no impact on human health. In general, green products may be made from recycled waste, manufactured in a more energy-efficient manner or supplied to the market with less packaging. Green products have become an important focus of environmental policy planning. The common criticism of green environmental protection is that environmental practices will increase costs and reduce the net income. However, the larger question is: How does the manufacturing industry implement green production? Boons [21] proposed the following six options for green production chain management:
- (1)
- Reduce the quantity of material used: Reduce the quantity of material needed to produce the product.
- (2)
- Search for alternative materials: Replace the original materials with alternative materials that have a less environmental impact.
- (3)
- Recycling of materials: Recycling of the materials that make up the product.
- (4)
- Search for alternative products: Replace the original product with another product that performs the same function.
- (5)
- Product Recycling: Recycling and reuse of the product after its use.
- (6)
- Eliminating excessive functions: Stop production of unused or less used product features.
2.3.2. The Paris Agreement
The Paris Agreement is a climate agreement signed by the UN’s 195 member countries on 12 December 2015 at the UN Climate Summit in 2015; hopefully, it can jointly deter global warming. Article 2 of the Paris Agreement states that, in the future, efforts will be made to control the increase in the temperature of the earth within the range of up to 2 °C in comparison with the pre-industrial age, and efforts must be made to pursue the above-mentioned harder target of increasing the warming rate to within 1.5 °C, in understanding that this will highly decrease the risk and impact of climate change [22].
Due to the growing global competition and changing consumer needs in recent years [23], increasing environmental considerations and energy shortages have made green issues a topical subject in many industries [24]. Enterprises attempt to recover renewable raw materials in order to obtain profits while simultaneously protecting the environment [25], and are devoted to the sustainable development of the environment [26]. In the production processes, energy, resource consumption, and virgin material consumption are actively reduced, thus, reducing waste output in the production processes.
The essence of environmental management is to solve ecological environmental problems during the process of business growth [27], as well as to provide enterprises with production efficiency and the efficient use of raw materials, including using smaller quantities of raw materials, recycling, reusing raw materials, and reducing the cost of waste, thereby enhancing the efficient use of raw materials and reducing wasted resources [28].
The government has considerable authority to dominate or push the industry, including making regulations and industrial plans and assisting enterprises with adequate funds and resources when implementing environmental strategies for continuous proceedings, and planning [29]. However, as various governments are stressed by limited natural resources and waste disposal, they have actively established resource recovery policies [25], and as the public continues to increase pressure on governments regarding environmental pollution, it compels governments to establish strict environmental legislation and substantial fines for environmental pollution, with the intention of reducing enterprise-induced pollution through proper environmental management [30].
2.3.3. Environmental Protection Measures in Typical Paper Industry
Some environmental protection measures in the paper industry are described as follows:
- (1)
- Purchasing various waste papers as raw material to make paper products in order to reduce environmental pollution and because it is more economical than using pulpwood.
- (2)
- Using cogeneration equipment (also known as electrothermal co-production), where the energy released from the combustion of fuel simultaneously generates electric and thermal energy, and surplus electricity and heat can be sold in order to use energy more efficiently.
- (3)
- Using contamination control equipment for pollution treatment, such as electrostatic precipitators (ESP) and flue gas desulfurization (FDG), in order to reduce solid suspended particles and SOx.
- (4)
- After coagulating the sedimentation of wastewater treatment, the resulting sludge, which contains high contents of organic substances and fertilizing ingredients, can be supplied to farmers for use as a soil amendment or for composting (high magnesium fertilizer).
- (5)
- The ash from the bottom of the boiler can be supplied for use in construction landfill, brick-making, artificial aggregate, and building materials.
2.4. Brief of the ABC (Activity-Based Costing) Method
As mentioned before, since the traditional cost accounting system allocates overhead to the product cost through the use of volume-related allocation criteria (such as direct labor hours, machine hours, direct material costs, etc.), its main disadvantage is that in the modern manufacturing environment as manufacturing processes become more automated and computerized, overhead cost will increase rapidly. If traditional cost accounting is also used, product costs will be seriously distorted. In addition, in the market environment with a low product demand and diversified products, there are many volume-unrelated production activities, such as product design, mold replacement, and handling; these differ from the volume-related measures. In other words, mass production may consume more machine hours than small production, but mass production does not necessarily spend a higher batch activity cost than small production. Therefore, in the higher overhead industries, using traditional cost accounting will overestimate or underestimate product costs. In view of this, Cooper and Kaplan [3] suggest using activity-based costing (ABC) to improve the accuracy of product costs. Research on implementing ABC exists in various industries, such as manufacturing, logistics, hotels, libraries and construction, airlines, etc., [31,32,33,34,35]. In addition, the ABC method is also applied to various fields, such as quality improvement, project management, software development, product outsourcing, environmental management, and so on [32,35,36,37,38,39,40,41].
The cost assignment of the ABC two-phase model is shown in Figure 1 [42,43,44]. ABC regards markets, channels, customers, processes, product lines, and products as the cost objects. The cost calculation of a cost object requires identifying the various activities required to complete the cost object first, and then to trace the various resources consumed by each activity. Therefore, ABC uses two-phase assignments to calculate the costs of cost objects. In the first phase, various resource costs are allocated to activity cost pools through resource drivers. Resources used by manufacturing companies may include raw materials, machinery, personnel, utilities, and energy, whose costs will be allocated to activities by using the appropriate resource drivers. Resource drivers represent the resource consumption in production activities, such as machine hours, kilowatt-hours, and square feet. In the second phase, each activity cost pool is allocated to cost objects by using appropriate different types of activity drivers, for example, the number of machine hours for machining, and time for setting up machines [31]. An activity driver is used to measure the activity consumption of the cost objects [45]. Manufacturing activities can be divided into the following categories [46]:
- Unit-level activities: performed once for each unit of product, such as processing and 100% inspection.
- Batch-level activities: performed once for each batch of products, such as installation, handling, and sampling inspection.
- Product-level activities: performed to benefit all units of a specific product, such as product design changes.
- Facility-level activities: performed to sustain manufacturing facilities, such as a factory guard.
The cost information obtained from the cost object can be used for strategic decisions related to quoting, purchasing, outsourcing, profit analysis, product-mix, and so on. In the process of product-mix decision-making, this paper considers the cost of facility activities as a fixed cost.
2.5. The Theory of Constraints (TOC)
The theory of constraints, as proposed by Dr. Eliyahu M. Goldratt in The Goal in 1984, was created as a method of continuous improvement. He believed that each enterprise body is an organic system with its own goals, and there are bound to be constraints in the system that affect the goals. The constraint theory starts from bottleneck management, and moves through the continuous removal of bottlenecks and constraints, thus improving the overall operations and achieving maximum benefits. Since TOC’s goal is achieving maximum throughput through short-term optimization procedures for managing resources and eliminating bottlenecks under given overheads and operating expenses [47], some researchers have proposed that TOC can be used for product mix decisions in short-term production [48]. Plenert [49] also believed that if TOC is used for multiple resource constraints, the resulting product mix may not be the optimal product-mix, as the determination of the product mix may lead to a bottleneck shiftiness; however, this limitation can be overcome through integer linear programming (ILP) [50].
This study constructs a mathematical programming model that establishes the optimal product mix in the short term through the flexibility of using restricted resources. The use of such restricted resources will affect the results of the ABC costing, which in turn affects the optimal product mix. For example, exceeding the limit of carbon dioxide emissions will increase the carbon tax cost; if it exceeds normal working hours, it will use overtime, which increases the direct labor time with a higher wage rate.
2.6. The Relationships between ABC, TOC, and Industry 4.0
ABC can calculate product costs more accurately, while TOC is a step-by-step improvement for bottlenecks to increase profits. In terms of product costing, as TOC is short-term, it uses restricted resources in the production process (for example, total carbon emissions limits, available labor hours and machine hours, restrictions on raw material supply, etc.), which will affect the results of ABC costing, which in turn affects the best product mix. For example, exceeding the limit of carbon dioxide emissions will increase the carbon tax cost. When production takes longer than normal working hours, it is necessary to use overtime, which increases direct labor costs due to the higher wage rate. In the case of Industry 4.0, various types of sensors can be installed in a machine, thus, more accurate and reliable Resource and Activity driver data can be collected, which improves the accuracy and immediacy of the ABC cost calculation. On the other hand, the related technologies developed by Industry 4.0 can be applied to the production control of actual production. Under the functional structure of MES, it can respond to the changes in production-related parameters and production resource constraints caused by actual production conditions, and give back information to managers to respond effectively, and adjust the production plan in time. At the same time, it can timely detect the actual situation of production, quality and machine operation, and give back to the manager to take effective improvement measures in time to achieve the planned production target [51]. For the above description, a mathematical programming model of ABC production planning and control under Industry 4.0 is shown in Figure 2.
3. Green Production Planning Decision Model under ABC for a Paper Company
3.1. A Production Process for a Typical Paper Company
The production process for a typical paper company is shown in Figure 3. The processes of paper-making are briefly described as follows:
Pulping:
The fundamental purpose of pulping is to stir the pulp, waste paper, and additives in the pulper into a mud or porridge. The pulp, waste paper, and additives are uniformly mixed in a pulp chest in appropriate mix proportions; there are different mix proportions for different product specifications.
Papermaking:
The pulp prepared in the pulping process enters the paper machine system, and the pulp fibers are hydrated with water. By water flow, the fibers are dispersed over a metal mesh, and form into longitudinal and transverse fibers to enter the paper machine, where the fibers adhere to the papermakers’ felt; most of the moisture in the fibers is removed by a water press.
Rewinding and packing:
Finally, after drying and calendering, the fibers are made into usable paper. The final step is to pack the paper products in boxes and deliver them to customers.
3.2. Assumptions
In this paper, we take the papermaking industry as an example. The product-mix decision model of the Green ABC Optimal Production Plan presents the following five assumptions:
- (1)
- The activities in the paper mill process have been classified into four level activities (unit, batch, product, and facility). The company’s ABC study team selected the appropriate resource drivers and activity drivers for the current production process.
- (2)
- The unit sales price of the product and the unit purchase price of the direct material do not change with the increase or decrease of the purchase quantity.
- (3)
- Machine capacity expansion is not considered.
- (4)
- With two shifts, the normal working time for each shift is 8 h, and can be extended by 4 h overtime with a higher wage rate to extend the direct working hours.
- (5)
- Carbon tax at different tax rates according to the level of CO2 emissions and the cost of carbon dioxide emissions are regarded as a piecewise variable cost.
3.3. Notations
This paper uses the following variables and parameters notations:
Decision variables:
Xi is the production quantity of product i, i = 1, 2, 3, ..., n;
(δ1, δ2) is an SOS1 set of 0–1 variables, where only one variable is 1;
(γ0, γ1, γ2) is an SOS2 set of non-negative variables, where at most two adjacent variables can be non-zero;
Nij is the number of batches of batch-level activity j (j ∈ B) of product i;
(λ1, λ2, λ3) is an SOS1 set of 0–1 variables, where only one variable must be non-zero;
(Φ0, Φ1, Φ2, Φ3) is an SOS2 set of non-negative variables, where at most two adjacent variables can be non-zero;
Parameters:
Pi is the unit sales price of product i;
Cm is the unit cost of the mth material, m = 1,2,3,....,s;
Aim is the demand for the mth material of product i
Ei is the process yield rate of product i;
Qm is the available quantity of the mth material;
HC1 is the total direct labor cost of HQ1;
HC2 is the total direct labor cost of HQ2;
HC3 is the total direct labor cost of HQ3;
TLH is the total hours required for direct labor;
HQ1 is the total normal available hours of direct labor;
HQ2 is the total direct labor hours after 2 h of overtime;
HQ3 is the total direct labor hours after 4 h of overtime;
LHi is the required labor hours per unit of product i;
TMC is the total costs of the machine;
Hip is the machine hours required per unit of product i in the pth process, p = 1, 2, 3, …, k;
Up is the hourly cost of the machine for the pth process;
Mp is the available machine hours of the pth process;
dj is the activity cost of each active driver for activity j;
Kij is the units number of each batch for batch-level activity j (j ∈ B) of product i;
Nij is the number of batches of batch-level activity j (j B) of product i;
Rij is the time required of the activity driver of batch-level activity j (j ∈ B) of product i;
Tj is the time restriction of the activity driver of batch-level activity j (j ∈ B);
TVOC is the total CO2 emissions;
COV1 is the carbon tax cost at COQ1;
COV2 is the carbon tax cost at COQ2;
COV3 is the carbon tax cost at COQ3;
COQ1 is the upper limit of total CO2 emissions of the first carbon tax range;
COQ2 is the upper limit of total CO2 emissions of the second carbon tax range;
COQ3 is the upper limit of total CO2 emissions of the third carbon tax range;
Vi is the CO2 emissions per unit of product i;
3.4. A Mathematical Programming for the Decision-Making Model
In this section, the general model proposed in this paper will be described, and a numerical example for illustration of how to apply this model to a real case company is presented in Section 4. A numerical example for illustration.
The optimal green product-mix decision model under ABC is depicted as follows:
Maximize Z = Total Revenue
- -
- Total Unit Activity Cost (Direct Material Cost, Direct Labor Cost, Machine Cost)
- -
- Total Batch Activity Cost (Inventory Handling Cost, Set-up Cost)
- -
- Carbon Tax Cost
- -
- Environment Regulatory Cost
3.4.1. Total Revenue
The total revenue is represented by , where Pi is the unit sales prices of products i; Xi is the number of sales of the ith product.
3.4.2. Total Direct Material Cost: Unit-Level Cost
In this paper, we assume that direct materials are purchased at a fixed price. Therefore, the direct material cost function is a linear function. Aim represents the mth material requirement of the ith product; there are 1 to n products and 1 to s raw materials. Ei represents the process yield rate of product i. The decision-maker decides the maximum resource (Qm) available for each raw material according to the actual cost information previously provided by the accounting department. The total material costs are represented by, which is associated with the constraints expressed in Equation (2). The function of material cost is shown in Figure 4.
Direct material constraints:
3.4.3. Total Direct Labor Costs: Unit-Level Cost
According to the government’s labor law, the direct labor time and direct labor cost of paper mills can be expanded at a higher wage rate through overtime or night shifts in the short term. Figure 5 shows the detailed total labor cost conditions. The normal direct working hours available are given as HQ1 and the corresponding direct labor costs are a fixed amount of HC1. Next, direct labor hours can be extended to HQ2 and HQ3 through overtime or night shifts, and the total labor costs are presented as HC2 and HC3, respectively. The total direct labor costs are expressed as [HC1 + (HC2 − HC1) γ1 +(HC3 − HC1) γ2] as in Equation (1).
Equations (3)–(8) represent the total labor hours required under the relevant constraints. The TLH indicates the total labor hours required for a papermaking mill, as shown in Equation (3). In Equations (4)–(8), (δ1, δ2) is an SOS1 set of 0–1 variables, where only one variable will be 1; δ1 = 1 and δ2 = 1 indicate that the total labor hour falls within the second range [HQ1, HQ2] and the third range [HQ2, HQ3] of labor hour, respectively, in Figure 5. (γ0, γ1, γ2) is an SOS2 set of non-negative variables, where at most two adjacent variables can be non-zero [52]. When γ0 and γ1 are non-zero, it means that the total labor hour falls within the second range [HQ1, HQ2]; when γ1 and γ2 are non-zero, it means that the total labor hour falls within the third [HQ2, HQ3]. Besides, when γ0 = 1, γ1 = 1, and γ2 = 1, it means that the data point will be B, C, and D, respectively. When δ1 = 1, δ2 = 0, γ0 = 1, and γ1 = γ2 = 0, the data point will fall within the first segment AB, where TLH ≤ HQ1, and the total direct labor cost is HC1.
For instance, if δ1 = 1, then δ2 = 0 from Equation (8); γ0 ≤ 1, γ1 ≤ 1, γ2 = 0, γ0 + γ1 = 1 from Equations (4)–(7), which means that the paper mills will need to work overtime. However, if γ0 = 1, then γ1 = γ2 = 0; this means that overtime work is not required. Furthermore, if δ1 = 0, then δ2 = 1 from Equation (8), γ0 = 0, γ1 ≤ 1, γ2 ≤ 1, and γ1 + γ2 = 1 from Equations (3)–(7), then the total required labor hour is HQ1 + (HQ2 - HQ1) γ1 + (HQ3 - HQ1) γ2, indicating that the paper mills need production overtime. The total direct labor costs are represented by [HC1 + (HC2 − HC1) γ1 + (HC3 − HC1) γ2].
Unit-level direct labor hour constraints:
TLH = HQ1 + (HQ2 − HQ1)γ1 + (HQ3 − HQ1)γ2
γ0 − δ1 ≤ 0
γ1 − δ1 − δ2 ≤ 0
γ2 − δ2 ≤ 0
γ0 + γ1 + γ2 = 1
δ1 + δ2 = 1
3.4.4. Total Machine Cost: Unit-Level Cost
In this paper, we assume that the machine cost function is a linear function, Hip represents the machine hours required per unit of product i in the pth process and there are n products and r machines. The maximum machine hours available for each machine per month are 528 h (24 h/day × 22 days/month), and regarding machine depreciation hourly as machine cost per hour for each machine. Up represents the hourly cost of the machine for the pth process. The total machine costs are represented by (), where the associated constraints are shown in Equation (9).
Machine hour constraints:
3.4.5. Batch Activity Cost Function for Inventory Handling and Setup Activities
The total batch activity costs are represented by (), where the associated constraints are shown in Equations (10) and (11).
Batch activity constraints:
3.4.6. Carbon Tax Function
Although new green production technologies can reduce carbon dioxide emissions, there are still carbon dioxide emissions from the steam supply device of the paper-making machine. Equation (12) is used to quantify CO2 emissions during the production process. It also assumes that taxation is taxed at different tax rates based on the quantity of CO2 emissions, so as to support the government’s carbon tax policy and fulfill the company’s social responsibility. In other words, as carbon dioxide emissions increase, the carbon tax will also increase. Therefore, the total cost of carbon dioxide emissions will be a piecewise linear function consisting of three different tax rates as shown in Figure 6. Carbon dioxide emissions could increase from COQ1 to COQ2 and COQ3. Therefore, the total carbon tax costs are COV1, COV2, and COV3 at COQ1, COQ2, and COQ3, respectively [53].
In Equations (13)–(18), (λ1, λ2, λ3) is an SOS1 set of 0–1 variables, where only one variable must be non-zero; (Φ0, Φ1, Φ2, Φ3) is an SOS2 set of non-negative variables, where at most two adjacent variables can be non-zero [51].
The first segment: if λ1 = 1 (λ2, λ3 = 0, from Equation (18)), then Φ0 ≤ 1; Φ1 ≤ 1; Φ2 ≤ 0; Φ3 ≤ 0; and Φ0 + Φ1 = 1 from Equations (13)–(17). Then the total CO2 emission and the total carbon tax costs of the paper-making mill are COQ1Φ1 and COV1Φ1, respectively. This expresses that (COQ1Φ1, COV1Φ1) is the linear combination of (0, 0) and (COQ1, COV1).
The second segment: if λ2 = 1 (λ1, λ3 = 0, from Equation (18)), then Φ0 ≤ 0; Φ1 ≤ 1; Φ2 ≤ 1; Φ3 ≤ 0; and Φ1 + Φ2 = 1 from Equations (13)–(17). Then the total CO2 emission and the total carbon tax costs of the paper-making mill are COQ1Φ1 + COQ2Φ2 and COV1Φ1 + COV2Φ2, respectively. This expresses that (COQ1Φ1 + COQ2Φ2, COV1Φ1 + COV2Φ2) is the linear combination of (COQ1, COV1) and (COQ2, COV2).
The third segment: if λ3 = 1 (λ1, λ2 = 0, from Equation (18)), then Φ0 ≤ 0; Φ1 ≤ 0; Φ2 ≤ 1; Φ3 ≤ 1; and Φ2 + Φ3 = 1 from Equations (13)–(17). Then the total CO2 emission and the total carbon tax costs of the paper-making mill are COQ2Φ2 + COQ3Φ3 and COV2Φ2 + COV3Φ3, respectively. This expresses that (COQ2Φ2 + COQ3Φ3, COV2Φ2 + COV3Φ3) is the linear combination of (COQ2, COV2) and (COQ3, COV3). In short, if the paper-making mill generates excessive carbon dioxide emissions, this will lead to an increase in the carbon tax rate. The total costs of carbon dioxide emissions are expressed as (COV1Φ1 + COV2Φ2 + COV3Φ3), whose associated constraints are shown as follows:
CO2 emission constraints:
TVOC = COQ1Φ1 + COQ2Φ2 + COQ3Φ3
Φ0 − λ1 ≤ 0
Φ1 − λ1 − λ2 ≤ 0
Φ2 − λ2 − λ3 ≤ 0
Φ3 − λ3 ≤ 0
Φ0 + Φ1 + Φ2 + Φ3 = 1
λ1 + λ2 + λ3 = 1
3.5. Energy Recycling
In reducing environmental pollution, the use of recycled waste paper as raw material is more economical than using pulpwood [54]. In this paper, Company P used recycled paper as a part of raw materials; to decrease costs and reduce the environmental impact, the quantity of recycled paper used will increase in the future. In addition, by using cogeneration equipment (also known as electrothermal co-production), the energy released from the combustion of fuel simultaneously generates electric and thermal energy, and surplus electricity and heat can be sold in order to use energy more efficiently.
After coagulating the sedimentation of wastewater treatment, the resulting sludge contains fibers from pulp dishing and filler from the white water dishing of paper mills. Its principal components include calcium carbonate, magnesium carbonate, and fiber, which can be used as a soil amendment after drying, and is mainly sold to farmers for composting (high magnesium fertilizer). When coal is combusted in a boiler to generate power, heavier dust particles are discharged from the bottom of the boiler, called bottom ash; it can be used for construction landfill, brick making, artificial aggregate, and building materials.
3.6. Other Sale and Production Constraints
The use of paper is very extensive and is mainly divided into the following six purposes:
- (1)
- Culture Paper: As the information transmission and cultural heritage used, it is closely related with the printing industry, for common cultural paper such as coated paper, Dowling paper, newsprint, etc.
- (2)
- Industrial paper: Used to manufacture paper boxes, cartons, paper cups that need to be processed by the operation; it is called industrial paper, common industrial paper such as Liner board, corrugating medium, Coated whiteboard, Chipboard, etc.
- (3)
- Packaging paper: Manufacturing paper bags, shopping bags of paper, such as wrapping paper, Kraft paper, etc.
- (4)
- Household paper: Paper used related to health care or home life, such as toilet paper, facial tissues, napkins, etc.
- (5)
- Information paper: In response to the rise of office automation and computer list machines, the rapid development of paper in recent years, such as plain copy paper, inkjet printing paper, thermal paper, no carbon required paper, etc.
- (6)
- Other paper: Paper made for other uses, such as rice paper, banknote paper, rust-proof paper, etc.
The case company (Company P) in this paper is a small and medium-sized company with a monthly output of about 3000 tons. Its products are mainly for the packaging market. For example, product 3 is used for the fruit protection of fruit trees to prevent sunburn and insect or bird bites. Product 2 is used for the packaging of fried foods to prevent oil leakage. In particular, product 3 is used for the packaging of department store boutiques. As the monthly demand in Taiwan is limited to 500 tons per month, there are fewer mills producing product 3, but the prices are relatively higher.
Thus, the model proposed in this paper is used to find the optimal product mix to achieve the maximum profit under the constraints of production resources, market demand, and carbon emission quota. Therefore, when these limit variables change, the optimal product mix will change accordingly. If there are market demand limits of products, we can add the constraints for the product demand’s upper limits. Similarly, if there is a minimum efficient scale of production, we can add the constraints for the products’ lower limits. This means that the model should be built based on the real situations; then we can use the model to find the useful solutions.
4. A Numerical Example for Illustration
4.1. Example Data and Optimal Decision Analysis
This article provides a numerical example to illustrate how the ABC (Activity-based Costing) is applied in a mathematical programming model to decide the optimal product-mix. The illustrative data are shown in Table 1.
Assume that Company P (case company) uses three kinds of direct materials (m = 1, 2, 3) to produce three kinds of products 1, 2 and 3 (i = 1, 2, 3). When Company P uses the ABC cost system to determine the optimal product-mix, it is required to compute the following basic activity costs: (1) unit-level activity cost: These costs include material, labor and machine costs; (2) Batch-level activity costs such as, the costs of inventory handling and machine set-up; (3) Facility-level activity costs, including plant management costs and compliance with environmental regulatory costs. Table 1 lists the relevant data for this example. The cost of compliance with environmental regulation refers to the cost of dealing with routine inspections, waste discharge and disposal, and ensuring that the production process complies with local government laws and environmental regulations. This study assumes that the cost of compliance with environmental regulatory is a fixed cost, represented as a constant $30,000 per month.
Company P has to determine the optimal quantity of products for each product based on its current capabilities. Equations (1)–(18) are the equations for the green production planning decision model in this model, which are specifically expressed as follows:
Maximize Z = Total Revenue
- -
- Total Unit Level Activity Cost (direct material cost, direct labor cost, machine cost)
- -
- Total Batch Level Activity Cost (inventory handling cost, set-up cost)
- -
- Carbon Tax Cost
- -
- Facility Level Activity Cost (plant management and environment regulatory cost)= (1700 × X1 + 1400 × X2 + 1200 × X3) − [(670 × 0.80 + 200 × 0.15 + 2500 × 0.05)/0.89 × X1 +(670 × 0.70+ 200 × 0.20 +2500 × 0.10)/0.9 × X2 + (670 × 0.65 + 200 × 0.30 + 2500 × 0.05)/0.91 × X3]− [190,080 + (253,440 − 190,080) × γ1 + (332,640 − 190,080) × γ2] − [(50 × 0.12 + 250 × 0.22 +12 × 0.13) × X1 + (50 × 0.12 + 250 × 0.18 + 12 × 0.12) × X2 + (50 × 0.12 + 250 × 0.17 + 12 × 0.11) × X3]− [(18 × 1) × N11 + (18 × 1) × N21 + (18 × 1) × N31] − [(100 × 5) × N12 + (100 × 4) × N22 + (100 × 4) × N32]− (10,000 × Φ1 + 19,000 × Φ2 + 31,000 × Φ3) − 30,000Subject to sales quantity:X1 ≤ 500Subject to direct material:
- 0.80/0.89 × X1 + 0.70/0.90 × X2 + 0.65/0.91 × X3 ≤ 2200
- 0.15/0.89 × X1 + 0.20/0.90 × X2 + 0.30/0.91 × X3 ≤ 700
- 0.05/0.89 × X1 + 0.10/0.90 × X2 + 0.05/0.91 × X3 ≤ 300
Subject to direct labor hour:- 18 × X1 + 16 × X2 + 15 × X3 − 31680 − (39600 − 31680) × γ1 − (47520 − 31680) × γ2 ≤ 0
- γ0 − δ1 ≤ 0
- γ1 − δ1 − δ2 ≤ 0
- γ2 − δ2 ≤ 0
- γ0 + γ1 + γ2 = 1
- δ1 + δ2 = 1
Subject to machine hour:- 0.12 × X1 + 0.12 × X2 + 0.12 × X3 ≤ 528
- 0.22 × X1 + 0.18 × X2 + 0.17 × X3 ≤ 528
- 0.13 × X1 + 0.12 × X2 + 0.11 × X3 ≤ 352
Subject to batch-level inventory handling:- X1 − 100 × N11 ≤ 0
- X2 − 100 × N21 ≤ 0
- X3 − 100 × N31 ≤ 0
- 1 × N11 + 1 × N21 + 1 × N31 ≤ 528
Subject to batch-level setup:- X1 − 400 × N12 ≤ 0
- X2 − 600 × N22 ≤ 0
- X3 − 600 × N32 ≤ 0
- 5 × N12 + 4 × N22 + 4 × N32 ≤ 528
Subject to VOC emission:- 1.2 × X1 + 1 × X2 + 0.9 × X3 − 2500 × Φ1 − 4000 × Φ2 − 5500 × Φ3 ≤ 0
- Φ0 − λ1 ≤ 0
- Φ1 − λ1 − λ2 ≤ 0
- Φ2 − λ2 − λ3 ≤ 0
- Φ3 − λ3 ≤ 0
- Φ0 + Φ1 + Φ2 + Φ3 = 1
- λ1 + λ2 + λ3 = 1
We use the mathematical programming decision model and LINGO 16.0 software to examine the sample data and derive an optimal solution as shown in Table 2.
According to the results of the above-mentioned production plan decision model solution, the monthly optimal product-mix of the green production plan decision is (X1, X2, X3) = (500, 1415, 910), which requires 2200 tons ( = 0.8 ÷ 0.89 × 500 + 0.7 ÷ 0.90 × 1415 + 0.65 ÷ 0.91 ×910) of the first kind of material; 698 tons (=0.15 ÷ 0.89 × 500 + 0.20 ÷ 0.90 × 1415 + 0.30 ÷ 0.91 ×910 ) of the second kind of material; 235 tons (=0.05 ÷ 0.89 × 500 + 0.10 ÷ 0.90 × 1415 + 0.05 ÷ 0.91 × 910) of the third kind of material; 45,290 (=18 × 500 + 16 × 1415 + 15 × 910) direct labor hours; 339 machine hours (=0.12 × 500 + 0.12 × 1415 + 0.12 × 910) of the first process of machinery; 520 machine hours (=0.22 × 500 + 0.18 × 1415 + 0.17 × 910) of the second process of machinery; 335 machine hours (=0.13 × 500 + 0.12 × 1415 + 0.11 × 910) of the third process of machinery, and 2834 tons (=1.2 × 500 + 1 × 1415 + 0.9 × 910) of CO2 emissions. The maximum profit (Z) is $1,154,258. This entails that the total direct labor hours are expanded to 45,290 h by adding 13,610 overtime hours, and CO2 emissions are expanded to 2834 tons; there are 343 extra CO2 emissions requiring a higher carbon tax.
4.2. Sensitivity Analysis
In recent years, the world has been suffering from PM2.5, and Taiwan is no exception. PM2.5 often reaches the red alert level in Central and Southern Taiwan in the winter. According to reports by Taiwan’s Environmental Protection Agency, one-third of Taiwan’s PM2.5 is mainly derived from industrial development. The government is planning to double the carbon tax rate in order to effectively guide Company P to reduce air pollution emissions. If so, the CO2 emission costs of Company P will increase by $72,024 (=24 × 2500 + 36 × 334) and the maximum profit will be reduced to $1,082,234. The details are shown in Table 3. Therefore, this year, Company P will blend RDF-5 with coal as a fuel for boilers to effectively reduce CO2 emissions.
In addition, Green purchase refers to purchasing products that fully consider reducing the environmental burden [55], and express a preference for the environment by purchasing products or services that can improve environmental protection [56]. Company P also attaches great importance to the use of recycled paper as a raw material. Although recycled paper with a higher quality is usually costs about 30% higher than the average purchase price, the case company is still actively developing pulping technology and plans to increase the proportion of recycled paper usage to 50% to fulfill its social responsibilities and reduce production costs. If this goal can be achieved, the monthly optimal product-mix of the green production planning decision will be changed into (X1, X2, X3) = (500, 1141, 1250), with the maximum profit increased to $ 1,519,473.
5. Shop Floor Control under Industry 4.0 in Paper Industry
5.1. Status Monitoring
Due to the innovation of production technology, the pattern of our industrial production has been transformed from labor-intensive into capital-intensive and technology-intensive. The original hand-made products have been replaced by automated production equipment. To be able to maintain a high competitiveness in the international market, it is necessary to improve the product quality and production efficiency. Toyota’s Toyota Production System (TPS), developed in the 1970s, is also synonymous with Lean Production. The TPS integrates a set of methods and tools with management concepts to completely eliminate seven forms of waste (Muda), including overproduction, excessive inventory, poor quality, unnecessary conveyance, over processing, unnecessary motion, waiting for work, and to produce profit through cost reduction. [57]. Lean Production (TPS) defines everything that does not create value as waste [58], and is widely recognized and accepted in industrial environments. It involves a rigorous integration of human manufacturing processes, continuous improvement, and a focus on value-added activities by avoiding waste [59]. However, to achieve the goal of lean production, the reliability of production equipment is an important determinant. That is, the production efficiency and product quality depend on the effective maintenance of the equipment. There is a famous statement in the factory: “maintenance is more important than repair, and repair is more important than purchase”; it fully expresses the importance of maintenance in equipment management.
To ensure the safe and stable operation of equipment, while taking into account the reliability and availability of the equipment, the early diagnosis, control, and prevention of equipment failures provide an important guarantee for the safe operation and smooth production in the factory. The implementation of equipment monitoring is based on the past usage of the equipment and the current operating conditions combined with maintenance records. It is thus possible to determine whether the equipment is abnormal, and to predict the useful life of the equipment without stopping the equipment and disassembling the selected components; therefore, equipment monitoring can maximize the economic benefits under a fully safe environment.
Under Industry 4.0, experts are establishing a machine-specific model to track the changes, regimes and health status of each machine, such as by building cyber-twins to manage various components of bearings and gearboxes. The cyber-twins can offer self-awareness and self-prediction to machines and their components. The self-awareness can provide machines with the ability to assess the operational status of individual machines, while self-prediction can help to predict the future behavior of each machine and provide proper alerts and maintenance instructions [60]. The diagram of the data and information flow in a cyber-physical system-enabled plant is shown in Figure 7.
Company P, in this paper, is using vibration diagnosis to detect paper machine bearing fault conditions. A general paper machine is 25 m in length and 8 m high; the vibration measurement process uses a dual-channel spectrum analyzer and accelerometer on the roller bearing position to select 9 measurement points for horizontal, vertical and axial vibration measurements in three directions, and the measured vibration signal transmitted to the laboratory through the 8 channel signal recorder to do a detailed analysis, in order to determine the deterioration of the bearings for preventive maintenance. Implementation results in the machine operating rate increasing by 15%, and the product non-performing rate decreasing by 20%.
5.2. Quality Control
IoT and smart manufacturing comprise the basic core of Industry 4.0. In the production process, machines and related detection components can collect and share production data in real time as the ultimate result of the production process. Produce quality can supply insights into machine status through reverse reasoning algorithms. It can also supply feedback for system management to adjust the production schedules [61]. SPC (Statistical Process Control) mainly refers to the statistical method applied to real-time quality monitoring in the production process. The product quality information in the production process is divided scientifically into random fluctuations and abnormal fluctuations. When the quality abnormality trend is significant in the production process, it will alert managers in real time to take appropriate measures to eliminate anomalies and recover the machine to its normal state of stability in order to achieve quality control [62]. The basic principles and methods of SPC were proposed by Dr. Shewhart in the 1930s. The purpose of SPC is to effectively monitor and control the quality of the products in the production process. After World War II, Japan was the first to widely promote and apply SPC in the industrial field during the period 1950–1980. As a result, Japan’s products are among the best in the world in terms of quality and productivity.
In the past, Company P used manual data collection and statistical analysis when applying the SPC method; the main shortcoming was that the processing time was too long and difficult to implement. Sensors are now used to collect data (Product quality data: Thickness, Dryness; Production parameters: Pulp concentration, Production speed, Pressure roller clearance, Vapor supply; Input data: Raw materials, working hours, machine hours, carbon emissions, overhead) and use PLC, MES and IoT for data statistics, analysis, transmission and monitoring. When the thickness of the product exceeds the control boundary, the monitoring system will transmit the abnormal information to the manager. The manager immediately adjusts the production parameters to restore the product quality to normal and avoids a large number of defective products due to delayed processing. At the same time, through the quality abnormality correction mechanism (cause analysis, propose improvement measures, implement improvement, improve quality performance: improve yield rate/reduce quality cost), we eliminate the cause of poor quality, prevent abnormal recurrences, and improve the quality performance. The schematic diagram of SPC joint correction improvement is shown in Figure 8.
In addition, in terms of the cost of the product, when the actual product cost calculated by the ABC cost system is higher than the standard cost, the ABC traceability function can be used to find the over-consumed resources, and the improvement mechanism is implemented according to the above-mentioned correction and improvement mechanism, and various improvement methods are used to improve or break through the limitations of resource bottlenecks to improve production efficiency and effectively reduce product costs.
6. Discussion
6.1. Managerial Insights for Industrial Practitioners
In addition to the accurate and complete product cost estimation, the ABC cost method can provide company managers with a clearer understanding of the resource consumption of different products and processes [63], in order that cost management and product mix can be improved, which enables optimal pricing and production decisions. In addition, timely and reliable acquisition of production-related data is an important factor in order to obtain accurate product cost estimates. Currently, due to the development of related technologies in Industry 4.0, various Sensor devices can be installed on machines, and production data can be obtained in a more timely and accurate manner [64], which improves the use efficiency of ABC and greatly reduces the cost of manually collecting production data, as conducted in the past.
However, in the process of pursuing the most profitable product mix, enterprises are often limited by their limited resources in the short-term, which affects the company’s profit target. Therefore, in the long run, enterprises must use various improvement technologies to enable the internal resources of the company to be effectively used, which can simultaneously break through the limitations of bottleneck resources and achieve the effect of improving business performance [65].
The lack of laborers and rising labor costs are the current operational difficulties faced by enterprises all over the world, which forces companies to work hard to gain production automation, as IT technology has promoted the boom of Industry 4.0 in recent years [66]. Enterprises can use industry 4.0 related technology to integrate software and hardware in production control, in order that the replenishment, manufacturing, monitoring, adjustment, and timely improvements of the production process can be automatically completed in the production environment of Industry 4.0, which significantly improves the efficiency of business operations [67].
In summary, a company manager can fully integrate the methods and technologies of ABC, TOC, and Industry 4.0 in business management. With the use of timely and accurate production cost information, a company can break through the limitations of the internal bottlenecked resources of the company through the improvement of related technologies developed by Industry 4.0. Business managers can make the right business decisions and help their company become a world-class company.
6.2. Related Issues & Future Research Directions
There are some related issues not involved in this research. These could be possible future research directions.
6.2.1. Multiple-Objective Problem
This paper only considers the production resources and carbon dioxide emission costs invested in the current production process of the paper industry and uses the product mix decision model to obtain the best product mix to achieve the single goal of maximum profit. Future research may attempt to extend these technologies to a variety of industries and different activities. This is because volume discounts, including product sales prices and material procurement costs, are placed in product mix decision models to reflect changes in real-world economic operating environments. In addition, in the face of the diversified needs of consumers, business operators need to exert their creativity to pursue current trends, but also take measures to foster product diversity and fast supplying in order to win the competitive advantage. Therefore, while planning their own profit targets, companies must also consider the multi-objective considerations of customer service levels and supplier profits [68]. This is also the direction of future research.
6.2.2. Efficiency Using DEA (Data Envelopment Analysis)
In 1978, Charnes, Cooper, and Rhodes proposed “Data Envelopment Analysis (DEA)” as a tool to measure the efficiency and productivity of decision-making units [69]. DEA is considered a relatively new “data-oriented” approach for evaluating the performance of peer decision-making units (DMUs) with multiple performance measures that convert multiple inputs into multiple outputs [70]. The single objective of this paper is to determine the product mix for the maximum profit through ABC’s accurate cost calculation according to the cost structure, price, and resource constraints of each product. Therefore, it is slightly different from the purpose of using DEA and can be listed as a direction for future research.
6.2.3. Cap-and-Trade Issue
With the rapid development of human economic activities, carbon emissions have been further aggravated. In recent decades, the global temperature has risen much faster than in previous periods; therefore, reducing carbon emissions is an important issue for the world’s governments. Many governments have developed policies to regulate carbon emissions. The European Union Emissions Trading Scheme (EU ETS), as established in 2005, actively promotes cap-and-trade regulations. Therefore, companies must make a tradeoff between spending in the carbon market and reducing carbon emissions. At the same time, the Eurobarometer survey found that nearly 50% of consumers have a preference for low-carbon products and are willing to pay higher prices to buy low-priced products [71]. Based on the above background, the impacts of cap-and-trade regulations and consumers’ preference for low-carbon products during business decision-making is the direction of future research.
In addition, governments in various countries have been seeking many policies to reduce carbon emissions, and integrated carbon taxes and carbon trading are considered to be the most effective regulatory mechanisms. The government determines the mechanism of carbon taxes and the quota allocation for carbon emissions and pursues social welfare as its biggest goal. Enterprises, on the other hand, consider the cost of carbon emissions between carbon taxes and carbon trading, and determine their output and sales volume under the goal of maximizing profits [72]. Therefore, how to use the carbon tax and carbon trading model structure to strike a balance between environmental protection and enterprise development, in order that both parties are satisfied, is also a direction for future studies.
6.2.4. The Cost of Stopping Due to Problems in Machines
The tangible losses caused by machine failure and shutdown roughly include reduced production losses and losses due to poor quality, such as remanufacturing, scrapping, customer complaints, etc. While intangible losses include credit losses, reduced safety, low employee sentiment, etc.
This shows the importance of preventive diagnosis and maintenance of machines. Therefore, this study specifically proposes the use of related technologies developed by Industry 4.0 to implement status monitoring [60] in Section 5.1, in order to reduce the machine failure rate and improve production performance. However, since the relevant sensors for production data collection have not yet been fully installed in Company P, it is difficult to calculate the cost of these actual losses in detail, which is a limitation of this study. The impact of machine downtime on production costs can be incorporated into future research models.
6.2.5. The Cost of the Periodic Maintenance of the Machines
Regarding the periodic maintenance of machines; in the past, general mechanical maintenance was performed on a regular basis through the estimated lifetime of the components according to intuitive experience. However, the service life of components, as estimated by intuition experience, is often inaccurate, and the data of the actual use time of parts is difficult to collect, which makes it difficult to conduct regular maintenance on machinery. Therefore, companies usually wait until a machine has a problem or fails to repair a fault, thus, in addition to the original maintenance costs (mainly including parts costs, labor costs, and downtime production loss), losses may also include huge quality failure costs. Now, through the development of Industry 4.0, companies can collect mechanical operating parameters through sensors, and diagnose production line equipment through the Internet of Things and big data analysis technology to reduce the chance of sudden equipment failure [73]. Generally, the estimated benefit can reduce Maintenance costs by 20–25%, eliminate unexpected downtime by 70–75%, and increase productivity by 20–25%, thus, it can be seen that the stability and normality of the production line equipment of the factory has deeply affected the competitiveness of the manufacturing industry. Therefore, this study specifically proposes the use of Industry 4.0 technology to implement status monitoring [74] in Section 5.1 to arouse the attention and interest of industry in promoting Industry 4.0. However, since the relevant sensors for mechanical operating parameters collection have not yet been fully installed in Company P, it is difficult to calculate the maintenance costs in detail, which is a limitation of this study. The cost-benefit analysis of using related technologies of Industry 4.0 for the periodic maintenance of machines is listed as the direction for future research.
6.2.6. The Application of Related Technologies Developed by Industry 4.0 in Environmental Pollution Prevention and Control
It is well known that carbon dioxide emissions and sewage discharge are the main causes of environmental pollution [75]. In the past, the Taiwan Environmental Protection Agency did not regularly assign auditors to factories to conduct the monitoring of carbon dioxide emissions and sewage discharge. However, due to insufficient manpower, the results were not significant. Now we can use sensors to sample in the environment of Industry 4.0, and then analyze and monitor the issues through the Internet of Things, big data, and cloud technology, and display the results for relevant management units in a timely manner to achieve the effects of saving manpower and real-time automatic monitoring. “The application of related technologies developed by Industry 4.0 in environmental pollution prevention and control” can be incorporated into future research.
6.2.7. The Model Validated against Real Data
Since Taiwan’s current carbon tax system is still under review by the Legislative Yuan, the case proposed by this study is based on the pre-determined carbon tax rate in its draft to try to calculate the possible impact. This is a limitation of this study. Other data, such as product prices, material prices, labor costs, and mechanical depreciation, are the actual average data from the past six months. Due to the formal implementation of the carbon tax system in Taiwan, the impacts of carbon emission costs in this research model are included in the direction of future research.
6.2.8. The Detail Diagram of Circular Economy in Paper Industry
In recent years, the circular economy (CE) has received more and more attention around the world. CE promotes the use of closed-loop production models within the economy. Its purpose is to improve resource utilization efficiency, especially focussing on the recycling of industrial waste, to achieve a better balance and harmony between the economy, the environment and society [76]. Figure 3 presented in this study is the main process of the ABC cost calculation in the paper industry. In the future, the concept of a circular economy will be used to incorporate the cost-benefit analysis of energy improvement and waste recycling into the future research scope. Figure 9 shows a detailed diagram of the circular economy in the paper industry.
6.2.9. The Application of Related Technologies Developed by Industry 4.0
Industry 4.0 has become a hot topic in recent years, as it can be applied to various industries [66]. This study briefly introduces the role that Industry 4.0 can play in data collection and production control, thereby arousing the attention of Taiwanese industries to understand and apply related technologies developed by Industry 4.0, which is in its infancy in the paper industry. This study, adds “What Industry 4.0 can do for the paper industry” as a topic for future research.
7. Conclusions
As economic environments are changing rapidly, the prices of products and raw materials are volatile. In addition, as the government’s environmental laws and regulations have become more rigorous, the awareness of social responsibility has gradually increased, and these factors affect company costs and profits. Therefore, from the point of view of the enterprise, how to establish a suitable mathematical programming model for a production planning mechanism to deal with changes in business environments, and provide timely access to the optimal product-mix to obtain the highest profit are the most anticipated issues for managers.
The purpose of this paper is mainly to integrate the TOC constraints (such as direct labor constraints, available machine constraints, and direct material supply constraints) under the ABC costing system, and integrate piecewise linear functions to estimate direct labor costs and carbon dioxide emission costs. A mathematical programming model was developed and used to prepare a production plan with the optimal green product mix. An illustrative numerical example was used to illustrate the application of the model. This model allows companies to make timely production decisions for the optimal production mix, as based on the changes in the production environment and constraints (e.g., fluctuations in supply and price of production resources, changes in product market demand, adjustments to environmental regulations, etc.). This is the primary contribution of this research. In addition, this paper proposes the use of Industry 4.0-related technologies for the paper industry; for example, Industry 4.0 can be used in shop floor processes to monitor machine status and quality control. Its benefits actively cause the business community to understand and consider Industry 4.0, which promotes interest in Industry 4.0-related technology investments.
In the literature, there are some related research articles. For example, Tsai et al. (2012) used the mathematical programming model to make the best decisions for green production capacity expansion in for food industry [77], and Tsai et al. (2013) used the ABC method to accurately calculate environmental costs and proposed the production decision model math by using mathematical programming for the automotive industry [78]. Recher et al. [79] also used the ABC method to develop the Activity-based Emission (ABE) Analysis approach for measuring the carbon footprint of business processes. This research extended these research articles and Industry 4.0 to propose a green production and planning approach for the paper industry.
The research model of this study fully demonstrates the relationship between ABC, TOC, and Industry 4.0 in Section 2.6; while Section 6.1 details its management implications, which can be used as an important reference model for companies to improve their cost structure. This is the most important value of this research. Therefore, when enterprises use this model to measure their resource costs, carbon emission costs, and related resource constraints currently used, if the enterprise cannot obtain the profit it deserves, it means that their manufacturing costs are too high. At this time, the function of ABC’s resources tracing can be used to identify costly resources and inefficient processes or activities (including CO2 emissions), and then, improve them by various improvement methods (including Industry 4.0 related technologies), thus, gradually optimizing the optimal product mix, and finally, achieving the goal of obtaining the most profit.
Author Contributions
W.-H.T. provided the research idea, the research purpose, and designed the research; S.-Y.L. collected and analyzed the data and wrote the paper; W.-H.T. provided the research method, supervised, corrected, and revised this paper. All authors have read and approved the final manuscript.
Funding
This research was funded by the Ministry of Science and Technology of Taiwan under Grant No. MOST106-2410-H-008-020-MY3.
Acknowledgments
The authors are extremely grateful to the sustainability journal editorial team and reviewers who provided valuable comments for improving the quality of this article. The authors also would like to thank the Ministry of Science and Technology of Taiwan for financial support of this research under Grant No. MOST106-2410-H-008-020-MY3.
Conflicts of Interest
The authors declare no conflict of interest.
References
- Lee, J. Industry 4.0 in Big Data Environment. German Harting Magazine, January 2014; 8–10. [Google Scholar]
- Lasi, H.; Fettke, P.; Kemper, H.G.; Feld, T.; Hoffmann, M. Industry 4.0. Bus. Inf. Syst. Eng. 2014, 6, 239–242. [Google Scholar] [CrossRef]
- Cooper, R.; Kaplan, R.S. Measure costs right: Make the right decision. Harv. Bus. Rev. 1988, 66, 96–103. [Google Scholar]
- Kee, R.; Schmidt, C. A comparative analysis of utilizing activity-based costing and the theory of constraints for making product-mix decisions. Int. J. Prod. Econ. 2000, 63, 1–17. [Google Scholar] [CrossRef]
- Spoede, C.; Henke, E.; Umble, M. Using activity analysis to locate profitability drivers: ABC can support a theory of constraints management process. Manag. Account. 1994, 75, 43–48. [Google Scholar]
- Kugele, A.; Jelinek, F.; Gaffal, R. Aircraft Particulate Matter Emission Estimation through All Phases of Flight; EEC/SEE/2005/0014; Eurocontrol Experimental Centre: Les Bordes, France, 2005. [Google Scholar]
- Mayor, K.; Tol, R.S.J. The impact of the EU-US Open Skies agreement on international travel and carbon dioxide emissions. J. Air Transp. Manag. 2008, 14, 1–7. [Google Scholar] [CrossRef]
- Upham, P. A comparison of sustainability theory with UK and European airports policy and practice. J. Environ. Manag. 2001, 63, 237–248. [Google Scholar] [CrossRef] [PubMed]
- Upham, P.; Raper, D.; Thomas, C.; McLellan, M.; Lever, M.; Lieuwen, A. Environmental capacity and European air transport: Stakeholder opinion and implications for modeling. J. Air Transp. Manag. 2004, 10, 199–205. [Google Scholar] [CrossRef]
- Tsai, W.-H.; Shen, Y.-S.; Lee, P.-L.; Chen, H.-C.; Kuo, L.; Huang, C.-C. Integrating information about the cost of carbon through activity-based costing. J. Clean. Prod. 2012, 36, 102–111. [Google Scholar] [CrossRef]
- Tonn, B. An equity first, risk-based framework for managing global climate change. Glob. Environ. Chang. 2003, 13, 295–306. [Google Scholar] [CrossRef]
- Sathre, R.; Gustavsson, L. Effects of energy and carbon taxes on building material competitiveness. Energy Build. 2007, 39, 488–494. [Google Scholar] [CrossRef]
- Hewitt, P.S. Depopulation and ageing in Europe and Japan the hazardous transition to a labor shortage economy. Int. Polit. Ges. 2002, 1, 111–120. [Google Scholar]
- Lucke, D.; Constantinescu, C.; Westkämper, E. Smart Factory—A Step towards the Next Generation of Manufacturing. In Manufacturing Systems and Technologies for the New Frontier; Mitsuishi, M., Ueda, K., Kimura, F., Eds.; Springer: London, UK, 2008; pp. 115–118. [Google Scholar]
- Kagermann, H.; Helbig, J.; Hellinger, A.; Wahlster, W. Recommendations for Implementing the Strategic Initiative INDUSTRIE 4.0: Securing the Future of German Manufacturing Industry; Final Report of the Industrie 4.0 Working Group; Forschungsunion: Frankfurt, Germany, 2013. [Google Scholar]
- Abramovici, M.; Stark, R. (Eds.) Smart Product Engineering. In Proceedings of the 23rd CIRP Design Conference, Bochum, Germany, 11–13 March 2013. [Google Scholar]
- Schlechtendahl, J.; Keinert, M.; Kretschmer, F.; Lechler, A.; Verl, A. Making existing production systems Industry 4.0-ready. Prod. Eng. Res. Dev. 2015, 9, 143–148. [Google Scholar] [CrossRef]
- Lee, J.; Bagheri, B.; Kao, H.A. A Cyber-Physical Systems architecture for Industry 4.0-based manufacturing systems. Manuf. Lett. 2015, 3, 18–23. [Google Scholar] [CrossRef]
- Sheng, P.; Srinivasan, M.; Kobayashi, S. Multi-objective process planning in environmentally conscious manufacturing: A feature-based approach. CIRP Ann. Manuf. Technol. 1995, 44, 433–437. [Google Scholar] [CrossRef]
- Zust, R.; Caduff, G. Live-cycle modeling as an instrument for life-cycle engineering. CIRP Ann. Manuf. Technol. 1997, 46, 351–354. [Google Scholar] [CrossRef]
- Boons, F. Greening products: A framework for product chain management. J. Clean. Prod. 2002, 10, 495–505. [Google Scholar] [CrossRef]
- UNFCC (United Nations Framework on Climate Change). Adoption of the Paris Agreement. In the Report of the Conference of the Parties on its twenty-first session (held in Paris from 30 November to 13 December 2015), Addendum, Report No. FCCC/CP/2015/10/Add.1. United Nations, 29 January 2016. Available online: http://unfccc.int/resource/docs/2015/cop21/eng/10a01.pdf (accessed on 19 August 2016).
- Lee, C.H.; Huang, S.Y.; Barnes, F.B.; Kao, L. Business performance and customer relationship management: The effect of IT. Organisational contingency and business process on Taiwanese manufacturers. Total Qual. Manag. Bus. Excell. 2010, 21, 43–65. [Google Scholar] [CrossRef]
- Tsai, W.-H.; Yang, C.-H.; Chang, J.-C.; Lee, H.-L. An activity-based costing decision model for life cycle assessment in green building projects. Eur. J. Oper. Res. 2014, 238, 607–619. [Google Scholar] [CrossRef]
- Georgiadis, P.; Vlachos, D. The effect of environmental parameters on product recovery. Eur. J. Oper. Res. 2004, 157, 449–464. [Google Scholar] [CrossRef]
- Chen, W.Y.; Jim, C.Y. Resident valuation and expectation of the urban greening project in Zhuhai, China. J. Environ. Plan. Manag. 2011, 54, 851–869. [Google Scholar] [CrossRef]
- Bansal, P.; Roth, K. Why companies go green: A model of ecological responsiveness. Acad. Manag. J. 2000, 43, 717–736. [Google Scholar]
- Majumdar, S.K.; Marcus, A.A. Rules versus discretion: The productivity consequences of flexible regulation. Acad. Manag. J. 2001, 44, 170–179. [Google Scholar]
- Liu, L.; Ma, X. Technology-based industrial environmental management: A case study of electroplating in Shenzhen, China. J. Clean. Prod. 2010, 18, 1731–1739. [Google Scholar] [CrossRef]
- Christmann, P. Effects of “best practices” of environmental management on cost advantage: The role of complementary assets. Acad. Manag. J. 2000, 43, 663–680. [Google Scholar]
- Tsai, W.-H. Activity-based costing model for joint products. Comput. Ind. Eng. 1996, 31, 725–729. [Google Scholar] [CrossRef]
- Tsai, W.-H.; Hsu, J.-L.; Chen, C.-H. Integrating activity-based costing and revenue management approaches to analyse the remanufacturing outsourcing decision with qualitative factors. Int. J. Revenue Manag. 2007, 1, 367–387. [Google Scholar] [CrossRef]
- Tsai, W.-H.; Kuo, L. Operating costs and capacity in the airline industry. J. Air Transp. Manag. 2004, 10, 269–275. [Google Scholar] [CrossRef]
- Tsai, W.-H.; Hsu, J.-L. Corporation social responsibility programs choice and costs assessment in the airline industry: A hybrid model. J. Air Transp. Manag. 2008, 14, 188–196. [Google Scholar] [CrossRef]
- Kim, Y.-W.; Ballard, G. Activity-based costing and its application to lean construction. In Proceedings of the 9th Annual Conference of the International Group for Lean Construction, Singapore, 6–8 August 2001. [Google Scholar]
- Tsai, W.-H. Quality cost measurement under activity based costing. Int. J. Qual. Reliab. Manag. 1998, 15, 719–752. [Google Scholar] [CrossRef]
- Roztocki, N. Using the integrated activity-based costing and economic value added information system for project management. In Proceedings of the Seventh Americas Conference on Information Systems, Boston, MA, USA, 2–5 August 2001; pp. 1454–1460. [Google Scholar]
- Fichman, R.G.; Kemerer, C.F. Activity-based costing for component-based software development. Inf. Technol. Manag. 2002, 3, 137–160. [Google Scholar] [CrossRef]
- Tsai, W.-H.; Lai, C.-W. Outsourcing or capacity expansions: Application of activity-based costing model on joint product decisions. Comput. Oper. Res. 2007, 34, 3666–3681. [Google Scholar] [CrossRef]
- Tsai, W.-H.; Hung, S.-J. Treatment and recycling system optimisation with activity based costing in WEEE reverse logistics management: An environmental supply chain perspective. Int. J. Prod. Res. 2009, 47, 5391–5420. [Google Scholar] [CrossRef]
- Tsai, W.-H.; Hung, S.-J. A fuzzy goal programming approach for green supply chain optimisation under activity-based costing and performance evaluation with a value chain structure. Int. J. Prod. Res. 2009, 47, 4991–5017. [Google Scholar] [CrossRef]
- Tsai, W.-H. A technical note on using work sampling to estimate the effort on activities under activity-based costing. Int. J. Prod. Econ. 1996, 43, 11–16. [Google Scholar] [CrossRef]
- Turney, P.B.B. Common Cents—The ABC Performance Breakthrough, How to Succeed with Activity-Based Costing; Cost Technology: Hillsboro, OR, USA, 1992. [Google Scholar]
- Turney, P.B.B. What an activity-based cost model looks like. J. Cost Manag. 1992, 5, 54–60. [Google Scholar]
- Turney, P.B.B. Common Cents: How to Succeed with Activity-Based Costing and Activity-Based Management, 2nd ed.; McGraw-Hill: New York, NY, USA, 2005. [Google Scholar]
- Cooper, R. Cost classification in unit-based and activity-based manufacturing cost systems. J. Cost Manag. 1990, 4, 4–14. [Google Scholar]
- Holmen, J.S. ABC vs. TOC: It’s a Matter of Time. Manag. Account. Montvale 1995, 76, 37–40. [Google Scholar]
- Noreen, E.; Smith, D.; Mackey, J.T. The Theory of Constraints and Its Implications for Management Accounting; North River Press: Great Barrington, MA, USA, 1995. [Google Scholar]
- Plenert, G. Optimizing theory of constraints when multiple constrained resources exist. Eur. J. Oper. Res. 1993, 70, 126–133. [Google Scholar] [CrossRef]
- Luebbe, R.; Finch, B. Theory of constraints and linear programming. Int. J. Prod. Res. 1992, 30, 1471–1478. [Google Scholar] [CrossRef]
- Kletti, J. (Ed.) Manufacturing Execution System-MES; Springer: New York, NY, USA, 2007. [Google Scholar]
- Williams, H.P. Model Building in Mathematical Programming, 2nd ed.; Wiley: New York, NY, USA, 1985; pp. 173–177. [Google Scholar]
- Tsai, W.-H.; Lin, S.-J.; Liu, J.-Y.; Lin, W.-R.; Lee, K.-C. Incorporating life cycle assessments into building project decision making: An energy consumption and CO2 emission perspective. Energy 2011, 36, 3022–3029. [Google Scholar] [CrossRef]
- Pati, R.K.; Vrat, P.; Kumar, P. Economic analysis of paper recycling vis-à-vis wood as raw material. Int. J. Prod. Econ. 2006, 103, 489–508. [Google Scholar] [CrossRef]
- Da Cunha Lemos, Â.D.; Giacomucci, A. Green procurement activities: So environmental indicators and practical actions taken by industry and tourism. Int. J. Environ. Sustain. Dev. 2002, 1, 59–72. [Google Scholar] [CrossRef]
- Faith-Ell, C.; Balfors, B.; Folkeson, L. The application of environmental requirements in Swedish road maintenance contracts. J. Clean. Prod. 2006, 14, 163–171. [Google Scholar] [CrossRef]
- Wagner, T.; Herrmann, C.; Thiede, S. Industry 4.0 impacts on lean production systems. Procedia CIRP 2017, 63, 125–131. [Google Scholar] [CrossRef]
- Shah, R.; Ward, P.T. Defining and developing measures of lean production. J. Oper. Manag. 2007, 25, 785–805. [Google Scholar] [CrossRef] [Green Version]
- Mrugalska, B.; Wyrwicka, M.K. Towards Lean Production in Industry 4.0. Procedia Eng. 2017, 182, 466–473. [Google Scholar] [CrossRef]
- Bagheri, B.; Yang, S.; Kao, H.-A.; Lee, J. Cyber-Physical Systems architecture for self-aware machines in Industry 4.0-based environment. IFAC-PapersOnLine 2015, 48, 1622–1627. [Google Scholar] [CrossRef]
- Lee, J.; Bagheri, B.; Kao, H.A. Recent Advances and Trends of Cyber-Physical Systems and Big Data Analytics in Industrial Informatics. In Proceedings of the 2014 12th International Conference on Industrial Informatics (INDIN), Porto Alegre, Brazil, 27–30 July 2014. [Google Scholar]
- Woodall, W.H.; Montgomery, D.C. Research Issues and Ideas in Statistical Process Control. J. Qual. Technol. 1999, 31, 376–386. [Google Scholar] [CrossRef]
- Tsai, W.H.; Hsu, J.L.; Chen, C.H.; Chou, Y.W.; Lin, S.J.; Lin, W.R. Application of ABC in hot spring country inn. Int. J. Manag. Enterp. Dev. 2010, 8, 152–174. [Google Scholar] [CrossRef]
- Sauer, O. Information Technology for the Factory of the Future—State of the Art and Need for Action. Procedia CIRP 2014, 25, 293–296. [Google Scholar] [CrossRef]
- Glock, C.H.; Jaber, M.Y. Learning effects and the phenomenon of moving bottlenecks in a two-stage production system. Appl. Math. Model. 2013, 37, 8617–8628. [Google Scholar] [CrossRef]
- Qin, J.; Liu, Y.; Grosvenor, R. A Categorical Framework of Manufacturing for Industry 4.0 and Beyond. Procedia CIRP 2016, 52, 173–178. [Google Scholar] [CrossRef]
- Lee, J.; Kao, H.A.; Yang, S. Service innovation and smart analytics for Industry 4.0 and big data Environment. Procedia CIRP 2014, 16, 3–8. [Google Scholar] [CrossRef]
- Tzeng, G.H.; Tang, T.I.; Hung, Y.M.; Chang, M.L. Multiple-objective planning for a production and distribution model of the supply chain: Case of a bicycle manufacturer. J. Sci. Ind. Res. 2006, 65, 309–320. [Google Scholar]
- Charnes, A.; Cooper, W.W.; Rhodes, E. Measuring the efficiency of decision-making units. Eur. J. Oper. Res. 1978, 2, 429–444. [Google Scholar] [CrossRef]
- Zhou, H.; Yang, Y.; Chen, Y.; Zhu, J. Data envelopment analysis application in sustainability: The origins, development and future directions. Eur. J. Oper. Res. 2018, 264, 1–16. [Google Scholar] [CrossRef]
- Wang, X.; Xue, M.; Xing, L. Analysis of Carbon Emission Reduction in a Dual-Channel Supply Chain with Cap-And-Trade Regulation and Low-Carbon Preference. Sustainability 2018, 10, 580. [Google Scholar] [CrossRef]
- Zhang, L.; Yang, W.; Yuan, Y.; Zhou, R. An Integrated Carbon Policy-Based Interactive Strategy for Carbon Reduction and Economic Development in a Construction Material Supply Chain. Sustainability 2017, 9, 2107. [Google Scholar] [CrossRef]
- Chesworth, D. Industry 4.0 Techniques as a Maintenance Strategy (A Review Paper); Research Project: Maintenance Strategies in Industry, Glyndwr University: Wrexham, UK, January 2018. [Google Scholar]
- Fleischmann, H.; Kohl, J.; Franke, J. A Modular Architecture for the Design of Condition Monitoring Processes. Procedia CIRP 2016, 57, 410–415. [Google Scholar] [CrossRef]
- Wang, S.; Hao, J. Air quality management in China: Issues, challenges, and options. J. Environ. Sci. 2012, 24, 2–13. [Google Scholar] [CrossRef]
- Ghisellini, P.; Cialani, C.; Ulgiati, S. A review on circular economy: The expected transition to a balanced interplay of environmental and economic systems. J. Clean. Prod. 2016, 114, 11–32. [Google Scholar] [CrossRef]
- Tsai, W.-H.; Lin, W.-R.; Fan, Y.-W.; Lee, P.-L.; Lin, S.-J.; Hsu, J.-L. Applying a mathematical programming approach for a green product mix decision. Int. J. Prod. Res. 2012, 50, 1171–1184. [Google Scholar] [CrossRef]
- Tsai, W.-H.; Chen, H.-C.; Leu, J.-D.; Chang, Y.-C.; Lin, T.W. A product-mix decision model using green manufacturing technologies under activity-based costing. J. Clean. Prod. 2013, 57, 178–187. [Google Scholar] [CrossRef]
- Recker, J.; Rosemann, M.; Gohar, E.R. Measuring the carbon footprint of business processes. In Proceedings of the International Conference on Business Process Management in Lecture Notes in Business Information Processing, Hoboken, NJ, USA, 13–16 September 2010; Volume 66, pp. 511–520. [Google Scholar]
Figure 1.
The cost assignment of the ABC two-phase model.

Figure 2.
The relationship between the mathematical programming model and Industry 4.0 in this research.
Figure 2.
The relationship between the mathematical programming model and Industry 4.0 in this research.

Figure 3.
The production process of paper-making.

Figure 4.
The direct material cost function.

Figure 5.
The piecewise direct labor cost function.

Figure 6.
The carbon tax cost function.

Figure 7.
The diagram of the data and information flow in a Cyber-physical system-enabled plant.

Figure 8.
The schematic diagram of SPC joint correction improvement.

Figure 9.
A schematic diagram of the interaction of the circular economy in the paper industry.


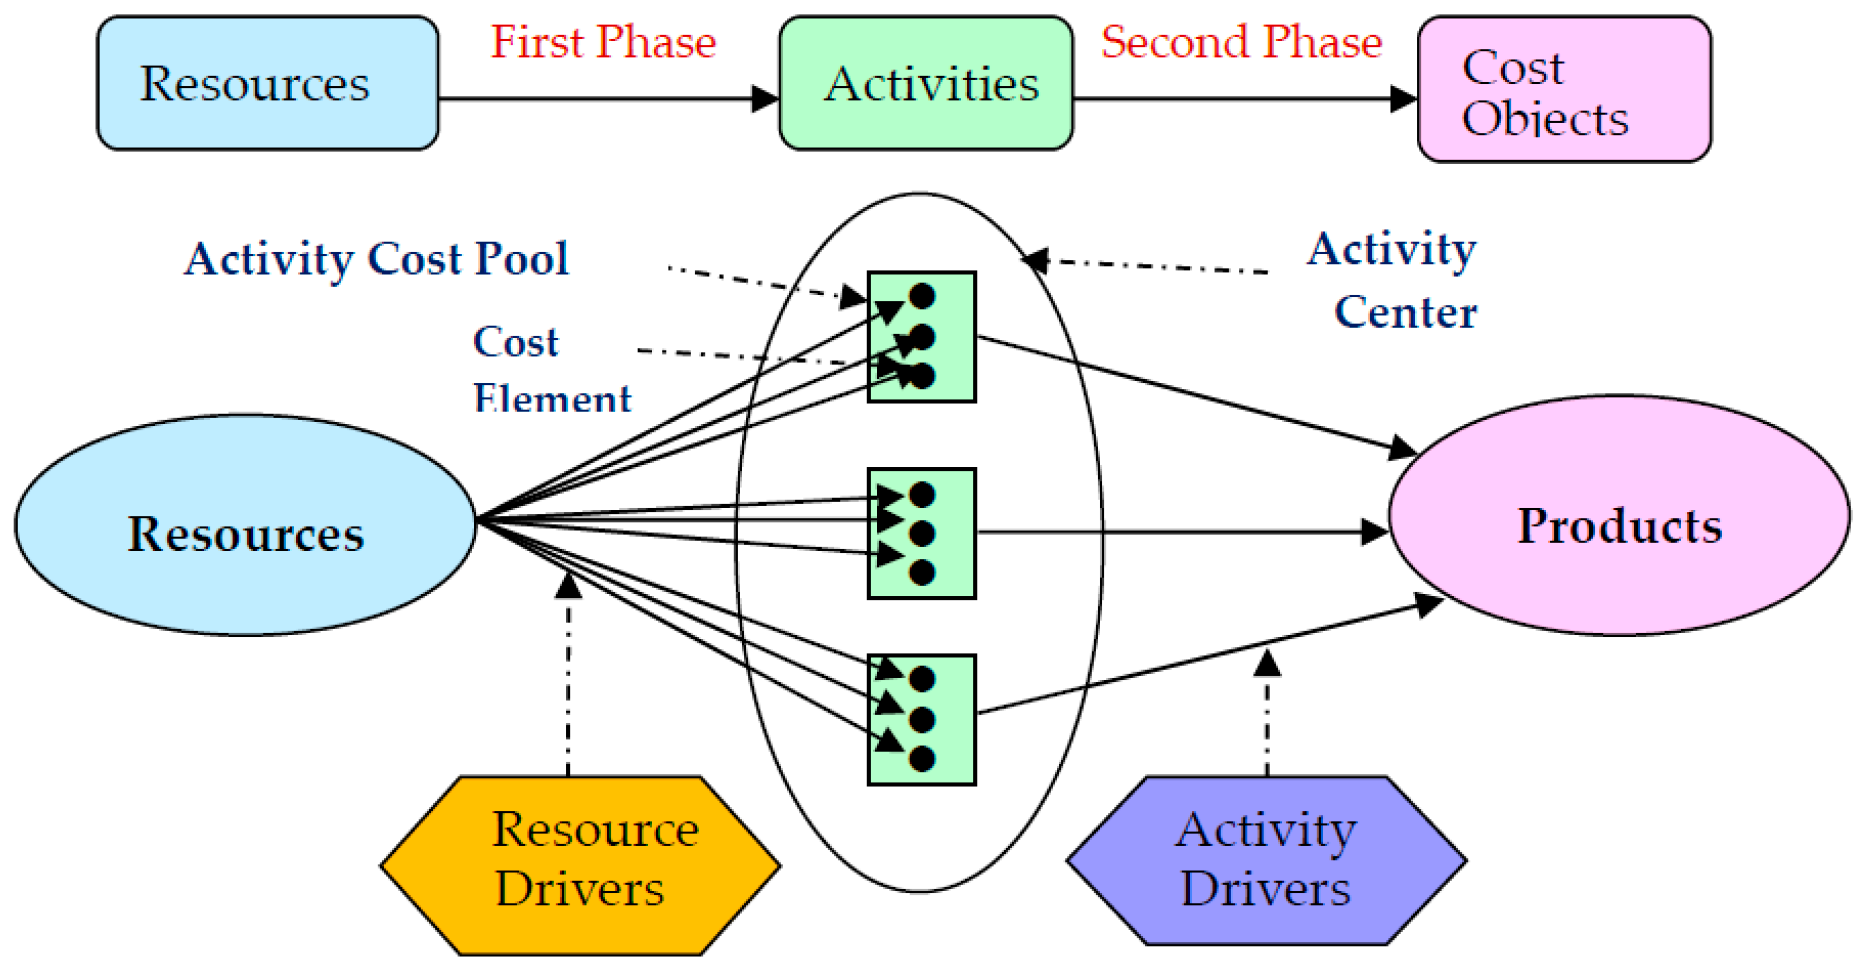
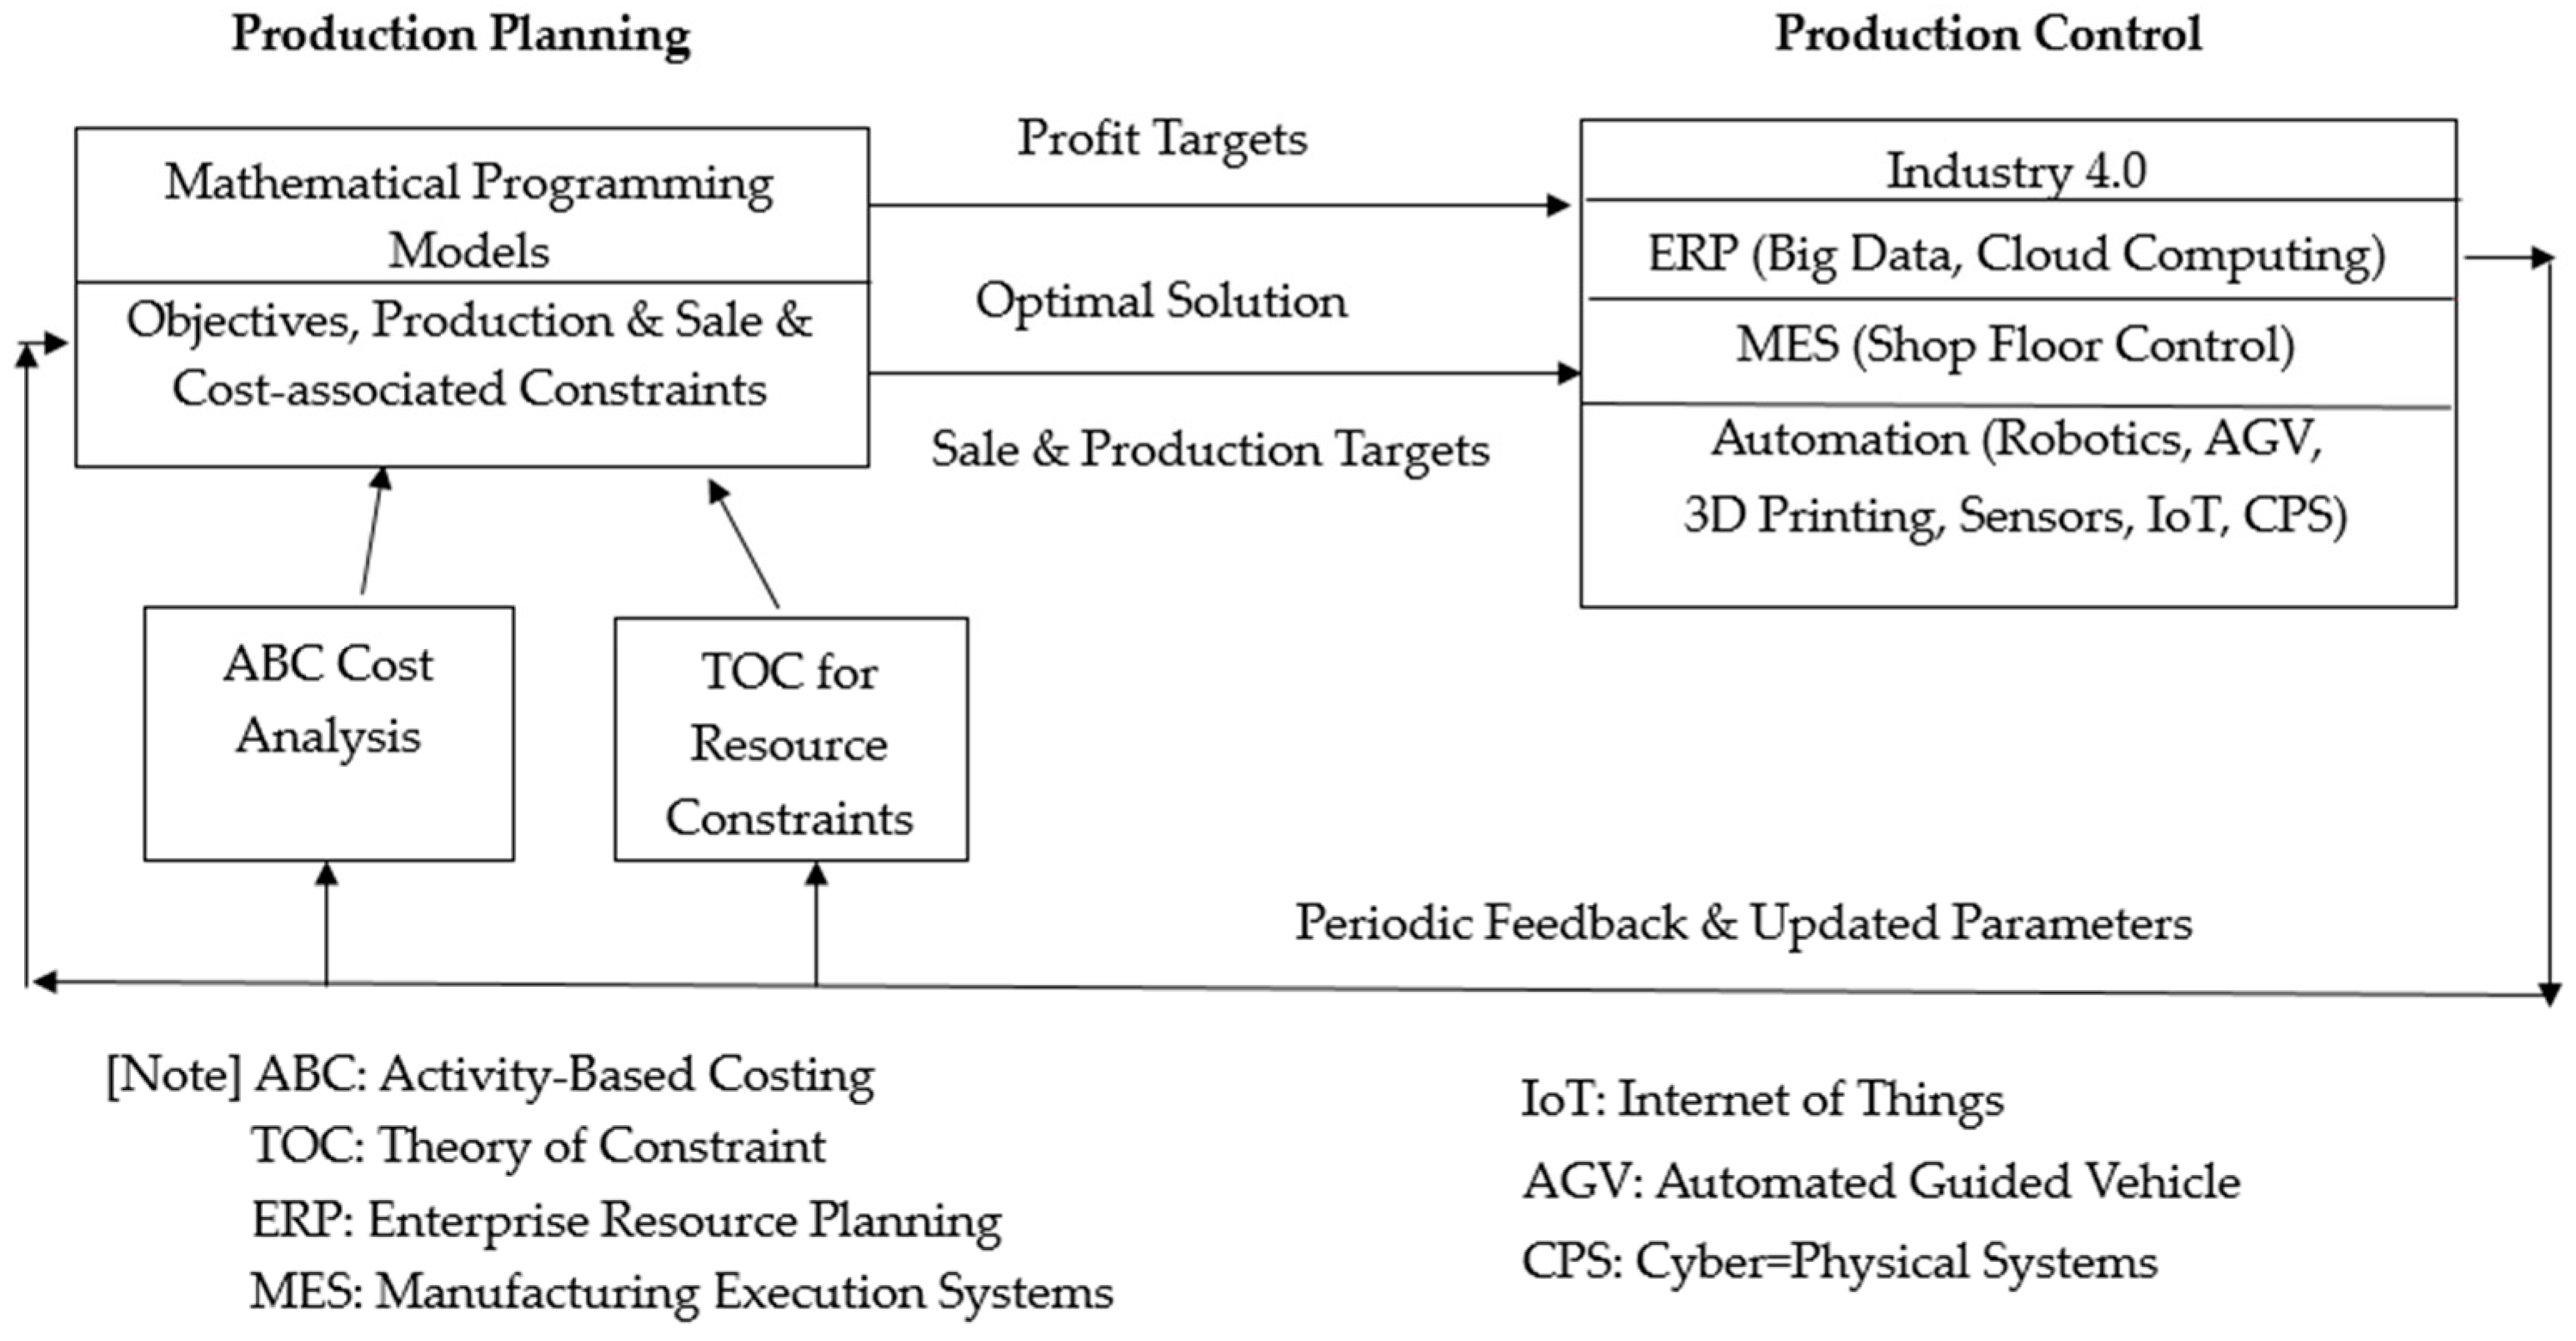
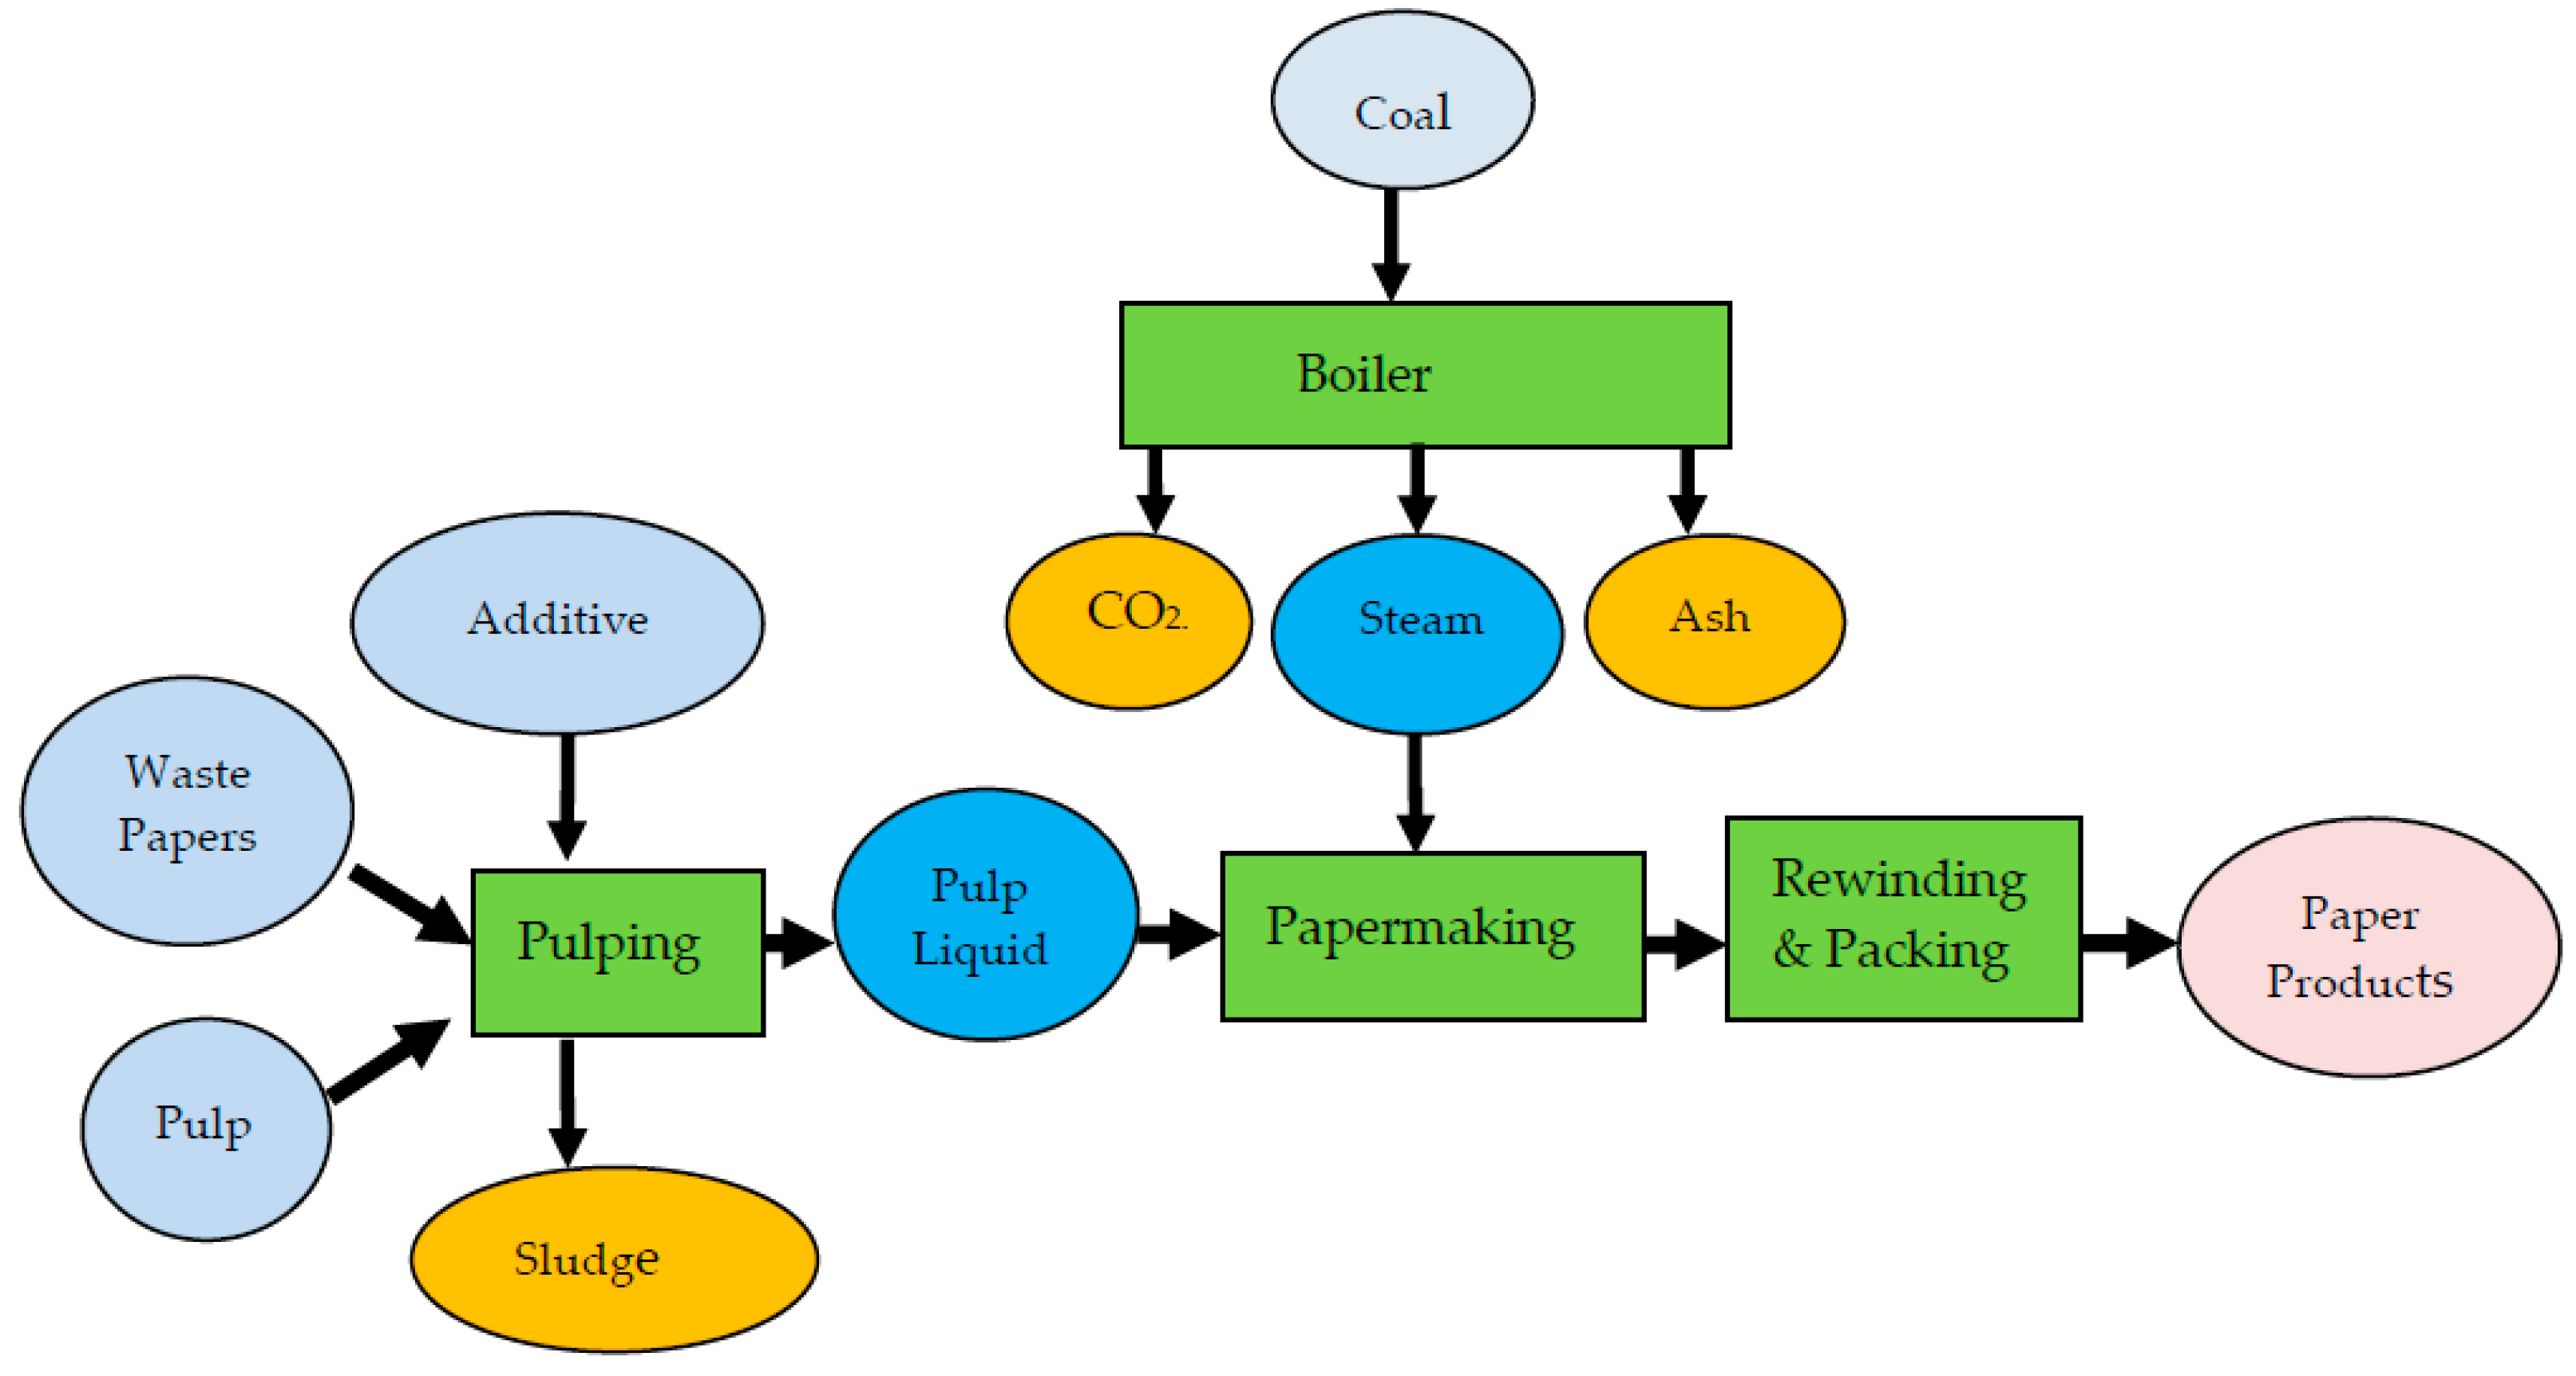
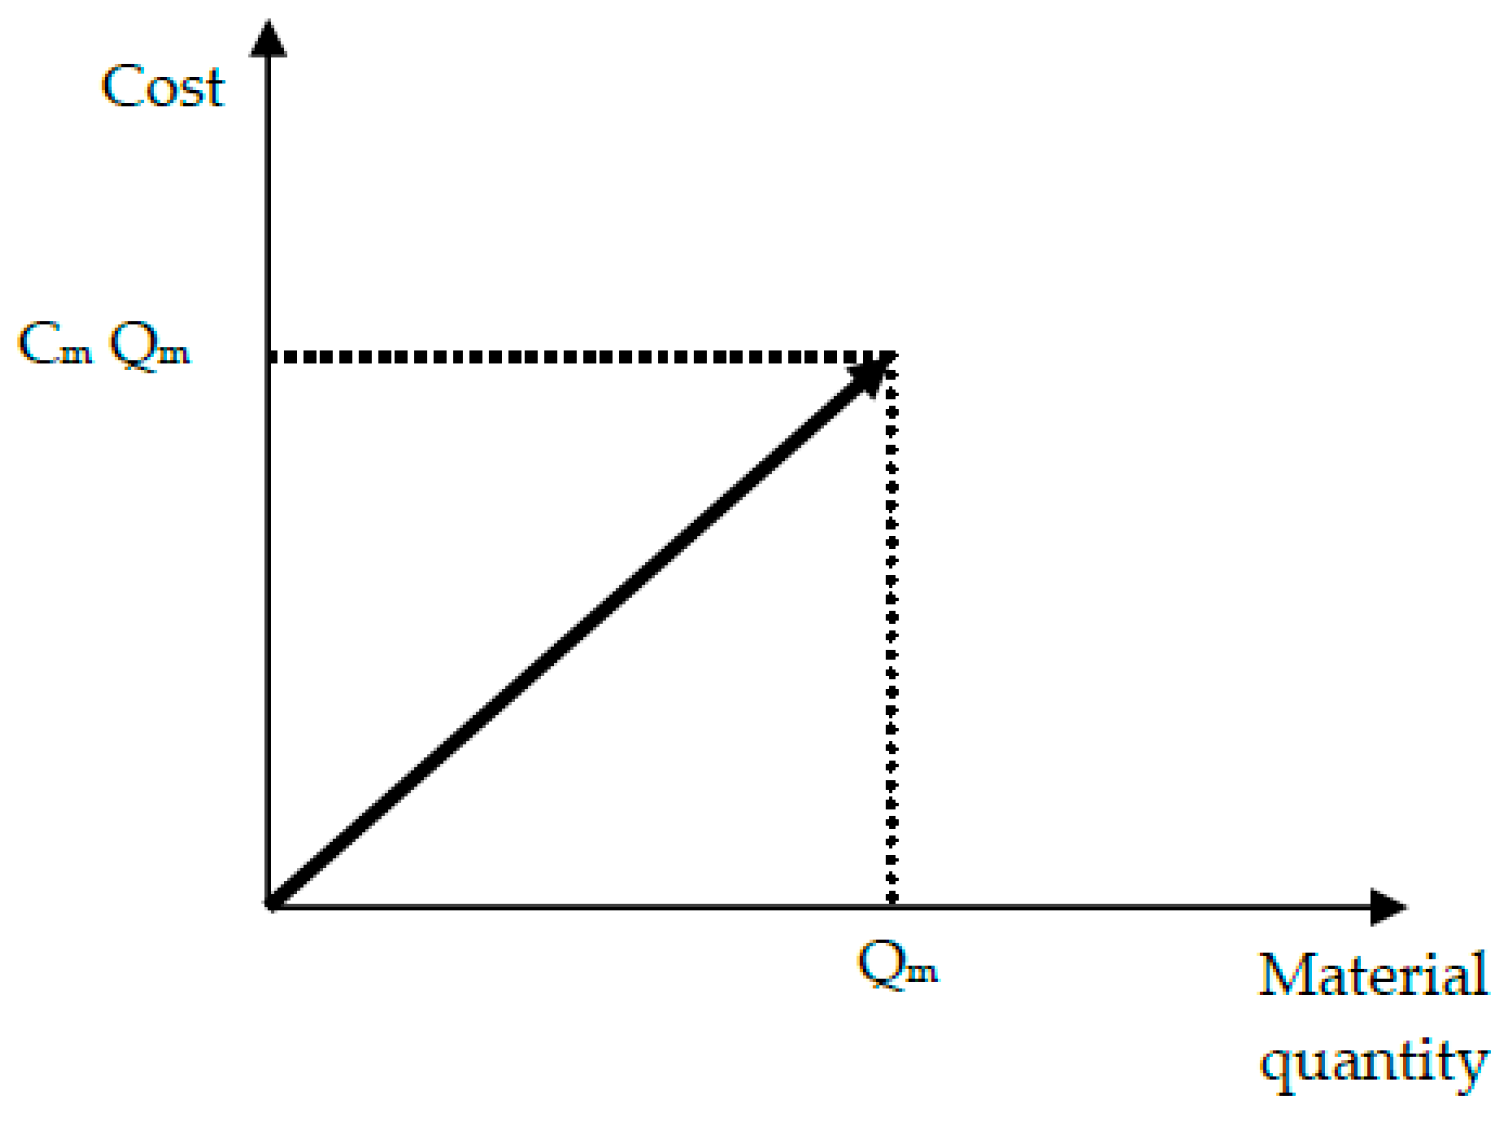
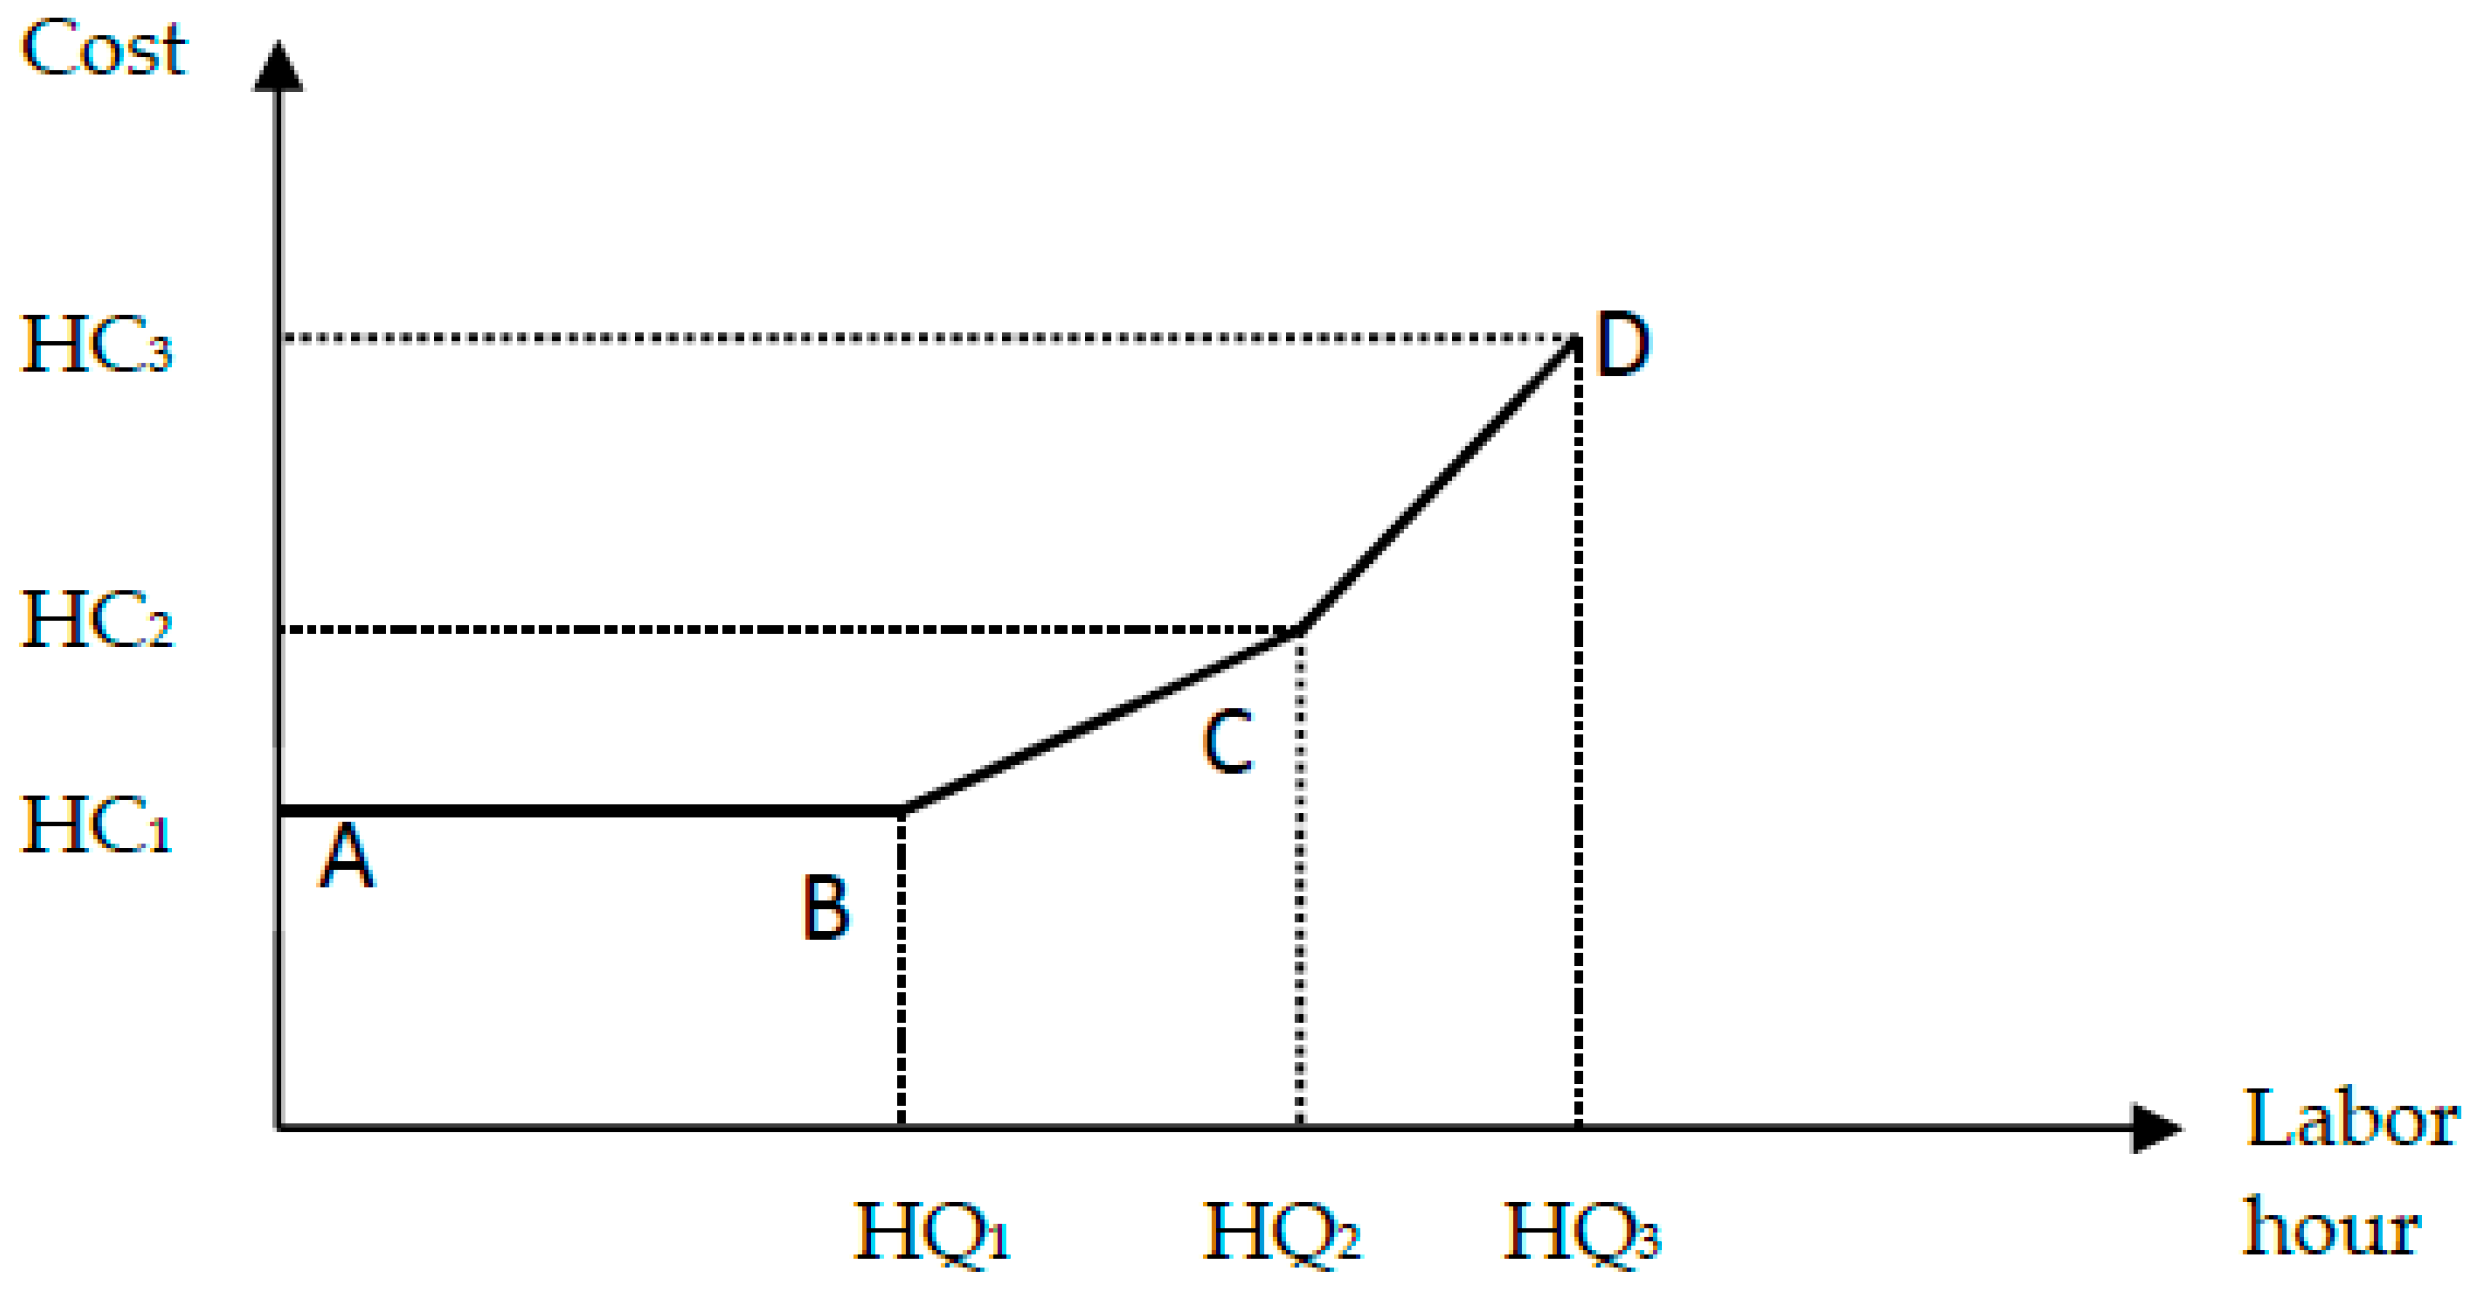
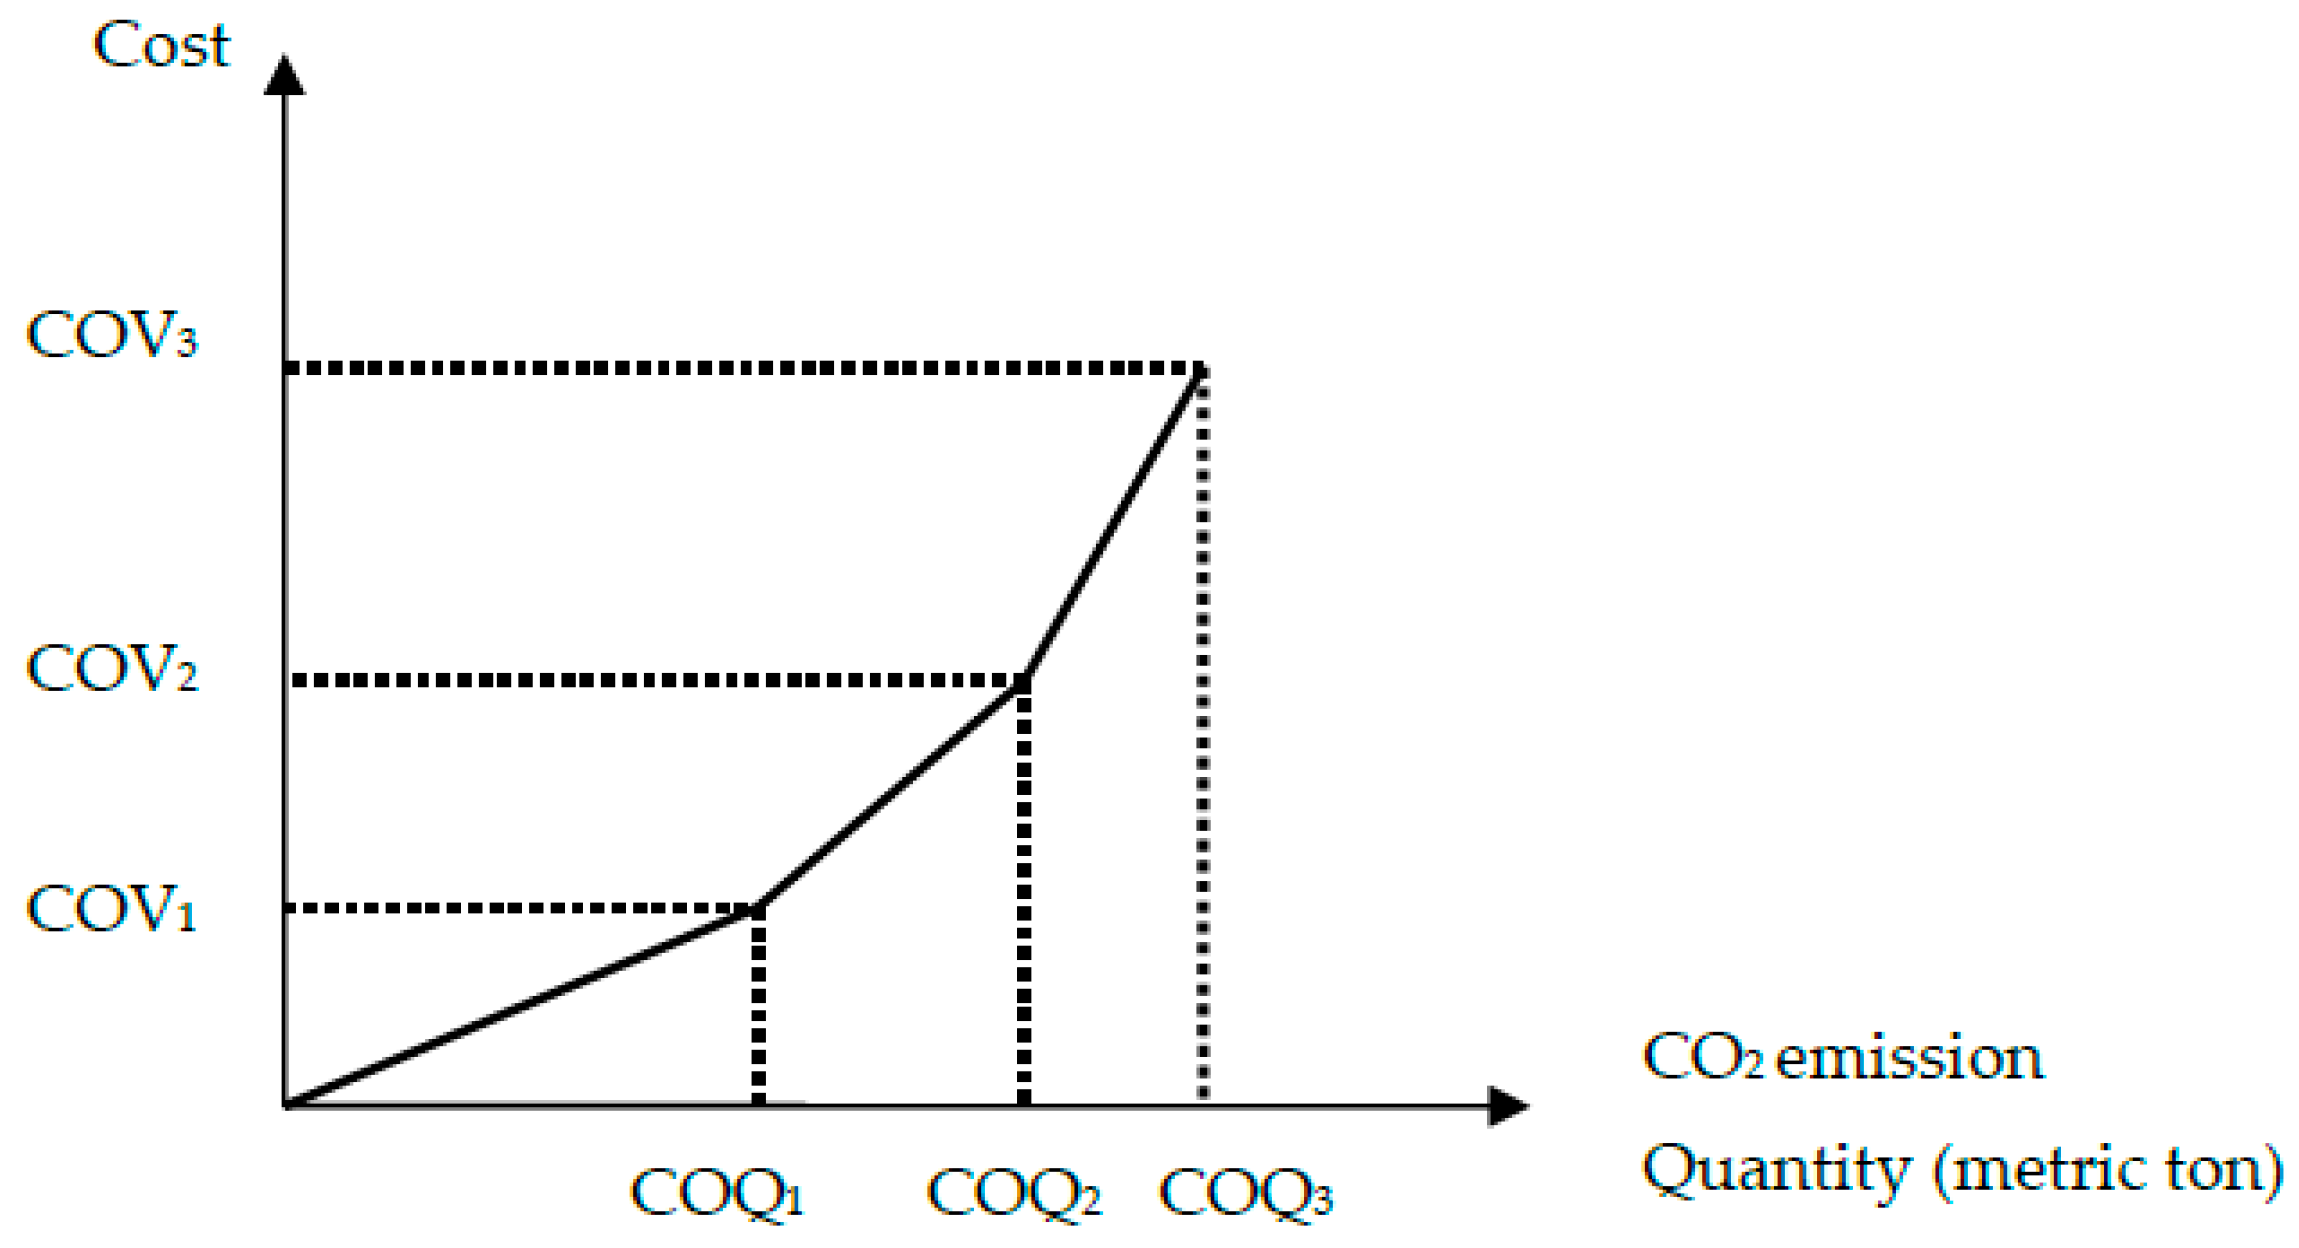
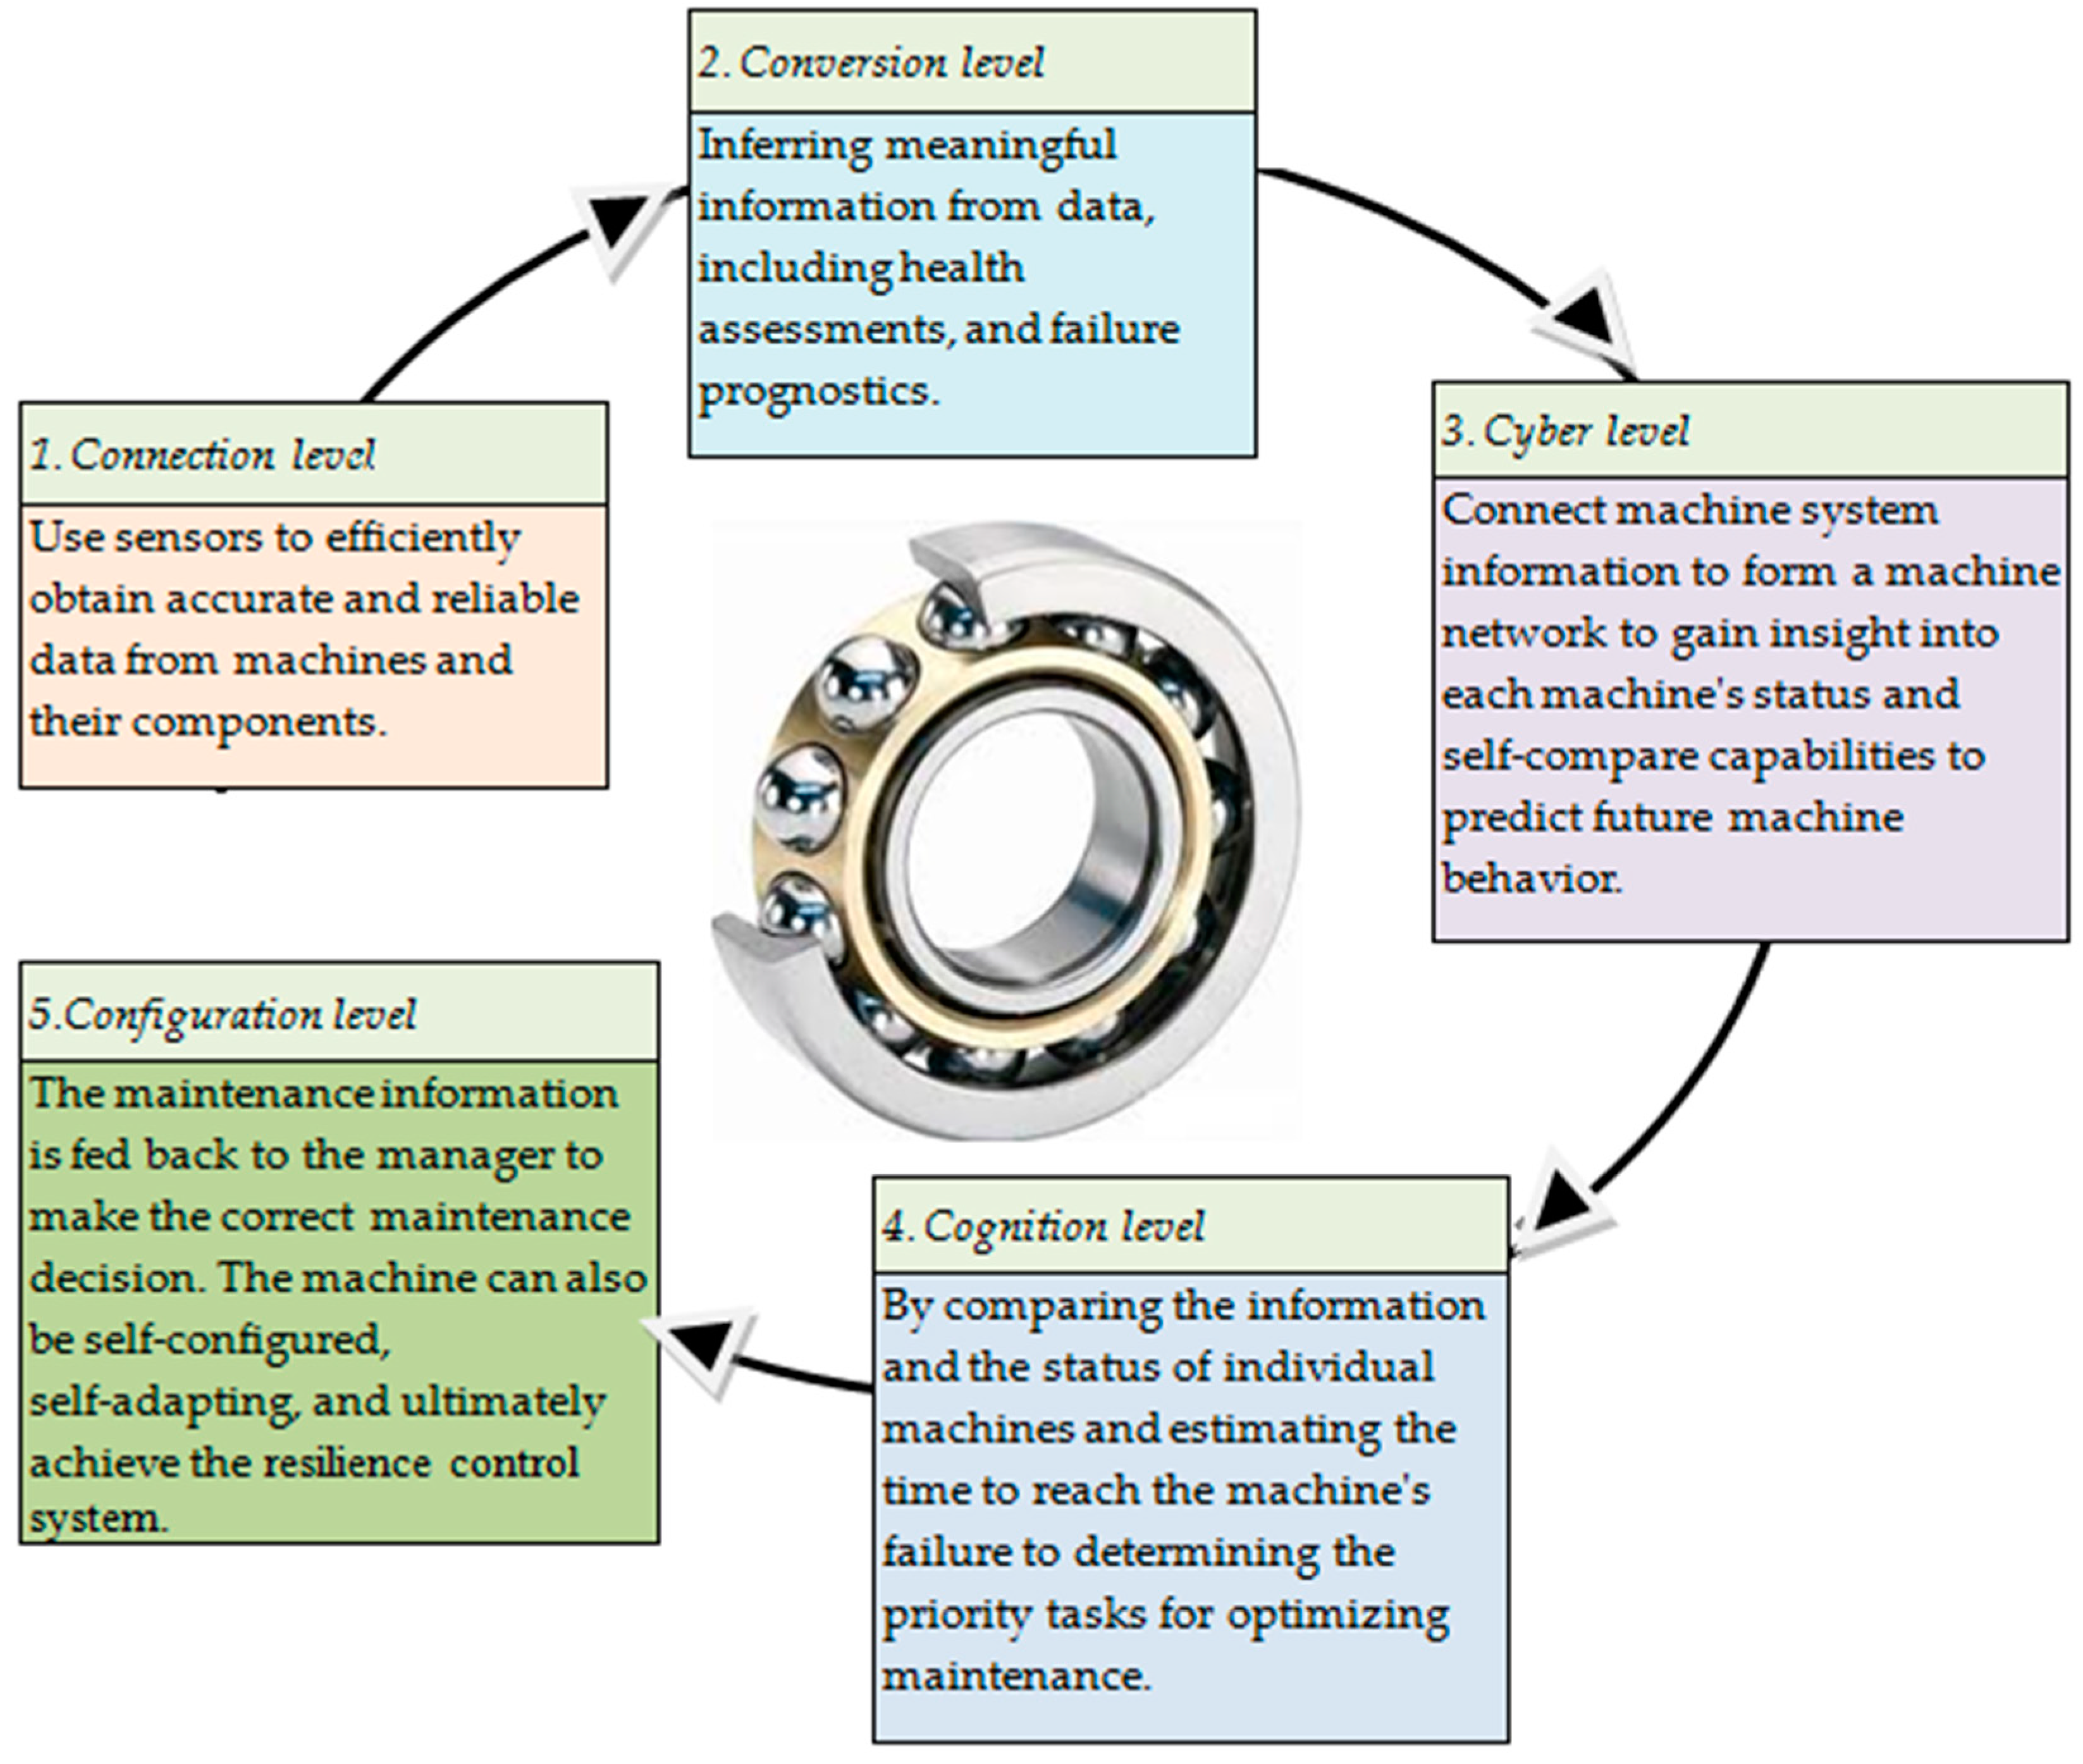
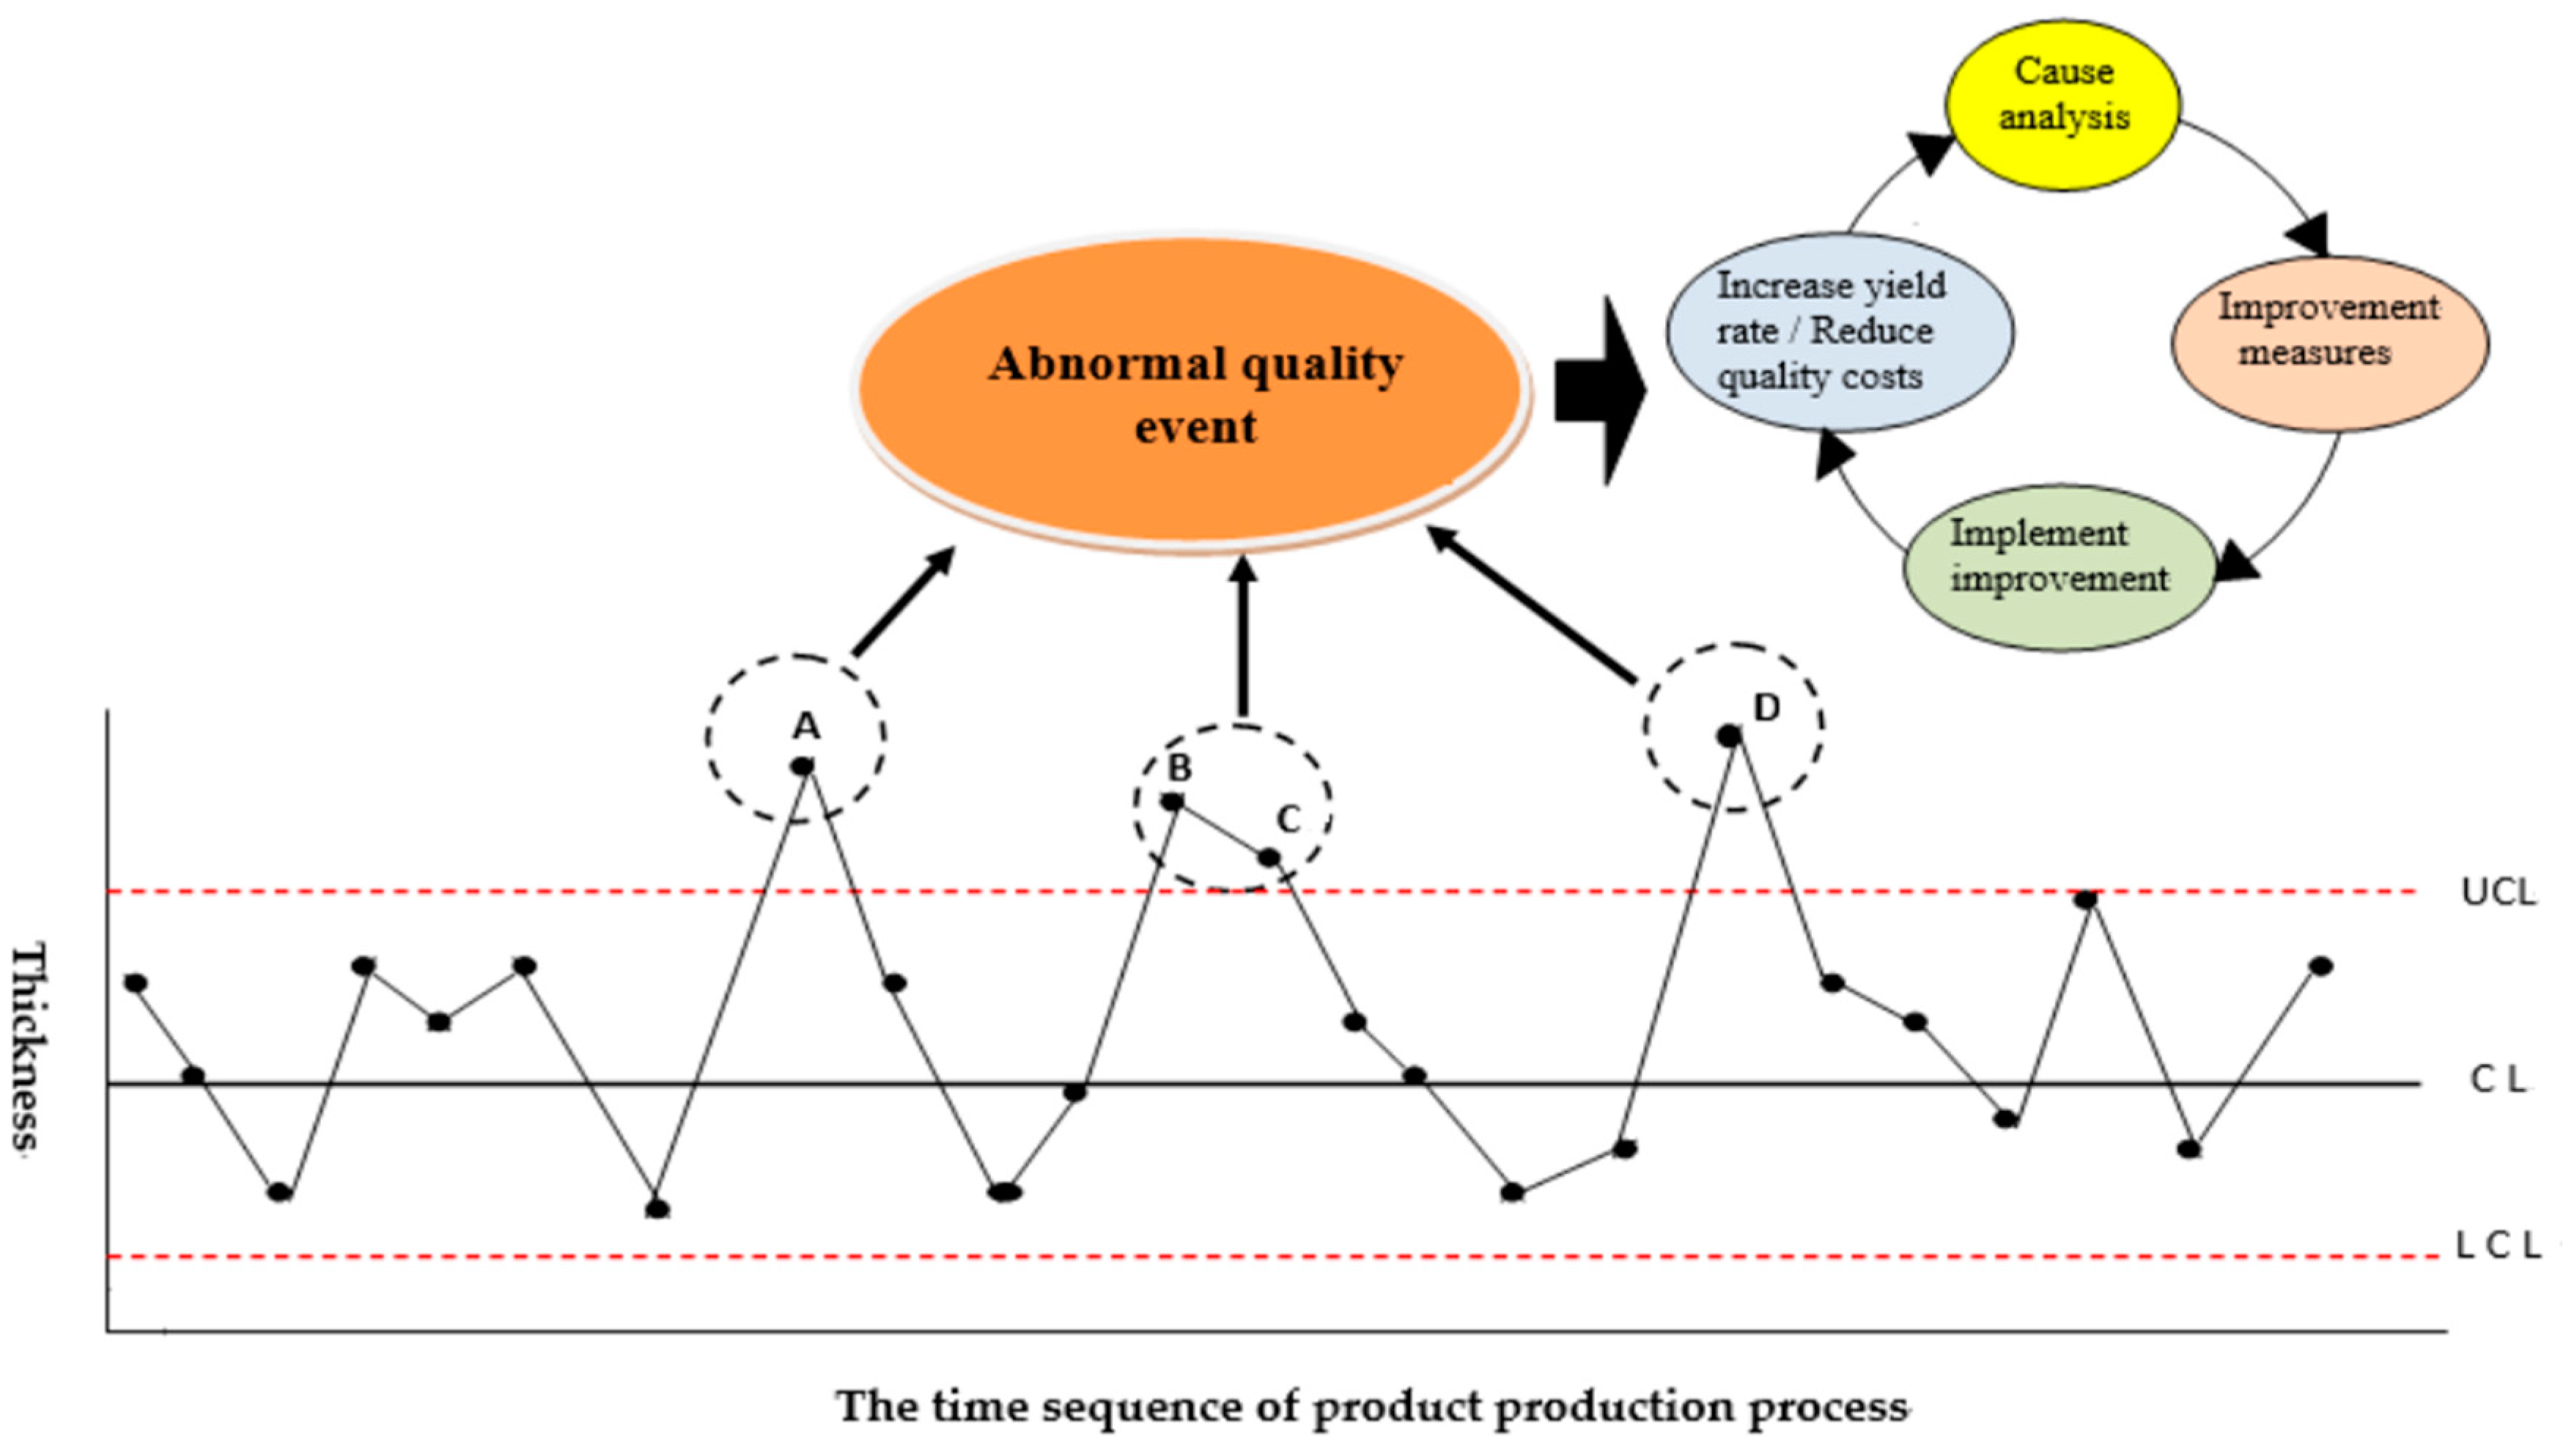
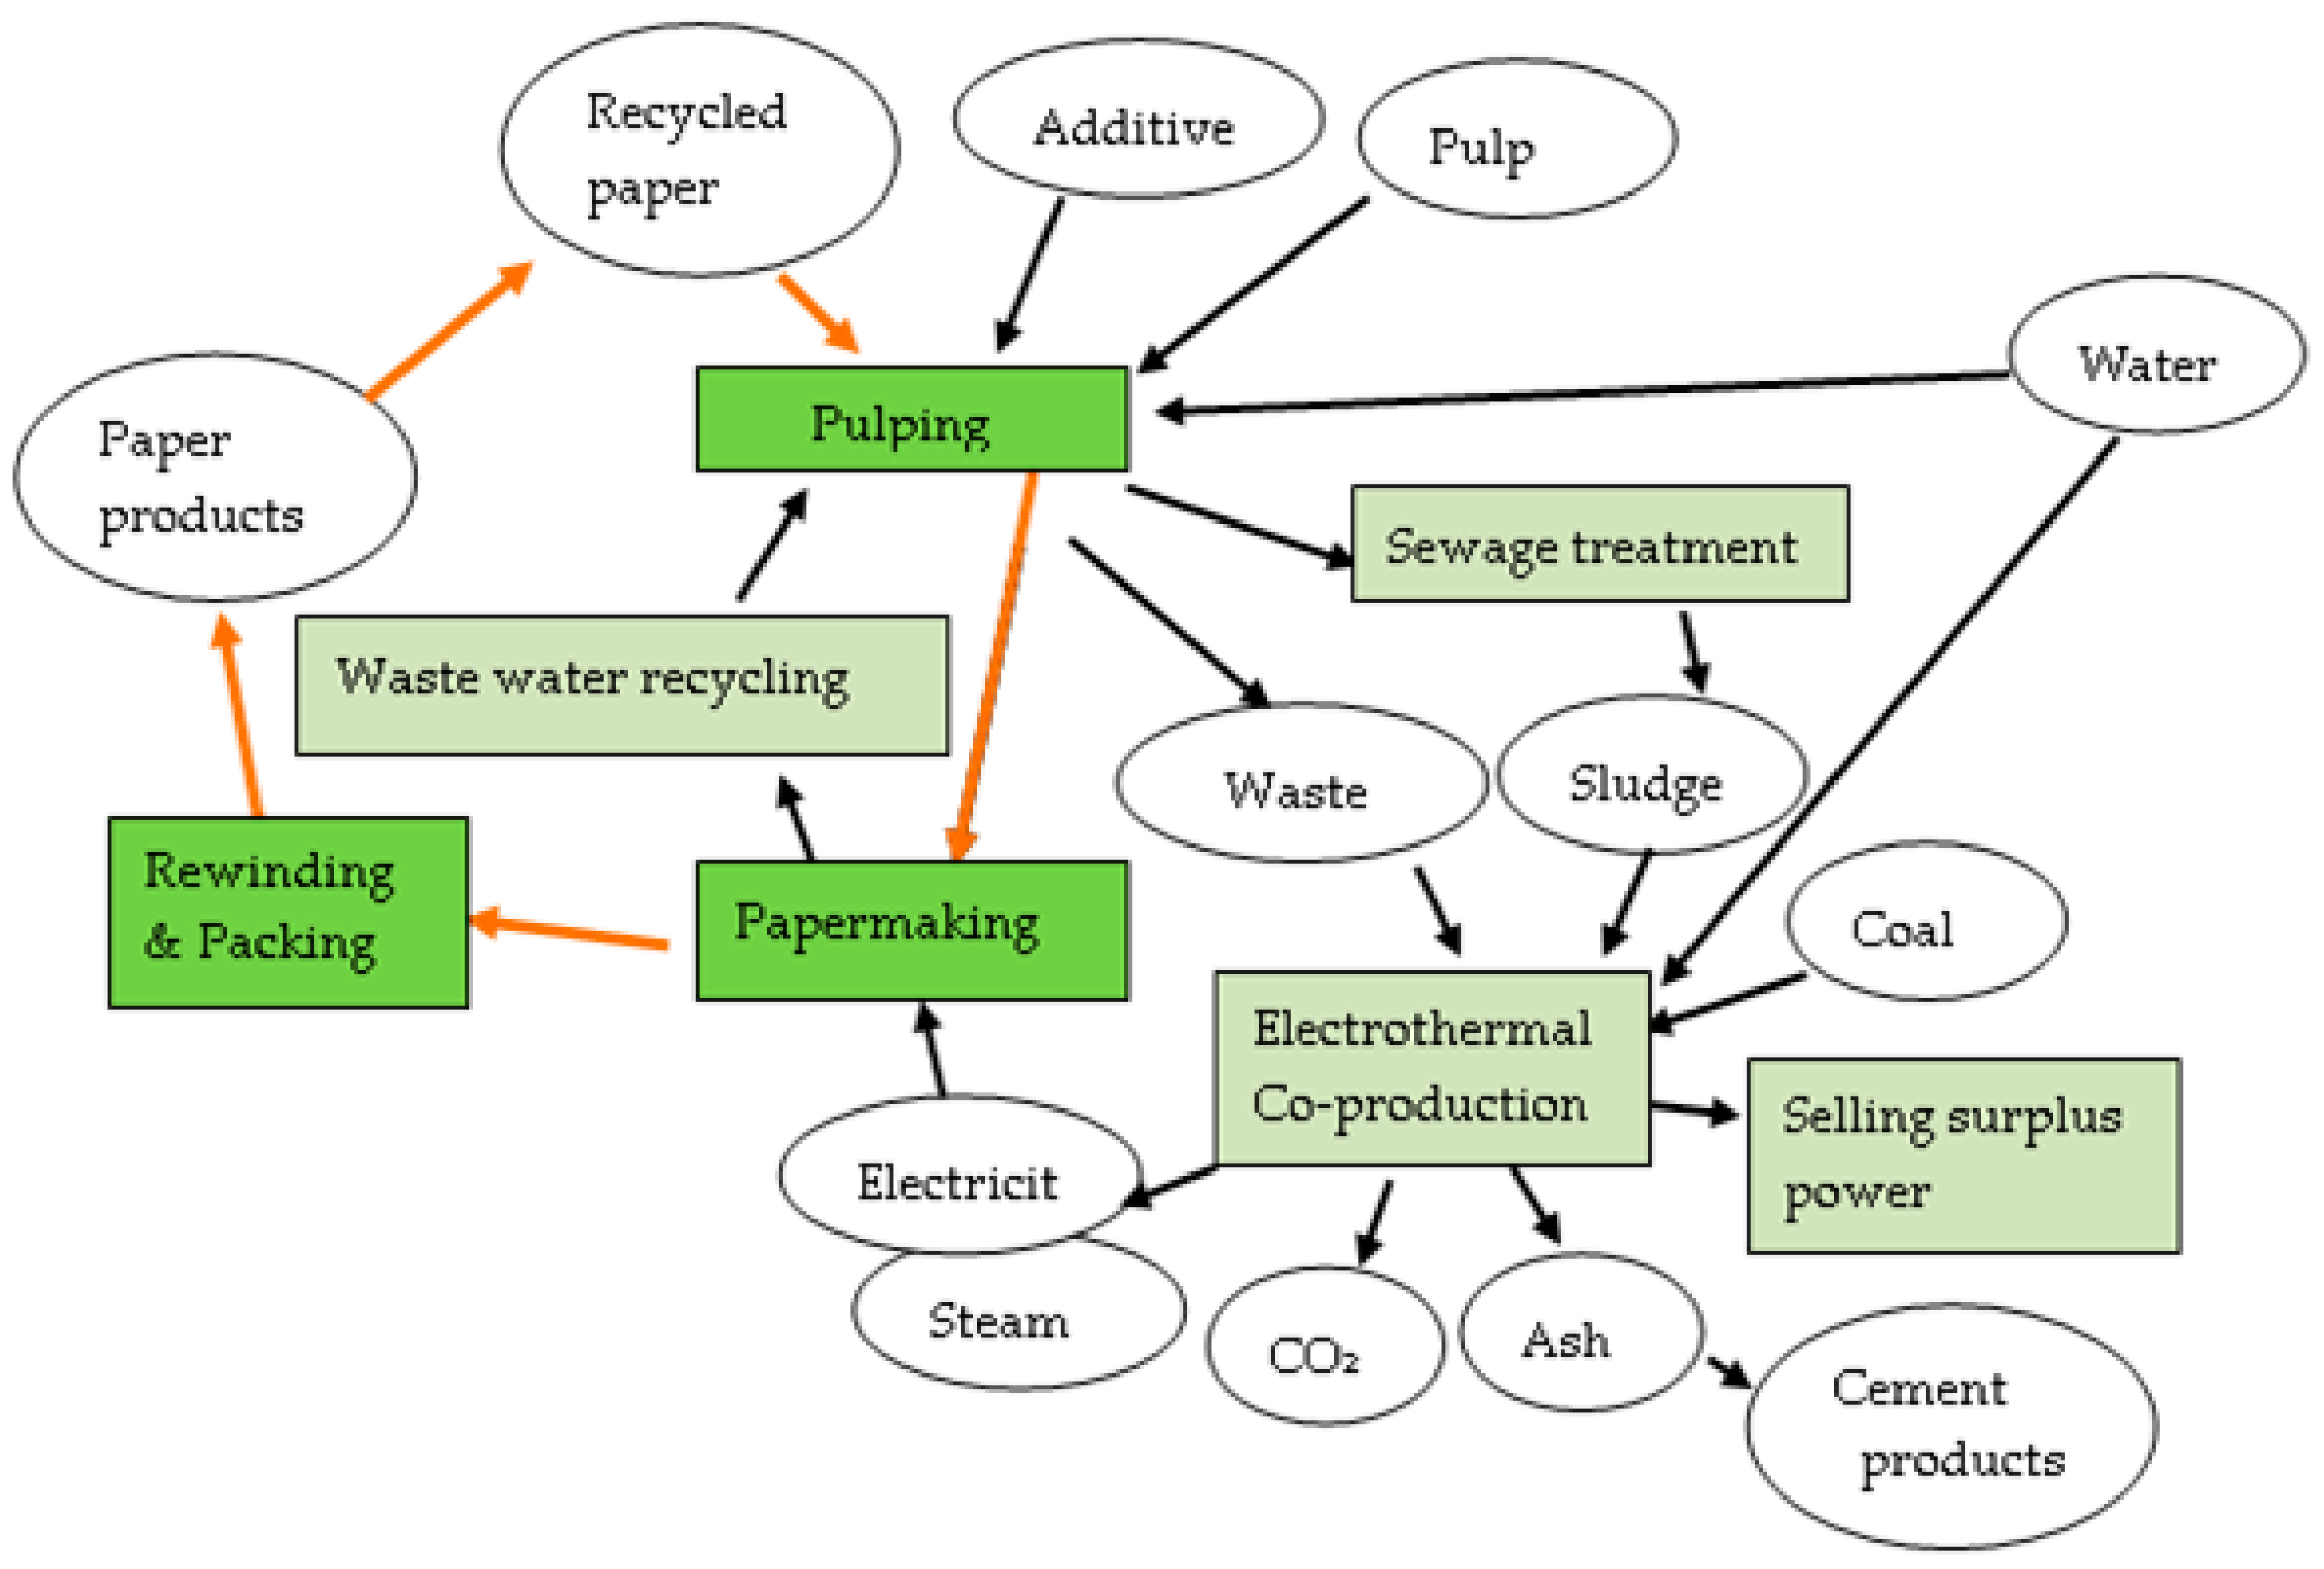
Table 1.
The example data.
| j | i | Product 1 | Product 2 | Product 3 | Available Capacity | |||
|---|---|---|---|---|---|---|---|---|
| Maximum Demand (Ton) | X1 ≤ 500 | |||||||
| Selling price (USD/ton) | Pi | 1700 | 1400 | 1200 | ||||
| Direct material | m = 1 | C1 = $670/ton | Ai1 | 0.80 | 0.70 | 0.65 | Q1 ≤ 2000 | |
| m = 2 | C2 = $200/ton | Ai2 | 0.15 | 0.20 | 0.30 | Q2 ≤ 700 | ||
| m = 3 | C3 = $2500/ton | Ai3 | 0.05 | 0.10 | 0.05 | Q3 ≤ 300 | ||
| Ei | 89% | 90% | 91% | |||||
| Direct labor constraint Cost Labor hours (hr) | HC1 = 190,080 | HC2 = 253,440 | HC3 = 332,640 | |||||
| HQ1 = 31,680 | HQ2 = 39,600 | HQ3 = 47,520 | ||||||
| Wage rate (USD/ hr) | WR1 = 6 | WR2 = 8 | WR3 = 10 | |||||
| Labor hours (hr/ton) | LHi | 18 | 16 | 15 | ||||
| Pulping (hr/ton) | Machine hours | U1 = $50/hr | 1 | Hi1 | 0.12 | 0.12 | 0.12 | MH1 = 528 |
| paper making (hr/ton) | Machine hours | U2 = $250/hr | 2 | H2 | 0.22 | 0.18 | 0.17 | MH2 = 528 |
| Rewinding (hr/ton) | Machine hours | U2 = $12/hr | 3 | Hi3 | 0.13 | 0.12 | 0.11 | MH3 = 352 |
| Batch-level activity Inventory handling Set-up | Handling hours | d1 = $18/hr | 1 | Ri1 | 1 | 1 | 1 | T1 = 528 |
| Ki1 | 100 | 100 | 100 | |||||
| Set-up hours | d2 = $100/hr | 2 | Ri2 | 5 | 4 | 4 | T2 = 528 | |
| Ki2 | 400 | 600 | 600 | |||||
| CO2 emission constraint Cost (USD) Emission quantities | COV1 = 60,000 | COV2 = 114,000 | COV3 = 195,000 | |||||
| COQ1 = 2500 | COQ2 = 4000 | COQ3 = 5500 | Vi | 1.2 | 1 | 0.9 | ||
| Tax rate (USD/ton) | TR1 = 24 | TR2 = 36 | TR3 = 54 | |||||
| Environmental regulatory costs. | Total fix cost | $30,000 |
Table 2.
The optimal solution for example data.
| X1 = 500 | X2 = 1415 | X3 = 910 |
| δ1 = 0 | δ2 = 1 | |
| γ0 = 0 | γ1 = 0.2815657 | γ2 = 0.7184343 |
| N11 = 5 | N21 = 15 | N31 = 10 |
| N12 = 2 | N22 = 3 | N32 = 2 |
| λ1 = 0 | λ2 = 1 | λ3 = 0 |
| Φ0 = 0 | Φ1 = 0.7773333 | Φ2 = 0.2226667 |
| Φ3 = 0 |
Table 3.
The increase in carbon emission costs by doubling the carbon tax rate.
| CO2 Emissions (Ton) | Tax Rate (USD/Ton) | CO2 EmissionCosts | Tax Rate (USD/Ton) | CO2 EmissionCosts | Difference |
|---|---|---|---|---|---|
| (λ1 = 1) 2500 | 24 | 60,000 | 48 | 120,000 | 60,000 |
| (λ2 = 1) 334 | 36 | 12,024 | 72 | 24,048 | 12,024 |
| Total 2834 | 72,024 | 144,048 | 72,024 |
© 2018 by the authors. Licensee MDPI, Basel, Switzerland. This article is an open access article distributed under the terms and conditions of the Creative Commons Attribution (CC BY) license (http://creativecommons.org/licenses/by/4.0/).
Share and Cite
MDPI and ACS Style
Tsai, W.-H.; Lai, S.-Y. Green Production Planning and Control Model with ABC under Industry 4.0 for the Paper Industry. Sustainability 2018, 10, 2932. https://doi.org/10.3390/su10082932
AMA Style
Tsai W-H, Lai S-Y. Green Production Planning and Control Model with ABC under Industry 4.0 for the Paper Industry. Sustainability. 2018; 10(8):2932. https://doi.org/10.3390/su10082932
Chicago/Turabian StyleTsai, Wen-Hsien, and Shang-Yu Lai. 2018. "Green Production Planning and Control Model with ABC under Industry 4.0 for the Paper Industry" Sustainability 10, no. 8: 2932. https://doi.org/10.3390/su10082932
Note that from the first issue of 2016, this journal uses article numbers instead of page numbers. See further details here.