Urban Transformations as an Indicator of Unsustainability in the P2P Mass Tourism Phenomenon: The Airbnb Case in Spain through Three Case Studies


Department of Civil Engineering, Technical University of Cartagena, Cartagena 30202, Spain
Sustainability 2018, 10(8), 2933; https://doi.org/10.3390/su10082933
Submission received: 6 August 2018
/
Revised: 12 August 2018
/
Accepted: 14 August 2018
/
Published: 18 August 2018
(This article belongs to the Special Issue Employment and Income Growth from Sustainable Tourism)
Abstract
:Globalization and the development of the so-called “collaborative economies” has coincided with an important transformation of mass tourism in the last decades. This phenomenon has been accentuated enormously in many European cities in recent years, generating a new P2P tourist model. The situation is having a strong social impact on the urban transformation of cities, and its characteristics are closely related to real estate speculative movements. In this sense, the analysis of urban transformation can offer interesting conclusions about the sustainability of these new tourist models in large touristic cities. In this article, we will analyse the effect associated with of so-called phenomena of “tourist flats” from the Airbnb portal in the cities of Madrid, Barcelona, and Palma de Mallorca. Through the use of GIS indicators and geostatistic analysis of spatial correlation, the current incidence of this phenomenon in these cities, and possible future scenarios of maintaining the current trend, will be evaluated and discussed. The results obtained show worrying indicators in relation to the economic and social sustainability of the current urban-tourist model created in the city which are linked to gentrification processes.
1. Introduction
1.1. Main Theories on Which the Study Is Based
Tourism is an activity whose behaviour has mutated in developed countries many times in the last century [1]. For example, tourism of the early twentieth century was elitist, with baths and hot springs in Europe [2], or gated communities in resorts in Florida in the US [3]. The development of sun and beach tourism later dedicated coastal areas to local tourists, but also to foreigners in search of warmer temperatures. The democratization of access to tourism has popularized mass tourism on the beaches of the Mediterranean in Europe since the 60s [4,5]. This phenomenon has, on many occasions, shown important signs of unsustainability in its behaviour in the last decades [6]. In this sense, the concept of sustainability in relation to the consumption of resources and the generation of intrinsically unbalanced models has been widely debated for mass tourism [7]. Many cases with important financial benefits in the short term but which have nonetheless perpetuated a prematurely-instigated model with little added value in the long term can be noted in the bibliography [8]. Within this field, we can find, for example, the development of urban models of sun and beach in which the disproportionate growth of second residences around tourist infrastructures ended up generating a tourist destination prematurely [9]. In this segment of mass tourism are also included cases in which the accelerated growth of a tourist destination in the short term has resulted in the loss of natural and scenic areas, which have diminished the area’s appeal to tourists [10,11]. These phenomena have given rise in to the standardization of the well-known concept of the tourist area life-cycle (TALC), and of the mature tourist settlements ([12,13,14,15,16] for example Butler since [17]).
Since the end of the 20th century, the mass tourism phenomenon has diversified enormously, offering cultural and gastronomic activities, leisure, night-life, conferences, heritage, shopping, music festivals, etc. [18,19,20,21]. In this context, the historic cities of many European countries [22,23], or large ones all over the world [24,25], have become major poles of attraction for mass tourism. Additionally, the globalization of the tourist phenomenon in recent years thanks to the internet and the so-called models of “P2P collaborative economy” has given rise to a great transformation in this field [26,27]. Here, people who have space to spare (hosts) are easily connected to with those who are looking for a place to stay (guests). The cost reduction, the greater access to information, or the increase and diversification of options for tourists have been, in this sense, positive aspects of this phenomenon [28,29,30]. In this field, Airbnb is the most successful P2P platform in world, reaching more than 2,000,000 listings in 190 countries [27,31].
Nevertheless, this transformation of the traditional tourism model has its pros and cons [32,33]. To begin with, it implies a distortion of the traditional hotel tourism model, whose collateral repercussions at the social level and in the labour market have been questioned [34,35]. Undoubtedly, cities benefit directly and indirectly at the local level from traditional tourism as an economic activity. However, this new tourism model reframes the debate about the costs and benefits of mass tourism for cities [36] in two main directions. On the one hand, excessive tourist pressure can affect daily coexistence with the permanent inhabitants of the city, which can generate important social tensions at the local level. On the other hand, the multiplier effects in the economy of this model are not the same as those of the traditional model of hotels, and can in some aspects be closer to those of the aforementioned second residences model [37]. Furthermore, these are not the only socioeconomic derivatives of the Airbnb model. For example, several cases have been detected in which this new model has generated a hyperinflationary phenomenon of the real estate rental market in recent years [38,39]. Another danger of this new model is the risk of a distortion of the traditional image associated with the tourist destination (luxury destinations offered as low-cost [40], coastal areas offered as “party and drunkenness” destinations [41], etc.). This issue can damage the image of a destination in the tourist market (something that costs years of promotion to achieve), but also the sustainability of the destination itself [42].
Therefore, is Airbnb a model that actually generates more pros than cons? Or is this a covert version of the problematic model of second homes? In that field, the phenomenon of feedback between the urban model, the tourism model, and the sustainability of both, understood in its broadest sense, has already been addressed in several studies [9,43]. This feedback is revealed mainly in the development of tourist real-estate bubbles. These bubbles tend to produce a short-term benefit as a result of the heavy consumption of tourist destination’s resources that, however, result in unsustainable or impoverished models in the long term [44]. This question can be of great interest in analysing the sustainability and the consequences of the proposed phenomenon. The current strong growth of this new Airbnb tourism model in many cities can have, as has been seen, strong social and economic implications in its urban transformation process. In this sense, the use of spatial analysis methodologies based on the geostatistical assessment of urban phenomena in a city can be very interesting to quantitatively diagnose the alterations and tendencies oriented towards the unsustainability of this new tourist model [45].
1.2. Current Situation in Spain and Specific Scope of the Study
In Spain, foreign tourism has increased from 52.7 to 82.2 million tourists since 2010, a growth classified by some authors as “tourist bubble” [46]. This phenomenon, which has consolidated the country as the second largest tourist power in the world, focuses mainly on the strong appeal of a series of cities that host millions of tourists each year. In that context, the role that the so-called “P2P tourism of second residences” is playing in these cities is decisive [47]. This new type of tourism, in which the Airbnb platform is the undisputed leader, nevertheless currently has an impact on cities that is difficult to evaluate [48].
Madrid, Barcelona, and Palma de Mallorca are the three main poles of urban tourism in Spain [49]. Hence, in this study, the socio-urbanistic phenomena of these three cities are going to be used as indicators in order to measure the impact of this new P2P tourism model. There are several studies in the scientific literature that analyse this phenomenon from a purely tourist perspective [26,30,32], from a more economic approach [35,38,50], oriented to the social level at the statistical level [33,51], aimed at the point of view of management [29,48], or even incorporating certain spatial analyses [52,53]. Nevertheless, there is hardly a comparative analysis of the impact in different cities, evaluating at a spatial level the relationship between the tourist phenomenon and the socio-urban evolution of its urban areas. For this purpose, the consequences of implementing the Airbnb accommodation platform in the aforementioned cities will be evaluated in different fields through geostatistical tools. The subsequent spatial correlation analysis of GIS indicators will allow us to appreciate the existence of a real estate-tourist bubble with worrying social and urban outcomes for these cities. This methodology of comparative geostatistical analysis of the Airbnb phenomenon raises an innovative approach from an academic point of view, allowing us to open new research avenues in this field. Furthermore, the results obtained can be very useful for local administrations and technical decision-makers in dealing with up-to-date problems such as the increase in rental prices, the planning of infrastructures and services used by tourists, and new growing social phenomena such as urban gentrification.
2. Materials and Methods
Urban spatial analysis is a proven tool for the diagnosis of the patterns of behaviour of tourist models, although its use is not very common in the scientific literature (good recent examples can be however found in [37,52,53,54,55,56]). The P2P real estate tourist market makes very selective use of the cities [51], and is usually developed through spatiotemporal patterns that can be parameterized and measured. In this work, due to its position of broad leadership in the sector and a large percentage share of the market, Airbnb will be used as a model for the global development of all P2P tourism rental platforms. To analyse the behaviour patterns of the P2P Airbnb platform in the cities of Madrid, Barcelona, and Palma de Mallorca, different GIS spatiotemporal indicators will be used. These GIS indicators have been evaluated between the period of April 2015 to February 2018, for different neighbourhoods in the three cities (*.CSV and *.GeoJSON files are included as Supplementary Materials). At a spatial level, it should be noted that in order to obtain comparable graphical and numerical analysis between the different cities, the geographical scope of evaluation for each city was the consolidated urban area included in the GeoJSON file (other delimitations, such as the administrative scope of the municipality, are not adequate because they may not represent territorially homogeneous areas of analysis).
To perform the analysis, two types of data sources have been used: Airbnb data with detailed GIS listings, reviews, and calendar data have been compiled from the corporative Airbnb and the NGO Inside Airbnb websites for the different neighbourhoods of the cities; and geo-referenced parameters of the parallel evolution of the real estate market in the areas have been obtained from geocatalogues from public administrations ([57,58,59]) and national real estate web portal Idealista.com. All this data will generate different spatial weights matrixes. From the spatial evolution over time of these data, two families of indicators have been developed. The first family, which we have called static indicators, tries to compare the current effects of the Airbnb phenomenon in the three cities. The second family, which we have called dynamic indicators, performs a spatial analysis over time in order to show a trend, and discuss future scenarios. The formulation of the indicators of both families is detailed below.
2.1. Static Andicators
Static indicators develop a detailed analysis at a spatial level of the current situation of Airbnb implementation for each city. The indicators analyse, in the different neighbourhoods, the current behaviour of the real estate market and urban phenomena in relation to the configuration of the Airbnb global structure. Through the use of these static indicators, we can compare numerically different impacts of the Airbnb phenomenon in the three cities. This will allow us to obtain a comprehensive visualization in order to perform an objective comparative analysis of the current situation for each city. To avoid possible biases derived from the seasonalization of tourism demand, ratios have been obtained as annual average values. The indicators from this first family are the following:
2.1.1. Global Tourist Saturation Index
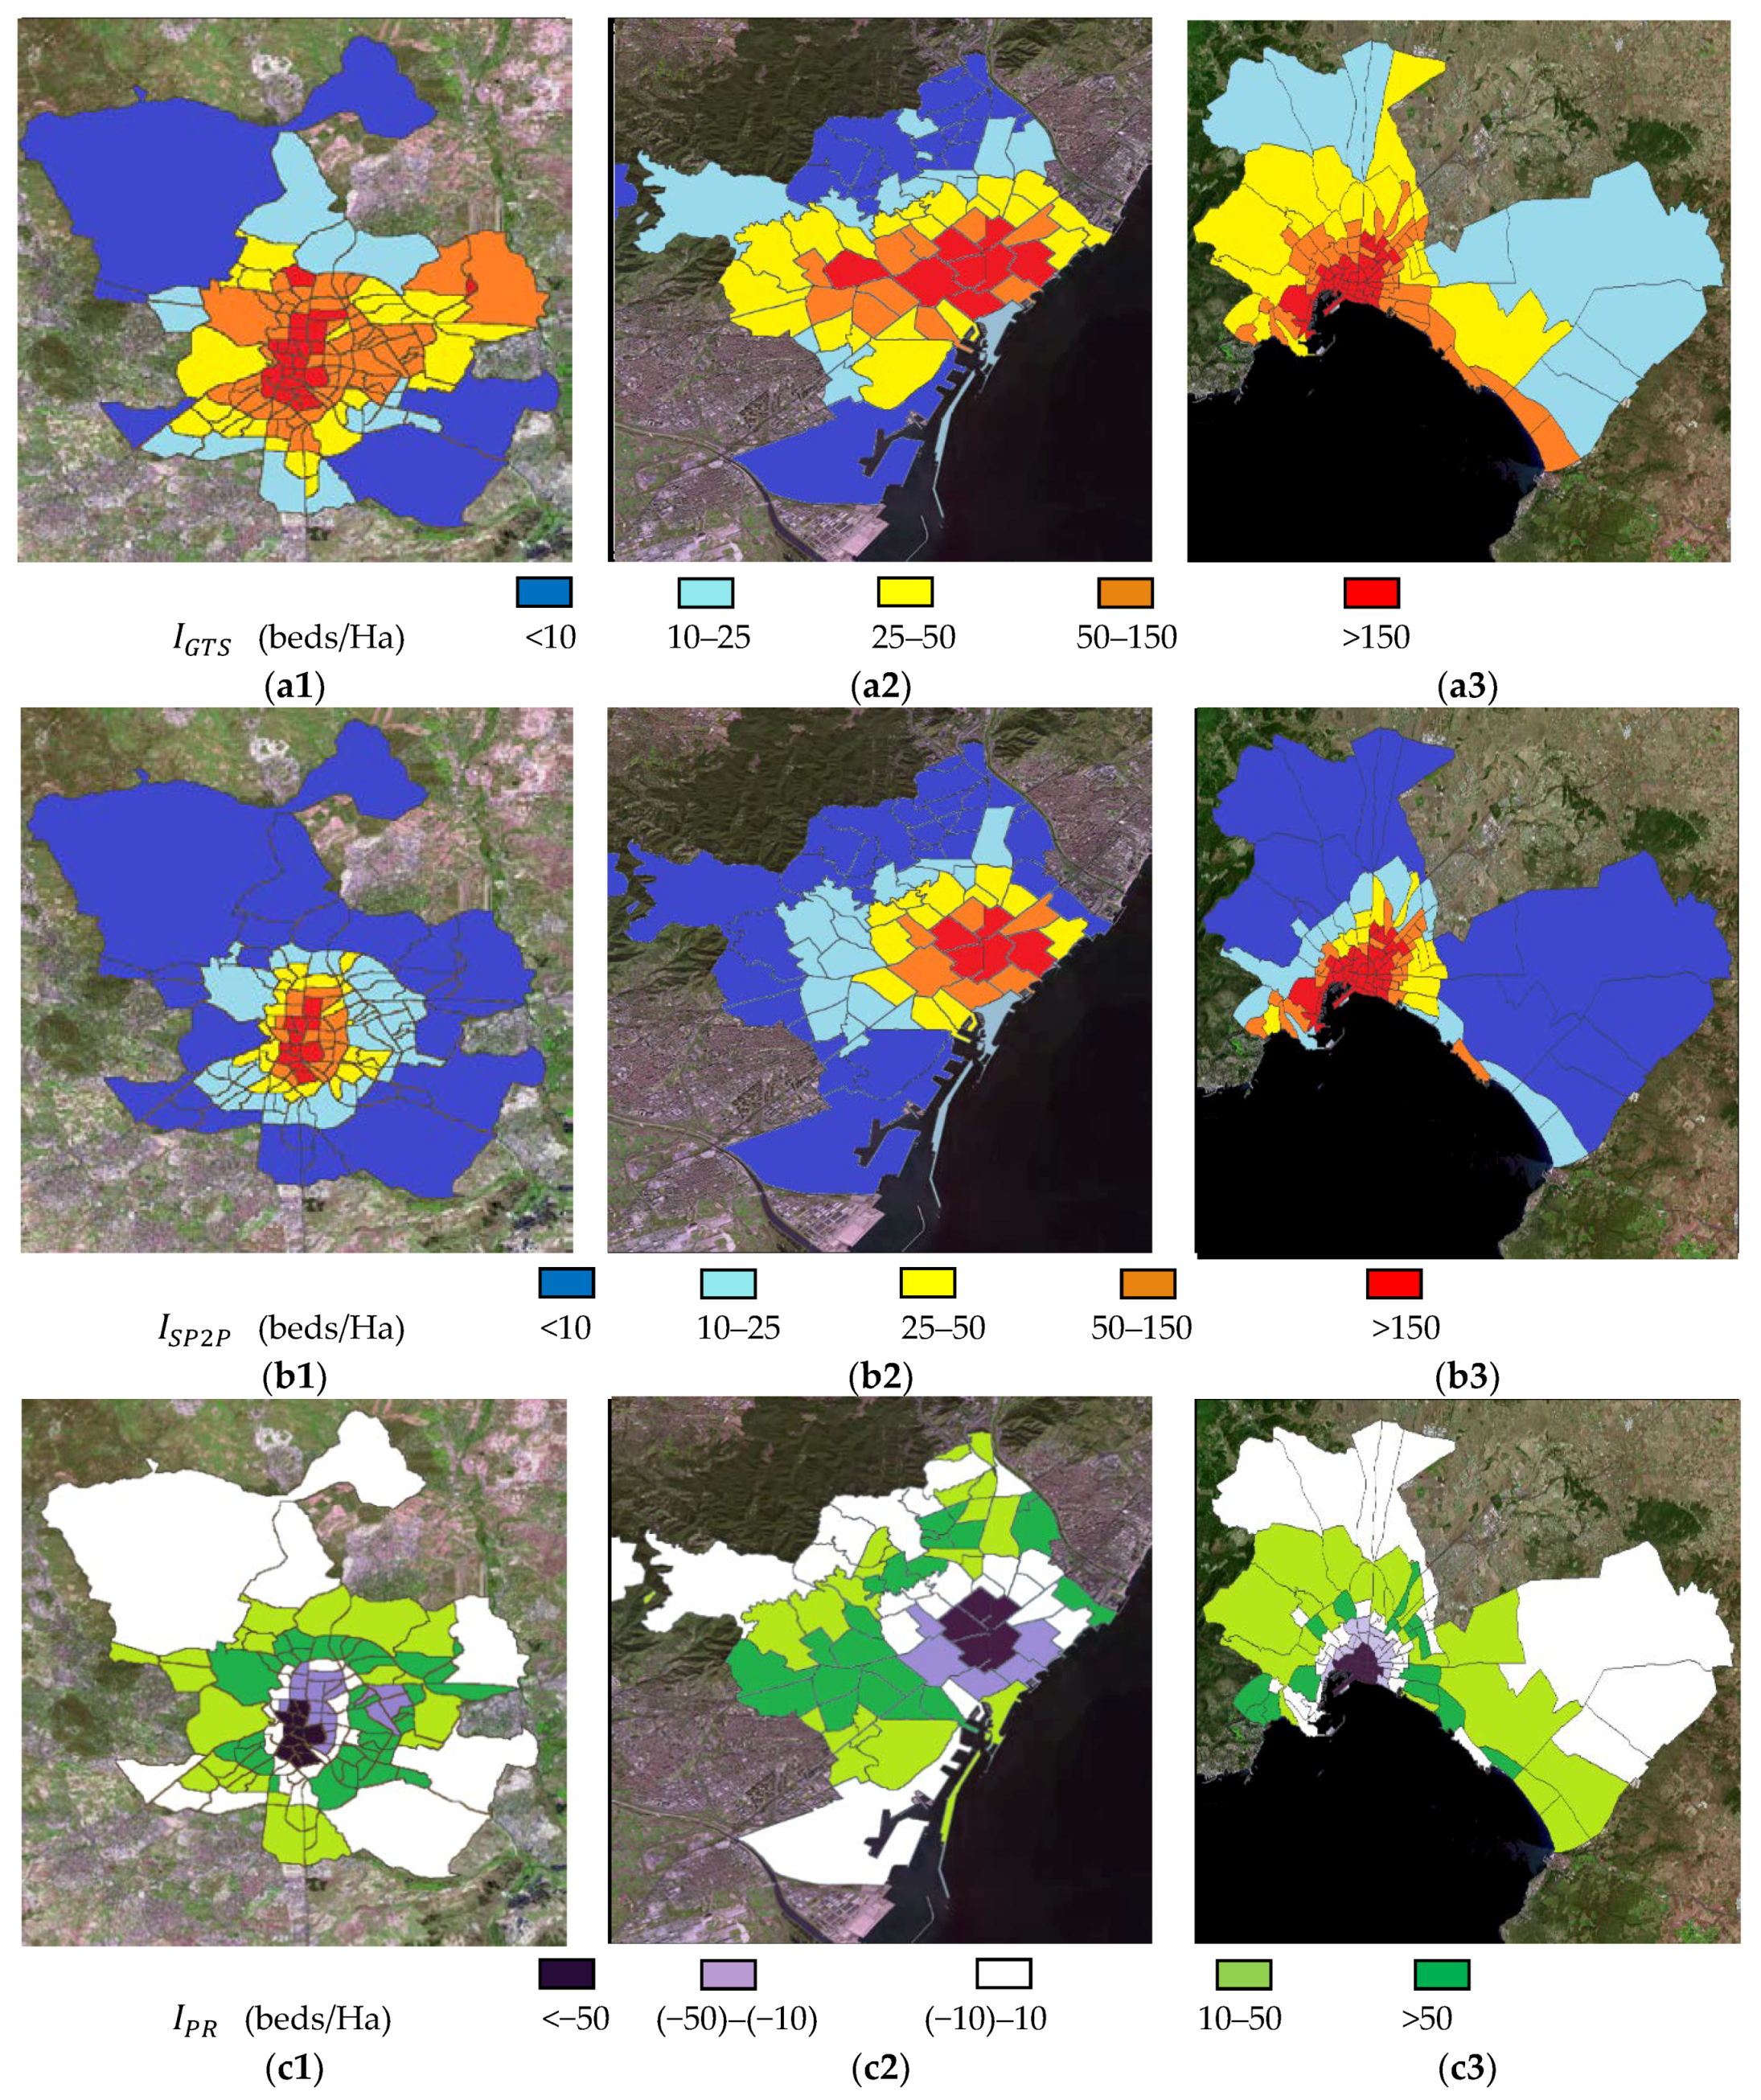
This indicator evaluates the geospatial intensity of the existing tourist offer in the different neighbourhoods of the city. This tourist offer has been taken as the geolocated sum of the normalised intensity rate of the traditional hotel offer plus the supply of the inventory obtained from the Airbnb platform (1).
where is the sum of the hotel offer of beds and the sum of the P2P offer of Airbnb beds for a reference surface in Ha (in this case each neighbourhood).
2.1.2. P2P 2nd Homes Index of Saturation
This indicator evaluates the density of the supply of beds from P2P portals in each of the neighbourhoods of the city. In this case, the geolocated P2P inventory has been limited to the Airbnb platform, which accounts for 80% of the offer in urban centres in the cities analysed (2).
where is the sum of the P2P offer of Airbnb number of beds for a reference surface in Ha (in this case each neighbourhood).
2.1.3. Tourist P2P Prevalence Rate
The spatial behaviour patterns of the hotel and P2P tourism offer are different [60]. This indicator illustrates the spatial prevalence of one over the other by calculating the subtraction of the intensities of both offers. The analysis of this indicator allows us to understand the urban distribution patterns of P2P tourist offers in relation to traditional hotels, and to quantify them by parameterizing their behaviour (3).
where is the sum of the hotel offer of beds and the sum of the P2P offer of Airbnb beds for a reference surface in Ha (in this case each neighbourhood).
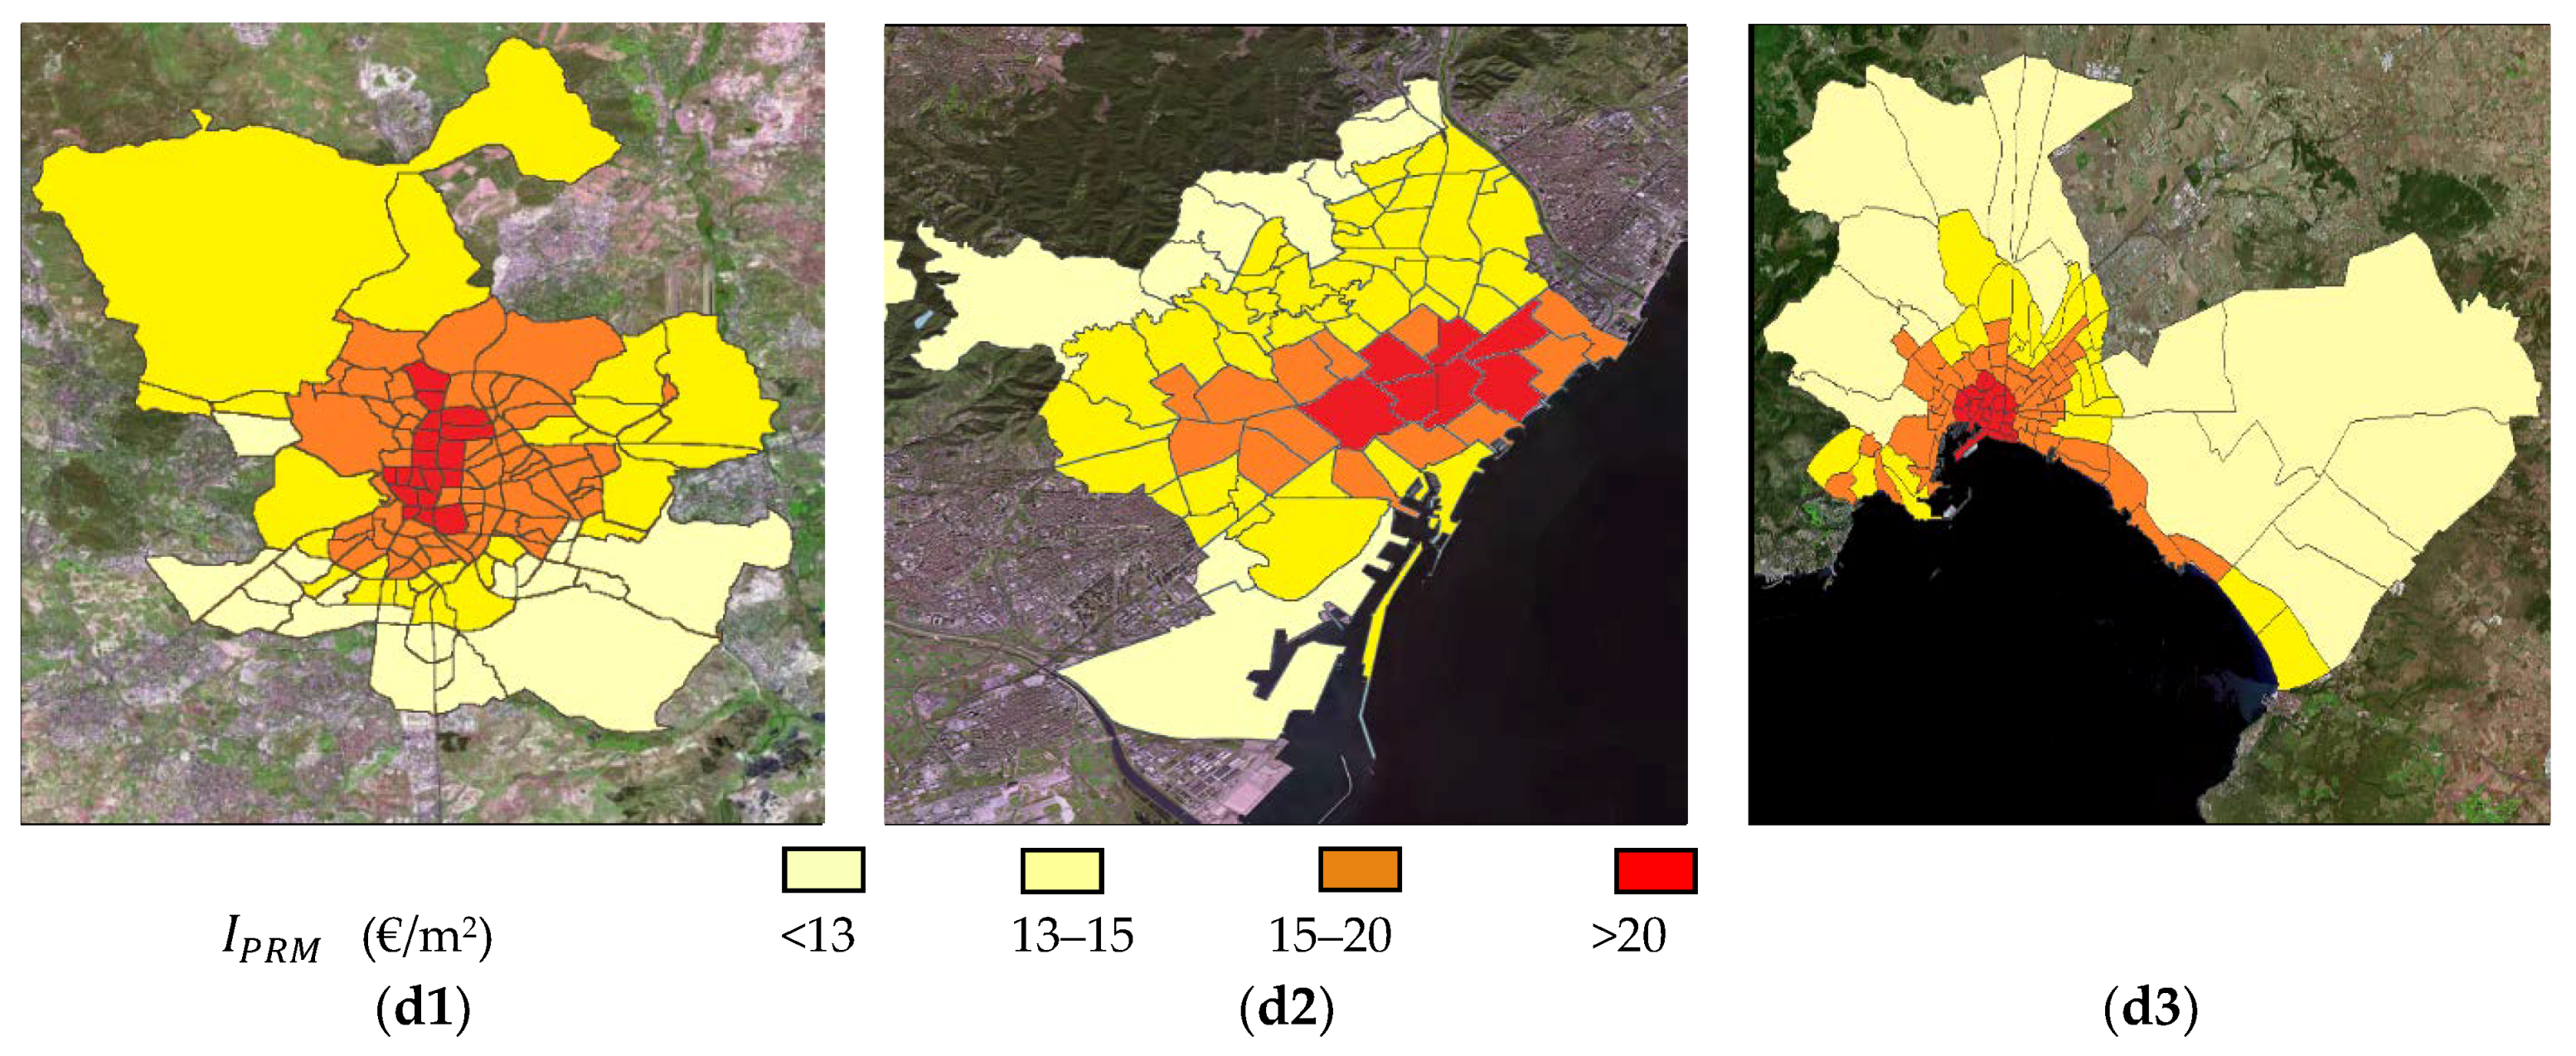
2.1.4. Price Index of the Rental Market
The housing rental market usually tends to be spatially segmented by zones [44]. This market has been influenced by the phenomenon of P2P tourism in some cities, as previously observed in [38,39]. This indicator seeks to analyse, in a comparative way, the spatial behaviour between different cities. In order to carry out this evaluation, values from the Idealista.com web portal for 3 May, 2018 have been compiled and geolocated to obtain average values according to (4).
where is the sum different values of rental housing market in €/m2 offered in the web portal idealista.com for a neighbourhood i and is the number of rental offers published in this website in this neighbourhood of the city.
2.2. Dynamic Indicators
The dynamic indicators will show more complex phenomena introducing the time variables, but acting with data in an aggregate way to simplify their treatment. They are therefore indicators that analyse the parameters in an evolutionary way. Analyses of the values were carried out during the period between April 2015 and February 2018. This will provide a very interesting mapping analysis of the current incidence of urban transformation processes as a consequence of the Airbnb phenomenon. The indicators show the comparative evolution of the Airbnb phenomenon and the real estate market in the city in order to study its possible feedback. This way the spatial correlation and the trend patterns between the phenomena associated with the Airbnb development and the city’s socioeconomic transformation processes will be analysed. The implementation of P2P second homes tourism models in large cities can have an important impact at the socio-urban level, developing phenomena such as gentrification. Therefore, we are largely in front of a socio-economic phenomenon, for which we will take into account the retrofeed between tourism models and urban transformation. The indicators of this second family are the following:
2.2.1. P2P Tourist Pressure Index
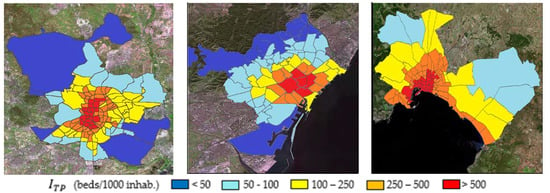
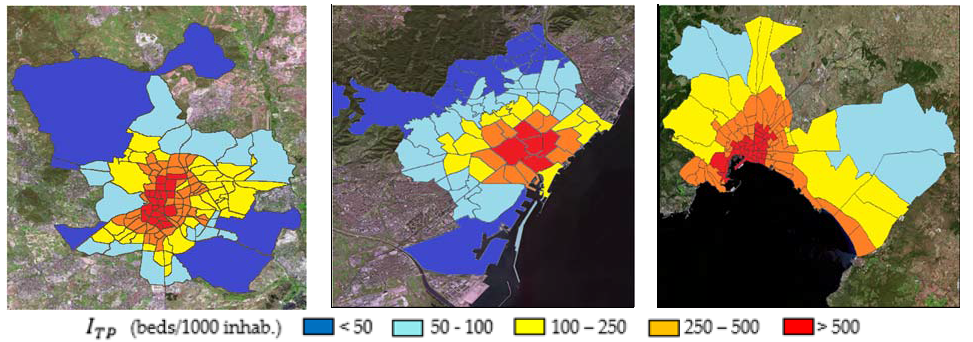
The tourist pressure exerted by the P2P model can be analysed spatially by normalised density maps in cities of diverse sizes. In that context, this indicator illustrates the evolution of Airbnb bed clusters per 1000 habitants in order to enable a comparative analysis of the evolution for different cities. This evolution will be measured during the aforementioned period between April 2015 and February 2018 for different neighbourhoods of the three cities (5).
where is the number of bed accommodations offered by Airbnb for a neighbourhood i during a period j and P is an average rate of population registered by the municipal census in this neighbourhood (for this work it has been taken 1000 inhabitants as average rate).
2.2.2. Increase Rate of the Rental Real Estate Market
There are some studies that relate the value of housing rental prices to the Airbnb phenomenon for some cities [38,50]. Nevertheless, the spatial correlation between the evolution of the rental market and the growth patterns of Airbnb in a city is a barely explored issue. This indicator (based in results of (4) over time) models at a spatial level the degree of intensity in the evolution of the rental market in different neighbourhoods. It shows which neighbourhoods have the highest rate of growth in prices, comparing the average rate of each neighbourhood in one period with the maximum rate found in the neighbourhood with the highest growth for that period. In order to carry out a comparative analysis between cities, the value of this rate has been adimensionalized for each neighbourhood, so that it is purely a percentage indicator (6).
where is the average rate variation of rental real estate market for a neighbourhood i during a period j, and is the maximum average variation rate of a neighbourhood for this period (in this case, j represents the period between April 2015 and February 2018). The data for different temporal milestones have been obtained in €/m2 in each neighbourhood from the Idealista.com web portal.
2.2.3. Index of Social Conflict
A controversial feature of the P2P tourism model is its difficult cohabitation with traditional residents. This question tends to be accentuated in heritage areas and historical urban cores of large tourist cities. This topic is not easy to analyse in a numerical and spatial way. To make a reasonable approximation to the phenomenon, the number of references in local newspapers of social conflicts linked to tourism in each of the neighbourhoods in the last three years have been inventoried from the internet (7). The procedure is based on searching homogeneously for news related to a given neighbourhood, and the issue of social conflict linked to tourism. This can also give us a certain measure of the level of news intensity in each neighbourhood, since it returns a result corresponding to a total number of news items during a period in which there may be the same news repeated several times in different channels of information.
where is the number local news associated to social conflicts linked to tourism found in Google for a neighbourhood i during a period j (in this case j represents the period between April 2015 and February 2018).
2.2.4. Urban Migration Index
Airbnb development influences several effects in real estate patterns of neighbourhoods. A phenomenon that is usually associated with the development of this new model of P2P tourism is that of gentrification [19]. In this phenomenon, the original residents of these traditional neighbourhoods are economically “expelled” to the urban periphery as a result of the increase in rental prices in their neighbourhoods. This effect is often associated in large cities with the P2P market of tourist flats, such as by Airbnb. However, there is scarce research evidence in this field, since it is difficult to analyse this phenomenon numerically and spatially. In this sense, this indicator evaluates rates of transfer of ownership in the last three years for the different neighbourhoods of each city. This can give us an idea of the neighbourhoods that have the most “migratory real estate movement”. The target of this index is to locate spatially the areas with more real estate transfers during a period of time, evaluating the value of each neighbourhood in relation to the neighbourhood with a maximum value. In order to carry out a comparative analysis between cities, the value of this index has been adimensionalized for each neighbourhood so that it is purely a percentage indicator (8).
where is the total number of house ownership transfer licenses registered for a neighbourhood i during a period j and is the maximum number of houses ownership transfer licenses registered for a neighbourhood for this period (in this case j represents the period between April 2015 and February 2018) according to the Official College of Property Registrars [61].
2.3. Spatial Correlation Analysis
Based on the analysis of these indices, the level and features of spatial statistic correlation between the indicators related to the Airbnb tourist phenomenon and those related to real estate and social phenomena of the city will be evaluated. These spatial relationships will be parameterized and assessed through the use of Global Moran’s I (for spatial Autocorrelation, [62]), Getis-Ord Gi (for cold and hot spot mapping, [63]) and Anselin Local Moran’s I (for cluster and outlier analysis, [64]) geoprocessing tools of ArcGIS Desktop 10.5.0 (ESRI, Redlands, CA, USA).
Global Moran’s I statistic will allow us to measure the degree of spatial autocorrelation of the set of geolocated data obtained from indicators and the sign of this autocorrelation (positive or negative). Its statistic formula for spatial autocorrelation is given as:
where is the deviation of an attribute for feature from its mean , is the spatial weight between feature and , is equal to the total number of features, and is the aggregate of all the spatial weights:
The -score for the statistic is computed as:
where:
The spatial GIS autocorrelation returns three values: the Moran’s I Index, z-score, and p-value. Given a set of features and an associated attribute, Global Moran’s I statistic evaluates whether the pattern expressed is clustered, dispersed, or random. When the z-score or p-value indicates statistical significance, a positive Moran’s I index value indicates a tendency toward clustering, while a negative Moran’s I index value indicates a tendency toward dispersion. The z-score and p-value are measures of statistical significance which inform us whether or not to reject the null hypothesis. For this tool, the null hypothesis states that the values associated with features are randomly distributed.
From the set of weighted features, we will identify statistically significant hot spots and cold spots using the Getis-Ord Gi statistic. The Getis-Ord local statistic formula is given as:
where is the attribute value for feature , is the spatial weight between feature and , is to total number of features and:
The statistic is a z-score, so no further calculations are required to obtain it. This parameter will measure the degree of clustering for either high values or low values. This High/Low Clustering tool returns four values: Observed General G, Expected General G, z-score, and p-value. The z-score and p-value are measures of statistical significance which can tell us whether or not to reject the null hypothesis. For this analysis, the null hypothesis states that the values associated with features are randomly distributed. This way, the higher (or lower) the z-score, the stronger the intensity of the clustering. A z-score near zero indicates no apparent clustering within the study area. A positive z-score indicates a clustering of high values. A negative z-score indicates a clustering of low values.
Finally, given this set of weighted features, statistically significant hot spots, cold spots, and spatial outliers will be graphically assessed by using the Anselin Local Moran’s I statistic. This statistic of spatial association is given as:
where is an attribute for feature , is the mean of the corresponding attribute, is the spatial weight between feature and , and:
with n equating to the total number of features. The -score for the statistic is computed as:
where:
This analysis implemented through GIS mapping will allow us to distinguish configuration patterns of High-High clusters (a high value surrounded primarily by high values), Low-Low clusters (a low value surrounded primarily by low values), and spatial outliers, either High-Low (high values surrounded primarily by low values) or Low-High (low values surrounded primarily by high values).
The subsequent bivariate statistical spatial correlation analysis between different indicators will help us to understand Airbnb patterns of development in the cities and its interaction with rental market and urban phenomena. In addition, it will allow us to sketch a first numerical reflection of the impact of the P2P tourism model at a socio-spatial level in the city, a field about which there are scarcely any scientific publications despite being currently a focus of controversy at the media level.
3. Results
The analysis carried out has been structured in three parts. The first develops a comparative analysis of the impact of the Airbnb tourism model in the three cities based on static indicators. The second develops a trend analysis in each of the cities based on dynamic indicators; this second analysis will allow us to propose future scenarios whose hypothetical effects will be discussed in the following section. The third part of the analysis will evaluate how the analysed phenomena interact and correlate the different GIS indicators with each other. This analysis of the existing spatial correlation will allow to establish patterns of behaviour of the different indicators. The reliability and generalization of these patterns will also be discussed in the later section.
3.1. Comparative Static Analysis between the Three Cities
In this first stage, the different indicators for each of the three cities in all neighbourhoods have been calculated. The ratios are annual average values from February 2017 to February 2018. To simplify the comparative analysis, the mean, minimum, and maximum values in the neighbourhoods of each city have been summarized in Table 1. The main aggregated values have been illustrated by means of the geoprocessing of a GIS density map, as shown in Figure 1.
If we analyse together the numerical tables and the density maps, we can observe several issues at a comparative level. In relation to the tourist activity corresponding to the three first static indicators, we find certain differentiated patterns in the cities. For example, the Global Tourist Saturation Index and the P2P 2nd homes Index of Saturation show a similar global behaviour, with some specific differences. The order of magnitude of the minimum, average, and maximum values of the cities is relatively similar, although there is less dispersion, for example, of extreme values in the city of Palma de Mallorca. This question may be related to the purely tourist nature of this third city, compared to others, whose activity is more diversified. Another interesting aspect is that despite being able to observe a global distribution of the offer between hotels and Airbnb at 50%, the values of the second indicator are much more accentuated in their distribution. This indicates, as can be seen in the normalized density maps, that the Airbnb model tends to geographically concentrate its supply more than the hotel model in certain areas of the city compared to others.
This phenomenon is explained much better thanks to the spatial analysis of the following indicator. If we look at the numerical values of the Tourist P2P prevalence rate , no common pattern or any significant differential element between the cities is detected. Nevertheless, the spatial distribution of these values is more revealing, demonstrating a common differential pattern in all cities in favour of Airbnb for the central urban areas, another differential in favour of hotel supply in the most peripheral or singular areas (e.g., airports), and indifferent behaviour in the periphery. In this sense, it is interesting to observe how a spatial distribution by crowns tends to be generated, in which the central crown is the one with the highest balance in favour of Airbnb. However, this distribution does not follow gradual parameters, since the outer ones do not correspond to those with the highest balance in favour of hotel density. The order from outside to inside is rather (i) without significant differences (neutral zone), (ii) with a slight balance in favour of hotels, (iii) with a strong balance in favour of hotels, (iv) without significant differences (neutral zone), (v) with a weak balance in favour of Airbnb, or (vi) with a strong balance in favour of Airbnb.
A similar issue can be appreciated in the indicator Price index of the rental market . This indicator does not offer numerical information of relevance at a numerical level (the average differences between the cities were expected). In this sense it should be noted that the values in Palma de Mallorca are notably lower than those in Madrid and Barcelona. However, it must be emphasized that the work sample is much smaller in this case (1082 in Palma compared to 11,475 in Madrid and 9368 in Barcelona), which may reflect other real estate problems. On the other hand, the spatial distribution may be more interesting, since it seems to show in all cities some clues about possible clustering phenomena linked to the impact of Airbnb tourism. Even so, this hypothesis is still very incipient at this point of the analysis, since there are numerous factors that influence the price of the rental market, regardless of the so-called “tourist flats” (as for example the differences of north-south behaviour in Madrid). Therefore, it will be necessary to wait for the subsequent statistical analysis of spatial correlation between various indicators to delve deeper into this matter.
3.2. Trend Analysis Based on Dynamic Indicators
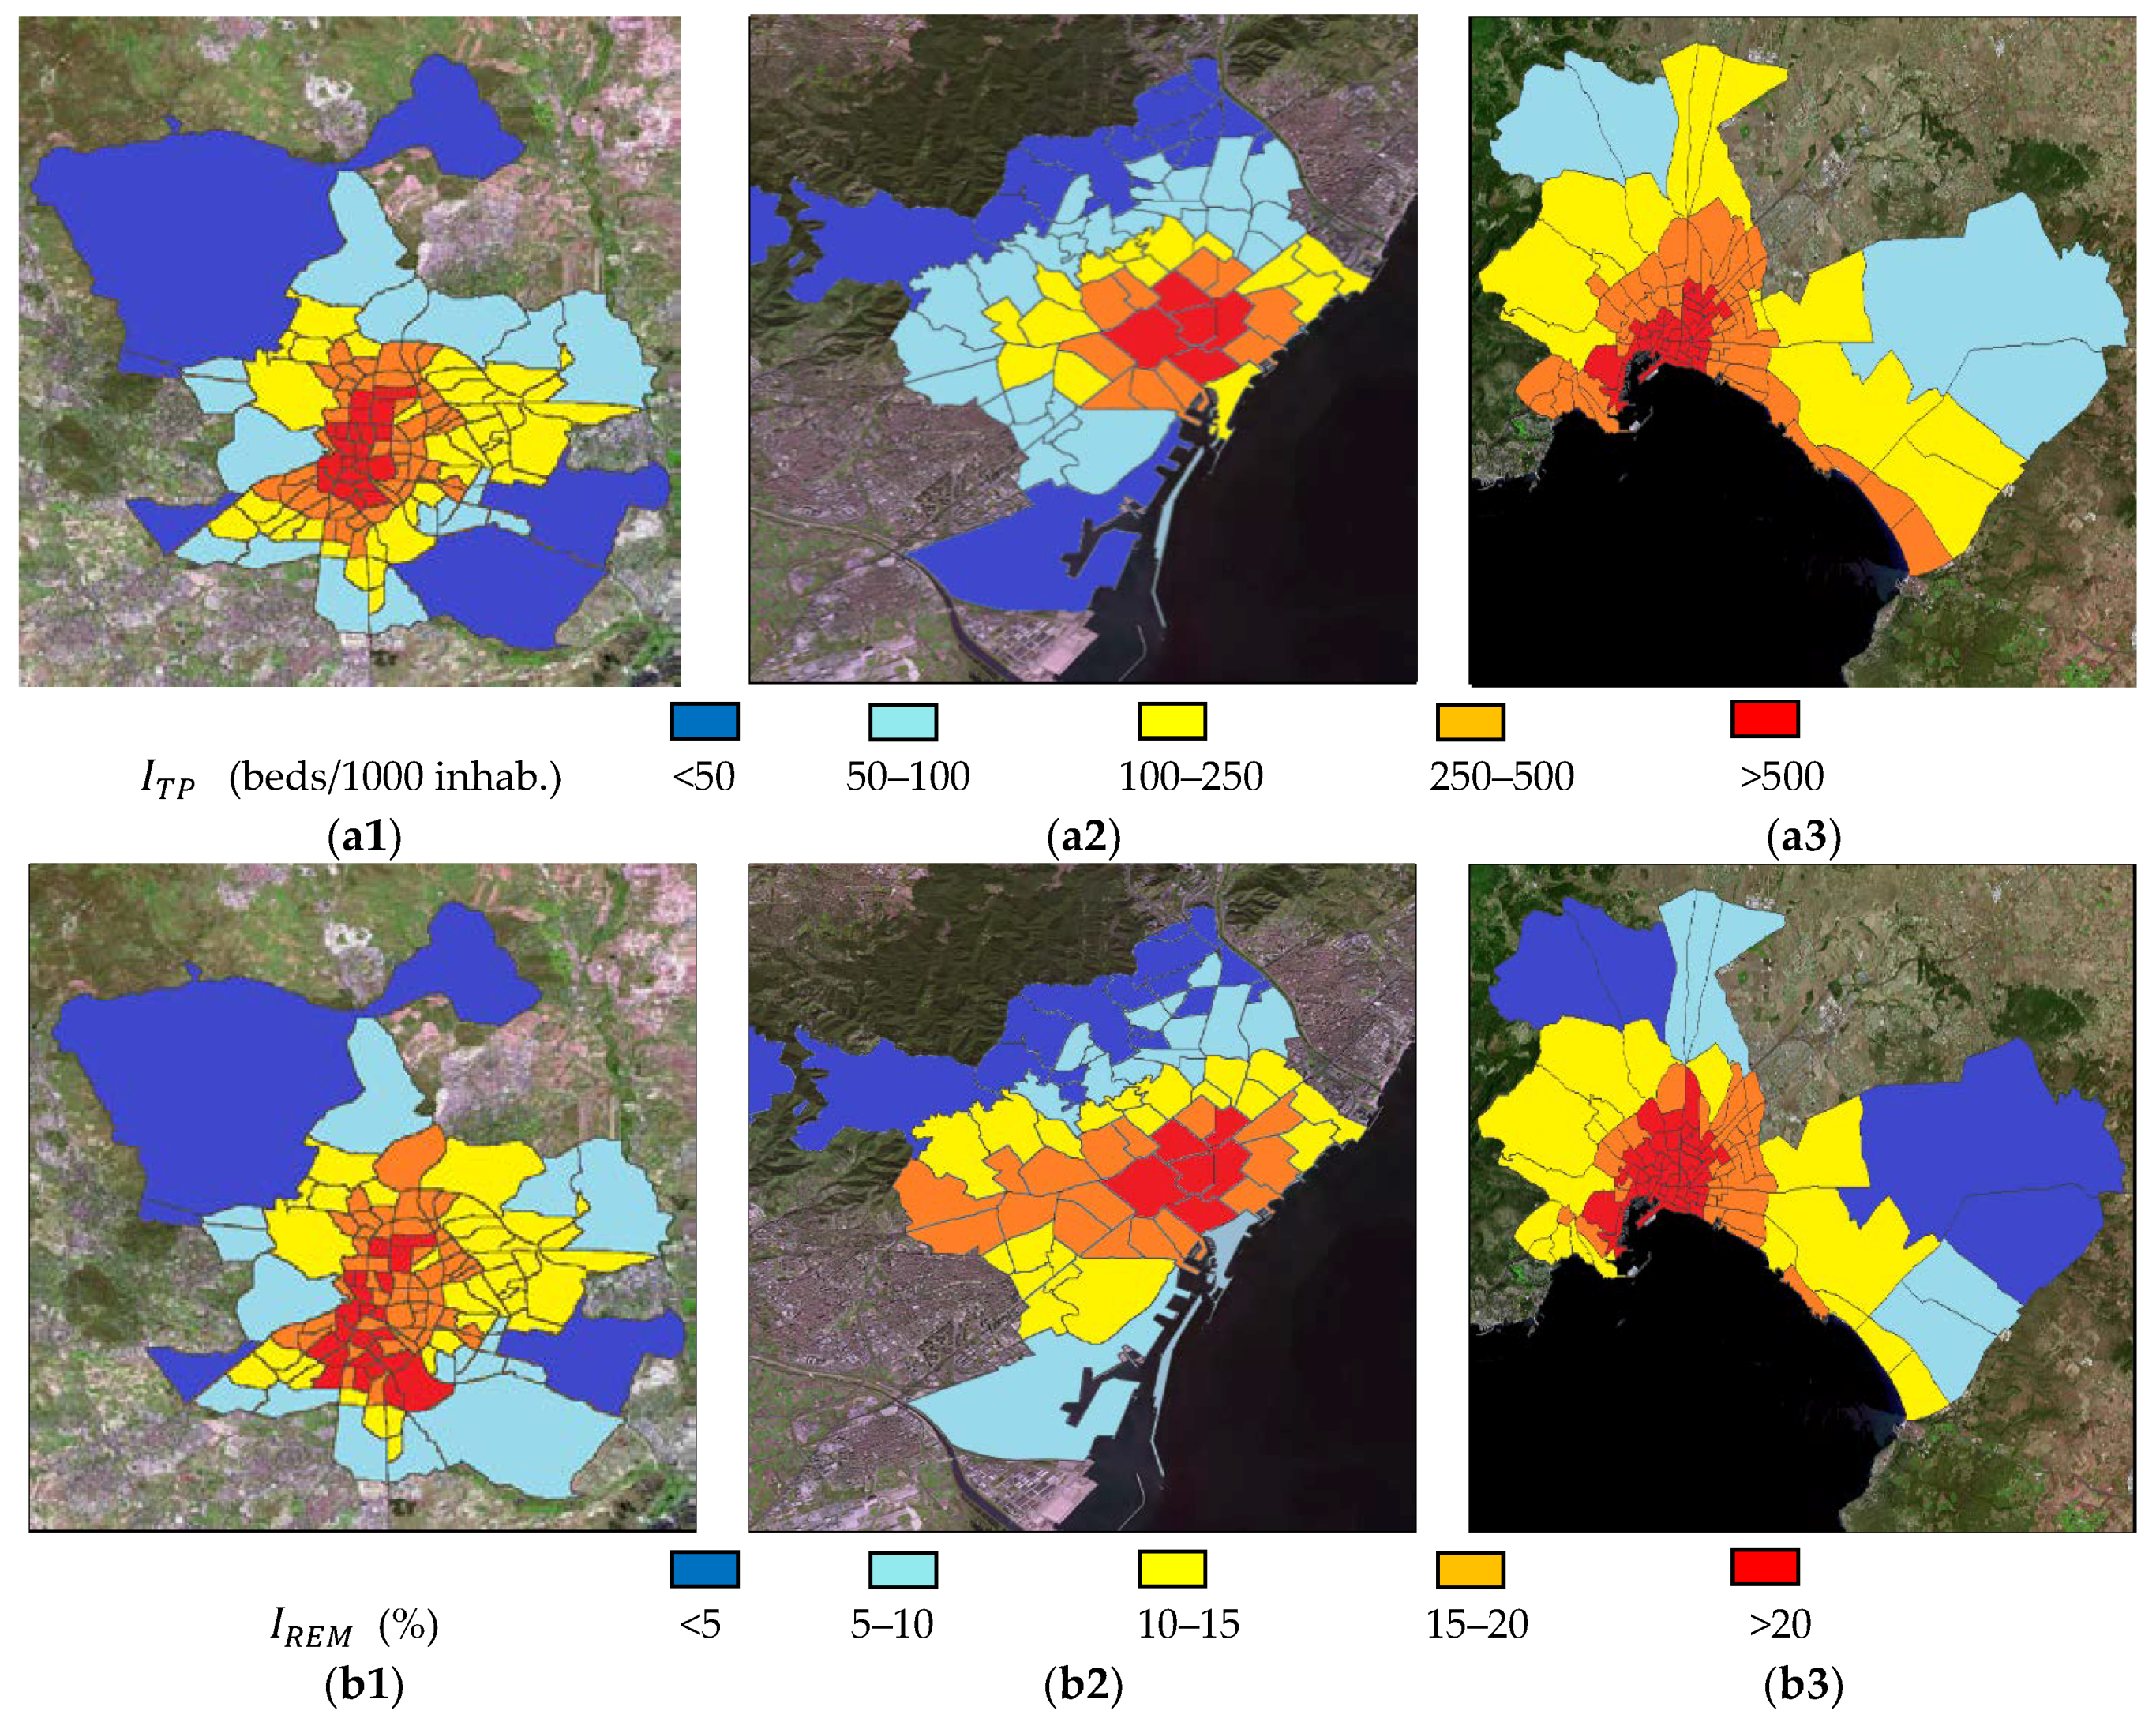
In this second stage, the dynamic indicators are studied by introducing the time variable in the analysis (see videos from supplementary material). For the calculation of this second family of indicators, a study period from April 2015 to February 2018 was taken. This stage not only allows us to perform a comparative analysis between the cities as in the previous case, but also to approach future scenarios by analysing trend lines in the behaviour patterns of the studied indicators. The results obtained in this second part can be observed in a summarized and aggregated way at the numerical level, shown in Table 2, and at the graphic level, shown in Figure 2.
First, if we analyse the evolution of the P2P Tourist Pressure Index we can observe how this value has been increasing numerically at an average level in the last years for the three cities. If we disaggregate the monthly data, it is interesting to see how this trend accelerates over the months. Even more interesting is the spatial analysis by neighbourhoods, since we can clearly see how the highest and lowest values for this period tend to cluster (see video in Supplementary Materials). This phenomenon allows us to intuit a possible spatial correlation with other variables in the urban implementation patterns of Airbnb. This hypothesis will be analysed in the following section by the HH and LL density indicators of Global Moran’s I, Getis-Ord Gi, and Anselin Local Moran’s I statistics.
The dynamic behaviour of the real estate rental market raises similar indications. At the numerical level, a certain average growth is observed for the index. But it is especially interesting to observe how this phenomenon occurs in a strongly heterogeneous way, with increases of average values of over 40% in some neighbourhoods. This phenomenon shows a behaviour that seems to have similar patterns to the clustering phenomenon of Airbnb implantation. As in the previous case, this phenomenon will require some analysis of the spatial correlation between indicators in order to corroborate these hypotheses.
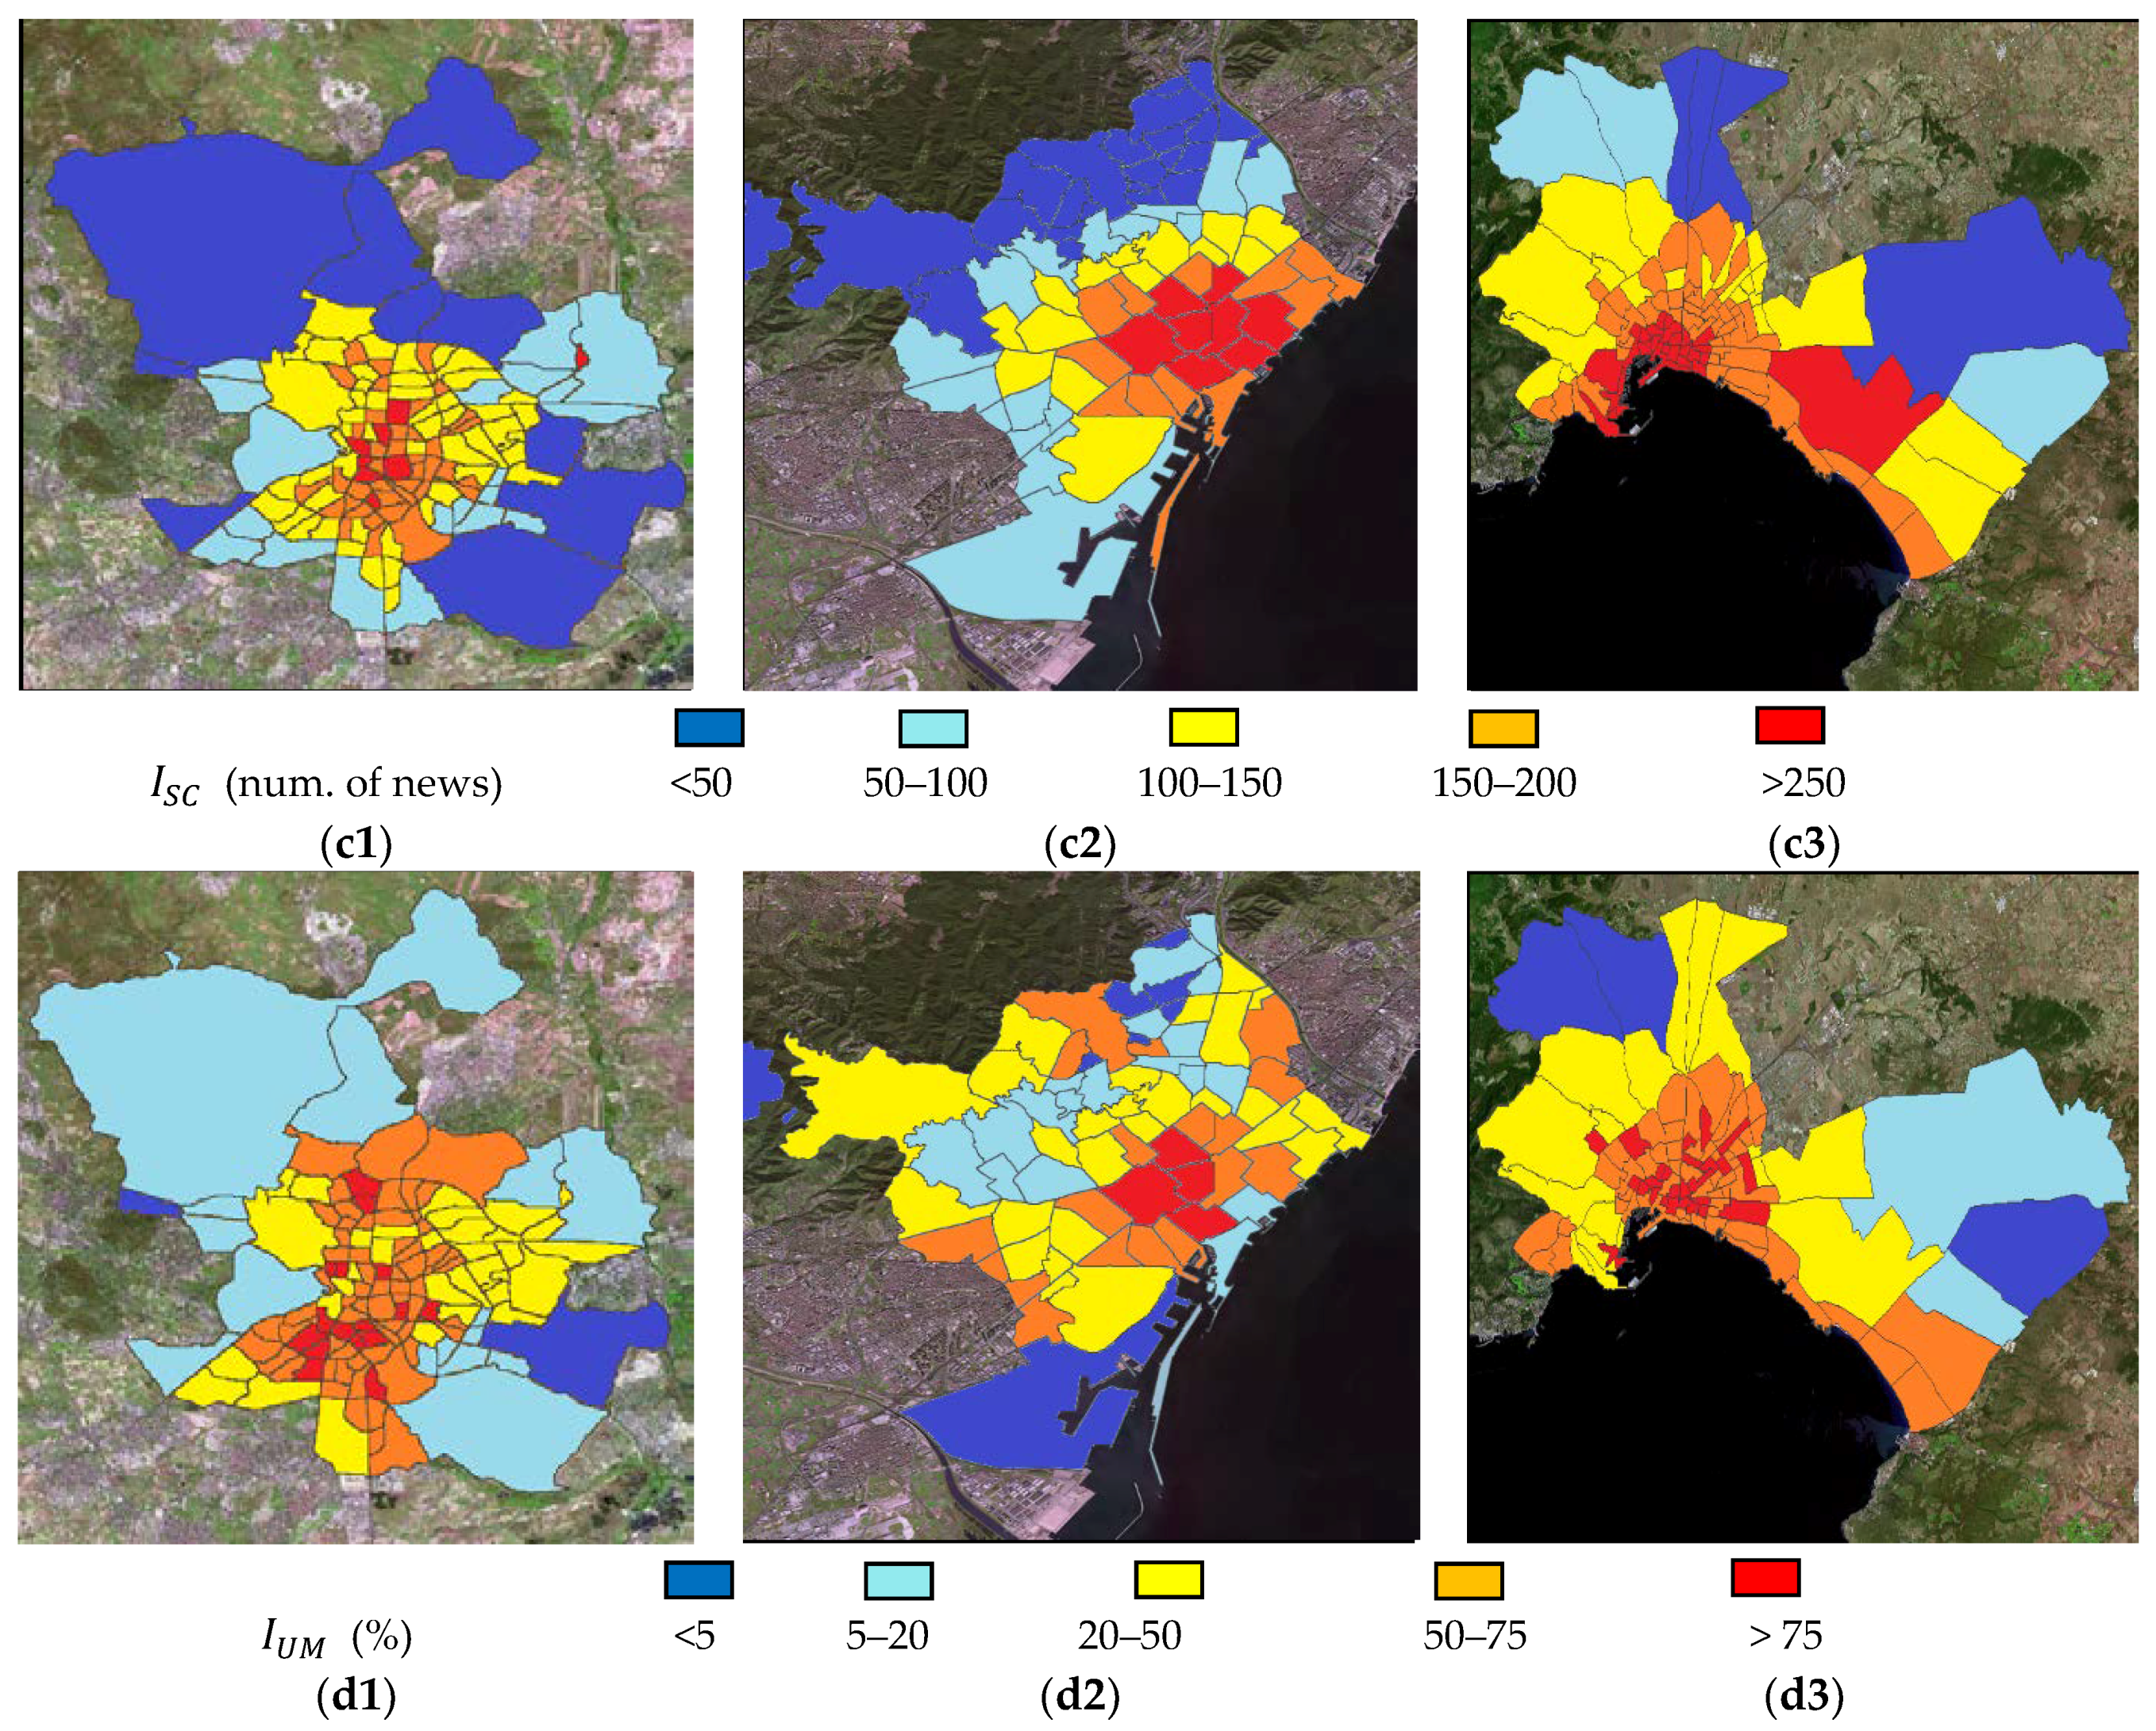
In the social field, the Index of social conflict also seems to show a similar behaviour. At the numerical level, there is a certain increase in the number of news items appearing on the internet, relating several miscellaneous conflicts with tourists. However, this could be explained by many other factors, such as the increase of local information media in the web or the relative weight of tourism in information for a city. Nevertheless, it is interesting to observe that if we segregate and distribute this total number of news by neighbourhoods in a geolocated way, the distribution patterns show a certain similarity in time with those of the indicator.
Finally, if we analyse the behaviour of the real estate market at the level of purchase and sale of housing, we can observe patterns similar to the previous cases (in this indicator we have to take into account the size effect of cities). At the numerical level, there is sustained growth in all cases (which could be motivated by factors other than those analysed, such as the recovery of the real estate market as a result of the overall improvement in the economy). The most interesting results are observed at a spatial level. The largest increase in this section is concentrated in very specific neighbourhoods (20% of the surface accumulates almost 50% of the transactions), with density distributions that have certain similarities to those of the previous indices. This heterogeneous distribution may be revealing of certain phenomena of urban gentrification. In order to corroborate and numerically quantify all these hypotheses, we will proceed to develop the statistics of spatial correlation between indicators in the following section.
3.3. Statistical Spatial Correlation between Tourist and Urban GIS Indicators
In order to study possible spatial autocorrelation phenomena, density normalised data of indicators have been analysed statistically (absolute values would not have been valid directly due to the different size of the cities). As stated before, the spatial relationships are assessed through the geoprocessing statistics Global Moran’s I, Getis-Ord Gi and Anselin Local Moran’s I with ArcGIS Desktop 10.5.0.
First we will check the statistical significance of the detected location patterns by Global Moran’s I statistic. If we analyse the Airbnb saturation index and the Price index of the rental market through Global Moran’s I statistic, we observe a strong positive spatial autocorrelation. In the same way, positive values are also observed for the global index that represents the sum of the hotel and Airbnb distribution. Nevertheless, in the index that shows the difference of both the spatial correlation is not appreciated. Similar circumstances with some nuances can be observed in the spatial statistical significance of dynamic indicators. On the one hand, strong autocorrelation is found for and . On the other hand, moderate values are detected in , and rather low values can be found in (Table 3).
At a spatial level, in the field of static indicators, it is interesting to observe how the spatial autocorrelation values of the tourist pressure are usually higher compared to the values of the tourist pressure. This is a consequence of the more clustered distribution of the Airbnb model compared to the traditional hotel model. Airbnb tends to concentrate its offers much more in urban centres and historical districts (exerting a more concentrated pressure in those areas), in comparison with the hotel offer (which is spatially more diversified). In the case of dynamic indicators, it can be observed that, although all are statistically significant at the level of spatial autocorrelation, the more social indicators and present somewhat lower values. This incidence may be largely due to the fact that the work sample in these indicators is smaller and less precise at the geolocation level.
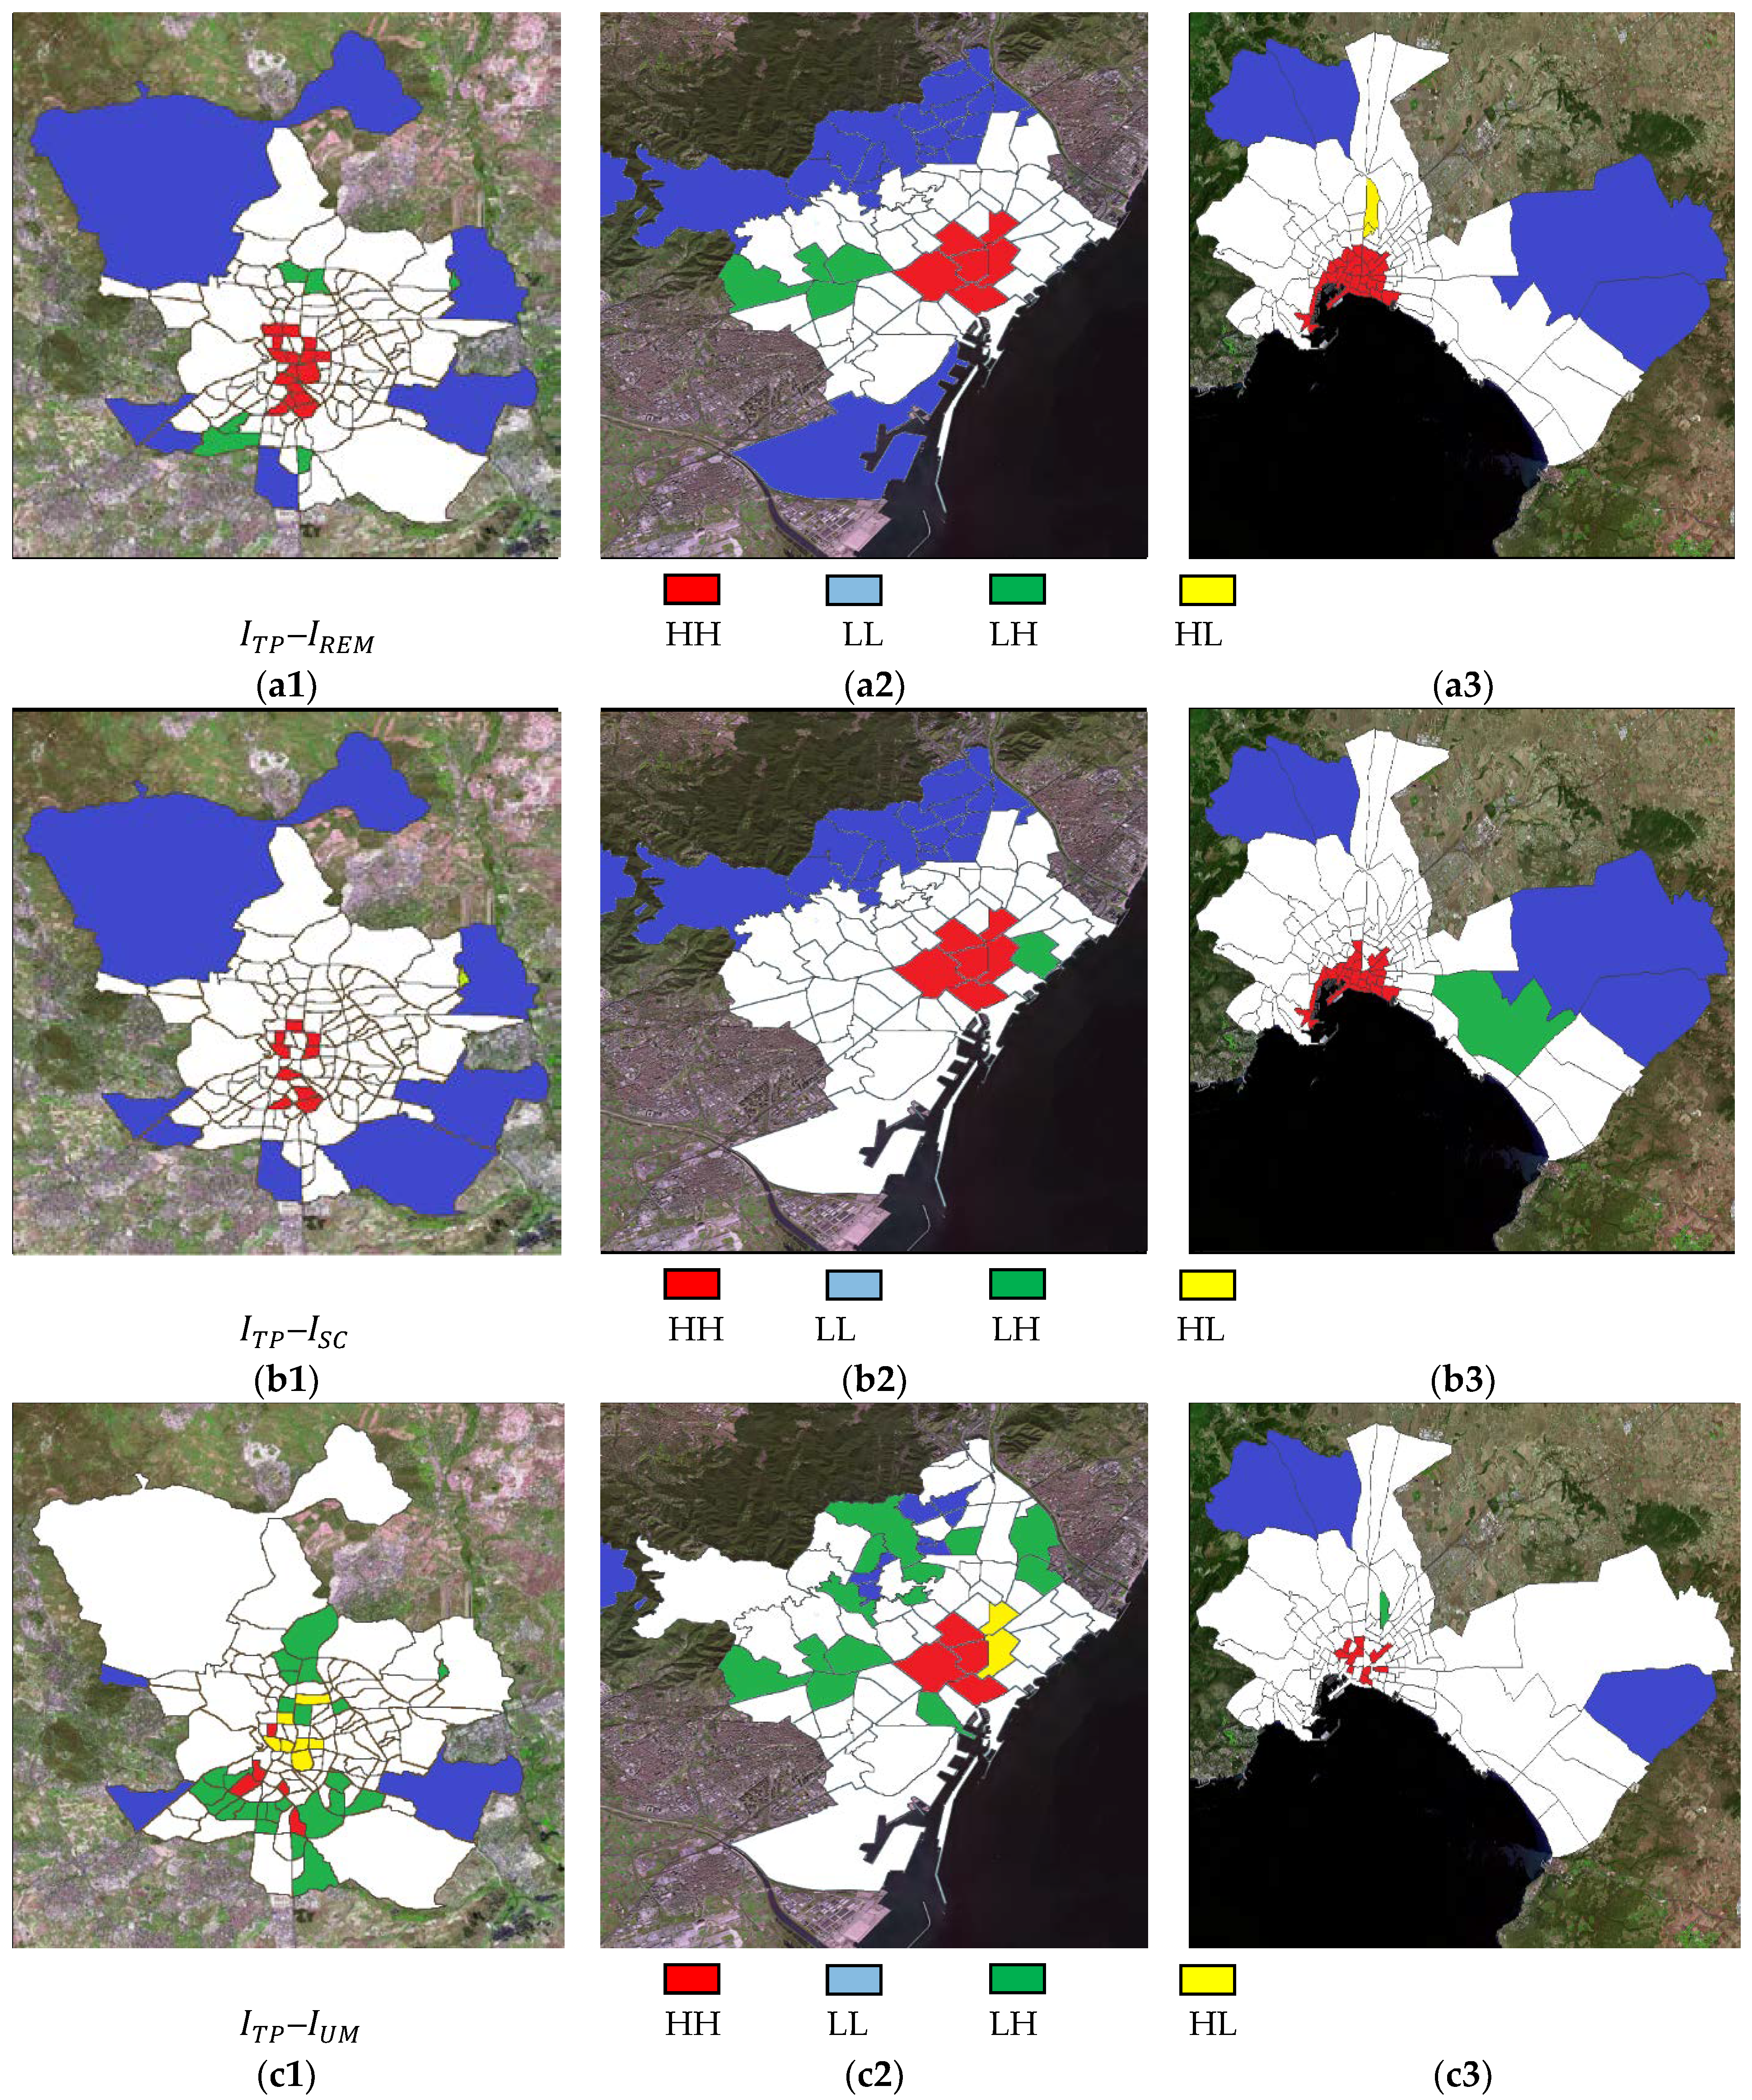
Then, if we perform a Getis-Ord Gi, mapping we can identify for cold and hot spots. These areas have been analysed through Anselin Local Moran’s I index to assess clusters and outliers. If we disaggregate all this analysis through bivariate geostatistics, we can evaluate the degree of spatial correlation between the different indicators. In this field, it is particularly interesting to assess within the dynamic scope the degree of spatial correlation between the indicator of the evolution of the implementation of Airbnb with the evolution indicators of the rental real estate market, the index of social conflict and the index of urban migration (Figure 3 and Table 4).
Bivariate spatial autocorrelation analysis reveals a close global spatial association between the Airbnb Tourist Pressure Index and the rest of dynamic indicators for all cities, but with different nuances for each correlation analysis. At the real estate market level, it is clear how there is a strong hot zone HH in the centre and a cold zone LL in the periphery for all cases. The emergence at a spatial level of some LH outliers is also appreciated (hot areas for real estate market with no linkage to Airbnb phenomena). This question may respond to the fact that representative but non-tourist areas of the city (Avenida Diagonal in Barcelona, Financial Center and Nuevos Ministerios in Madrid, etc.), are “dragged down” by the global growth of the rental real estate market boosted by P2P tourist phenomena.
A similar behaviour (but more accentuated) exists between the effect of Airbnb and the social conflict linked to tourism. In this case, a great predominance of cold zones LL and hot HH is very clearly observed. Therefore, a clear correlation between both indicators can be verified as a consequence of the scarce number of outliers, both at the level of LH and HL. It should be noted that in this case (and in the following), we find z-scores which are proportionally lower than in the first case. This may be due to the fact that the samples to be correlated are not so similar in size and accurate in geolocation for the and indicators, as mentioned in the previous section.
The third correlation is the most different of the three, and also in this case, the three cities do not show homogeneous behaviour. On one side, it does not offer the classic hot centre HH—cold periphery LL structure. In this case, we observe a hot centre HH, several intermediate areas with outliers or scarce significance, and peripheral areas that could be categorized as high level of LH outlier or even of a certain “temperate” level. This pattern of behaviour may be derived by the so-called gentrification phenomena, in which Airbnb has a significant impact. The expulsion of the traditional resident population from the historic districts to the periphery due to the increase in rents due to P2P tourism could largely affect the hot areas of the centre and the numerous outliers of the periphery. On the other hand, it is interesting to observe how this phenomenon does not occur in the three cities, but is limited to the case of Madrid and Barcelona. In the latter case, although there is a certain clustering in the centre, the global structure of concentration is quite dispersed, being undoubtedly the case with less spatial correlation of the three.
This last item can raise different interpretations. On the one hand, the hypothesis could be raised that, in this case, a phenomenon of gentrification does not occur as in the other two cities. This could lead us to raise the theory that the size effect influences the appearance of gentrification phenomena as a result of P2P tourism. In this sense, in view of the results we could conclude that this phenomenon is only achieved in large cities, and requires a minimum city size to occur (Palma de Mallorca is a city with 4 times less population than Barcelona and 8 times less than Madrid). On the other hand, another possibility is that the size effect may also have an influence, without implying that there is no urban gentrification phenomenon. In this case, the results obtained would be due to the territorial idiosyncrasy of the city of Palma de Mallorca itself. Being a medium-sized city on the Mallorca island, the “expelled” original population would have moved to other nearby towns on the island instead of peripheral neighbourhoods of the city itself, thus being replaced by Airbnb tourists, in a clear example of gentrification on a large scale. All these questions will be discussed in more detail in the next section “Discussion”.
4. Discussion and Conclusions
The results obtained shed some light on the Airbnb phenomenon and its consequences. However, in addition to providing several answers, they also generate new questions. In the first place, it should be noted that we are facing a relatively recent phenomenon. This is a company and associated tourism model created both just 10 years ago, which have really been consolidated worldwide in the last five years. Therefore, there are no studies in the scientific literature that cover a long period of time or results that corroborate trends contrasted in a sustained manner over time. There are also no consolidated studies from the numerical and applied point of view that address the Airbnb model issues from the adopted perspective. The existing studies on the subject tend to approach the Airbnb phenomenon from a fundamentally tourist perspective (accommodation, customer opinions, etc. [31,32,44,47,65,66]). These perspectives usually obviate their socioeconomic consequences at an urban and territorial level. We can find segmented studies from topics analysed here, like the impact in rental market [38,39], or the mapping distribution of tourist accommodation [32]. Nevertheless, the spatial patterns and the impacts in the city are quite unknown. There are some recent approaches to this matter from a spatial perspective [52]. Even so, knowledge of how it interacts with the real estate market and with its social environment has not been spatially and numerically stated, so far.
In this sense, the results obtained show interesting conclusions about the impacts of the Airbnb phenomenon in the main tourist cities of Spain. We have observed that Airbnb does not follow the same implantation patterns as hotels. This new tourist model territorially concentrates its impact in the centre of the cities. In addition to heritage areas, it is usually residential neighbourhoods of traditional character that are subjected to a strong tourist pressure. This phenomenon generates a difficult cohabitation, both socially and economically. A close spatial correlation has been verified at the geostatistical level between the configuration of indicators from touristic pressure of the Airbnb model and the one of indicators from alteration of the rental real estate market, social conflict for tourism, and urban migration.
In this context, what is the real impact of Airbnb in the real estate market of cities? Airbnb usually argues that its offer barely reaches 2% of the overall offers of the rental market in the cities. This premise is true in the three cities analysed. Nevertheless, this argument does not imply that it cannot generate an upward change in market prices, as this statement might suggest. As we have seen, the distribution of the Airbnb offer is concentrated at the spatial level, which produces imbalances in the affected areas. In addition, these areas (urban centres, traditional neighbourhoods, and heritage districts) are usually “trend generating” areas in the real estate market, which may lead to a certain “drag effect” on the global rental real estate market in the rest of the city. As we have also observed, all these patterns generate other social imbalances, leading to a phenomenon of “tourist gentrification”.
Nevertheless, the urban gentrification phenomenon due to Airbnb tourism raises several questions. Can this phenomenon occur in all tourist cities? Does it always follows the same patterns? Does it always have the same socio-economic effects? Some of these questions cannot be answered categorically with just this study, that only opens a new field of research in the matter, open to future more specialized studies. It is evident that, in this case, “size matters”. In the analysed cities, the phenomenon does not seem to affect large and medium cities equally. On the other hand, we find common behaviour patterns, but not identical ones. What is clear is that this new model of P2P tourism, more technological and adapted to the needs of the user of the XXI century, raises certain controversies about its impact on the status quo of cities. Therefore, the hitherto unquestioned global economic benefits of tourism now pose serious questions at the local socioeconomic level.
In this sense, special attention must be paid to the current trend in this recent phenomenon from the point of view of sustainability. We must bear in mind that mass tourism consumes resources from cities, and needs important infrastructures and services. From this perspective, excessive overcrowding in certain areas can lead to a devaluation of the city itself as a tourist product [8]. In addition, in the case of a demand with a strong seasonality component, this often forces cities to oversize their infrastructures and services, generating imbalances and inefficiencies in the use of existing resources [54].
That is why, as previously mentioned, it is important to remember that we are facing a problem with only 5 years of clear and consolidated implementation in the main cities of the world. Consequently, the studies existing so far in the field cannot yet analyse the true magnitude of this phenomenon, as we are probably just facing “the tip of the iceberg”. In this context, some municipal administrations have begun to take measures in the matter, but which are more based on political approaches rather than detailed technical analyses (the municipality of Palma de Mallorca decided to forbid the rental of multi-family dwellings to tourists in the city in April 2018, for example).
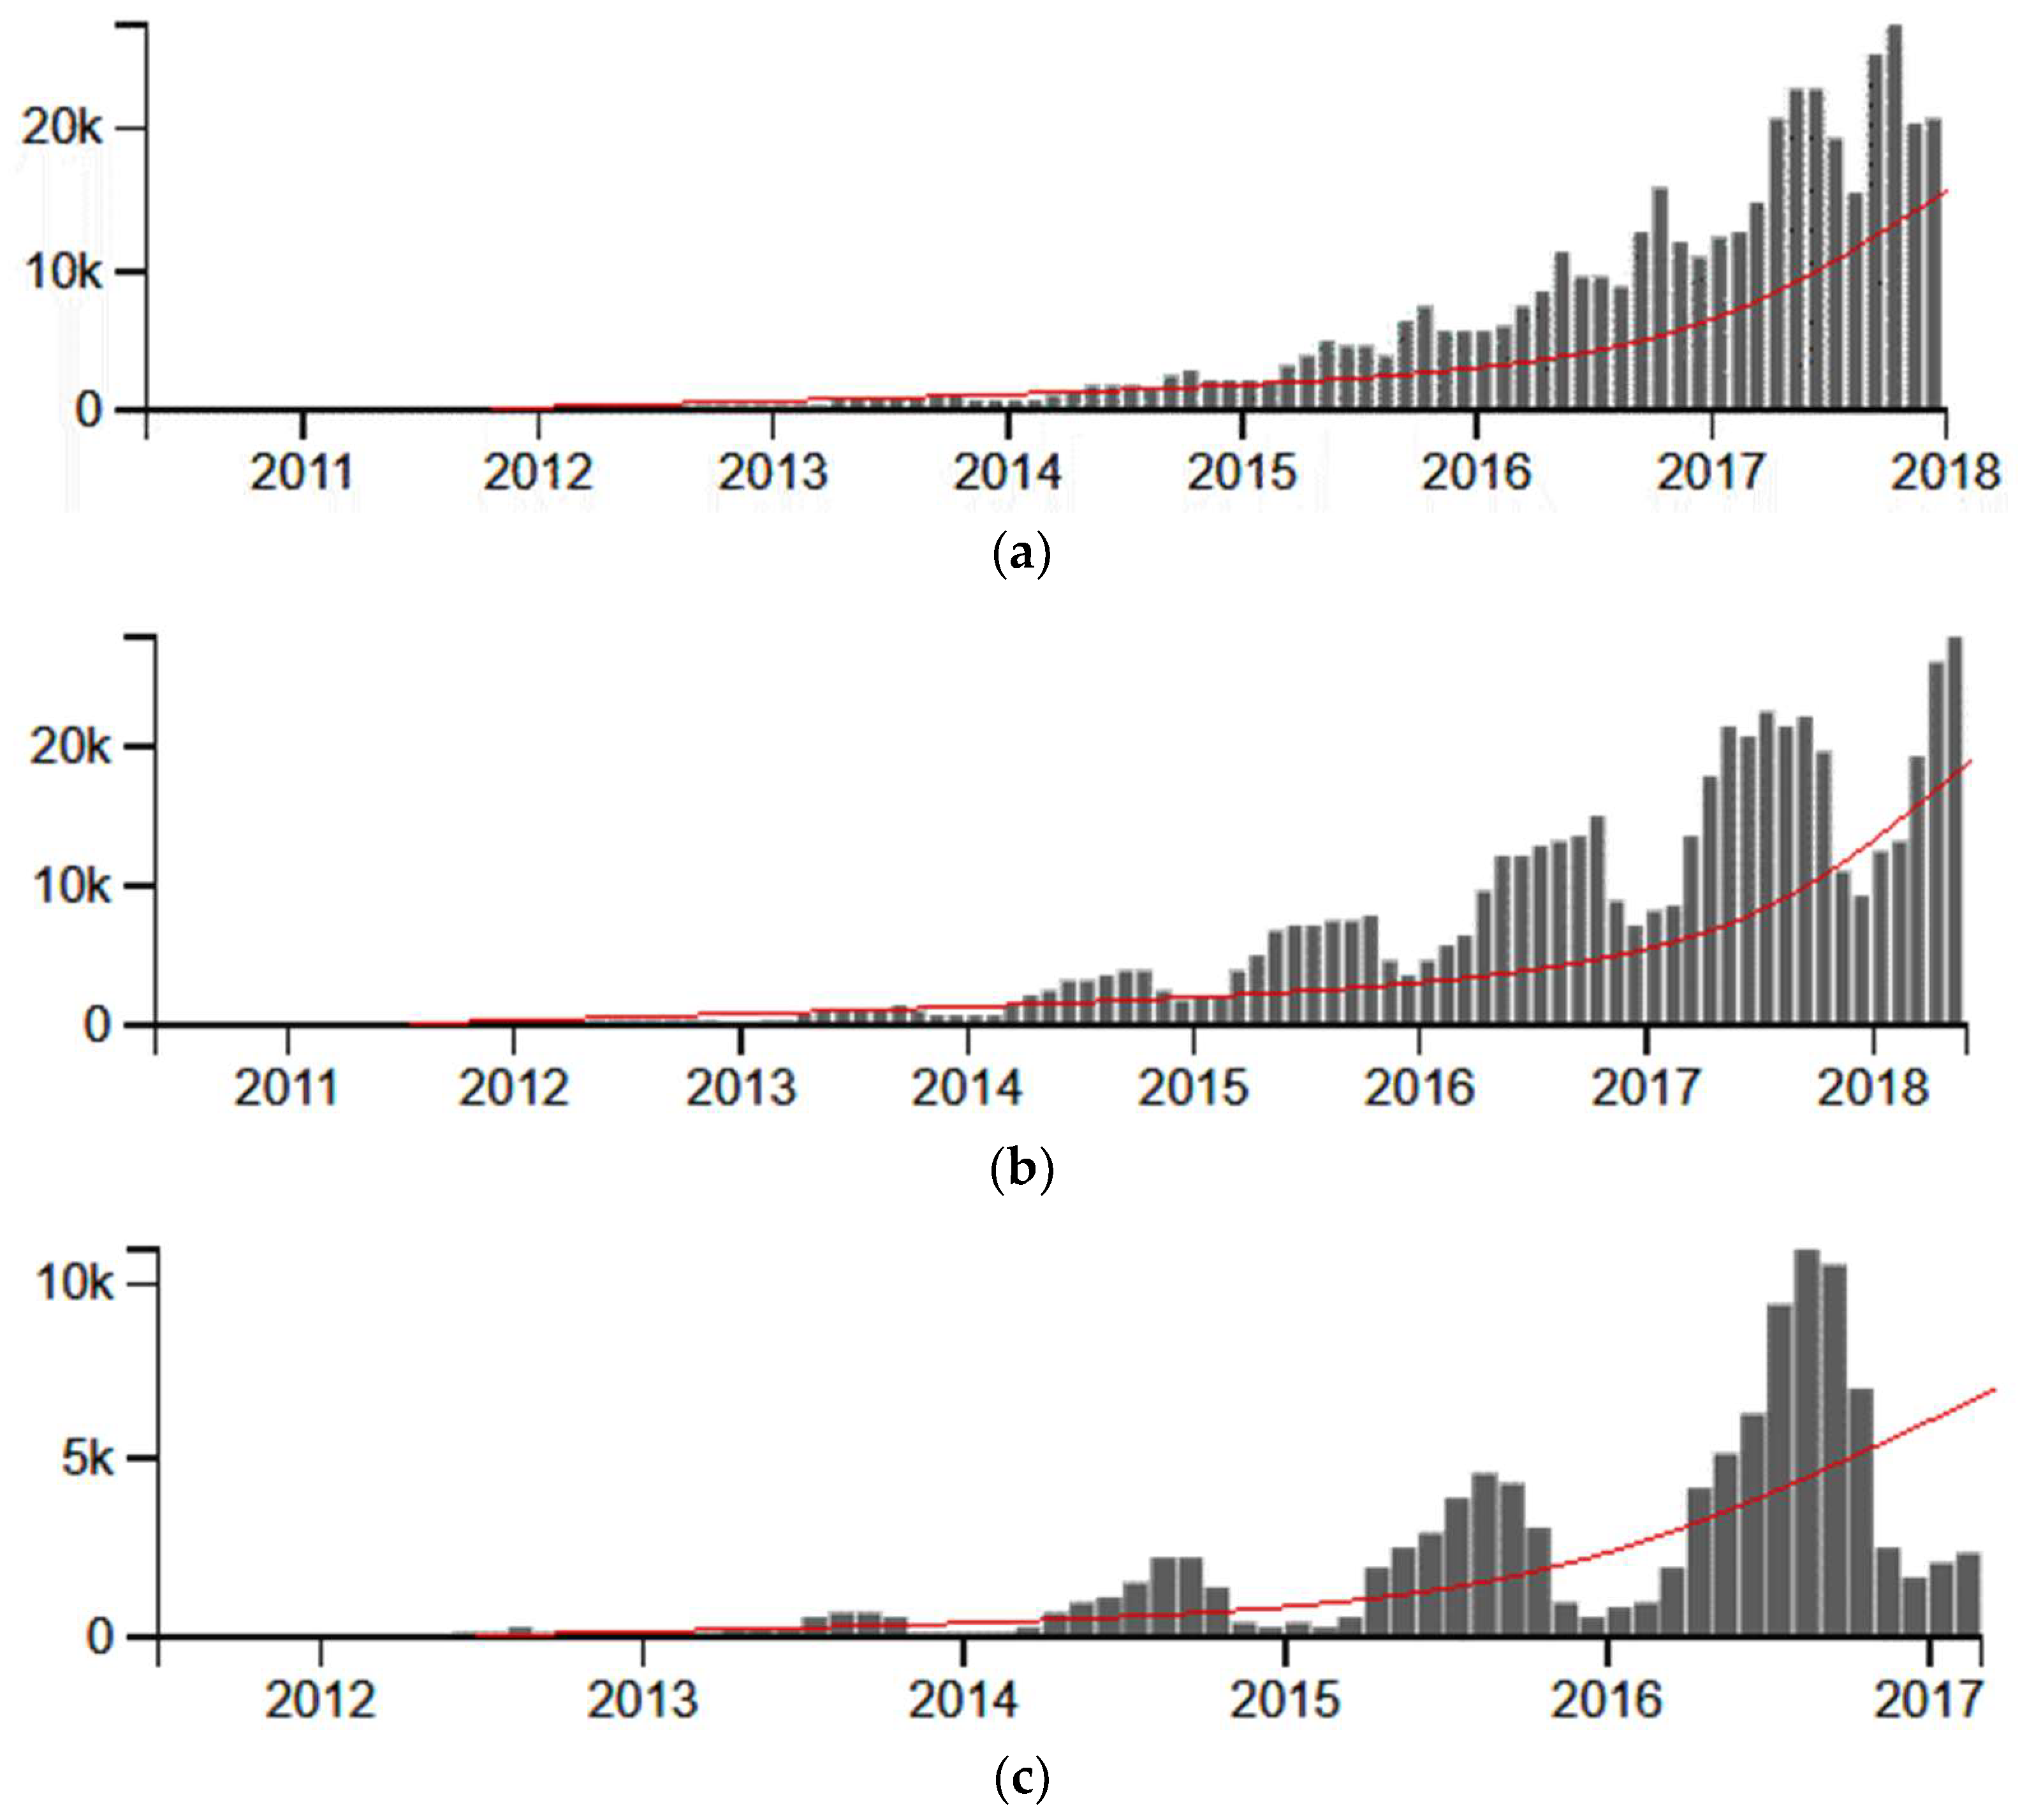
This is why it is especially interesting to observe the current temporal sequencing of the dynamic indicators used. A geolocated analysis of indicators has been carried out during the last three years (April 2015–February 2018) which has undoubtedly been the period of greatest explosion of the new phenomenon. However, if we look for example at the number of Airbnb listings used to develop the indicators, and we extend the period until the last 5 years, we can observe disquieting scenarios for the future (Figure 4).
If we develop a trend analysis, we observe that the behavior that best fits the growth of Airbnb listings in the three cities during the last five years is rather the beginning of an exponential one. If this trend continues, the number of Airbnb listings could multiply by a factor or four the current number in 2025 for main cities, seriously aggravating the previously observed problems. In addition, this model also produces periodic concentrations stressing the problems of seasonality in the tourist demand of cities (especially in the case of coastal cities such as Barcelona and Palma de Mallorca). All these questions should undoubtedly represent a worrying incentive for the development of future research on the impact of the Airbnb tourist model. In this sense, the specific impact of Airbnb on the seasonality of the tourist demand, or a more accurate spatial analysis of the trend behavior of some indicators (of which this study offers only an approximation), could be interesting future research lines.
Supplementary Materials
The following materials used for GIS analysis are available online below under a Creative Commons CC0 1.0 Universal (CC0 1.0) “Public Domain Dedication” license at https://www.mdpi.com/2071-1050/10/8/2933/s1. This material includes Summary information and metrics CSV file for listings (good for visualizations), Summary Review data and Listing ID file (to facilitate time-based analytics and visualizations linked to a listing), Neighbourhood list for geo filter (sourced from city or open source GIS files) for February 2018. The GeoJSON or SHP files of neighbourhoods used for each city is also included. Videos have also been included for the three cities analysed with the temporal sequence of the phenomena summarized.
Acknowledgments
The author acknowledges the web portal “Inside Airbnb: adding data to the debate” for the help to obtaining data from listings, reviews and calendar of Airbnb users and database from the cities.
Conflicts of Interest
The author declares no conflict of interest.
References
- Isabel, C. Which type of tourism matters to the regional economic growth? The cases of Spain and Italy. Int. J. Tour. Res. 2008, 10, 127–139. [Google Scholar] [CrossRef]
- Csirmaz, É.; Pető, K. International trends in recreational and wellness tourism. Procedia Econ. Financ. 2015, 32, 755–762. [Google Scholar] [CrossRef]
- Mescon, T.S.; Vozikis, G.S. The economic impact of tourism at the port of Miami. Ann. Tour. Res. 1985, 12, 515–528. [Google Scholar] [CrossRef]
- Manno, G.; Anfuso, G.; Messina, E.; Williams, A.T.; Suffo, M.; Liguori, V. Decadal evolution of coastline armouring along the Mediterranean Andalusia littoral (South of Spain). Ocean Coast. Manag. 2016, 124, 84–99. [Google Scholar] [CrossRef]
- Carranza, M.L.; Drius, M.; Malavasi, M.; Frate, L.; Stanisci, A.; Acosta, A.T.R. Assessing land take and its effects on dune carbon pools. An insight into the Mediterranean coastline. Ecol. Indic. 2018, 85, 951–955. [Google Scholar] [CrossRef]
- García-Ayllón, S. GIS assessment of mass tourism anthropization in sensitive coastal environments: Application to a case study in the mar menor area. Sustainability 2018, 10, 1344. [Google Scholar] [CrossRef]
- Tim, K.; Simon, C. The market viability of European mass tourist destinations. A post-stagnation life-cycle analysis. Int. J. Tour. Res. 1999, 1, 87–96. [Google Scholar] [CrossRef]
- Miralles, J.L.; García-Ayllón, S. The economic sustainability in urban planning: The case of La Manga. WIT Trans. Ecol. Environ. 2013, 173, 279–290. [Google Scholar] [CrossRef]
- Miralles, J.L.; García-Ayllón, S. Gis analysis of the consequences of short-term urban planning in a mass tourism destination in Spain. Int. J. Sustain. Dev. Plan. 2015, 10, 499–519. [Google Scholar] [CrossRef] [Green Version]
- Chris, C. The environmental consequences of declining destinations. Prog. Tour. Hosp. Res. 2012, 2, 337–345. [Google Scholar] [CrossRef]
- Chen, L.; Thapa, B.; Kim, J.; Yi, L. Landscape optimization in a highly urbanized tourism destination: An integrated approach in Nanjing, China. Sustainability 2017, 9, 2364. [Google Scholar] [CrossRef]
- Agarwal, S. The resort cycle and seaside tourism: An assessment of its applicability and validity. Tour. Manag. 1997, 18, 65–73. [Google Scholar] [CrossRef]
- Guo, X. A novel Bass-type model for product life cycle quantification using aggregate market data. Int. J. Prod. Econ. 2014, 158, 208–216. [Google Scholar] [CrossRef]
- Hovinen, G.R. Revisiting the destination lifecycle model. Ann. Tour. Res. 2002, 29, 209–230. [Google Scholar] [CrossRef]
- Kruczek, Z.; Kruczek, Z.; Kruczek, M.; Szromek, A. Possibilities of using the tourism area life cycle model to understand and provide sustainable solution for tourism development in the Antarctic Region. Sustainability 2018, 10, 89. [Google Scholar] [CrossRef]
- Corral, S.; Hernández, J.; Navarro Ibáñez, M.; Rivero Ceballos, J. Transforming mature tourism resorts into sustainable tourism destinations through participatory integrated approaches: The case of Puerto de la Cruz. Sustainability 2016, 8, 680. [Google Scholar] [CrossRef]
- Butler, R.W. The Concept of a Tourist Area Cycle of Evolution: Implications for Management of Resources. Can. Geogr./Le Geogr. Can. 1980, 24, 5–12. [Google Scholar] [CrossRef]
- Sidali, K.L.; Huber, D.; Schamel, G. Long-term sustainable development of tourism in South Tyrol: An analysis of tourists’ perception. Sustainability 2017, 9, 1791. [Google Scholar] [CrossRef]
- Ashworth, G.; Page, S.J. Urban tourism research: Recent progress and current paradoxes. Tour. Manag. 2011, 32, 1–15. [Google Scholar] [CrossRef]
- García-Hernández, M.; de la Calle-Vaquero, M.; Yubero, C. Cultural heritage and urban tourism: Historic city centres under pressure. Sustainability 2017, 9, 1346. [Google Scholar] [CrossRef]
- Campón-Cerro, A.; Folgado-Fernández, J.; Hernández-Mogollón, J. Rural destination development based on olive oil tourism: The impact of residents’ community attachment and quality of life on their support for tourism development. Sustainability 2017, 9, 1624. [Google Scholar] [CrossRef]
- Zamfir, A.; Corbos, R.-A. Towards sustainable tourism development in urban areas: Case study on Bucharest as tourist destination. Sustainability 2015, 7, 12709–12722. [Google Scholar] [CrossRef]
- Rabbiosi, C. Renewing a historical legacy: Tourism, leisure shopping and urban branding in Paris. Cities 2015, 42, 195–203. [Google Scholar] [CrossRef]
- Schmutz, V.; Elliott, M.A. Tourism and sustainability in the evaluation of world heritage sites, 1980–2010. Sustainability 2016, 8, 261. [Google Scholar] [CrossRef]
- Khan, M.; Woo, M.; Nam, K.; Chathoth, P. Smart city and smart tourism: A case of Dubai. Sustainability 2017, 9, 2279. [Google Scholar] [CrossRef]
- Lutz, C.; Newlands, G. Consumer segmentation within the sharing economy: The case of Airbnb. J. Bus. Res. 2018, 88, 187–196. [Google Scholar] [CrossRef]
- Guttentag, D.A.; Smith, S.L.J. Assessing Airbnb as a disruptive innovation relative to hotels: Substitution and comparative performance expectations. Int. J. Hosp. Manag. 2017, 64, 1–10. [Google Scholar] [CrossRef]
- Roelofsen, M.; Minca, C. The Superhost. Biopolitics, home and community in the Airbnb dream-world of global hospitality. Geoforum 2018, 91, 170–181. [Google Scholar] [CrossRef]
- Gunter, U. What makes an Airbnb host a superhost? Empirical evidence from San Francisco and the Bay Area. Tour. Manag. 2018, 66, 26–37. [Google Scholar] [CrossRef]
- Liang, L.J.; Choi, H.C.; Joppe, M. Exploring the relationship between satisfaction, trust and switching intention, repurchase intention in the context of Airbnb. Int. J. Hosp. Manag. 2018, 69, 41–48. [Google Scholar] [CrossRef]
- Guttentag, D. Airbnb: Disruptive innovation and the rise of an informal tourism accommodation sector. Curr. Issues Tour. 2015, 18, 1192–1217. [Google Scholar] [CrossRef]
- So, K.K.F.; Oh, H.; Min, S. Motivations and constraints of Airbnb consumers: Findings from a mixed-methods approach. Tour. Manag. 2018, 67, 224–236. [Google Scholar] [CrossRef]
- Varma, A.; Jukic, N.; Pestek, A.; Shultz, C.J.; Nestorov, S. Airbnb: Exciting innovation or passing fad? Tour. Manag. Perspect. 2016, 20, 228–237. [Google Scholar] [CrossRef]
- Xie, K.L.; Kwok, L. The effects of Airbnb’s price positioning on hotel performance. Int. J. Hosp. Manag. 2017, 67, 174–184. [Google Scholar] [CrossRef]
- Blal, I.; Singal, M.; Templin, J. Airbnb’s effect on hotel sales growth. Int. J. Hosp. Manag. 2018, 73, 85–92. [Google Scholar] [CrossRef]
- van der Borg, J.; Costa, P.; Gotti, G. Tourism in European heritage cities. Ann. Tour. Res. 1996, 23, 306–321. [Google Scholar] [CrossRef]
- Garcia-ayllon, S. Geographic information system (GIS) analysis of impacts in the tourism area life cycle (TALC) of a Mediterranean resort. Int. J. Tour. Res. 2016, 196, 186–196. [Google Scholar] [CrossRef]
- Kakar, V.; Voelz, J.; Wu, J.; Franco, J. The visible host: Does race guide Airbnb rental rates in San Francisco? J. Hous. Econ. 2018, 40, 25–40. [Google Scholar] [CrossRef]
- Horn, K.; Merante, M. Is home sharing driving up rents? Evidence from Airbnb in Boston. J. Hous. Econ. 2017, 38, 14–24. [Google Scholar] [CrossRef]
- Alegre, J.; Cladera, M.; Sard, M. Tourist areas: Examining the effects of location attributes on tour-operator package holiday prices. Tour. Manag. 2013, 38, 131–141. [Google Scholar] [CrossRef]
- Laws, E. The British on Holiday: Charter Tourism, Identity and Consumption; Andrews, H., Ed.; Channel View Publications: Bristol, UK, 2011; ISBN1 Hbk: 978-1-84541-183-1. ISBN2 PbK: 978-1-84541-182-4. [Google Scholar]
- Hof, A.; Schmitt, T. Urban and tourist land use patterns and water consumption: Evidence from Mallorca, Balearic Islands. Land Use Policy 2011, 28, 792–804. [Google Scholar] [CrossRef]
- García-Ayllón, S.; Miralles, J.L. The feedback between a tourism model and urban planning in La Manga, a mass tourist destination on the Spanish coast. WIT Trans. Ecol. Environ. 2014, 187, 339–349. [Google Scholar] [CrossRef]
- Cheng, M.; Foley, C. The sharing economy and digital discrimination: The case of Airbnb. Int. J. Hosp. Manag. 2018, 70, 95–98. [Google Scholar] [CrossRef]
- García-Ayllón, S. Retro-diagnosis methodology for land consumption analysis towards sustainable future scenarios: Application to a mediterranean coastal area. J. Clean. Prod. 2018, 195, 1408–1421. [Google Scholar] [CrossRef]
- Ferrante, M.; Lo Magno, G.L.; De Cantis, S. Measuring tourism seasonality across European countries. Tour. Manag. 2018, 68, 220–235. [Google Scholar] [CrossRef]
- Brochado, A.; Troilo, M.; Shah, A. Airbnb customer experience: Evidence of convergence across three countries. Ann. Tour. Res. 2017, 63, 60–63. [Google Scholar] [CrossRef]
- Wegmann, J.; Jiao, J. Taming Airbnb: Toward guiding principles for local regulation of urban vacation rentals based on empirical results from five US cities. Land Use Policy 2017, 69, 494–501. [Google Scholar] [CrossRef]
- Rovira Soto, M.T.; Anton Clavé, S. Second homes and urban landscape patterns in Mediterranean coastal tourism destinations. Land Use Policy 2017, 68, 117–132. [Google Scholar] [CrossRef]
- Gibbs, C.; Guttentag, D.; Gretzel, U.; Morton, J.; Goodwill, A. Pricing in the sharing economy: A hedonic pricing model applied to Airbnb listings. J. Travel Tour. Mark. 2018, 35, 46–56. [Google Scholar] [CrossRef]
- Martin-Fuentes, E.; Fernandez, C.; Mateu, C.; Marine-Roig, E. Modelling a grading scheme for peer-to-peer accommodation: Stars for Airbnb. Int. J. Hosp. Manag. 2018, 69, 75–83. [Google Scholar] [CrossRef]
- Gutiérrez, J.; García-Palomares, J.C.; Romanillos, G.; Salas-Olmedo, M.H. The eruption of Airbnb in tourist cities: Comparing spatial patterns of hotels and peer-to-peer accommodation in Barcelona. Tour. Manag. 2017, 62, 278–291. [Google Scholar] [CrossRef] [Green Version]
- Adamiak, C. Mapping Airbnb supply in European cities. Ann. Tour. Res. 2018, 71, 67–71. [Google Scholar] [CrossRef]
- García-Ayllón, S. La Manga case study: Consequences from short-term urban planning in a tourism mass destiny of the Spanish Mediterranean coast. Cities 2015, 43, 141–151. [Google Scholar] [CrossRef]
- Albuquerque, H.; Costa, C.; Martins, F. The use of geographical information systems for tourism Marketing purposes in Aveiro region (Portugal). Tour. Manag. Perspect. 2018, 26, 172–178. [Google Scholar] [CrossRef]
- Rahayuningsih, T.; Muntasib, E.K.S.H. Nature based tourism resources assessment using geographic information system (GIS): Case study in Bogor. Procedia Environ. Sci. 2016, 33, 365–375. [Google Scholar] [CrossRef]
- Ministerio de Fomento. Sistema de Información Urbana (SIU). Available online: http://visorsiu.fomento.es/geonetwork/srv/es/main.home (accessed on 18 April 2018).
- Consejeria de Vivienda de Cataluña. Mapa de alquiler de Cataluña. Available online: http://territori.gencat.cat/es/detalls/Article/Nou-mapa-de-lloguer-a-Catalunya (accessed on 17 March 2018).
- Instituto Balear de la Vivienda. Mapa de Compraventa Palma de Mallorca. Available online: http://www.caib.es/govern/organigrama/area.do?coduo=1364&lang=es (accessed on 14 February 2018).
- Guttentag, D.; Smith, S.; Potwarka, L.; Havitz, M. Why tourists choose Airbnb: A motivation-based segmentation study. J. Travel Res. 2018, 57, 342–359. [Google Scholar] [CrossRef]
- Colegio de Registradores de la Propiedad. Geoportal del Regitro de la Propiedad. Available online: http://geoportal.registradores.org/geoportal/index.html?idVisor=2 (accessed on 4 April 2018).
- Wu, C. Handbook of applied spatial analysis: Software tools, methods and applications edited by Manfred M. Fischer and Arthur Getis. J. Reg. Sci. 2012, 52, 386–388. [Google Scholar] [CrossRef]
- Ding, Y.; Fotheringham, A.S. The integration of spatial analysis and GIS. Comput. Environ. Urban Syst. 1992, 16, 3–19. [Google Scholar] [CrossRef]
- Anselin, L. Local indicators of spatial association—LISA. Geogr. Anal. 1995, 27, 93–115. [Google Scholar] [CrossRef]
- O’Regan, M.; Choe, J. Airbnb and cultural capitalism: Enclosure and control within the sharing economy. Anatolia 2017, 28, 163–172. [Google Scholar] [CrossRef]
- Karlsson, L.; Kemperman, A.; Dolnicar, S. May I sleep in your bed? Getting permission to book. Ann. Tour. Res. 2017, 62, 1–12. [Google Scholar] [CrossRef]
Figure 1.
Aggregated GIS mapping by neighbourhoods of density geoprocessing for the static indicators in Madrid (1), Barcelona (2) and Palma de Mallorca (3): (a) Global Tourist Saturation Index ; (b) P2P 2nd homes Index of Saturation (c) Tourist P2P prevalence rate ; (d) Price index of the rental market .


Figure 2.
Aggregated GIS mapping by neighbourhoods of density geoprocessing for the dynamic indicators in Madrid (1), Barcelona (2) and Palma de Mallorca (3): (a) P2P Tourist Pressure Index ; (b) Increase rate of the rental real estate market (c) Index of social conflict and (d) Urban Migration index .


Figure 3.
General data map geoprocessing through Getis-Ord Gi indicators: aggregated Anselin Local Moran’s I analysis of z-scores of cold (LL) and hot (HH) spots assessment of observed G vs. expected G in (a) Madrid, (b) Barcelona and (c) Palma de Mallorca for p-values = 0.01. Hot spots identification and outliers (LH and HL): Bivariate Anselin Local Moran’s I evaluation for the analysis of spatial correlation in Madrid (1), Barcelona (2) and Palma de Mallorca (3) between dynamic indicators: (a) P2P Tourist Pressure Index and Increase rate of the rental real estate market (b) P2P Tourist Pressure Index and Index of social conflict and (c) P2P Tourist Pressure Index and Urban Migration index .

Figure 4.
Historical data used to develop the indicators (in dark grey) and trend simulation of the number of Airbnb listings obtained for (a) Madrid, (b) Barcelona and (c) Palma de Mallorca, adjusted polynomially (in red).
Figure 4.
Historical data used to develop the indicators (in dark grey) and trend simulation of the number of Airbnb listings obtained for (a) Madrid, (b) Barcelona and (c) Palma de Mallorca, adjusted polynomially (in red).


Table 1.
Summary of the static GIS indicators for the three cities analysed (the minimum, average and maximum values of their neighbourhoods are indicated jointly).
Table 1.
Summary of the static GIS indicators for the three cities analysed (the minimum, average and maximum values of their neighbourhoods are indicated jointly).
| GIS Static Indicators | Madrid Min./Average/Max. | Barcelona Min./Average/Max. | Palma de Mallorca Min./Average/Max. |
|---|---|---|---|
| (beds/Ha) | 7.7/88.6/222.6 | 6.2/74.3/253.8 | 22.8/92.6/243.7 |
| (beds/Ha) | 1.2/45.7/162.3 | 0.9/39.4/184.1 | 6.4/37.7/152.9 |
| (beds/Ha) | 0.1/4.6/24.6 | 0.2/5.3/22.7 | 0.0/4.2/21.9 |
| (€/m2) | 11.3/18.5/24.2 | 11.9/18.2/23.4 | 9.8/14.1/17.7 |
Table 2.
Summary of the dynamic GIS indicators for the three cities analysed (values for the periods April 2015-February 2016, February 2016-February 2017 and February 2017-February 2018 of their neighbourhoods are indicated jointly).
Table 2.
Summary of the dynamic GIS indicators for the three cities analysed (values for the periods April 2015-February 2016, February 2016-February 2017 and February 2017-February 2018 of their neighbourhoods are indicated jointly).
| GIS Dynamic Indicators | Madrid 2015–2016/2016–2017/2017–2018 | Barcelona 2015–2016/2016–2017/2017–2018 | Palma de Mallorca 2015–2016/2016–2017/2017–2018 |
|---|---|---|---|
| (beds/1000 inhab.) | 35.6/44.7/68.2 | 36.9/50.2/87.6 | 42.4/57.7/80.5 |
| (%) | 7.8/10.5/11.1 | 12.1/15.6/20.2 | 9.7/11.1/16.5 |
| (num. of news) | 255/607/814 | 653/1266/1414 | 756/1071/1313 |
| (transfer licenses) | 26,742/28,864/30,525 | 19,792/20,657/23,631 | 4632/5953/6534 |
Table 3.
Global Moran’s I statistic for static and dynamic indicators in the three cities (data order: Madrid/Barcelona/Palma de Mallorca).
Table 3.
Global Moran’s I statistic for static and dynamic indicators in the three cities (data order: Madrid/Barcelona/Palma de Mallorca).
| Static Indicators | ||||
| Global Moran’s Index | 0.43/0.46/0.48 | 0.71/0.72/0.75 | 0.08/0.11/0.12 | 0.55/0.49/0.47 |
| z-score | 38.3/40.1/42.5 | 79.9/81.8/82.4 | 12.1/14.3/13.5 | 34.1/34.8/32.6 |
| p-value | 0.01/0.01/0.01 | 0.01/0.01/0.01 | 0.01/0.01/0.01 | 0.01/0.01/0.01 |
| Dynamic Indicators | ||||
| Global Moran’s Index | 0.66/0.69/0.67 | 0.67/0.72/0.70 | 0.41/0.44/0.45 | 0.32/0.27/0.38 |
| z-score | 54.4/54.8/53.6 | 58.1/59.6/52.2 | 35.7/42.9/50.6 | 35.0/31.8/32.4 |
| p-value | 0.01/0.01/0.01 | 0.01/0.01/0.01 | 0.01/0.01/0.01 | 0.01/0.01/0.01 |
Table 4.
Bivariate Global Moran’s I statistics for spatial correlation between dynamic indicators in the three cities (data order: Madrid/Barcelona/Palma de Mallorca).
Table 4.
Bivariate Global Moran’s I statistics for spatial correlation between dynamic indicators in the three cities (data order: Madrid/Barcelona/Palma de Mallorca).
| Dynamic Indicators | – | – | – |
|---|---|---|---|
| Bivariate Global Moran’s I | |||
| Global Moran’s Index | 0.59/0.66/0.65 | 0.61/0.71/0.75 | 0.60/0.71/0.18 |
| z-score | 55.2/68.7/70.1 | 37.0/44.6/43.5 | 38.8/60.2/15.5 |
| p-value | 0.01/0.01/0.01 | 0.01/0.01/0.01 | 0.01/0.01/0.01 |
© 2018 by the author. Licensee MDPI, Basel, Switzerland. This article is an open access article distributed under the terms and conditions of the Creative Commons Attribution (CC BY) license (http://creativecommons.org/licenses/by/4.0/).
Share and Cite
MDPI and ACS Style
Garcia-Ayllon, S. Urban Transformations as an Indicator of Unsustainability in the P2P Mass Tourism Phenomenon: The Airbnb Case in Spain through Three Case Studies. Sustainability 2018, 10, 2933. https://doi.org/10.3390/su10082933
AMA Style
Garcia-Ayllon S. Urban Transformations as an Indicator of Unsustainability in the P2P Mass Tourism Phenomenon: The Airbnb Case in Spain through Three Case Studies. Sustainability. 2018; 10(8):2933. https://doi.org/10.3390/su10082933
Chicago/Turabian StyleGarcia-Ayllon, Salvador. 2018. "Urban Transformations as an Indicator of Unsustainability in the P2P Mass Tourism Phenomenon: The Airbnb Case in Spain through Three Case Studies" Sustainability 10, no. 8: 2933. https://doi.org/10.3390/su10082933
Note that from the first issue of 2016, this journal uses article numbers instead of page numbers. See further details here.