Bayesian Count Data Modeling for Finding Technological Sustainability


Department of Big Data and Statistics, Cheongju University, Chungbuk 28503, Korea
Sustainability 2018, 10(9), 3220; https://doi.org/10.3390/su10093220
Submission received: 11 August 2018
/
Revised: 30 August 2018
/
Accepted: 7 September 2018
/
Published: 8 September 2018
Abstract
:Technology developments change society, and society demands new and innovative technology developments. We analyze technology to understand society and technology itself. Much research related to technology analysis has been introduced in various fields. Most of it has been on patent analysis. This is because detailed and accurate results of research and development are patented. In this paper, we study a new patent analysis method based on the count data model and Bayesian regression analysis. Using the count data model, we analyzed the technological keywords extracted from the collected patent documents. We used the prior distribution of Bayesian statistics to reflect the experience and knowledge of the relevant technological experts in the analysis model. Moreover, we applied the proposed model to find sustainable technologies. Finding and developing sustainable technologies is an important activity for companies and research institutes to maintain their technological competitiveness. To illustrate how our modeling could be applied to real domains, we carried out a case study using the patent documents related to artificial intelligence.
1. Introduction
A company with sustainable technology can maintain technological competitiveness in the marketplace [1,2]. Most companies have tried to find their sustainable areas for technological innovation and new product development. Therefore, sustainable technology is an important issue in the management of technology (MOT) [3]. Many academics, research institutes, and companies have studied sustainable technologies. Recently, Kim et al. (2018) published a statistical method for sustainable technology analysis [4]. They considered Bayesian inference and social network analysis for the proposed method and applied their research to the technology domain related to artificial intelligence (AI). They also used the IPC (international patent classification) codes extracted from patent documents as input data for sustainable technology analysis. The IPC is a hierarchical system of technologies for the classification of patents [5]. For example, the IPC code G06F represents electric digital data processing technology [6]. In general, IPC codes cover a wide range of technologies. Thus, it is difficult for us to grasp the detailed technological structure of a specific technology field. In order to overcome this problem, we propose a technology analysis method using patent keywords. The keywords are extracted from patent documents related to specific technology through text mining techniques [7]. Therefore, the technology keyword can represent a more detailed description of a specific technology field than the IPC code for sustainable technology analysis. In addition, we propose a statistical modeling using Bayesian count data analysis for understanding sustainability of a given technology domain. The count of event is the number of times an event occurs [8]. In this paper, each patent keyword is an event, and we analyzed the count data of patent keywords. We considered the Poisson probability distribution for the proposed statistical patent analysis model, because the count data of patent keywords are nonnegative integer values [9]. We also combined the Poisson count model with Bayesian regression analysis to build Bayesian count data modeling for finding technological sustainability. In this paper, we looked for sustainable technologies from the predictive keywords that have the most significant impact on the dependent keywords that represent the target technology. For example, if AI (artificial intelligence) is the target technology, ‘artificial’ and ‘intelligence’ become response keywords (variables), and other keywords, except ‘artificial’ and ‘intelligence’, such as ‘learning’, ‘visual’, and ‘language’, are predictive variables. Therefore, we carried out Bayesian count data modeling to find technological sustainability. To show the validity of our modeling, we performed a case study using the patent documents related to AI. The remainder of this paper is organized as follows: In Section 2, we show the research background related to our study. We explain the proposed modeling for finding technological sustainability in Section 3. The next section illustrates the result of our case study. In the Conclusions section, we conclude our research and describe our future work related to this paper.
2. Sustainable Technology and Patent Analysis
In this paper, sustainable technology means a technology that can sustain a company’s technological competitiveness. Therefore, it is important for a company to know what its sustainable technologies are. In the MOT field, many companies and institutes have tried to find their sustainable technologies. Many research results on sustainable technology analysis have been published in academia [1,2,4,10,11]. Sustainable technology analysis has been made using diverse analytical methods in various technological fields. However, research on this field is still lacking. Companies and research institutions demand more sophisticated and feasible methodologies for sustainable technology analysis. Most methods for sustainable technology analysis rely on patent analysis. This is because patents contain accurate and vast results on the research and development of technology. This is due to the exclusive right to use the technology granted to the inventor. For this reason, many studies related to patent analysis have been made [12,13,14,15,16]. In patent analysis, we should transform the collected patent documents into structured data consisting of keywords, IPC codes, citations, etc. for statistical analysis. In the preprocessing process of patent data, we used the R data language and its ‘tm’ package [7,17]. Using the structured patent data, we performed the proposed modeling for finding technological sustainability.
3. Finding Technological Sustainability Using Bayesian Count Data Modeling
To find the sustainability of a given technology field, we need the structured data applied to Bayesian count data modeling. Therefore, to prepare the structured data, we extracted the patent keywords from the collected patent documents using text mining techniques in Figure 1.
In our text mining process, first of all, we needed to determine the target technology for statistical analysis. Next, we used a retrieved equation to collect the patent documents related to target technology from the patent databases in the world. It is impossible to analyze the searched patent document data directly, because the data are not suitable for inputting data for statistical analysis, including Bayesian count data modeling. Thus, we tried to make structured data for statistical analysis. The first step in creating structured data is to create a corpus collecting and interpreting text documents. Based on the created corpus, we transformed the patent documents into plain texts, and cleaned the text data by eliminating whitespace, removing step-words (“and”, “for”, “in”, “is”, etc.), stemming, and filtering. Finally, we made the document–keyword matrix as structured data for Bayesian count data modeling. The matrix consisted of patents (rows) and keywords (columns), and its elements were the frequency (count) values of keywords occurring in each patent document. Next, we built a methodology using the Bayesian count data model to analyze the structured data for finding sustainable technology.
In our research, we considered Bayesian count data modeling with a Poisson distribution for finding technological sustainability. The Poisson probability distribution is the most popular model for count data. If the random variable Y is distributed to Poisson with parameter λ, its distribution is defined as follows [9]: .
where the expectation E(Y) and variance of Y are equal to parameter . In addition, the likelihood function of Poisson random variable Y is as follows [18,19]:
Equation (4) is in the form of , and this is Gamma distribution with parameters c and d. We can therefore select Gamma distribution as conjugate prior for the Poisson parameter. In this paper, the frequency of each patent keyword extracted from patent document data is a Poisson random variable with parameter as follows:
where m is the number of all keywords. In our modeling, we define the frequency (count) of ith keyword, the occurring keyword as , and represent the data set as follows [9]:
Using this data set, we performed the generalized linear model (GLM) with Poisson probability distribution, no predictors, and log link function as follows:
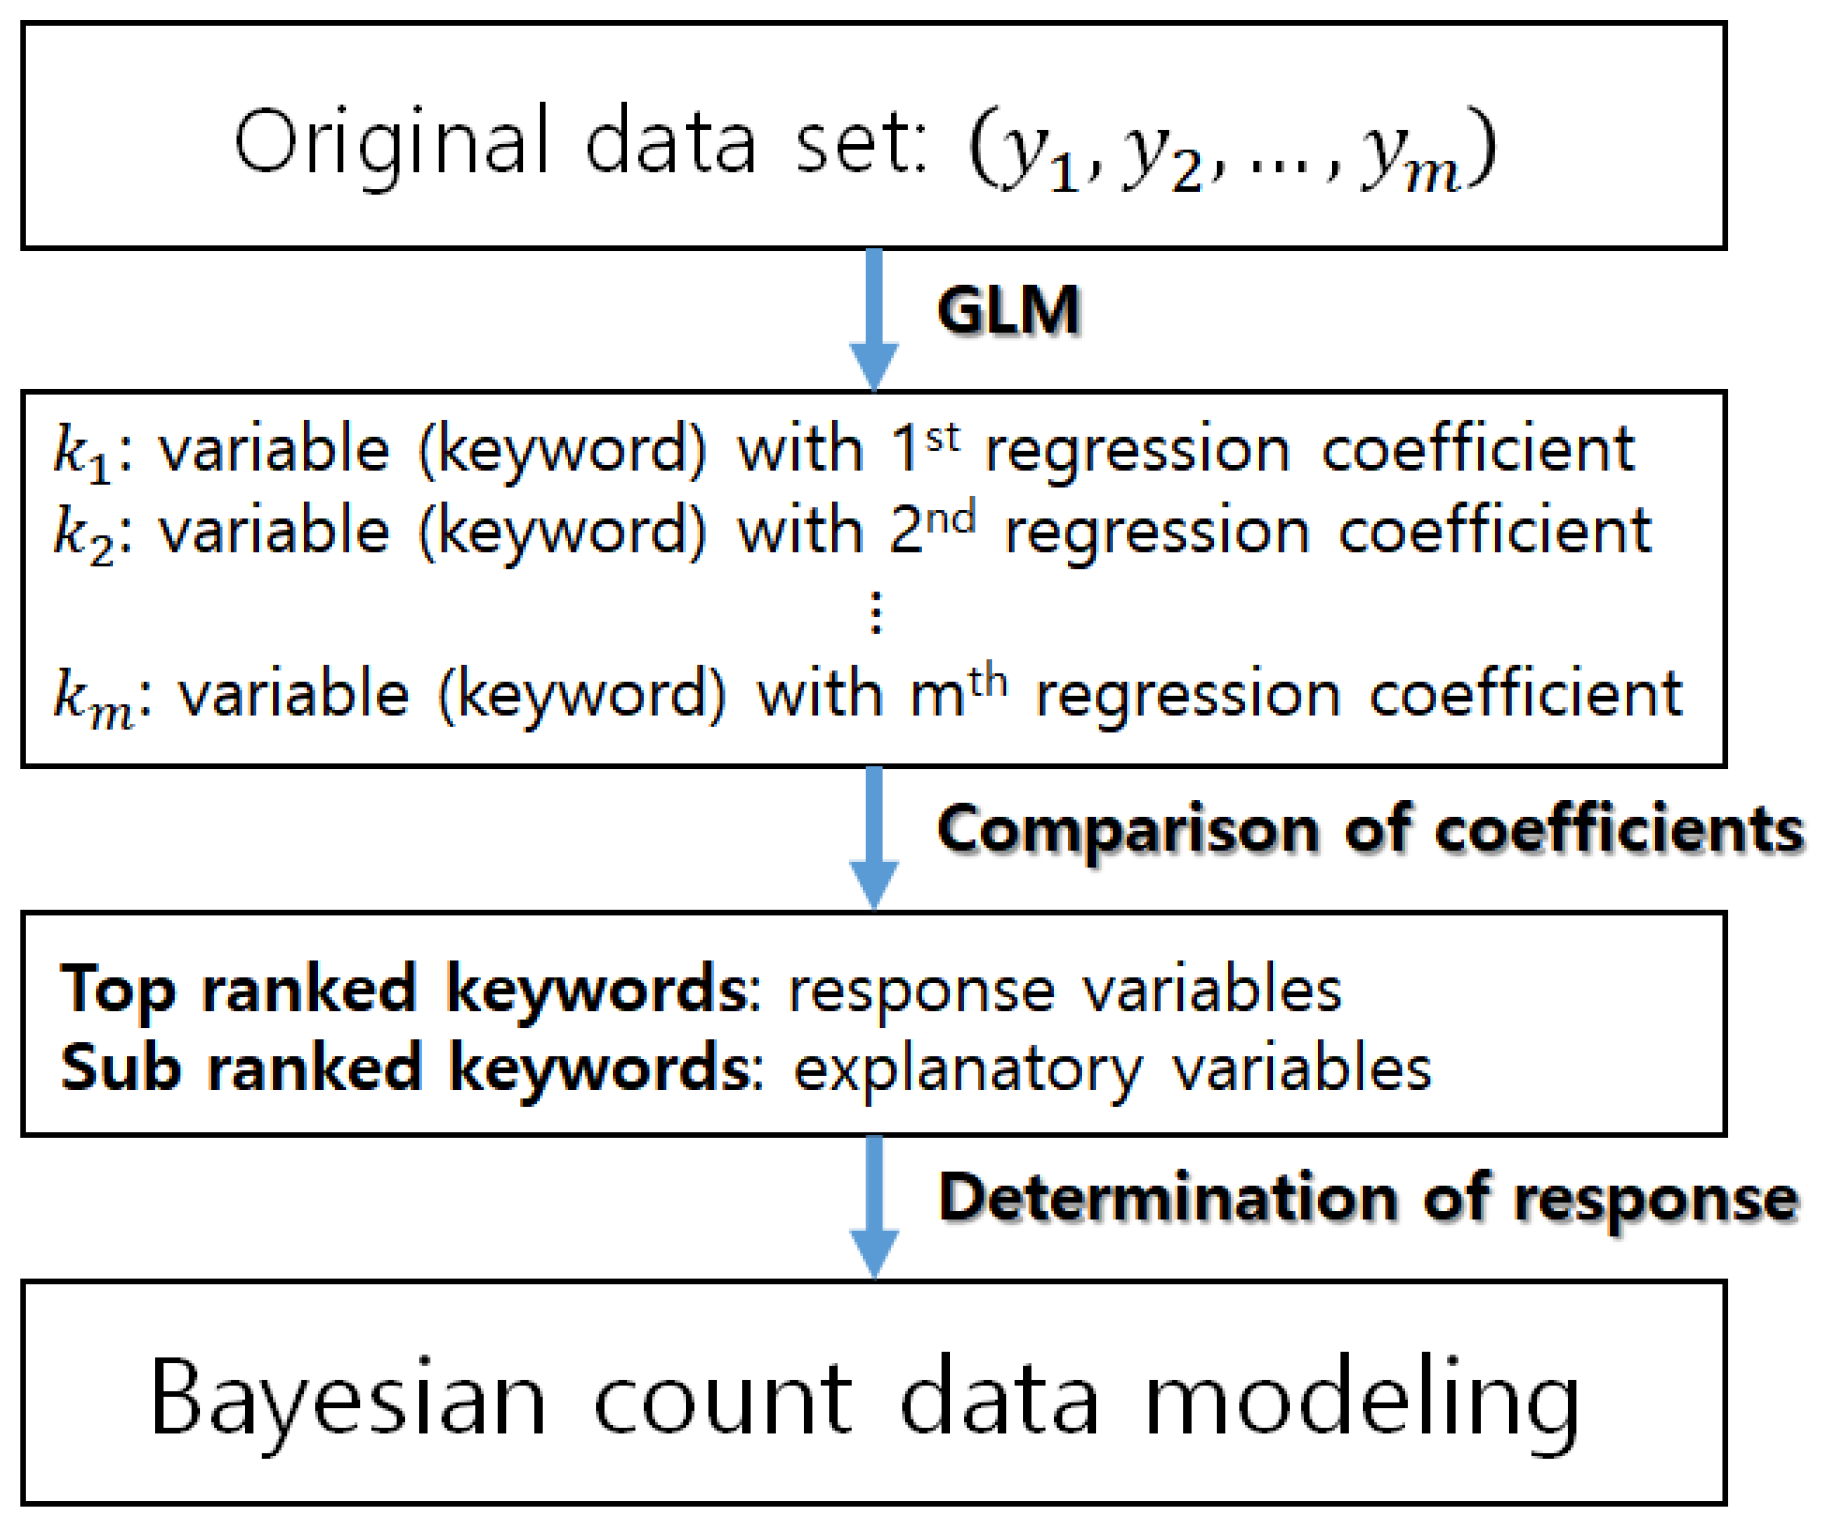
We determined the response and predictor variables (keywords) by the results of the GLM. The parameter from this constant GLM model with Poisson distribution is similar to the mean of Poisson random variable. In this paper, therefore, we used the Poisson mean value by MLE (maximum likelihood estimator) instead of the constant GLM model. In addition, we considered the full GLM model using all predictor variables as well as the constant model. In our study, we used variables with large coefficient values as response variables and those with small coefficient values as explanatory variables.
In Figure 2, Bayesian modeling has increasingly been used in diverse data analysis areas, such as regression and classification. This is one of two approaches to statistics. We started Bayesian count data modeling from the following expression [18]:
where is the model parameter, and is the response variable to be predicted. and are the prior and posterior probabilities of parameter respectively. represents the likelihood function of given , respectively. Additionally, is calculated by the following integration [19]:
Using Bayesian modeling, we determined the model parameter of posterior distribution. Because we were interested in the mean of the parameters, we had to select a prior distribution to begin Bayesian modeling. In general, noninformative or informative priors can be used for the prior distribution in Bayesian modeling [9,19]. In our research, we used the informative prior to get the updated result for the parameter estimation. However, we needed to carry out Bayesian computing such as Markov Chain Monte Carlo (MCMC) for using the informative prior [19]. To alleviate the computational burden, we were able to use conjugate prior.
In this paper, we denoted the response variable as Y, and the explanatory variables as , where p is the number of explanatory variables. We selected the keywords representing target technology as response variables, and the remaining keywords, except the response variables, were used as explanatory variables. For example, if our target technology was AI, we selected the keywords ‘Artificial’ and ‘Intelligence’ as response variables. For Bayesian count data modeling, we constructed the Poisson regression model with Gamma distribution as prior. The Poisson regression model is defined as follows [9,20]:
where β is the regression parameter. Additionally, an informative Gamma prior for is as follows:
where is Gamma function, and and are and , respectively. This expression is used for the likelihood in Bayesian count data modeling. Thus, using the likelihood and prior distributions, we show the posterior distribution as follows:
We can ignore the terms not involving , so we yield the proportional result of posterior distribution as follows:
This expression represents the kernel of the Gamma distribution with parameters and . In addition, by the characteristic of Gamma distribution, the posterior mean and variance of are and , respectively. In the Bayesian Poisson regression case, is distributed Poisson with mean , where is the parameter vector of Poisson regression. In our research, () is shown as (response keyword | explanatory keywords). Therefore, we get the Bayesian count data modeling as follows:
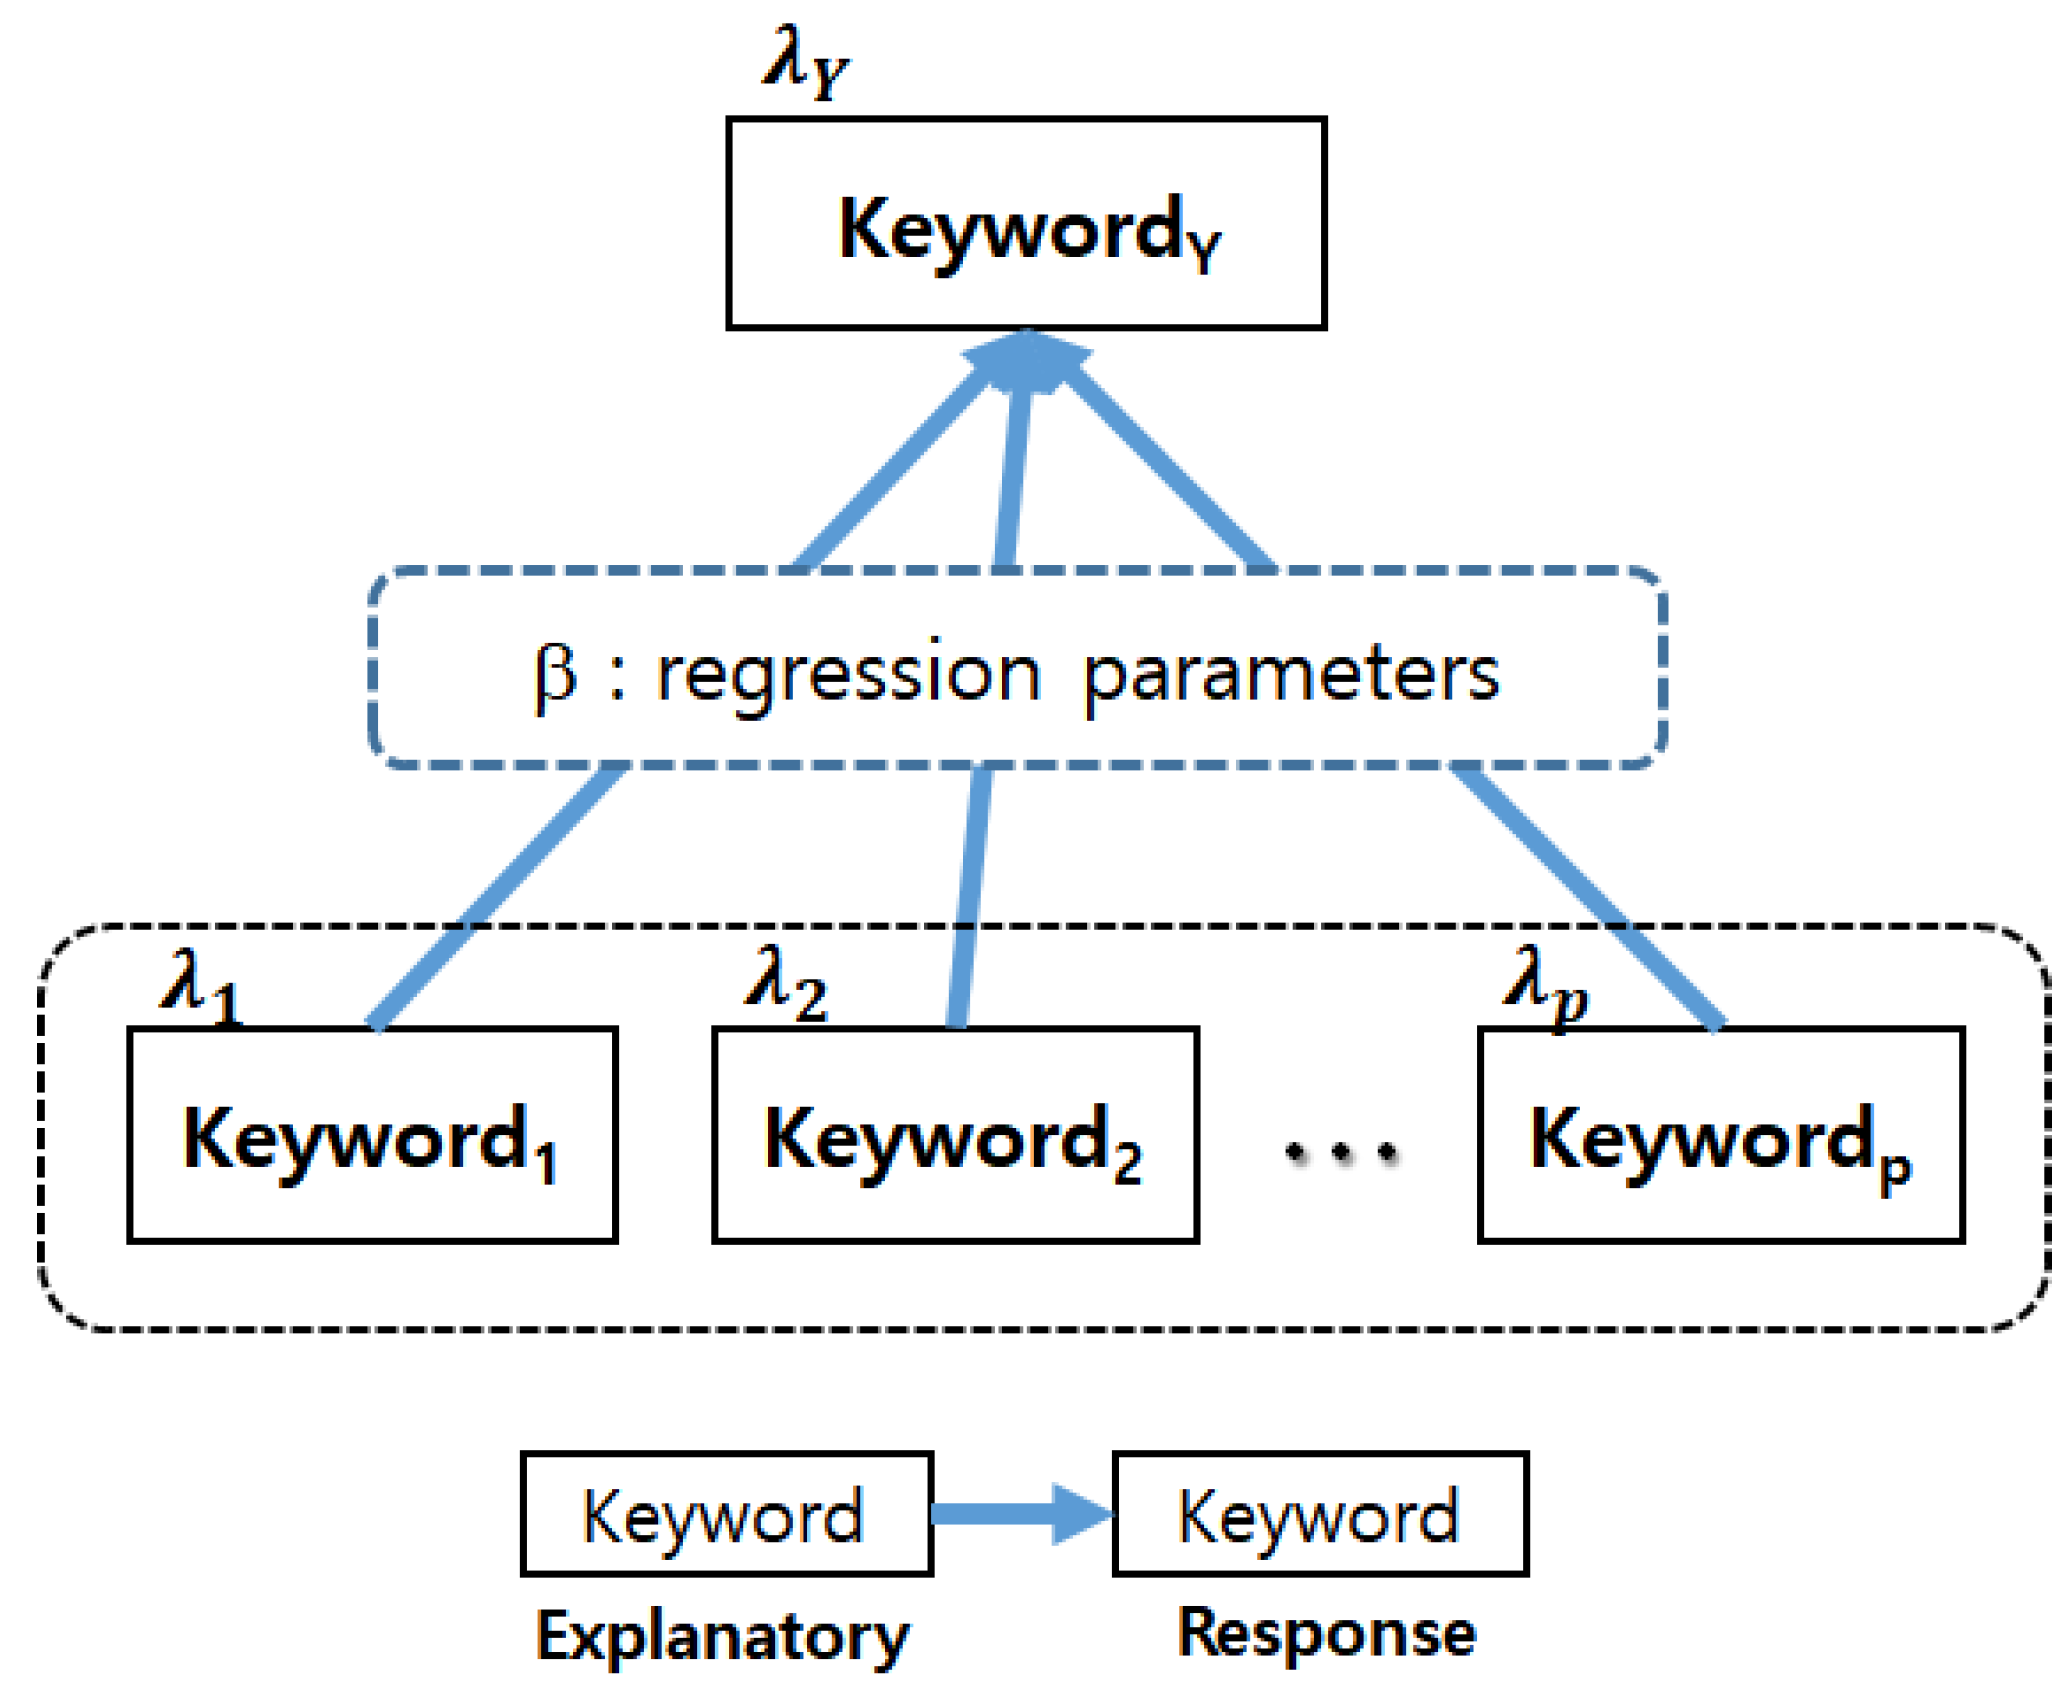
where c and d are defined in Equation (4). The posterior distribution is computed by multiplying given prior and likelihood based on data, and the calculated posterior is used as a prior at the next modeling. Using this modeling, we built a technology structure to understand the target technology from the viewpoint of sustainability in Figure 3.
In our modeling, all keywords except response were used as explanatory keywords. In Figure 3, the keyword at the beginning of the arrow indicates the explanatory variable, and the keyword at the end of the arrow indicates the response variable. Additionally, each keyword is distributed to Poisson with parameter . From the final result of Bayesian count data modeling, we got the regression coefficients β between response and explanatory variables (keywords). Using β, we built a technological structure of a target domain for sustainable technology management. This description is related to Figure 3. That is, we selected the keywords with high impact using the Poisson parameter, which is mean value of Poisson random variable (keyword). Next, we extracted the final predictor keywords by comparing probability value (p-value) of the regression parameters. Therefore, we selected the meaningful predictor variables in two steps. First, the predictor variables with large Poisson parameters were selected. Next, the predictor variables with relatively large regression coefficients were chosen. In order to make the scale of variables equal, we standardized variables before proceeding with Bayesian count data modeling. Bayesian count data modeling is based on the following concept in Figure 4.
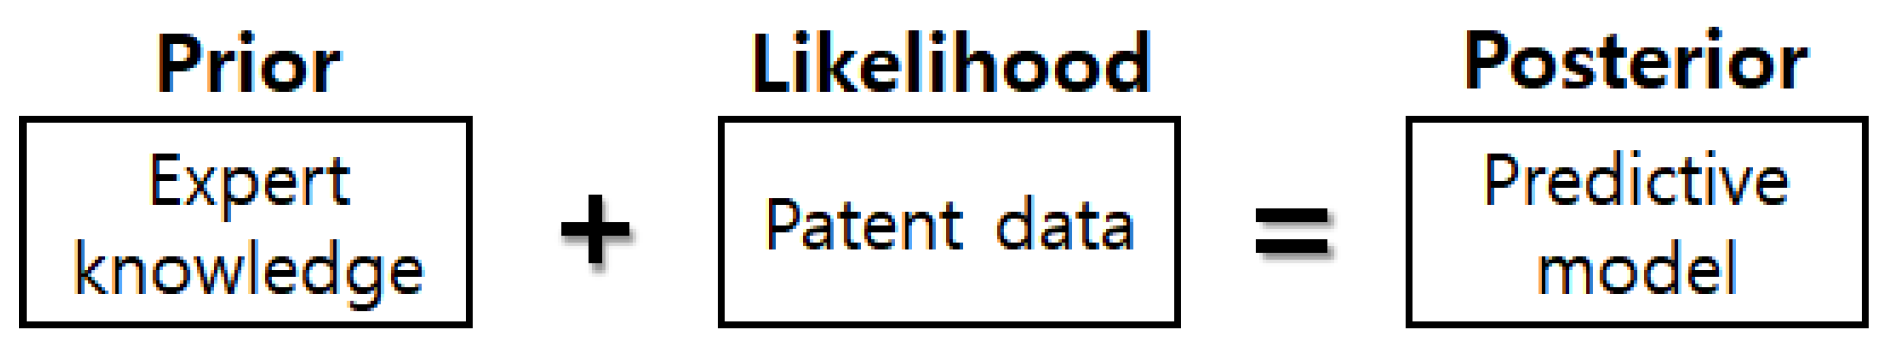
In this paper, we tried to combine the expert’s subjective knowledge and objective result from patent data analysis. That is, the prior represented the domain knowledge of experts, and the likelihood denoted the objective data based on patent documents. The result of multiplying prior and likelihood is posterior; we used this as a predictive model for finding technological sustainability. Therefore, we used the prior probability distribution to reflect the experience and knowledge of the relevant technology experts in the model. The collected patent data were represented by the likelihood function. We got the posterior distribution by multiplying the prior distribution and likelihood function. Finally, these Bayesian probability distributions were applied to the count data regression for the Bayesian count data model. Using this approach, we expect an improved performance of patent technology analysis for sustainable technology. Our model is applicable to multivariate response vector as well as univariate response variables.
This is because, depending on the technology field, there may be more than one response variable. For example, in the AI technology field, the response vector is defined as follows:
We illustrate how this research could be applied to practical problems through a case study in the next section.
4. Case Study
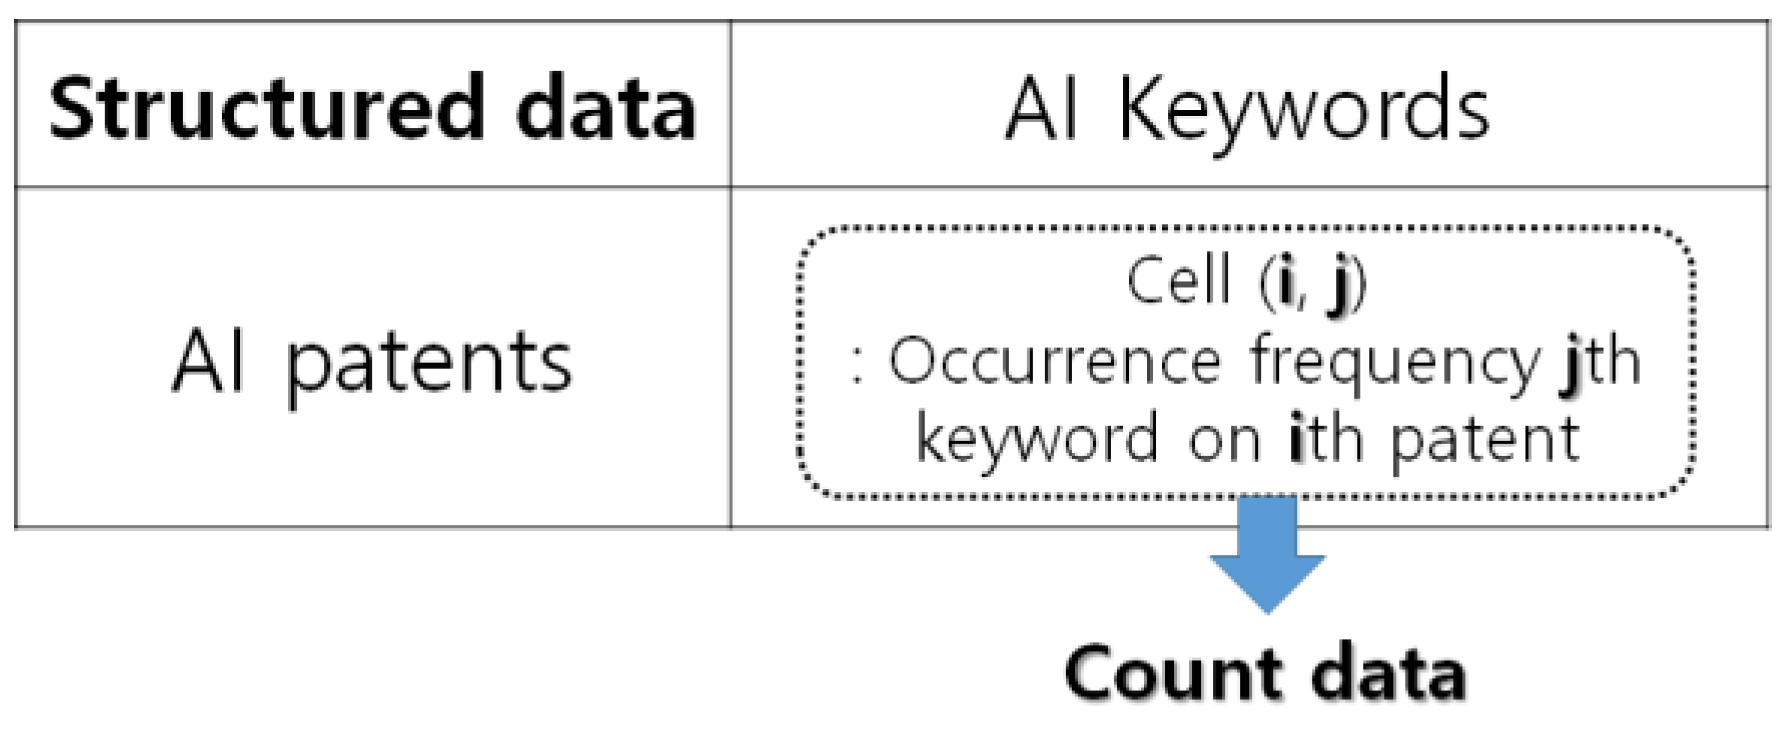
To show how this research could be applied to a practical problem, we performed a case study using the patent documents related to artificial intelligence (AI) technology. We collected the patents applied and registered by 2016 from the WIPSON [21]. The total number of collected and valid patents was 11,973 cases. First of all, we consulted experts on AI and extracted the keywords related to AI from the collected patent document data [22]. Next, using text mining techniques, we built structured patent data for performing our case study [7,17]. Our structured patent data are shown in Figure 5.
The row and column of this data matrix are patents and keywords related to AI, and each cell of this matrix represents the occurrence frequency of each keyword on a patent. In this case study, we selected the keywords ‘Artificial’ and ‘Intelligence’ as dependent variables. The remaining keywords, except dependent variables, were used as predictor variables. That is, the structured data contain the keywords in Table 1 and the keywords ‘Artificial’ and ‘Intelligence’, and each element of the structured data represents the occurrence frequency of each keyword on the AI patents. Based on the structured data, we classified the AI technology as follows:
In Table 1, we divided AI technology to five subtechnologies as follow: Learning, behavior, language, vision, and neuro. In addition, we showed the patent keywords belonging to each subtechnology. We used this technology tree to retrieve the AI patents and analyze them. First, we estimated the Poisson parameters for the patent keywords using a maximum likelihood estimator (MLE) by the frequency values of the keywords. Table 2 shows the estimates of Poisson parameters for all patent keywords.
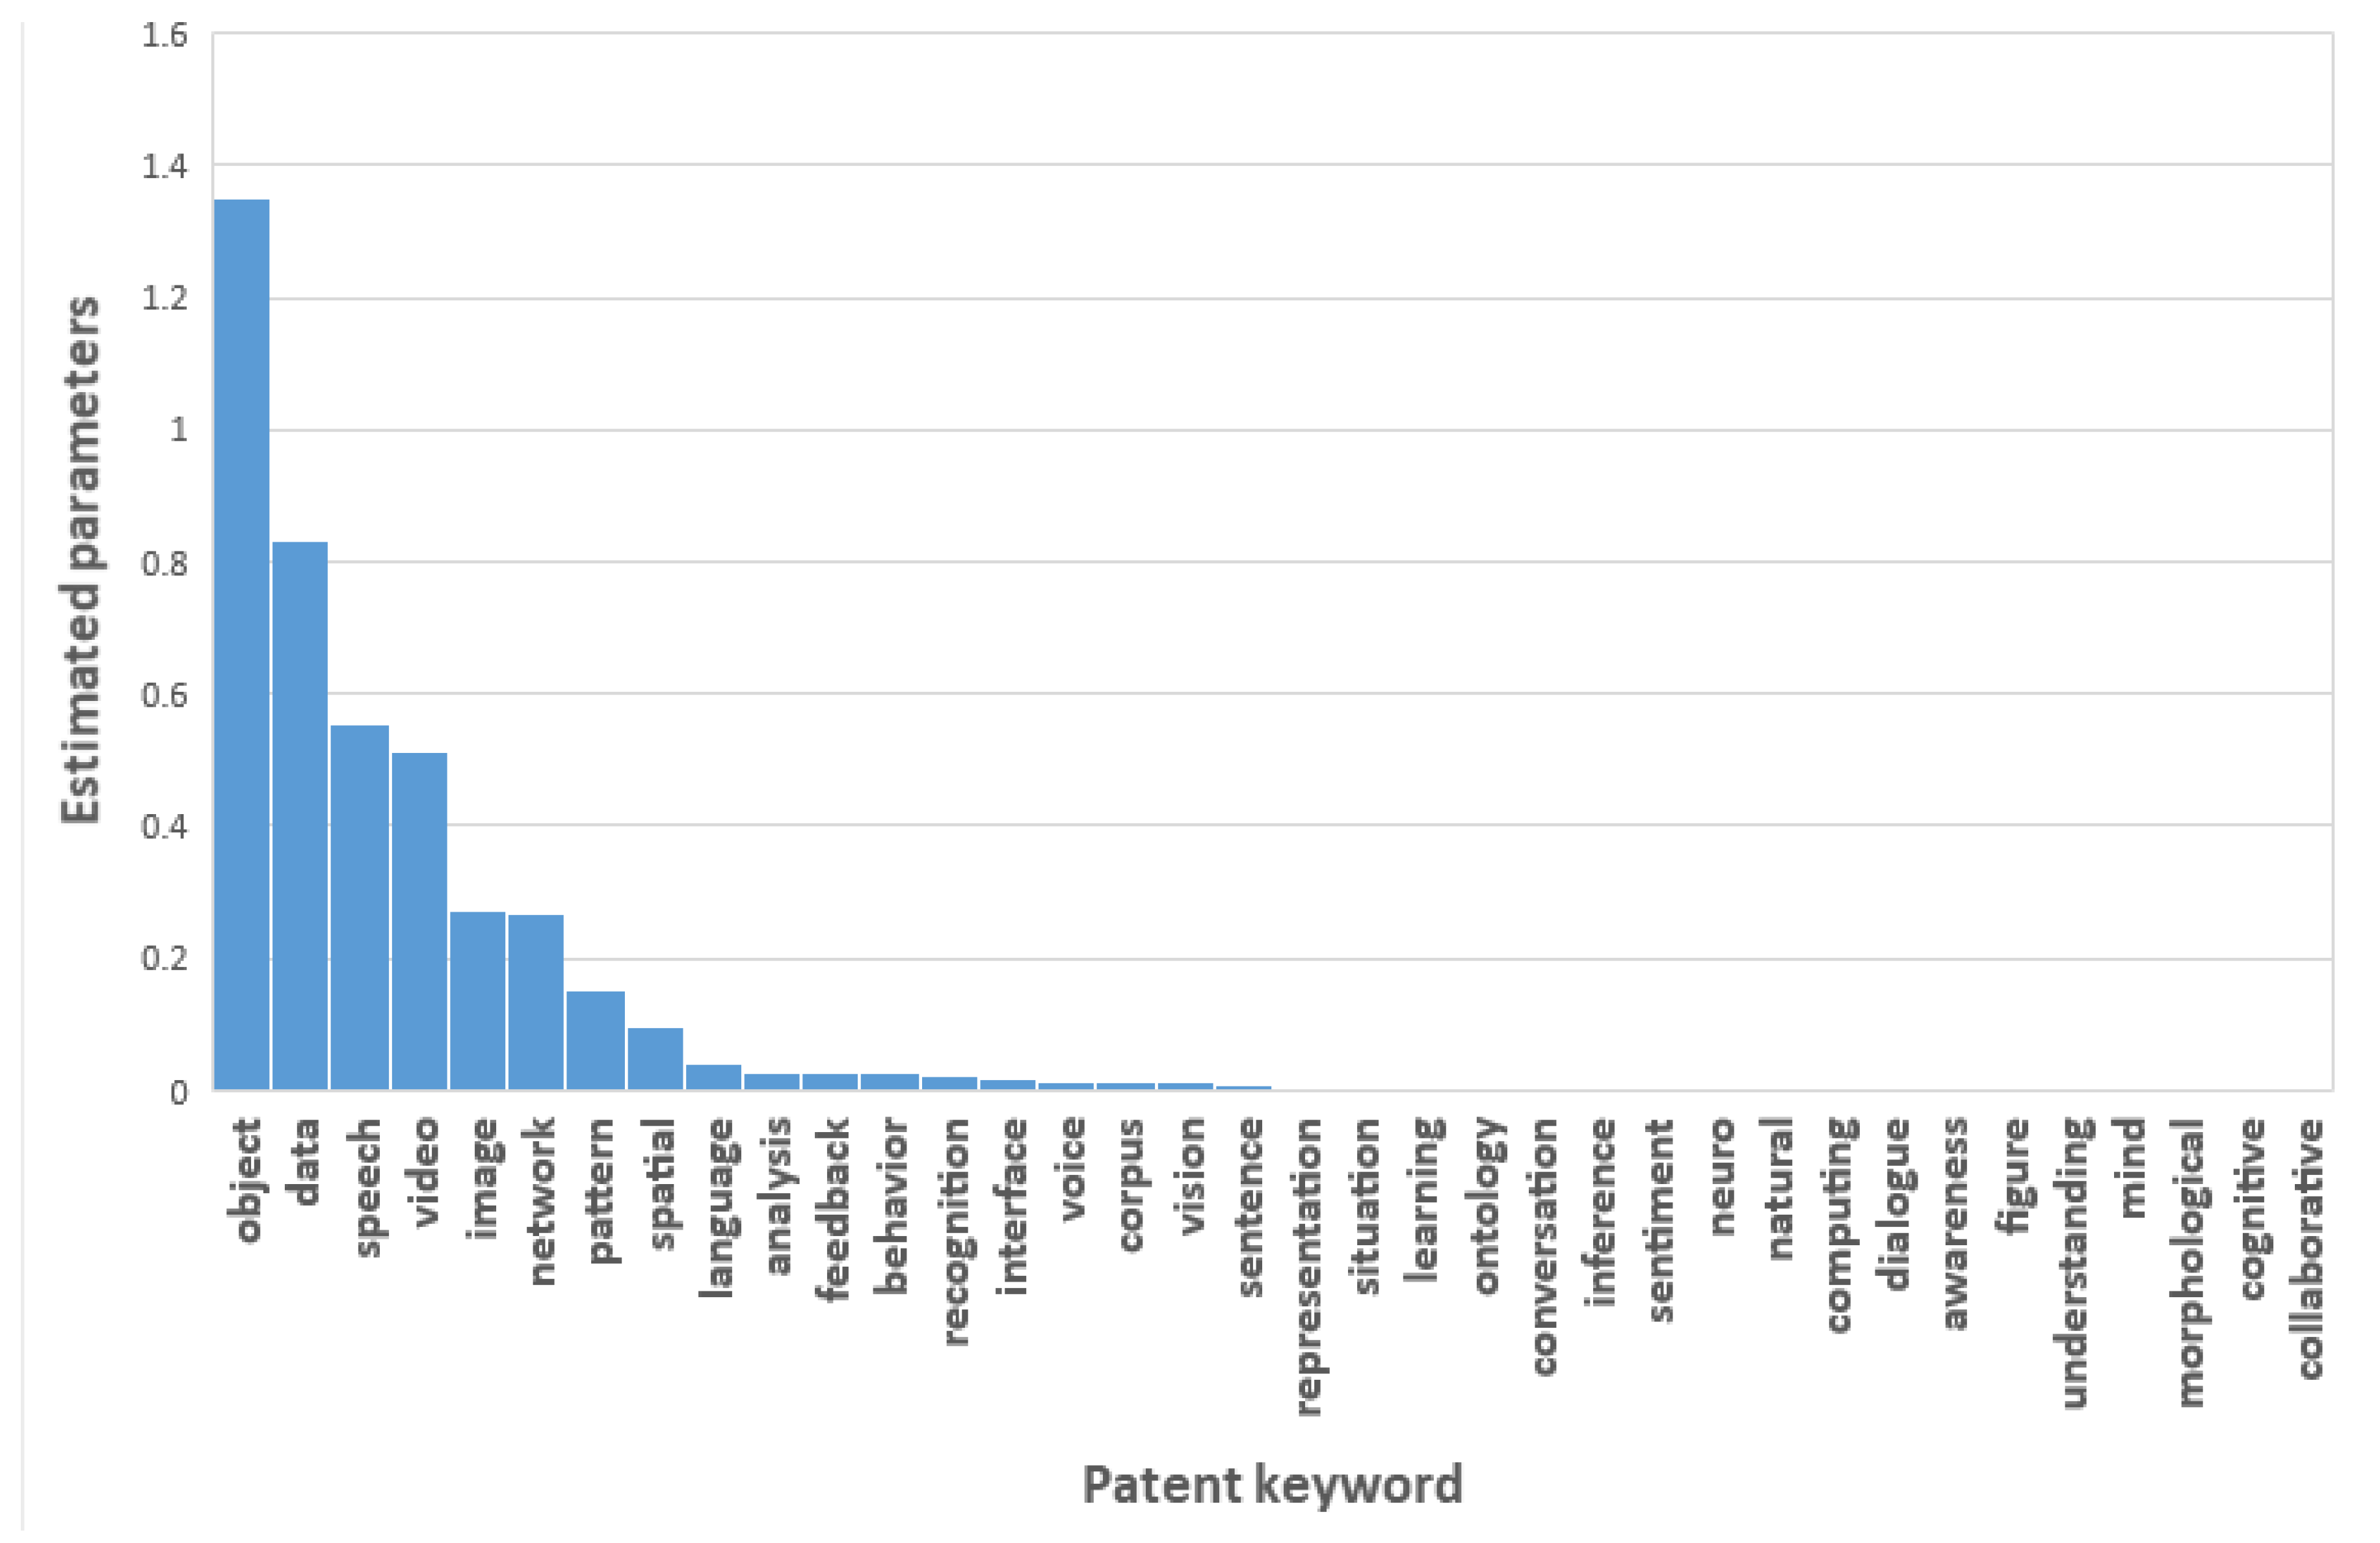
We can compare the relative frequency between the patent keywords in Table 2. These estimates are the MLE (maximum likelihood estimate) for Poisson parameters of AI keywords [18]. Figure 6 illustrates the MLEs for the Poisson parameters of all patent keywords.
In this figure, we found the MLEs of ‘object’, ‘data’, ‘speech’, ‘video’, ‘image’, ‘network’, ‘pattern’, ‘spatial’, ‘language’, ‘analysis’, feedback’, ‘behavior’, ‘recognition’, ‘interface’, ‘voice’, ‘corpus’, ‘vision’, and ‘learning’ are relatively larger than other keywords. Using the results in Figure 6, we determined the patent keywords that affect AI technology. A keyword with a larger MLE value will have more impact on AI technology. We also carried out Bayesian count data modeling on the structured patent data matrix. Table 3 shows the results of the modeling.
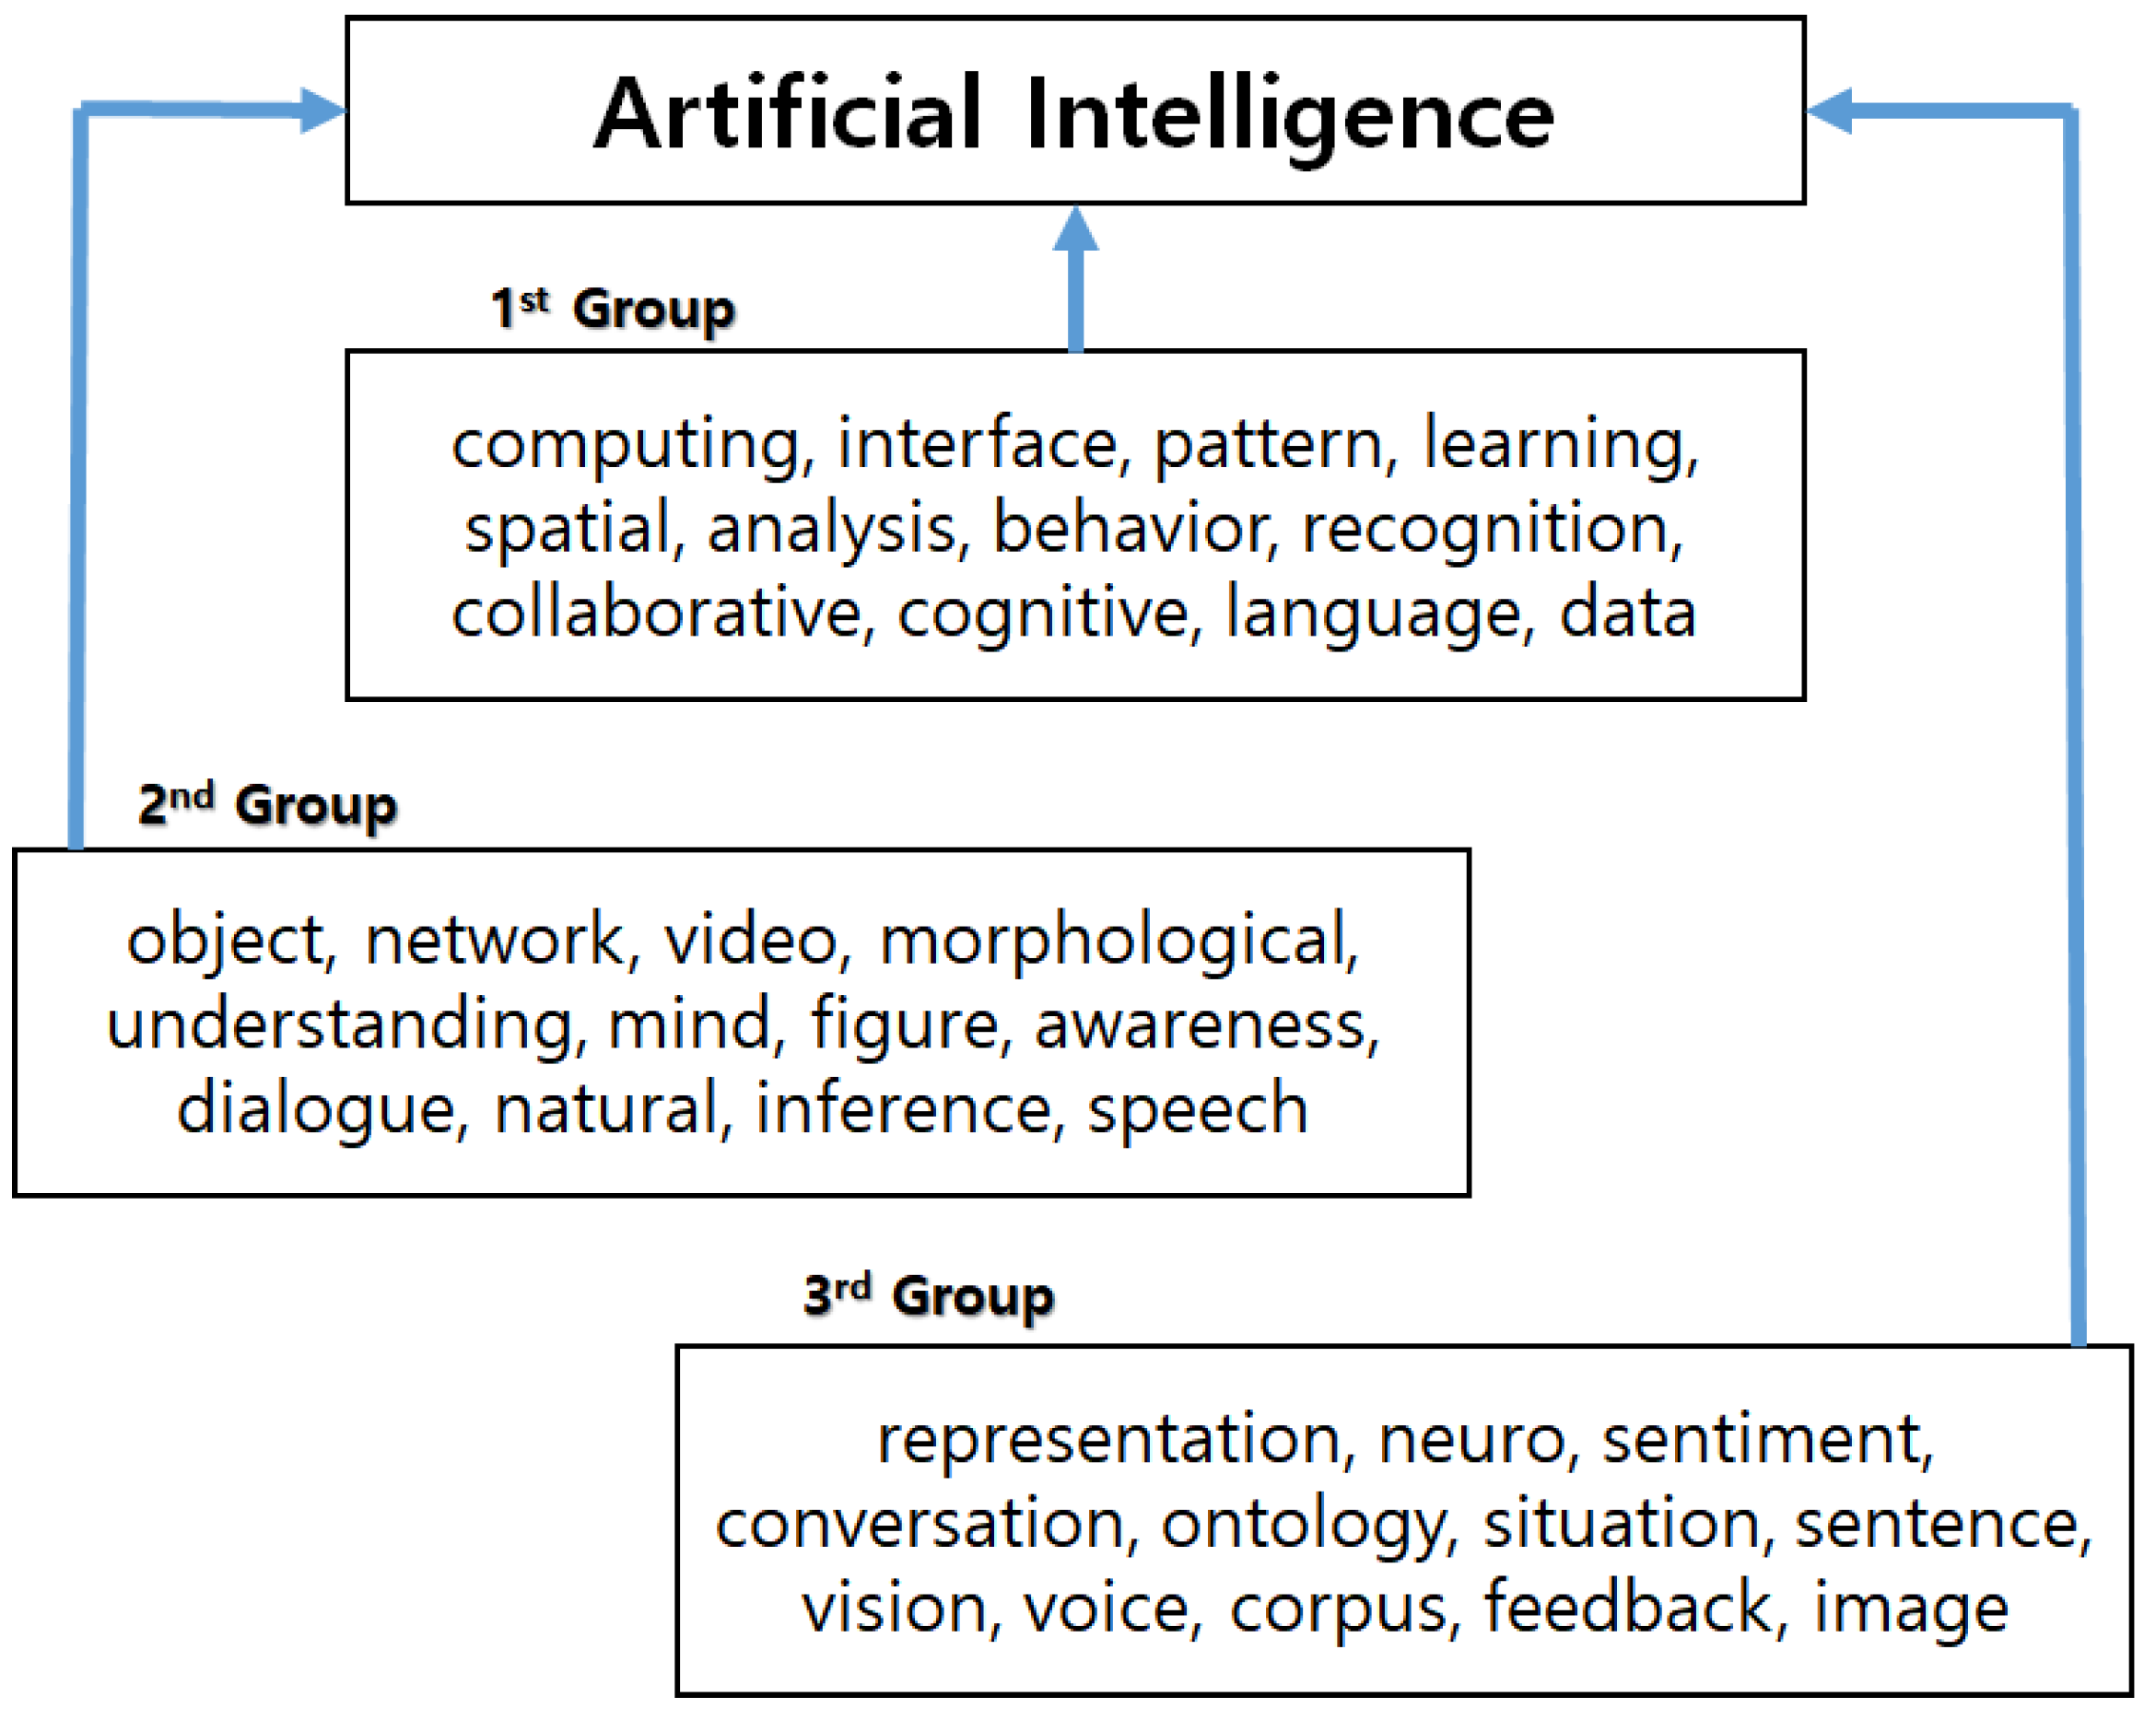
We performed the Bayesian regression models by Gaussian, as well as Poisson distributions. To compare the weights of all keywords equally, we standardized the scale of each variable. In addition, the weight in Table 3 is the average value of Poisson and Gaussian parameters. In this paper, we selected the keywords with larger weight values for finding technological sustainability in AI technology. Using the result of Table 3, we show the patent keyword ranking that influences AI technology in Figure 7.
The keywords in the 1st Group have a greater impact on AI technology than in the 2nd Group or the 3rd Group. Using the experimental results of this paper, we made the following technological structure for sustainable AI technology.
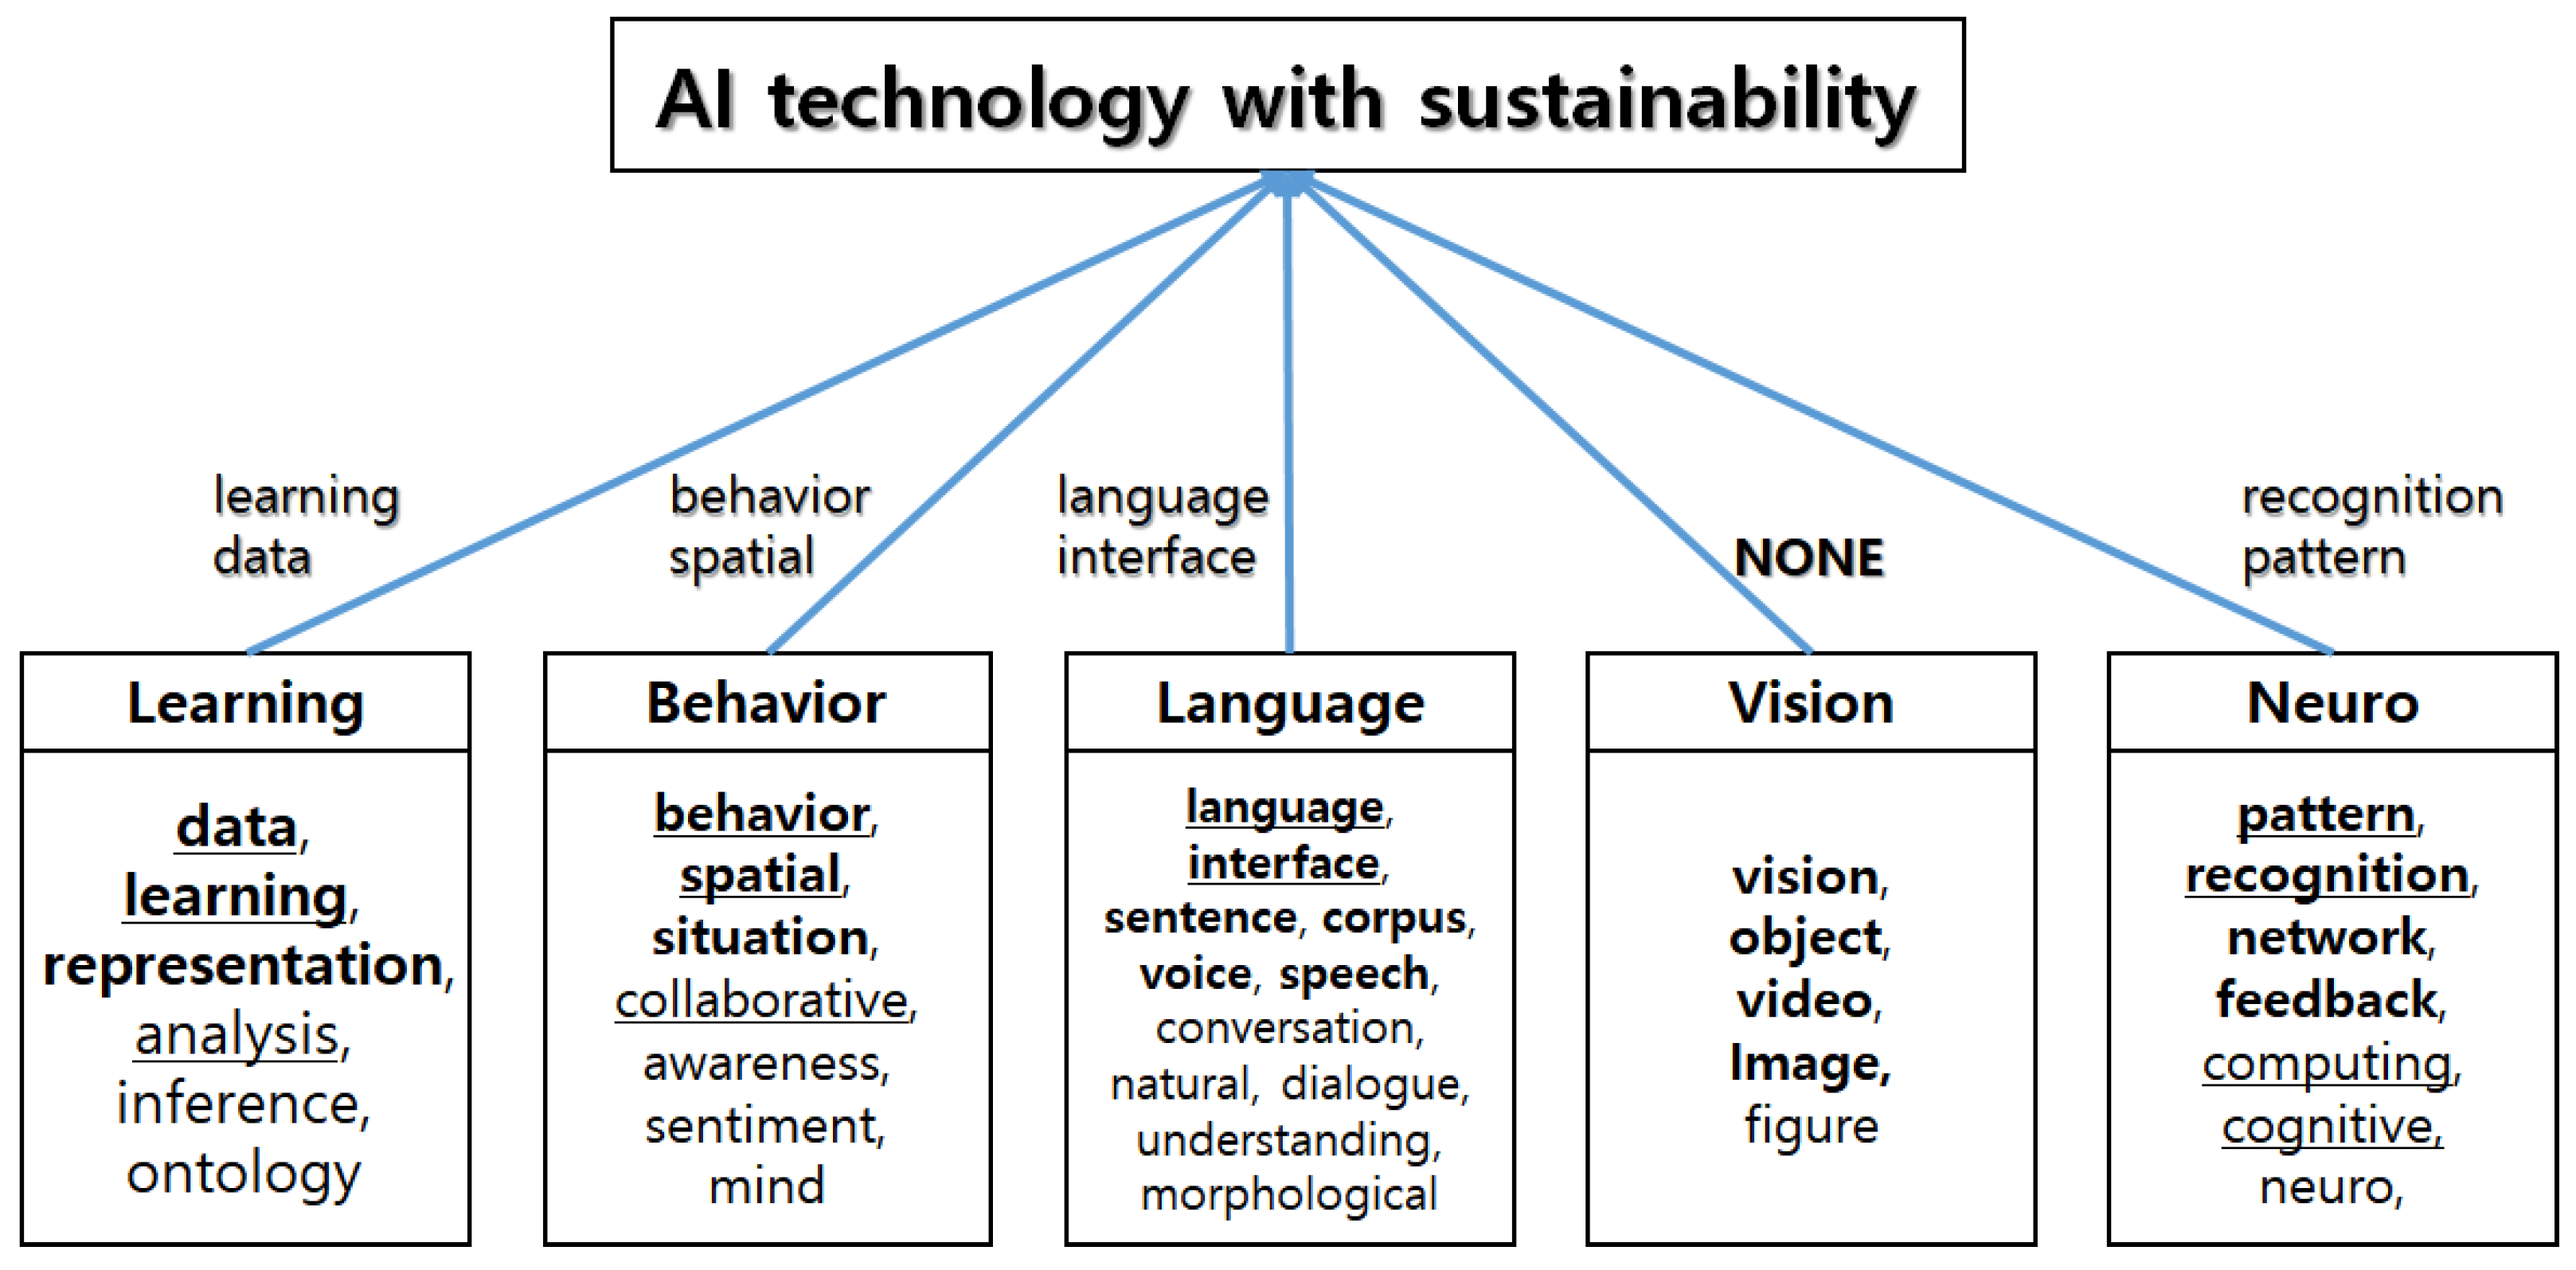
In this paper, we divided the AI technology into five subtechnologies (learning, behavior, language, vision, neuro) in Table 1. In Figure 8, each subtechnology contains the keywords that can represent its technology. For example, the keywords of learning, inference, ontology, representation, analysis, and data describe the learning technology for AI. Each keyword is represented by bold or underlined types, depending on its importance from the results of Table 2 and Table 3. The keywords in bold type are those that have an impact on AI technology from the results of Poisson MLEs. Additionally, the keywords with underlined lettering affect AI technology, based on the Bayesian regression model. Therefore, we knew that the subtechnologies related to learning, behavior, language, and neuro influence the sustainability of AI technology. However. we found that the subtechnology of vision has a relatively small effect on the technological sustainability of AI compared to other subtechnologies. In this paper, we concluded that the four technologies related to ‘learning data’, ‘behavior spatial’, ‘language interface’, and ‘recognition pattern’ are important to continue the sustainability for AI technology.
5. Discussion
Since most statistical analyses are performed based on given or observed data, there is no factor that can reflect subjective opinions of experts with domain knowledge of data in the model building process. However, in the Bayesian count model, the analyst can determine the prior distribution and various attempts can be made based on the expert’s experience in determining this distribution. Through this, we can build a final model with high performance. Using Bayesian count data modeling based on the prior distribution from domain experts, we can generalize our results to various technological fields, such as bio, materials, smart cars, etc.
Our research contributes to quantitative approaches to finding sustainable technology areas in diverse technologies. This paper focuses on objective analysis through patent data analysis compared with existing methods based on qualitative methods. Particularly, the implication of this study is that the subjective experiences of experts are added to the quantitative data analysis.
6. Conclusions
We proposed Bayesian count data modeling to find technological sustainability. To know the sustainable technology in a given technological field is very important to improve the technological competition of a company and a nation. Much research has been conducted to find sustainable technologies. Most of it was carried out using statistical models that do not consider the characteristic of count data from patent documents. However, most structured patent data have a count data structure. In order to solve this discrepancy problem, Bayesian count data modeling is proposed in this study. In addition, we applied the domain knowledge of experts to prior distribution of model parameters in the Bayesian regression model. To show the validity of proposed modeling and illustrate how our approach could be applied to practical problems, we carried out a case study using patent documents related to AI technology. In the case study, we found the subtechnologies for the sustainable technologies of AI. They were learning from data, spatial behavior, interface of language, and pattern recognition technologies. Therefore, we should concentrate our research and development on these subtechnologies to keep the sustainability of AI technology.
Our research can be applied to the research and development-related planning of companies and research institutes. Additionally, this research will contribute to diverse technological fields as well as AL technology. In this research, we considered only the patent keywords extracted from patent documents for patent technology analysis using statistical modeling. Our future work will use more diverse elements as well as keywords, such as citations and claims, to find sustainable technologies for specific technological domains.
Author Contributions
S.J. designed this study and collected the data for the experiment. He also preprocessed the data and selected valid patents and analyzed the data to show the validity of the study, and wrote the paper and performed all the research steps.
Funding
This research received no external funding.
Conflicts of Interest
The author declared no conflict of interest.
References
- Park, S.; Jun, S. Statistical Technology Analysis for Competitive Sustainability of Three Dimensional Printing. Sustainability 2017, 9, 1142. [Google Scholar] [CrossRef]
- Choi, J.; Jun, S.; Park, S. A patent analysis for sustainable technology management. Sustainability 2016, 8, 688. [Google Scholar] [CrossRef]
- Roper, A.T.; Cunningham, S.W.; Porter, A.L.; Mason, T.W.; Rossini, F.A. Banks, Forecasting and Management of Technology; John Wiley & Sons: Hoboken, NJ, USA, 2011. [Google Scholar]
- Kim, J.; Jun, S.; Jang, D.; Park, S. Sustainable Technology Analysis of Artificial Intelligence Using Bayesian and Social Network Models. Sustainability 2018, 10, 115. [Google Scholar] [CrossRef]
- WIPO. World Intellectual Property Organization. Available online: www.wipo.org (accessed on 15 May 2018).
- WIPO IPC. International Patent Classification (IPC), World Intellectual Property Organization. Available online: http://www.wipo.int/classifications/ipc/en (accessed on 15 May 2018).
- Feinerer, I.; Hornik, K. Package ‘tm’ Ver. 0.7-5, Text Mining Package, CRAN of R Project. 2018. Available online: https://cran.r-project.org/web/packages/tm/tm.pdf (accessed on 1 August 2018).
- Hilbe, J.M. Modeling Count Data; Cambridge University Press: Cambridge, UK, 2014. [Google Scholar]
- Cameron, A.C.; Trivedi, P.K. Regression Analysis of Count Data; Cambridge University Press: New York, NY, USA, 2013. [Google Scholar]
- Kim, S.; Jang, D.; Jun, S.; Park, S. A novel forecasting methodology for sustainable management of defense technology. Sustainability 2015, 7, 16720–16736. [Google Scholar] [CrossRef]
- Park, S.; Lee, S.; Jun, S. A network analysis model for selecting sustainable technology. Sustainability 2015, 7, 13126–13141. [Google Scholar] [CrossRef]
- Jun, S.; Park, S. Examining technological innovation of Apple using patent analysis. Ind. Manag. Data Syst. 2013, 113, 890–907. [Google Scholar] [CrossRef]
- Kim, J.; Jun, S. Graphical causal inference and copula regression model for Apple keywords by text mining. Adv. Eng. Inform. 2015, 29, 918–929. [Google Scholar] [CrossRef]
- Jun, S.; Park, S. Examining technological competition between BMW and Hyundai in the Korean car market. Technol. Anal. Strateg. Manag. 2016, 28, 156–175. [Google Scholar] [CrossRef]
- Grimaldi, M.; Cricelli, L.; Rogo, F. Valuating and analyzing the patent portfolio: The patent portfolio value index. Eur. J. Innov. Manag. 2018, 21, 174–205. [Google Scholar] [CrossRef]
- Kim, J.; Jun, S.; Jang, D.; Park, S. An Integrated Social Network Mining for Product-based Technology Analysis of Apple. Ind. Manag. Data Syst. 2017, 117, 2417–2430. [Google Scholar] [CrossRef]
- R Development Core Team. R: A Language and Environment for Statistical Computing; R Foundation for Statistical Computing: Vienna, Austria; Available online: http://www.R-project.org (accessed on 1 April 2018).
- Ross, S.M. Introduction to Probability and Statistics for Engineers and Scientists, 4th ed.; Elsevier: Seoul, Korea, 2012. [Google Scholar]
- Gelman, A.; Carlin, J.B.; Stern, H.S.; Dunson, D.B.; Vehtari, A.; Rubin, D.B. Bayesian Data Analysis, 3rd ed.; Chapman & Hall/CRC Press: Boca Raton, FL, USA, 2013. [Google Scholar]
- Hogg, R.V.; McKean, J.M.; Craig, A.T. Introduction to Mathematical Statistics, 8th ed.; Pearson: Upper Saddle River, NJ, USA, 2018. [Google Scholar]
- WIPSON. WIPS Corporation. Available online: http://www.wipson.com (accessed on 15 May 2018).
- KISTA, Korea Intellectual Property Strategy Agency. Available online: http://www.kista.or.kr (accessed on 16 June 2018).
Figure 1.
Text mining process for creating structure data for Bayesian count data modeling.

Figure 2.
Determination of response variable by generalized linear model (GLM) results.

Figure 3.
Technology structure of Bayesian count data modeling.

Figure 4.
Concept of Bayesian count data modeling.

Figure 5.
Structured patent data.

Figure 6.
MLEs of all patent keywords.

Figure 7.
Patent keyword ranking that influences artificial intelligence.

Figure 8.
Technological structure for sustainable AI.


Table 1.
Hierarchical structure of AI technology.
| Sub-Technology | Patent Keywords |
|---|---|
| Learning | Learning, inference, ontology, representation, analysis, data |
| Behavior | Behavior, awareness, situation, sentiment, mind, spatial, collaborative |
| Language | Language, natural, understanding, morphological, dialogue, sentence, corpus, voice, speech, conversation, interface |
| Vision | Vision, figure, object, video, image |
| Neuro | Neuro, network, computing, feedback, pattern, recognition, cognitive |
Table 2.
Estimates of Poisson parameters for all keywords.
| Keyword | λ | Keyword | λ | Keyword | λ |
|---|---|---|---|---|---|
| analysis | 0.0287 | image | 0.2745 | pattern | 0.1506 |
| awareness | 0.0008 | inference | 0.0019 | recognition | 0.0211 |
| behavior | 0.0258 | interface | 0.017 | representation | 0.0062 |
| cognitive | 0.0001 | language | 0.0426 | sentence | 0.0103 |
| collaborative | 0.0001 | learning | 0.0058 | sentiment | 0.0016 |
| computing | 0.001 | mind | 0.0004 | situation | 0.006 |
| conversation | 0.0035 | morphological | 0.0004 | spatial | 0.0966 |
| corpus | 0.0123 | natural | 0.0011 | speech | 0.5527 |
| data | 0.8316 | network | 0.2668 | understanding | 0.0005 |
| dialogue | 0.0009 | neuro | 0.0014 | video | 0.5114 |
| feedback | 0.0287 | object | 1.351 | vision | 0.0123 |
| figure | 0.0007 | ontology | 0.0044 | voice | 0.0153 |
Table 3.
Model parameters and weight.
| Keyword | Poisson | Gaussian | Weight |
|---|---|---|---|
| analysis | 0.1023 | 0.0176 | 0.0599 |
| awareness | −0.663 | −0.0013 | −0.3321 |
| behavior | 0.1062 | 0.0103 | 0.0582 |
| cognitive | −0.2173 | −0.0016 | −0.1094 |
| collaborative | −0.1971 | 0 | −0.0985 |
| computing | 0.0867 | 0.2221 | 0.1544 |
| conversation | −1.73 | −0.0009 | −0.8654 |
| corpus | −4.5122 | −0.0009 | −2.2566 |
| data | −0.2869 | −0.0065 | −0.1467 |
| dialogue | −0.882 | −0.0007 | −0.4414 |
| feedback | −5.6046 | −0.0046 | −2.8046 |
| figure | −0.632 | −0.0002 | −0.3161 |
| image | −16.8687 | −0.0159 | −8.4423 |
| inference | −1.1521 | −0.0013 | −0.5767 |
| interface | 0.167 | 0.0284 | 0.0977 |
| language | −0.2675 | 0.002 | −0.1327 |
| learning | 0.1336 | 0.05 | 0.0918 |
| mind | −0.5577 | −0.0004 | −0.2791 |
| morphological | −0.5222 | −0.0012 | −0.2617 |
| natural | −0.8831 | −0.0016 | −0.4424 |
| network | −0.3976 | −0.0099 | −0.2038 |
| neuro | −1.5059 | −0.0007 | −0.7533 |
| object | −0.3076 | −0.0085 | −0.158 |
| ontology | −2.0103 | −0.0028 | −1.0065 |
| pattern | 0.1729 | 0.0155 | 0.0942 |
| recognition | −0.003 | 0.0214 | 0.0092 |
| representation | −1.247 | −0.008 | −0.6275 |
| sentence | −3.2219 | −0.0033 | −1.6126 |
| sentiment | −1.695 | −0.0006 | −0.8478 |
| situation | −2.1258 | −0.0019 | −1.0638 |
| spatial | 0.1356 | 0.0144 | 0.075 |
| speech | −1.2228 | −0.0131 | −0.618 |
| understanding | −0.546 | −0.0037 | −0.2749 |
| video | −0.5061 | −0.0072 | −0.2567 |
| vision | −3.2688 | −0.0032 | −1.636 |
| voice | −3.6855 | −0.0027 | −1.8441 |
© 2018 by the author. Licensee MDPI, Basel, Switzerland. This article is an open access article distributed under the terms and conditions of the Creative Commons Attribution (CC BY) license (http://creativecommons.org/licenses/by/4.0/).
Share and Cite
MDPI and ACS Style
Jun, S. Bayesian Count Data Modeling for Finding Technological Sustainability. Sustainability 2018, 10, 3220. https://doi.org/10.3390/su10093220
AMA Style
Jun S. Bayesian Count Data Modeling for Finding Technological Sustainability. Sustainability. 2018; 10(9):3220. https://doi.org/10.3390/su10093220
Chicago/Turabian StyleJun, Sunghae. 2018. "Bayesian Count Data Modeling for Finding Technological Sustainability" Sustainability 10, no. 9: 3220. https://doi.org/10.3390/su10093220
Note that from the first issue of 2016, this journal uses article numbers instead of page numbers. See further details here.