Abstract
Car parking is a challenging part of urban transportation and traffic violations cause many problems for citizens. Studies have shown that there is a direct relationship between vehicle parking violations and urban places. In this study, we investigated the spatial distribution of vehicle violations in a region of Tehran, Iran, that is suffering from a heavy traffic load and heavily polluted air. Although there are two dissimilar urban segregations in the north and south of the study area, in both of the regions, about 70% of all curb-parks are legal, while the remaining are illegal. However, our analysis indicates a dissimilar pattern of car parking violations. Additionally, spatial analysis reveals a direct relationship between some POIs (Point of interests) and the occurrence of car park violations. For example, the number of vehicle park violations around the hospitals is more than the average of the study area. However, the number of park violations around the universities is less than the average. Our results also show that POIs have an impact radius that leads to violations occurring in that area. For example, the influence range of a hospital on the creation of car park violations was estimated at 125 meters. Our presented approach along with the discussed findings and conclusions can be useful to an extensive range of stakeholders, including urban planners, traffic police departments, local municipalities, law enforcement agencies and environmentalists, to have a better perspective of infrastructure planning.
1. Introduction
Since the advent of motor vehicles, providing places for parking in cities has been an important issue that should be considered in urban planning and management. Every city trip ends at a park on the street or a parking lot. Therefore, a park on the street is an essential part of a city’s transport system. Box [1] suggests that curb-parks should not be allowed next to main roads or at least during rush hours, and only on the adjacent streets where there is the possibility of parking. However, some urban and transportation planners believe that a curb-park is part of new urbanization, and the value of land in the urban environment significantly increases with the possibility of parking alongside it [2]. Nevertheless, in recent years, due to the growth and development of urbanization, unauthorized, chaotic, and temporary parks of cars along the streets, especially in large cities, has increased the traffic and barriers for pedestrians and drivers, which violates traffic laws. Increasing the marginal park will reduce the street width and indirectly slow traffic [3,4]. Besides, curb-park violations directly cause traffic congestions and interrupt the normal flow of cars on the roads. In other words, drivers who do not stop correctly on the designated places contribute to the lingering travel times of road users [5]. This issue results in a lot of problems, especially in POIs, including commercial, administrative and educational units. It should be noted that parking and departing from the park will slow down traffic and increase traffic accidents [6]. In many urban roads, there are parallel stops and even angled stops along the streets. A comparison of parallel parks with angled parks shows that the incidence of car accidents in angled parks are two to three times greater than that of parallel parks [7,8].
In a field study in a small area of Los Angeles by Shoup [9], the average distance travelled to find an appropriate parking space by cars on the streets was estimated to be 3600 miles per day. Drivers significantly reduce their speed and increase their heart rate when searching for street parking [10]. In an analytical and quantitative study, Guo, Gao [2] using street-width variables and the number of moves required to perform a park, showed that stops along the streets had a significant effect on slower traffic and increased the city trip time of other drivers. Chen, Conway [11] reviewed the New York City data sets and found that the increasing demand for delivery of small packages has increased the parks along the streets. In other words, in a megacity of New York, traffic and the stops for the delivery of goods have become a challenge.
The research show that there is an association between on-street parking and crash risk [12]. A study in Montreal, Canada, showed that more than two-thirds of accidents with pedestrians occurred near the intersection of the streets. Therefore, it was suggested that some restrictions on the car-parks, speed limits on the roads, and some simple prohibitions such as parking forbiddances near the intersections should be applied [13]. Humphreys, Box [14] showed that 49% of accidents happened on the main streets, 68% of accidents occurred on the roads to the highways, and 72% of accidents happened in the suburbs with stopped cars at the sides of the streets. Additionally, the findings of this study show that 20% of the total number of accidents is due to street-side parks. The curb-parks near intersections seem to be one of the vital causes of accidents due to disrupting the visibility of drivers when entering the intersections [15,16].
Today, most of the large cities have become an industrial and automotive environment rather than a safe place for humans. Promoting automobile driven and industrial approaches to the city have created impassable roads for many citizens, including the elderly and the disabled people, heavy traffic, long highways, and meaningless and depressing freeways. There is a global consensus on using the bicycle, public transportation and walking to achieve sustainable urban transport, which reduces the use of private cars [17]. Gössling, Schröder [17] outlined that in the three studied cities, 58–59 percent of the spaces allocated for urban transportation (parking and road space) is used by private cars. The study showed that only 1.3 to 4.1 percent of urban transport space was allocated to cycling routes, while the space devoted to the car-park is larger than the total bike path space. Another study in China showed that curb-parks reduced the number of e-bikes usage from 65% to 47% [18]. Additionally, curb-parks increase the adverse lane-crossing behaviour of non-motorized vehicles [19,20]. It can be said that curb-parks are one of the significant obstacles to reaching a human-centred city and sustainable urban transportation.
GIScience can offer practical solutions for collecting, storing, retrieving, processing, analysing and displaying spatial data. Due to its unique capabilities in solving spatial problems and providing scientific and precise solutions in planning and decision making, their popularity has been increasing day by day, and their areas of application have become more extensive. In recent years, various studies have been carried out on the use of GIS tools in accident analysis and driving rules violations [21,22,23,24] attempting to boost urban safety and healthy urban living by shedding light on urban planning policies. In particular, Martens and Benenson [25] combined agent-based modelling with GIS tools to simulate driving behaviours in the car-park. They demonstrated that usually, drivers are looking for a suitable park within a 250-meter range of their target destination. Even drivers who use navigation services to find the shortest route search for a suitable park location after reaching the desired location [26]. Drivers who arrive without planning to reach their destination are trying to park in any possible way within the desired range. Therefore, the lack of planning for a parking place has a significant impact on how to park based on the nature of the requirement of the stops (daily, administrative, emergency, recreational, shopping, etc.). As surveys show, drivers who are not well aware of the location and duration of the park are less sensitive to the correct way of the car-park. Ajeng and Gim [27] conducted a study in Indonesia and investigated an association between parking duration and commercial type of land uses and street characteristics.
The World Health Organization (WHO) reported that 1.35 million people die every year on the roads worldwide due to car accidents [28]. Table 1 shows the death per vehicle in Iran and some other countries in 2018.

Table 1.
Comparison of the vehicle per 1000 population with death by car accidents per 100,000 vehicles in Iran and some other countries (source: WHO 2018).
As shown in Table 1, the number of deaths per vehicle in Iran is more than four to eight times higher than in developed countries such as the USA and Germany, respectively, and more than two times that of a neighboring country such as the UAE. According to the Iranian Legal Medicine Organization (ILMO), 26% of those deaths were on city roads. The high volume of mortality per vehicle in Iran indicates the need to study the violations and reasons for this issue.
Despite extensive studies in the modelling and analysis of accidents and civil violations, the literature lacks spatial analysis of vehicle park offences and their association with land use. Therefore, the present study examines the spatial distribution of vehicle park offences along the streets in an urban district of Tehran. Typically, these violations follow certain patterns, and understanding these patterns can be used to make more efficient decisions to tackle the problem of curb-parks in cities.
2. Study Area and Data
2.1. Study Area
The chosen study area is the 6th district of Tehran, due to its centrality and high occurrence of traffic violations. The selected study area lies within an area of 2138 hectares located approximately in the centre of the city. It has a 251,384 population based on the census of 2016. The district’s area is 3.3 percent, and its population is 2.9 percent of the city. It currently holds more than 30 percent of governmental buildings, public and private institutions, banks, and state organisations. In other words, the government management, decision-making system as well as the city’s modern business-economic systems are located in the 6th district. The combination of the above factors makes the area of demand to regional and urban studies.
The study area contains large and crowded streets such as Azadi Street, Enghelab Street, North Amir Abad and south Karegar Streets, as well as Enghelab Square, where they meet. The existence of various kinds of POIs in the study area provided a unique situation to investigate their impact on curb-park violations. Besides, the accessibility to the study area facilitated the data collection process. Figure 1 shows the study area and the selected regions on both sides of Enghelab Square (part A (upper right) and part B (lower left)).
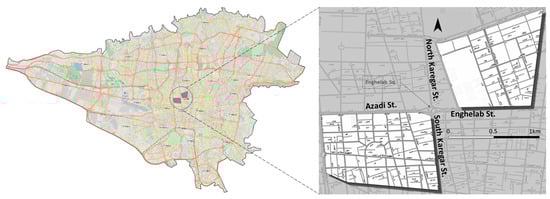
Figure 1.
Study area.
Table 2 shows the characteristics of regions in the study area. The area of region B is 10% bigger than region A; however, the length of streets, where their curb-parks are in region B is 20% longer than in region A.
Table 2.
Characteristics of regions in the study area.
2.2. Data
As per data collection, we used a free Android application called SW Map, which uses the built-in GPS of the mobile phone with a five-meter accuracy. The accuracy of the system was reliable enough to carry out this project. However, manual inspection was also applied to avoid significant inaccuracies.
Since the focus of the study was on vehicle park violations, in the first step, a list of possible infractions was collected through a field visit. The breaches after visiting the area are illustrated and listed in Figure 2a,b. Any possible violation that may not be included in the list was considered as a legal park. The table was entered into the application, and the necessary settings for data collection were done. The flowchart of our study is shown in Figure 3. Because the curb-parks in the area are temporary and dynamic, therefore, a route was designed to allow authors to collect data simultaneously on both sides of the streets. The data were collected from 10 AM to 1 PM, within four days. During this time range, the usual traffic of Google shows the least congestion. Therefore, the effects of the rush hour would be minimum. Data collection was done at the same time to avoid any additional errors occurrence.
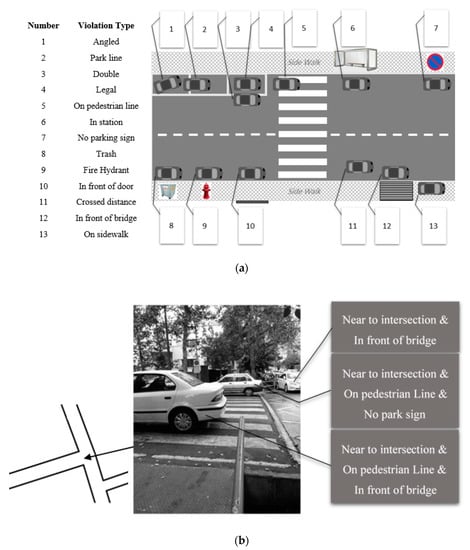
Figure 2.
(a) A visual illustration of park violation types; (b) An example of park violations at the streets’ intersection.
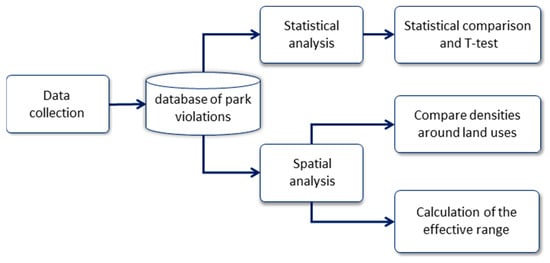
Figure 3.
Flowchart of the study.
3. Methods and Results
3.1. Statistical Analysis of Traffic Violations
The collected data were analysed statistically and spatially. Statistical analyses were performed based on the number of types of offences and the comparison of the two regions within the study area. Table 3 shows the statistics of violations data in two areas, namely A and B. There were not any curb-park-lines in region B; therefore, there were no recorded curb-park-line violations except for five cases. The smallest violation number in both areas is the angled car-park. The most substantial curb-park violation is the park-line, on the bridge stop and the double-parking in region A, respectively, while in region B, the highest number is for double-parking and stopping on the sidewalk followed by stopping on the pedestrian line.
Table 3.
Park violations statistics in regions A and B.
The area of regions and their streets’ length vary; therefore, we normalised the number of parks based on the total number of illegal parks. Figure 4 graphically illustrates the comparisons of the curb-park violations.
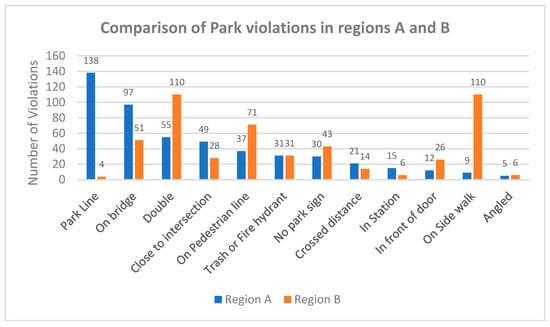
Figure 4.
Comparison of park violations in regions A and B.
The bar chart in Figure 4 reveals some facts about the distribution of park violations in the regions. Park-line violation in part A is greatly higher than part B; however, the number of on sidewalk violations in region B is significantly higher than in region A. Additionally, double-park and on pedestrian line violations in region B is twice as big as in region A. In contrast, on bridge park violations in region A is two times bigger than region B. Although the remaining park violations have different numbers, they are negligible because of the small number of them. The investigations showed the reasons for this discrepancy were in the spatial features of the regions. Due to the lack of park-lines in region B, the recorded park-line violations are small. Additionally, the field visit showed that the width of sidewalks in region A was narrow. Therefore, stopping on the sidewalks was impossible.
3.2. Spatial Analysis of Traffic Violations
Performing spatial analysis allowed us to analyse curb-park violations in terms of their patterns and spatial distribution, which are depicted in the following sections.
Density of Total Stops
Figure 5 shows the maps of the density of total stops, including both legal and illegal stops. On some streets, such as Enghelab Street and Jomhoori Avenue, there is no congestion due to the intense surveillance of police on these streets, while in some areas, there is a high density of stops. In region A, there are two dense parts, which is because of a street march in that area during the data collection.
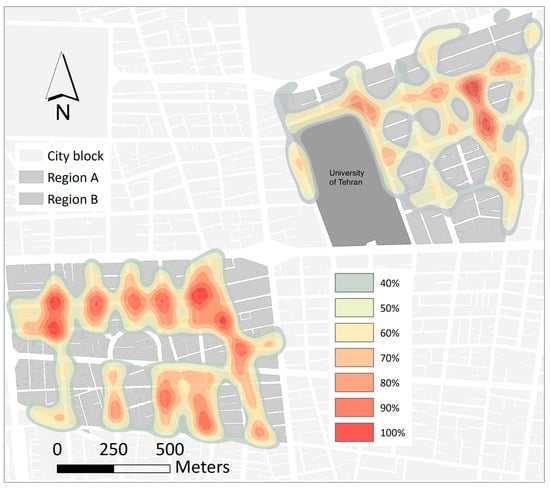
Figure 5.
Density analysis of total stops in regions A and B.
It seems the stopping density is higher at the intersections due to the impact of the points on the crossroads. In other words, intersections have more than two traffic streams that make the intersections as hotspots of curb-parks [29]. Additionally, this could be due to the nature of taking a taxi along the streets in Iran as people raise their hand to take a taxi and taxi drivers stop along the streets to pick up passengers and often fill their cars with four passengers.
The question that arises is whether the park violations in the intersections are more than the other parts of the streets? To answer this question, buffers, within a radius of 50 meters, were drawn to the centre of the intersections and the points were separated. Then, the statistics of inside and outside of intersections were analysed separately, which is shown in Table 4.
Table 4.
Statistical comparison of stops inside and outside intersections in the two regions.
The rate of stops, inside and outside of the intersections relative to each other and relative to cumulative stops is approximately the same in region A. While in region B, the number of illegal stops inside the intersections is higher than the outside.
Figure 6 shows region A with points inside and outside the intersections. As can be seen, almost in all intersections, there are curb-parks except for the intersections with narrow streets, which is not possible due to the width of the road that makes it impossible.
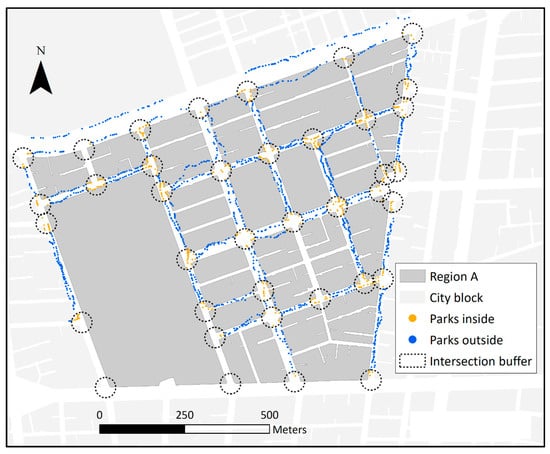
Figure 6.
Points inside and outside of intersections in the regions A.
To extract the spatial patterns of car park violations, the stops were divided into two categories, legal and illegal. Figure 7 shows regions A, B, and the density of the stops. If the distribution of legal and illegal stops is homogeneous, it is expected that the distribution of total, legal, and illegal stops have the same patterns. In other words, where the total stops’ density is large, both legal and illegal stops must have high density and vice versa. A close look at Figure 7 shows that this hypothesis is not valid in the entire study area. For example, around the University of Tehran, there is a high density of stops in its northern parts. It is located in region A as a large block in the west of the map. However, the legal stops have a very high density around the campus, and the illegal stops are sparse. Additionally, in the west part of region A, there is a high density of total and illegal stops while the legal ones have a relatively low density. However, according to Table 4, the number of legal stops is always higher than illegal stops. Table 4 shows that approximately 70 percent of total stops are legal, and 30 percent of all parks are illegal.
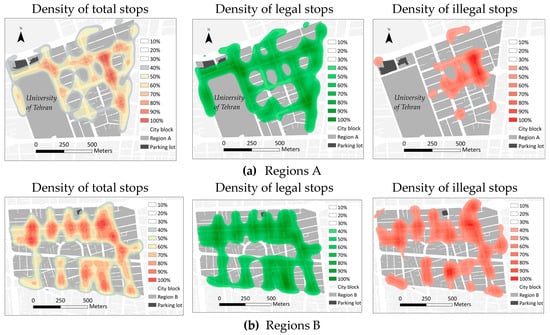
Figure 7.
Comparison of legal and illegal stops in regions A and B.
3.3. Influential Factors in Legal and Illegal Park Densities
In this study, 12 types of curb-park violations were identified through a field visit. It seems that park violations happen due to a lack of space; however, some violations prove otherwise. For example, angled park or park-line violations occur due to drivers failing to comply with the local traffic regulations.
With the argument presented in the previous section, it seems that some POIs affect how cars stop. In other words, an amenity such as a hospital increases illegal stops, while other amenities such as a university decrease illegal stops. Features that have similar high values were estimated using Kernel Density Estimation (KDE). The KDE method is widely used in finding clusters and hotspots, e.g., [30]. We considered the bandwidth of the kernel function 100 meters consistent with the impact range of POIs. The density map was overlaid on top of the OpenStreetMap layer to find the factors that affect the type of parks (legal or illegal). The centres of the densest parts were extracted. The results show that the hospital is one of the most essential factors in the creation of congestion in the park violation. For example, as shown in Figure 8b, the location of Mostafa Khomeini hospital overlapped with one of the illegal curb-park densities. Additionally, the entrance of Tehran University matched the legal stops’ dense points.
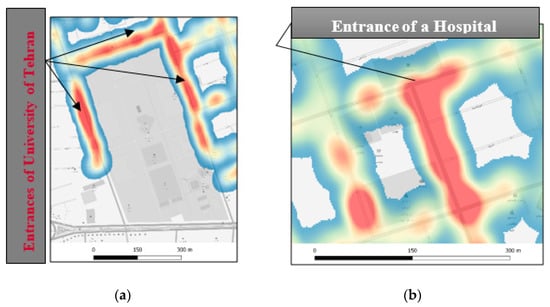
Figure 8.
(a) POI and the legal stops density; (b) POI and illegal stops density.
A positive and direct relationship between the hospitals and the density of curb-park violations was visible in the field visit. There were high densities of violated parks around hospitals. Other influential POIs that were discovered after the above-mentioned method (overlaying maps) are the cinema, coffee shop, bank and bakery.
Visualising POIs on top of density maps shows that some POIs conform with the dense areas of violated stops, and legal stops match another type of POIs. Dense centres of legal stops that fit the POI include colleges, libraries and administrative centres. Additionally, legal dense centres are far from illegal dense centres. As can be seen in Figure 7, around the University of Tehran, the legal stops are very dense, indicating that curb-park rules are carefully heeded in this area. In the northwest corner of the University of Tehran, there is also a judicial centre surrounded by proper stops.
In Figure 7 the parking lots are shown in both parts of the areas. As can be seen, although there is a high density of curb-parks around the parking lots, the majority of them are legal. The density of illegal parks vanished around the parking lots in both parts of the study area.
Concerning the density of the legal and illegal stops around some of the POIs, a hypothesis is formed. This hypothesis states that the stops that seem to be planned or of a longer time, are of the legal density. For example, the stops around the hospital cannot be planned and emerge as an emergency. Therefore, legal stops are less. While for stops around the library, the drivers have a prior plan and would spend a long time there, so the legal stops are dense. In other words, the assumption of having a plan ahead or not, and the duration of the stoppage justifies the stops density (whether legal or illegal).
3.3.1. Park Violations around Hospitals
The stops inside and outside 100-meter buffers of hospitals were compared to investigate park violations around hospitals. Figure 9 shows the number of infractions found in and out of a 100-meter distance from hospitals. As the chart shows, the number of park-line violations and double-parks have risen sharply around hospitals. The double-parks tripled and passing over park-lines nearly doubled in the vicinity of the hospitals.
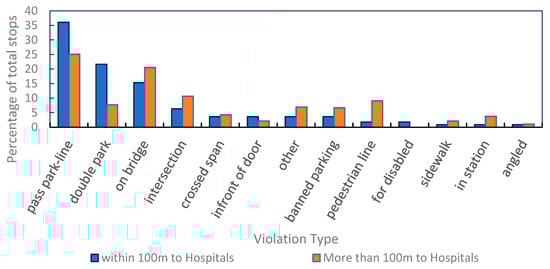
Figure 9.
Comparison of the stop violations inside and outside of the 100-meter span of hospitals.
There is a statistically significant difference between the number of curb-park violations between the zones, with a confidence level of more than 99.9%. According to the bar chart, double-parks and park-line violations within a 100-meter distance from the hospital are much higher than outside of the 100-meter range. Accordingly, the impact range of the hospital on increasing the number of curb-park violations can be calculated.
The calculations show that there is not a significant difference between park violations within 100 meters and outside 100 meters of banks, supermarkets and schools. In other words, the patterns of park violations around the mentioned POIs are the same as the average pattern of the study area.
Figure 10 shows the impact range of a hospital in occurring a park violation, the more distance from the hospital, the less illegal curb-parks and vice versa. The increase in the number of infractions (at distances of more than 150 m) is due to the interference of the influence of other hospitals and other factors. According to the diagram, the hospital has an impact zone of approximately 125 meters, which is measured from the hospital entrance door. The impact range was calculated from the fitted line. The reason for the last reduction (at a distance of more than 250 meters) is the limit of the study area. As the distance from the hospital increases, the number of violations decreases as well, because there is not any recorded points outside the study area.
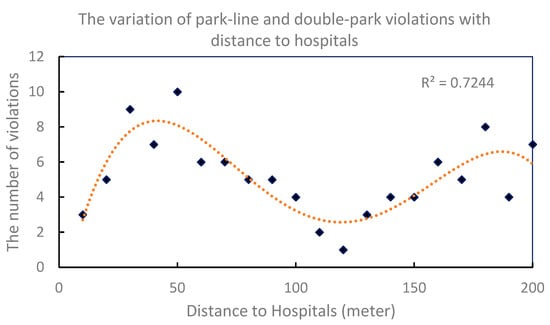
Figure 10.
Diagram of the number of park violations with distance from hospitals.
3.3.2. Park Violations around POIs
Figure 11 and Figure 12 show legal and non-accurate stops around the library, university and judicial offices. Closer to these POIs, the higher the number of legal stops. Conversely, closer to these POIs, the lower the number of illegal stops. As can be seen, the impact range of these POIs is calculable as the same as for the hospital. The impact range of these POIs is nearly 100 meters.
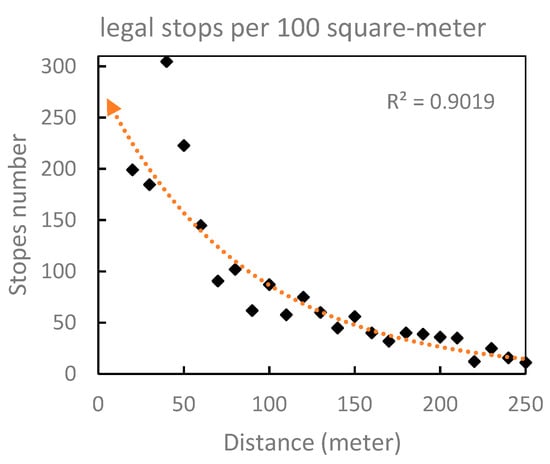
Figure 11.
Increase of legal stops near the POI.
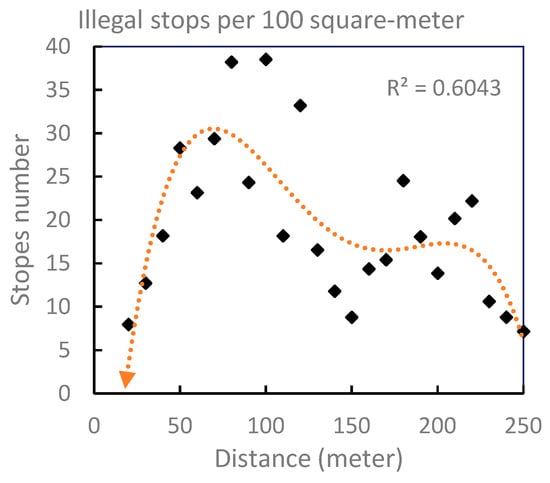
Figure 12.
Reduction of violations near the POI.
4. Discussion
In this study, the relationship between vehicle stops in two regions of Tehran city was investigated. The results of the study showed that spatial analysis of parking violations could help in discovering their patterns as well as identifying influential factors of curb-park violations. The conducted analysis is useful and can shed light for urban planners, police departments and law enforcement agencies among others, to have a better perspective of infrastructure planning. For example, the number of car-park violations around universities and libraries significantly decreased, while places such as hospitals, cinemas and bakeries absorbed the parking infractions. Prior planning and stopping time seem to be two main factors in how vehicles park along the streets [26]. In other words, if the nature of the POI is such that the clients need to plan ahead or have a long standstill, the number of violations will decrease in that spot. Conversely, influential POIs that require no prior planning to stop or the duration of the stop is short, result in a high number of violations.
The results of the survey showed that there are some differences in the features of two selected study areas, which reflected as the differences in the curb-park patterns. For example, the number of parks on the paths in the southern region of Enghelab Street is much larger than in the north part. This problem can be due to the width of the paths that are slightly wider than the north part. Therefore, parking on pavements is low in the north region. In other words, there is no possibility of parking on the sidewalk in the north area. Additionally, park-line pass violations in the southern boundary were much less than the north boundary due to the lack of park-lines in the southern region.
Although all streets of the northern part of the study area had park-lines, a small proportion of violations were for park-line violations. Thus, it can be said that citizens have exceptional attention to the existence of car-park-lines. Contrary to the negative perception about drivers’ breaking rules, the high proportion of curb-parks between lines impressed authors during the data collection. Therefore, urban decision-makers should pay special attention to the need for updating and maintenance of park-lines.
As mentioned before, the co-existence of some amenities (POIs) on the dense points of illegal stops shows that there is a direct relationship between POIs and curb-park violations. Using the number of violations counted at the intervals of POIs, the range of POI influence was calculated. In other words, there is a certain distance from a POI that within this range, the combination and the number of park violations differ with the average of the study area. For example, the impact range of a hospital was estimated at 125 meters, which is also consistent with field observations.
The numerical investigations show that there is a relationship between curb-park violations and the location of parking lots; however, it is not extendable to the city because of the low quantity of parking lots in the study area. It can be seen that although there are dense curb-parks around the parking lots in both parts of the study area, the density of violations around the parking lots considerably decreased.
5. Conclusion
Traffic violations within urban environments, especially in large cities such as Tehran, can have negative impacts, including increasing the volume of traffic, endangering the safety of citizens and cars, increasing air and voice pollutions and reducing the quality of life. This problem is even more extreme in developing countries where tradition and modernity in terms of using and adapting infrastructure can cause conflicts for each other. For instance, the traditional taxi-taking attitude in the relatively modernized Iranian traffic infrastructure does not conform with the current driving behaviours suitable for modern societies.
In this study, the spatial distribution of vehicle stops was investigated. Additionally, the number of curb-park violations was estimated by using some parameters such as type and number of commercial POIs. The POIs and the distance from them are the influential parameters on the number of legal and illegal stops. The findings of this study showed that the distribution of curb-park violations around some POIs is different from the general pattern of the region. In other words, the number of stop violations increases around some places and decreases around some others. For example, the number of violations around hospitals increases and is different from the average of the area, as the double-park and park-line infractions dramatically increase around hospitals. While around other POIs such as a university, the number of legal stops exceeds the average of the region. The differences can be seen up to a specific distance. Here, this distance is called the impact zone because outside this zone, both the number of violations and their combinations are different from the inner part of the area. Therefore, the number of curb-park violations is predictable, based on the type of POI. Thus, urban decision-makers can anticipate violations around each POI according to the nature of each one and take the necessary measures to reduce the number of violations or to install surveillance cameras. Some POIs reduce park violations and seem that there is no need to be monitored by local authorities in those areas. While some POIs absorb car-park infractions, therefore more monitoring can reduce the number of violations.
The study was conducted in two relatively different areas which differed in terms of traffic signs. Despite the general thinking among people, in comparing the two regions of the study area, it was found that drivers pay attention to the park-lines and carefully stop within the borders. Therefore, it was suggested that urban decision-makers should pay special attention to the updating of park-lines in the city.
According to the field survey, car-park violations cause instant traffic and sometimes even lead to accidents between cars or pedestrians. As per future directions, a comparison of accident quantity and curb-park infractions is recommended. Curb-park violations can cause instant traffic jams. However, it was not possible in this study to measure the instant traffic and car-park infractions simultaneously and hence, this could be another potential lead for future work.
Author Contributions
Conceptualization, methodology and writing, J.K.; methodology, writing—review, formal analysis, A.T.; writing—original draft preparation, methodology, project administration, M.J.-N.; writing—review and editing, investigation, methodology, J.J.A.
Funding
This research received no external funding.
Conflicts of Interest
The authors declare no conflict of interest.
References
- Box, P.C. Curb-parking problems: Overview. J. Transp. Eng. 2004, 130, 1–5. [Google Scholar] [CrossRef]
- Guo, H.; Gao, Z.; Yang, X.; Zhao, X.; Wang, W. Modeling travel time under the influence of on-street parking. J. Transp. Eng. 2011, 138, 229–235. [Google Scholar] [CrossRef]
- Box, P.C. Curb Parking Findings Revisited. Available online: http://citeseerx.ist.psu.edu/viewdoc/download?doi=10.1.1.127.5368&rep=rep1&type=pdf (accessed on 12 November 2019).
- Cao, Y.; Yang, Z.; Zuo, Z. The effect of curb parking on road capacity and traffic safety. Eur. Transp. Res. Rev. 2017, 9, 4. [Google Scholar] [CrossRef][Green Version]
- Małecki, K. A computer simulation of traffic flow with on-street parking and drivers’ behaviour based on cellular automata and a multi-agent system. J. Comput. Sci. 2018, 28, 32–42. [Google Scholar] [CrossRef]
- Chen, J.; He, X.-Q. Road traffic delay caused by curb parking set in the influenced area of signalized intersection. In Proceedings of the 11th International Conference of Chinese Transportation Professionals (ICCTP), Nanjing, China, 14–17 August 2011. [Google Scholar]
- Box, P.C. Angle parking issues revisited, 2001. Inst. Transp. Eng. Ite J. 2002, 72, 36. [Google Scholar]
- Biswas, S.; Chandra, S.; Ghosh, I. Effects of on-street parking in urban context: A critical review. Transp. Dev. Econ. 2017, 3, 10. [Google Scholar] [CrossRef]
- Shoup, D.C. An opportunity to reduce minimum parking requirements. J. Am. Plan. Assoc. 1995, 61, 14–28. [Google Scholar] [CrossRef]
- Ponnambalam, C.T.; Cheng, R.; Donmez, B. Effects of Searching for Street Parking on Driver Behaviour and Physiology: Results from an On-Road Instrumented Vehicle Study. In Proceedings of the Human Factors and Ergonomics Society Annual Meeting, Philadelphia, PA, USA, 1–5 October 2018; SAGE Publications: Los Angeles, CA, USA, 2018. [Google Scholar]
- Chen, Q.; Conway, A.; Cheng, J. Parking for residential delivery in New York City: Regulations and behavior. Transp. Policy 2017, 54, 53–60. [Google Scholar] [CrossRef]
- Edquist, J.; Rudin-Brown, C.M.; Lenné, M.G. The effects of on-street parking and road environment visual complexity on travel speed and reaction time. Accid. Anal. Prev. 2012, 45, 759–765. [Google Scholar] [CrossRef] [PubMed]
- Morency, P.; Cloutier, M.-S. From targeted “black spots” to area-wide pedestrian safety. Inj. Prev. 2006, 12, 360–364. [Google Scholar] [CrossRef] [PubMed]
- Humphreys, J.; Box, P.C.; Sullivan, T.D.; Wheeler, D.J. Safety Aspects of Curb Parking; Rep. No. 1978, FHWA-RD-79-76; Federal Highway Administration: Washington, DC, USA, 1978. [Google Scholar]
- Loukaitou-Sideris, A.; Liggett, R.; Sung, H.-G. Death on the crosswalk: A study of pedestrian-automobile collisions in Los Angeles. J. Plan. Educ. Res. 2007, 26, 338–351. [Google Scholar] [CrossRef]
- Runge, J.W.; Cole, T.B. Crosswalk markings and motor vehicle collisions involving older pedestrians. JAMA 2002, 288, 2172–2174. [Google Scholar] [CrossRef] [PubMed]
- Gössling, S.; Schröder, M.; Späth, P.; Freytag, T. Urban space distribution and sustainable transport. Transp. Rev. 2016, 36, 659–679. [Google Scholar] [CrossRef]
- Ye, X.; Yan, X.; Chen, J.; Wang, T.; Yang, Z. Impact of curbside parking on bicycle lane capacity in Nanjing, China. Transp. Res. Rec. 2018, 2672, 120–129. [Google Scholar] [CrossRef]
- Hongwei, G.; Ziyou, G.A.O.; Xiaomei, Z.H.A.O.; Xiaobao, Y.A.N.G. Traffic behavior analysis of non-motorized vehicle under influence of curb parking. J. Transp. Syst. Eng. Inf. Technol. 2011, 11, 79–84. [Google Scholar]
- Ye, X.; Chen, J. Impact of curbside parking on travel time and space mean speed of nonmotorized vehicles. Transp. Res. Rec. 2013, 2394, 1–9. [Google Scholar] [CrossRef]
- Levine, N.; Kim, K.E.; Nitz, L.H. Spatial analysis of Honolulu motor vehicle crashes: I. Spatial patterns. Accid. Anal. Prev. 1995, 27, 663–674. [Google Scholar] [CrossRef]
- Erdogan, S.; Yilmaz, I.; Baybura, T.; Gullu, M. Geographical information systems aided traffic accident analysis system case study: City of Afyonkarahisar. Accid. Anal. Prev. 2008, 40, 174–181. [Google Scholar] [CrossRef] [PubMed]
- Truong, L.T.; Somenahalli, S.V. Using GIS to identify pedestrian-vehicle crash hot spots and unsafe bus stops. J. Public Transp. 2011, 14, 6. [Google Scholar] [CrossRef]
- Yalcin, G.; Duzgun, H.S. Spatial analysis of two-wheeled vehicles traffic crashes: Osmaniye in Turkey. KSCE J. Civil Eng. 2015, 19, 2225–2232. [Google Scholar] [CrossRef]
- Martens, K.; Benenson, I. Evaluating urban parking policies with agent-based model of driver parking behavior. Transp. Res. Rec. 2008, 2046, 37–44. [Google Scholar] [CrossRef]
- Caicedo, F.; Blazquez, C.; Miranda, P. Prediction of parking space availability in real time. Expert Syst. Appl. 2012, 39, 7281–7290. [Google Scholar] [CrossRef]
- Ajeng, C.; Gim, T.-H. Analyzing on-street parking duration and demand in a Metropolitan City of a developing country: A case study of Yogyakarta City, Indonesia. Sustainability 2018, 10, 591. [Google Scholar] [CrossRef]
- World Health Organization. Global Status Report on Road Safety 2018: Summary; World Health Organization: Geneva, Switzerland, 2018. [Google Scholar]
- Cvitanić, D.; Breški, D.; Vidak, B. Review, testing and validation of capacity and delay models at unsignalized intersections. Promet-Traffic Transp. 2007, 19, 71–82. [Google Scholar]
- Anderson, T. Comparison of spatial methods for measuring road accident ‘hotspots’: A case study of London. J. Maps 2007, 3, 55–63. [Google Scholar] [CrossRef]
© 2019 by the authors. Licensee MDPI, Basel, Switzerland. This article is an open access article distributed under the terms and conditions of the Creative Commons Attribution (CC BY) license (http://creativecommons.org/licenses/by/4.0/).