Carbon Footprint Evaluation Based on Tourist Consumption toward Sustainable Tourism in Japan


Graduate School of Environmental and Information Studies, Tokyo City University, Yokohama 224-8551, Japan
*
Author to whom correspondence should be addressed.
Sustainability 2020, 12(6), 2219; https://doi.org/10.3390/su12062219
Submission received: 18 February 2020
/
Revised: 6 March 2020
/
Accepted: 9 March 2020
/
Published: 12 March 2020
(This article belongs to the Special Issue Sustainable Business Models in Tourism)
Abstract
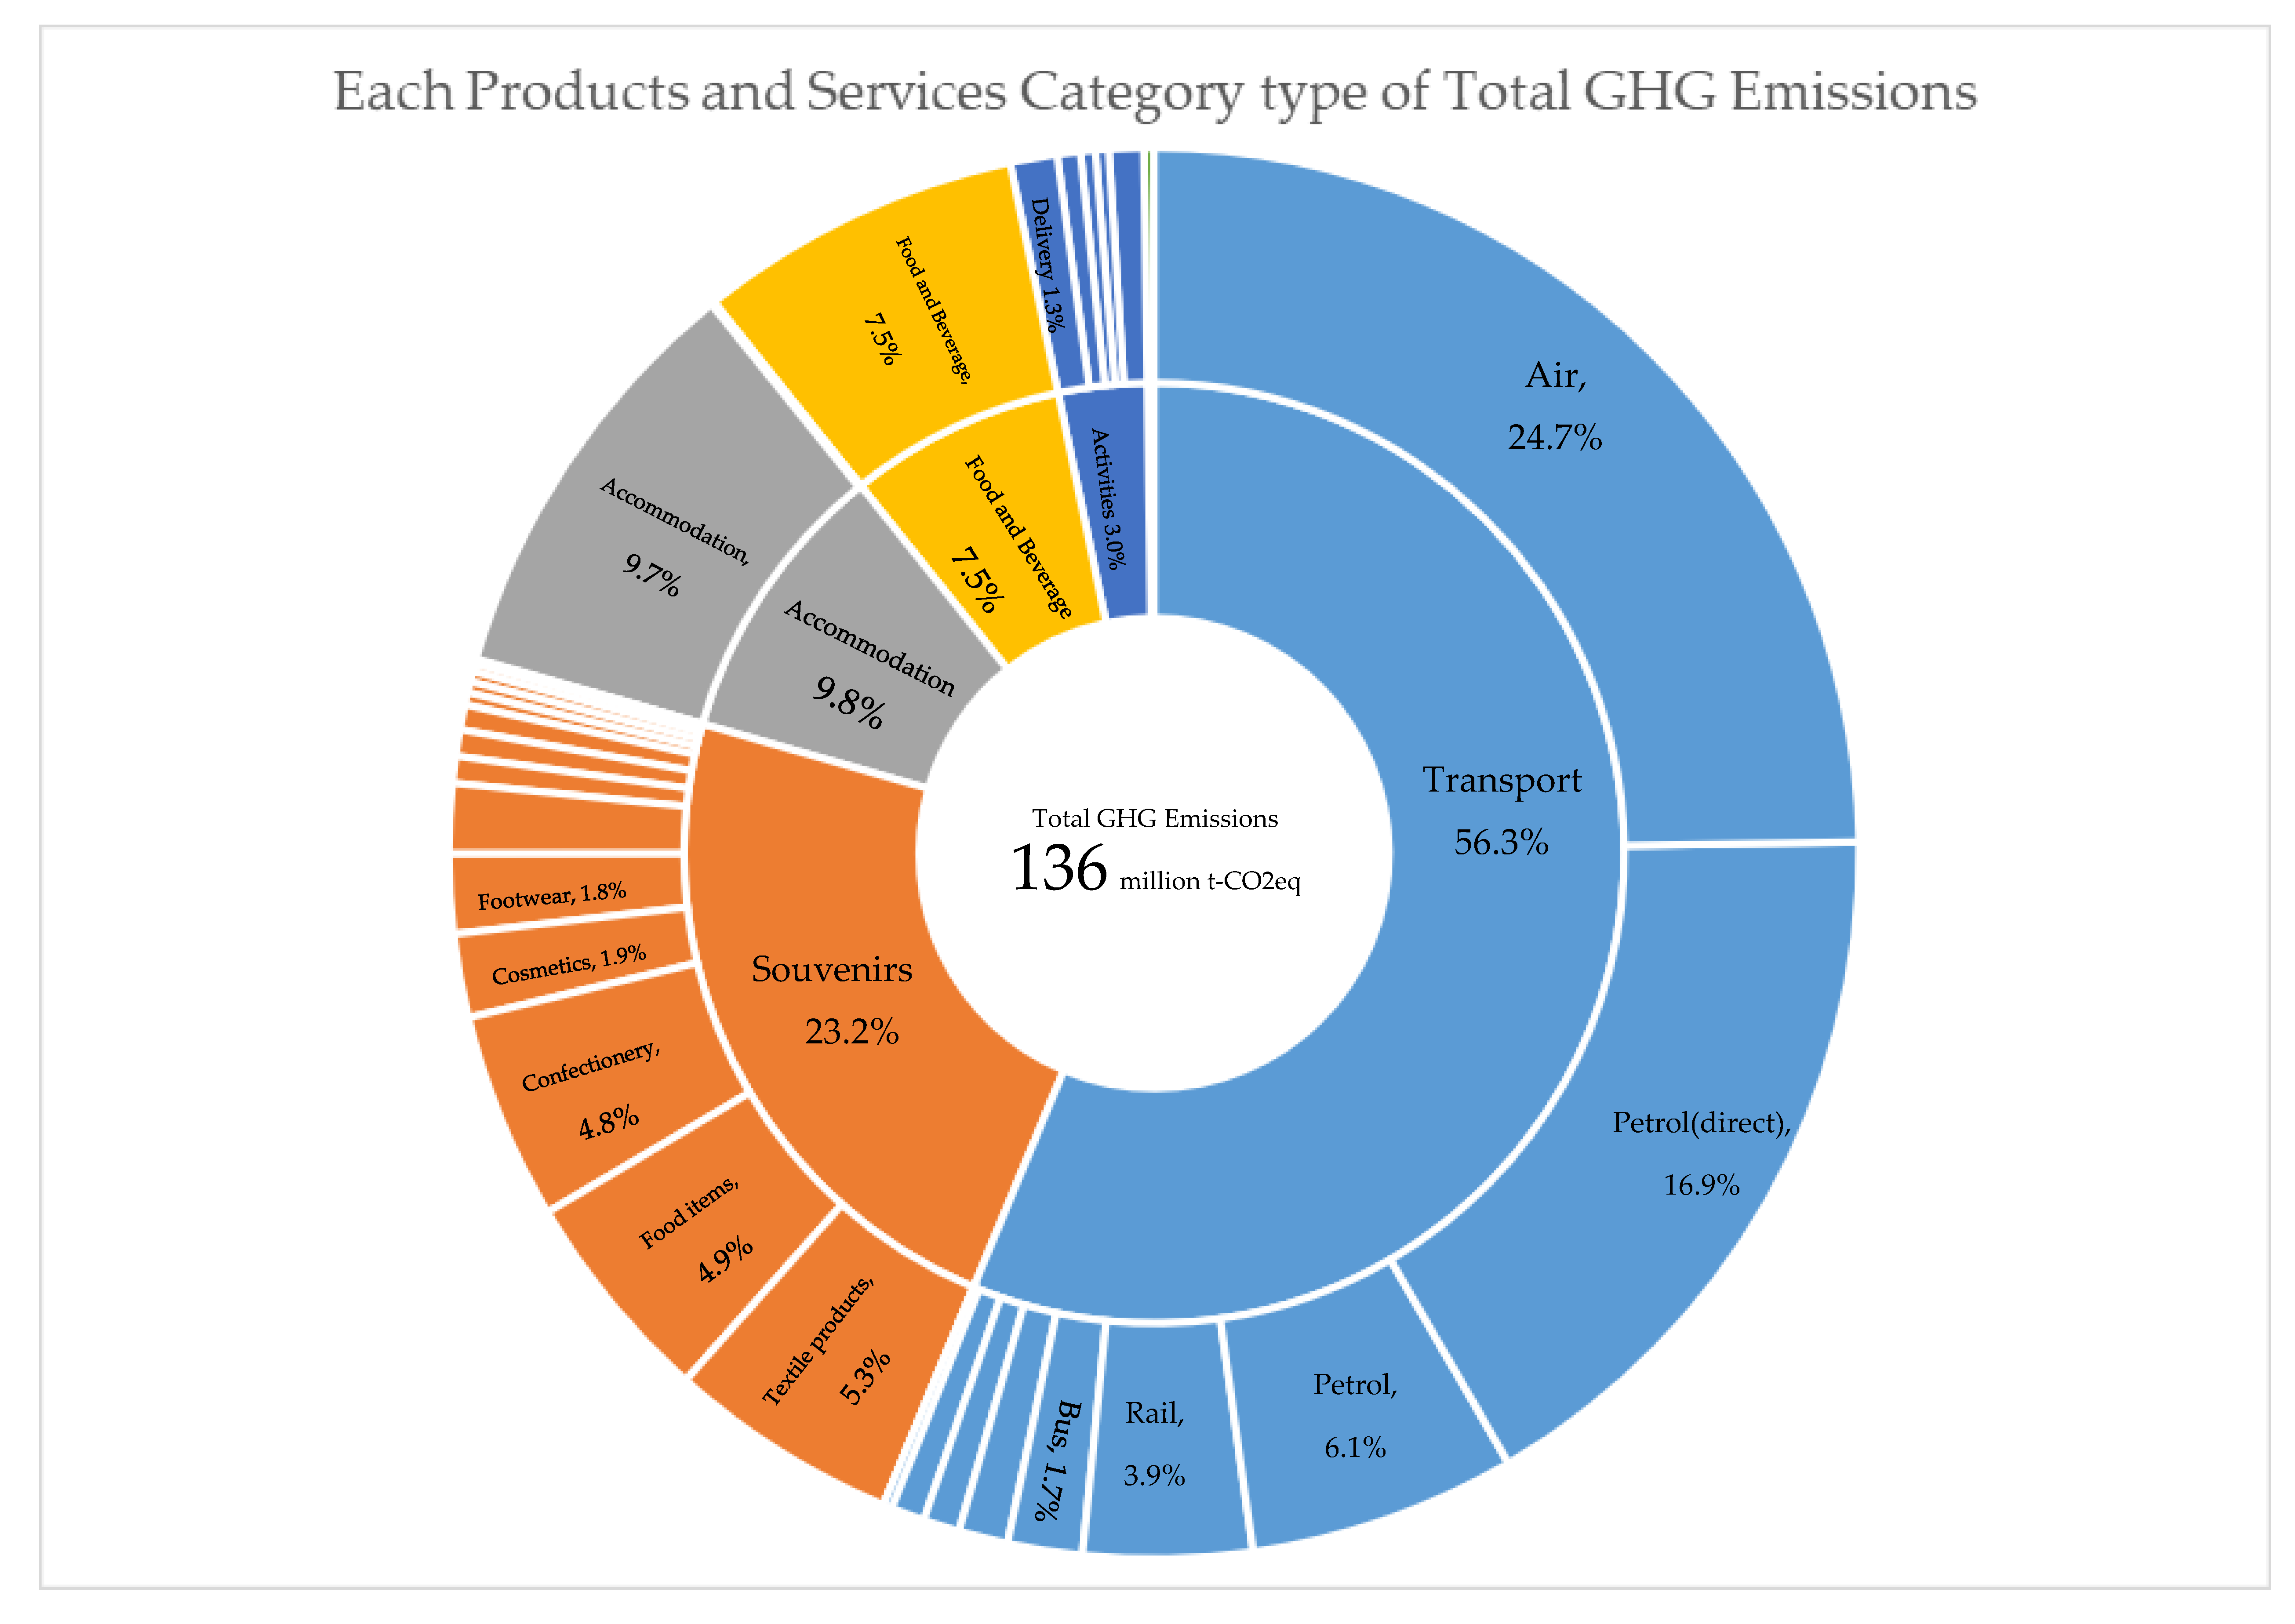
:The importance of the contribution of tourism to climate change has been noted by the United Nations World Tourism Organization (UNWTO). By combining a process-based life cycle assessment (LCA) and input–output analysis, several researchers have attempted to evaluate the impacts of the tourism industry, as well as its products and services. Indeed, the tourism sector has a wide range of industries, including travel and tours, transportation, accommodation, food and beverage, amusement, souvenirs, etc. However, the existing cases do not show a breakdown of the impact on climate change. In this paper, the carbon footprint (CFP) of the Japanese tourism industry was calculated based on tourist consumption, using the Japanese input–output table and the Japanese tourism industry. We demonstrate that the total emissions were approximately 136 million t-CO2 per year. The contribution ratio of each stage is as follows: Transport 56.3%, Souvenirs 23.2%, Petrol (direct emissions) 16.9%, Accommodation 9.8%, Food and Beverage 7.5%, and Activities 3.0%. Then, in the breakdown, the impacts are in the following order: Air transport 24.7%, Petrol (direct emissions) 16.9%, Accommodation 9.8%, Food and Beverage 7.5%, Petrol 6.1%, Textile products 5.3%, Food items 4.9%, Confectionery 4.8%, Rail transport 3.9%, Cosmetics 1.9%, and Footwear 1.8%. In addition to transportation, this research also highlights the contribution from souvenirs, accommodation, and food and beverages.
1. Introduction
According to the United Nations, more than three million people travel across the world every day, and approximately 1.2 billion people travel abroad every year. This includes not only personal travel, but also MICE [1] (Meetings, Incentives, Conferences, and Exhibitions,) which are international meetings (conventions) held, for example, by international organizations, academic societies, etc.
The year 2017 was designated as the “International Year of Sustainable Tourism for Development” to spread awareness of the role of tourism. One of the messages was, through contact with nature, to raise awareness of the challenges posed by the effective use of resources and the effect on climate change. Another intention was to increase awareness of global issues [2]. The United Nations World Tourism Organization (UNWTO) is still recognizing the impact of tourism on global warming as an important issue in the 21st century. UNWTO has defined sustainable tourism as "Tourism that takes full account of its current and future economic, social and environmental impacts, addressing the needs of visitors, the industry, the environment and host communities" [3,4]. The world tourism industry has also begun to implement “Tourism for SDGs”, aiming to contribute to the Sustainable Development Goals (SDGs). In the "SDG compass", which shows the approach to the SDGs, the "life cycle assessment (LCA)" is introduced as one of the means to map the high-impact areas in the value chain in "Step 2 Determine priority issues". Such international trends call for actions that include the concept of sustainability, not only in developing countries but also in developed countries.
In Japan, according to a survey by the Japanese Ministry of Land, Infrastructure, Transport, and Tourism (MLIT) [5], environmental efforts are one of the most important issues, regardless of the field of business. Today, in the field of tourism in Japan, there are a variety of local governments, residents, tourism industries, etc., that are making efforts to protect the environment. Establishing a cooperative system that goes beyond the initiative of a single entity has been strongly recognized as an option to tackle the issue. In addition, it has been shown that environmental conservation efforts are not only indispensable for the sustainable development of tourism but also greatly related to improving the attractiveness of tourist destinations.
According to the Japan Tourism White Paper (2017) [6], the gross domestic product (GDP) of the tourism sector, as defined by the UNWTO (2012), is approximately 8.5 trillion yen (about 78.6 billion US dollars), accounting for approximately 1.7% of the country’s total GDP. Moreover, the growth rate of the tourism sector GDP is about 23%, which is higher than the growth rate for other industries. On the other hand, in a specific tourist area, a significant increase in visitors, for example, might result in a negative impact on the civic life, natural environment, landscape, etc., which could greatly reduce the level of satisfaction for travelers. Such tourism situations have become a major issue, referred to as “overtourism”. The Japanese government has established the “Tourism Strategy Promotion Task Force” as part of the Japan Tourism Agency (JTA) (2018). The goal of this entity is to harmonize the increasing needs of tourists and the living condition of the residents in the tourist area. A system was developed to comprehensively examine and promote their coexistence. With these social issues in mind, the JTA is considering establishing an evaluation index for sustainable tourism in Japan.
In connection with overtourism, Martín Martín, JM et al. (2018) [7] analysed a study of the city of Barcelona (Spain) that found that citizens had a general aversion to tourism. We have determined that there is a negative economic effect due to the increase in the number of accommodations and demand for vacation rentals. The main effects are concerns about rising home rental prices and the move to higher priced tourism markets. Martín Martín, J. M. et al. (2019) [8] also point to the issue of tourism seasonality. They looked at the factors that make decisions by tourism entrepreneurs. The results show that entrepreneurs acknowledge the cost of shutting down during off-peak season. They also indicated that they placed great importance on the factors that justify closing the office for several months a year. These papers show that economic growth in the tourism sector has the potential to undermine other economies and change the style of the tourism sector.
Martínez, J.M.G. et al. (2019) [9] analysed the stability of rural tourism as a desirable condition for sustainable tourism in terms of the difference between rural tourism and urban tourism. The survey draws on major tourist attractions in Spain. The analysis concludes that the annual level of stability of rural tourism is not far from the stability of the most stable urban tourism, due to the much higher seasonality in coastal tourist destinations. Martinez, J.M.G. et al. (2020) [10] collected and analysed the individual preferences of the most representative stakeholder groups (farmers, business owners, governments, scientists). They calculated the conflict index between groups of stakeholders in this study. From here, the most favorable content to consider the target was shown. On the other hand, the most serious disagreements were found between farmers and scientists, and between farmers and governments. Thus, there are various issues concerning the sustainability of tourism, suggesting that targeting through stakeholder communication is important.
A life cycle assessment (LCA) can be an alternative solution for this situation, as it can identify the potential environmental impacts caused by the tourism sector within its different life cycle stages. From the viewpoint of LCA, there are two main methods for calculating the environmental impacts: Process-based LCA (focusing on the different processes constituting the scope of evaluation) and input–output based LCA (focusing on the monetary interaction between the different industrial sectors). Filimonau et al. (2016) [11] made a summary of the different LCA studies focusing on tourism (Appendix A, Table A1).
The process method, which is a method of examining the individual processes that make up the life cycle one by one and collecting and accumulating the environmental load data for each process, is often targeted at specific product services such as holiday travel (including or excluding accommodation) and tourist accommodation (Appendix A, Table A1). On the other hand, the input–output method is based on the estimated consumption of energy and resources, as well as the environmental impacts of emitted substances by using an input–output table. The input–output is often targeted at evaluating industrial sectors, such as the local tourism sector and the national tourism industry.
Lenzen et al. (2018) [12] calculated the carbon footprint (CFP) of global tourism using multi-regional input–output (MRIO). The tourism industry is composed of a wide range of industries including travel, lodging, dining, amusement, souvenirs, etc., and is expected to grow at a global annual rate of 4%. The global GHG (greenhouse gas) emissions related to tourism were not well quantified until now. In this study, based on tourism-related data from 160 countries, the CFP for tourism was estimated to increase from 3.9 to 4.5 Gt CO2eq between 2009 and 2013. This is about four times the previous estimate and accounts for about 8% of global GHG emissions. The authors commented on the high contribution of food and beverage in addition to travel and shopping.
In Japan, New Tourism Study Group of The Institute of Life Cycle Assessment, Japan (ILCAJ) has been studying the GHG emissions related to tourism since 2009 [13] to highlight their importance. In 2013, the calculation methods for tourism were examined, based on the works from Ito et al. (2011) [14], focusing on transportation, Tamari et al. (2011) [15], focusing on accommodation, and finally, Kazama et al. (2011) [16], focusing on food and beverage. In the same year, the product category rule (PCR) [17] for travel was also examined in the Carbon Footprint Communication Program (CFP Program). The bottom-up evaluation results were used for labeling, such as PCR for the CFP program and for the establishment of certification standards for Eco Mark (Type I label) [18,19].
Finally, Shimizu et al. (2015) [20] also examined 27 industrial sectors related to tourism in Japan and Korea using the input–output table approach, tourism statistics related to consumption, and various data on CO2 emission intensities. In the future, while the production value of the tourism industry can be expected to increase, they noted that this is a possibility of increasing emissions of greenhouse gases, such as carbon dioxide (CO2). However, for the domestic case, there is no breakdown that clarifies the degree of impact of “travel, lodging, amusement, souvenirs, etc.”, which are the key elements which compose tourism. Therefore, our study aims at clarifying this point.
In this study, we calculate the CFP for the entire Japanese tourism industry and quantitatively show the breakdown by the different categories that compose this industry (transportation, accommodation, food and beverage, souvenirs, activities, etc.).
2. Materials and Methods
2.1. Input–Output Table Approach
In this method, the evaluation is conducted retrospectively from the supply chain, so that a comprehensive evaluation is performed from the viewpoint of the life cycle of products and services. Therefore, this study uses the LCA method [21] in order to meet the objective of considering comprehensive evaluation by including the pre-tourism preparation stage and post-tourism stage, as well as the different stages occurring during travelling.
In this research, the Japanese input–output table is used. The principles of this method are based on the works from W.W. Leontief [22] and are often used in the LCA research field. The formula used in this method is
where d is the direct environmental impact and the environmental impact per production value. (I-A) −1 is the Leontief inverse matrix and can be used to consider the direct and indirect economic ripple effect caused by the consumption of one type of goods. f is the amount of activity. This method helps to evaluate the entire supply chain. According to Hondo (2008) [23], it has the following advantages:
- Arbitrariness is not involved in the choice of system boundaries.
- There is a full understanding of the indirect environmental impact.
- Public statistics with excellent transparency and objectivity are used.
- It can evaluate all goods and services.
To sum up, it is possible to make an objective evaluation, and the existing limit to obtain the data for each process is overcome by using the input–output table. Therefore, the calculation following this approach was adopted in this study.
2.2. System Boundaries
As shown in Table 1, the system boundaries of this study follow the traditional approach adopted for tourism evaluation. Preparation (Pre-tourism), Inbound Tourism, Domestic Tourism, Outbound Tourism, and After (Post-tourism) are the different life stages. These cover consumptions related to movement and accommodation of tourists and the staff and participants of MICE events. However, these do not include the consumption of foreign tourists before/after travelling or items purchased by MICE organizers or the energy consumption at the venues.
The tourism statistics data “Internal and national tourism consumption, by timing of purchase and products” provided by the JTA [24] distinguish foreign visitors visiting Japan (referred to as inbound tourism in this study), domestic tourism, which includes also the travels within Japan of foreign visitors (e.g., flight connection), and finally Japanese nationals/Japan foreign residents overseas travel (referred to in this study as outbound tourism).
The items evaluated in this study are displayed as “○” in Table 1, and those that are not included are displayed as “Not applicable”. These data were provided by JPY (1$ = 113 JPY (2017 Ave.)).
2.3. Calculation Method of CFP
As mentioned earlier in Section 2.1, this study calculates the CFP using the input–output approach. The calculation formula is shown below:
where di is the direct GHG emission intensity provided for each sector by the Inventory Database for Environmental Analysis version 2” (IDEAv.2), as developed by the National Institute of Advanced Industrial Science and Technology (AIST). A is the direct input coefficient matrix: We used the 2011 waste input–output table (WIO) developed by Kondo et al. (2019) [25] to have a broad overview. I is an identity matrix, (I-A) (−1) is the Leontief inverse matrix, and fi is the amount of activity obtained from the statistics of the JTA(2017), as detailed previously. It would be more effective to use data focusing on the same year; however, the last waste input–output table available focuses only on 2011. DEi is the direct emission from fuel combustion added to the calculation in order to cover the full cradle to grave aspects of products and services. Using this equation, the calculation was extended from cradle-to-gate to cradle-to-grave.
The tourism statistics data “Internal and National tourism consumption, by timing of purchase and products” [24], regularly surveyed by JTA, is calculated and aggregated based on Tourism Satellite Accounts (TSA). The items were aggregated to represent the total amount spent during or for travel, including amounts paid for souvenirs, for example. Here, travel is defined as “going away from the area of daily life regardless of the content of activities at destination” and is used synonymously with tourism. Business trips were included in the data; however, the organizer’s consumption/waste amount and direct environmental impact at MICE events were not included. The data are provided for 2017.
The statistical data are based on the Survey of Consumption Trends for Foreign Visitors to Japan [26] and the Survey of Travel and Tourism Consumption in Japan (Survey details and results are included in [24]).
Visitor data in the survey are foreign visitors to Japan who leave Japan, excluding transit passengers, crew members, and those staying for more than a year. The following three surveys were conducted. A national survey, which reveals the types of foreign visitors, travel content, and consumption content throughout Japan, a regional survey, which clarifies the type of foreign visitors, the content of travel, and the content of consumption for each visited place (prefecture), and a cruise survey, which clarifies the types of foreign visitors who obtained ship tourism-landing permission, as well as the content of travel and consumption. The survey was conducted with a target of approximately 140,000 votes per year, and the investigator asked foreigners visiting the departure lobby at the airport and seaport to be surveyed to cooperate. Therefore, the survey was conducted using a tablet terminal or a paper questionnaire while listening.
Domestic traveler’s data measure the number of tourism trips and tourism consumption of domestic tourism and outbound tourism in 2017 by JTA. According to the result report, the survey target is residents in Japan. It targets about 25,000 people extracted based on the basic ledger. As for the survey method, JTA distributed questionnaires to the survey subjects. The reporter (the person being surveyed) or a proxy fills out the questionnaire and returns it. It is the tourist consumption amount estimated and totaled by multiplying the number of trips by the linear estimation multiplication factor from the answer result.
As shown in Table 2, it can be seen that spending for “Accommodation services” and “Food and beverage serving services” is important, and for “Passenger transport services”, the amount of spending is higher for planes (sum of domestic and international flights) and Shinkansen (Japanese bullet train).
Table 2 and Appendix A, Table A2 detail the spending (top 3) of consumable items for each travel type. In the case of inbound tourism, the largest spending is represented by accommodation and food and beverage expenses, followed by medicines and cosmetics. Domestic sightseeing (overnight stay): Accommodation, food and drinks, and Shinkansen expenses are the largest expenses. Domestic sightseeing (day trip): Eating and drinking, Shinkansen, and gasoline costs are the largest expenditures. For domestic tourism (for transit), flight expenses (international flights) are the highest spending amounts in most cases. Finally, for outbound tourism, accommodation, flight (international flights), and food and beverages are the greatest amounts.
In this article, each product/service item is associated with an input–output table (I/O) classification code. Some major items such as “Travel agencies, tour operators, and tourist guide services” do not include detailed sub-items but still correspond to I/O classification codes. See Appendix A, Table A2 for each inventory item and I/O classification correspondence.
3. Results
3.1. CFP of Tourism
The CFP was calculated as shown below (Figure 1) and was found to be 136 million t-CO2eq. The contribution ratio of each stage is as follows: transport 56.3%, souvenirs 23.2%, petrol (direct emissions) 16.9%, accommodation 9.8%, food and beverage 7.5%, and activities 3.0%.
Then, in the breakdown, the impact was in the following order: air transport 24.7%, accommodation 9.8%, food and beverage 7.5%, petrol 6.1%, textile products 5.3%, food items 4.9%, confectionery 4.8%, rail transport 3.9%, cosmetics 1.9%, and footwear 1.8%.
Table 3 shows a summary of the top contributors of each travel type, ranking the items in GHG emissions. The top five rankings for inbound tourism are as follows: air transport, accommodation, cosmetics, food and beverage, and food items. For overnight stays of domestic tourism, they are as follows: petrol (direct emissions), air transport, accommodation, food and beverage, and petrol. For day trips of domestic tourism, they are as follows: petrol (direct emissions), petrol, food items, food and beverage, and confectionery. For transit overseas of domestic tourism, they are as follows: air transport, textile products, footwear, petrol (direct emissions), and confectionery. For outbound tourism, they are as follows: air transport, accommodation, food and beverage, textile products, and confectionery.
From these results, the impact of transport is important, not only due to the transportation directly but also due to the contribution from souvenirs, accommodation, and food and beverage.
The following sub-parts 3.2 to 3.4 show the detailed breakdown by stage.
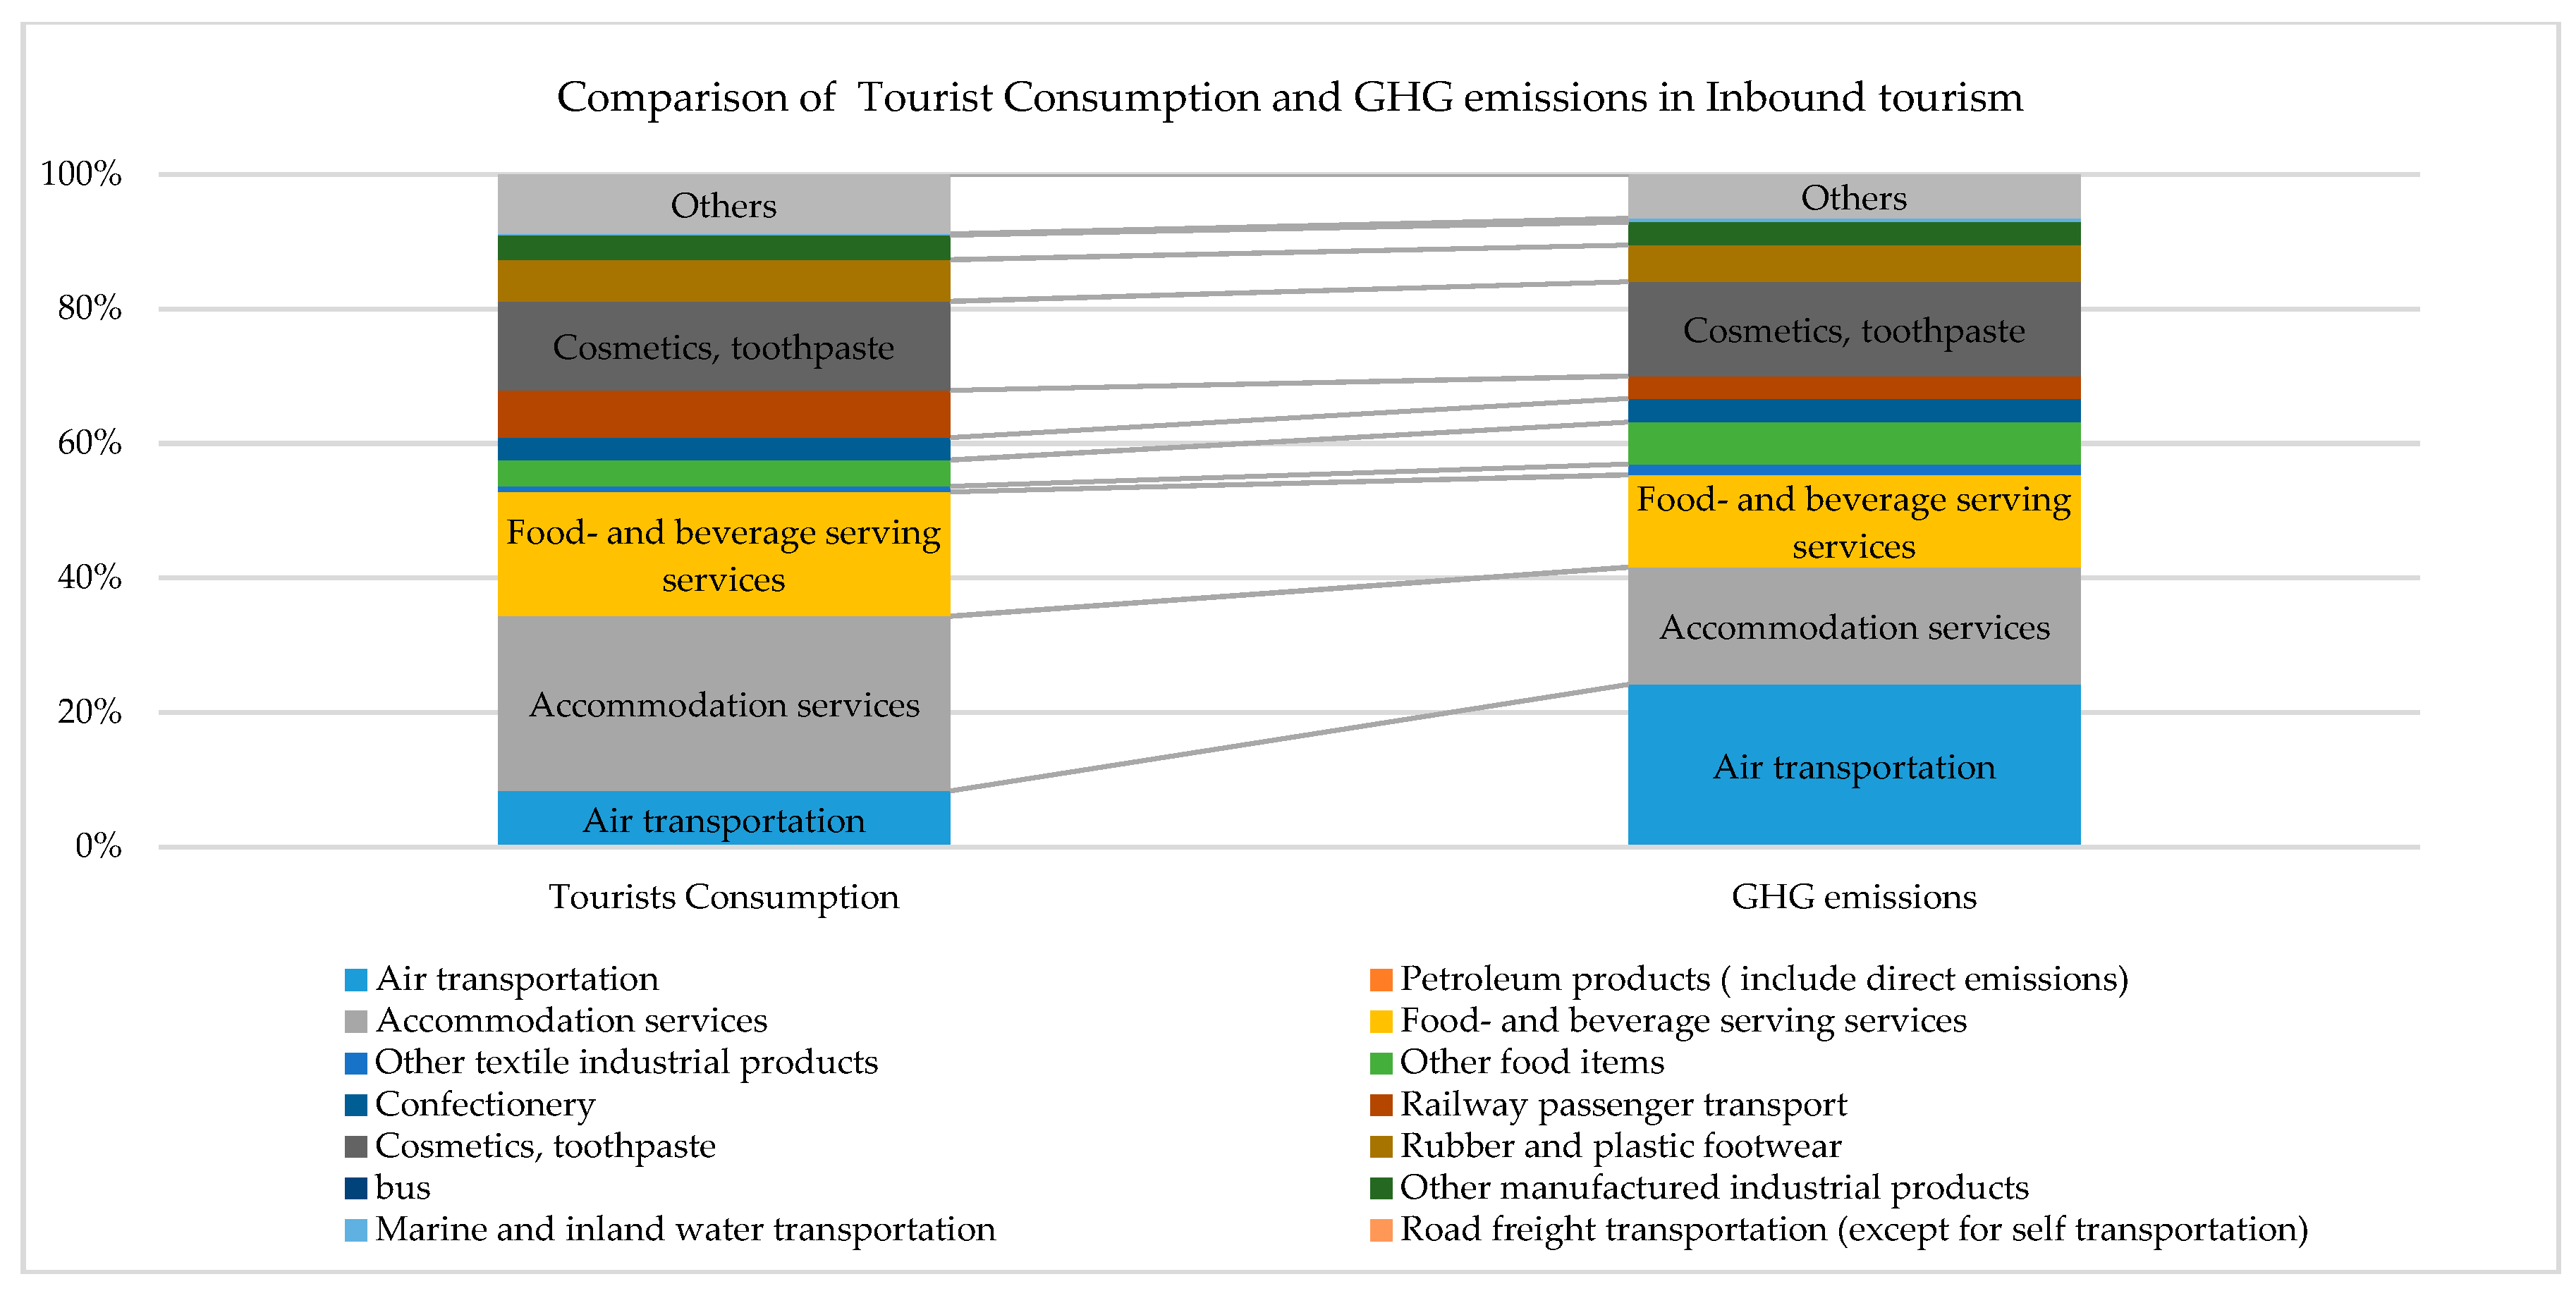
3.2. Inbound Tourism
Figure 2 shows the comparison of travelers’ consumption and GHG emissions of the inbound tourism stage. Travelers spend a great deal on accommodation, food and beverage, and cosmetics, and the GHG emissions show similar tendencies. It can also be seen that air transport has a higher impact than others.
3.3. Domestic Tourism
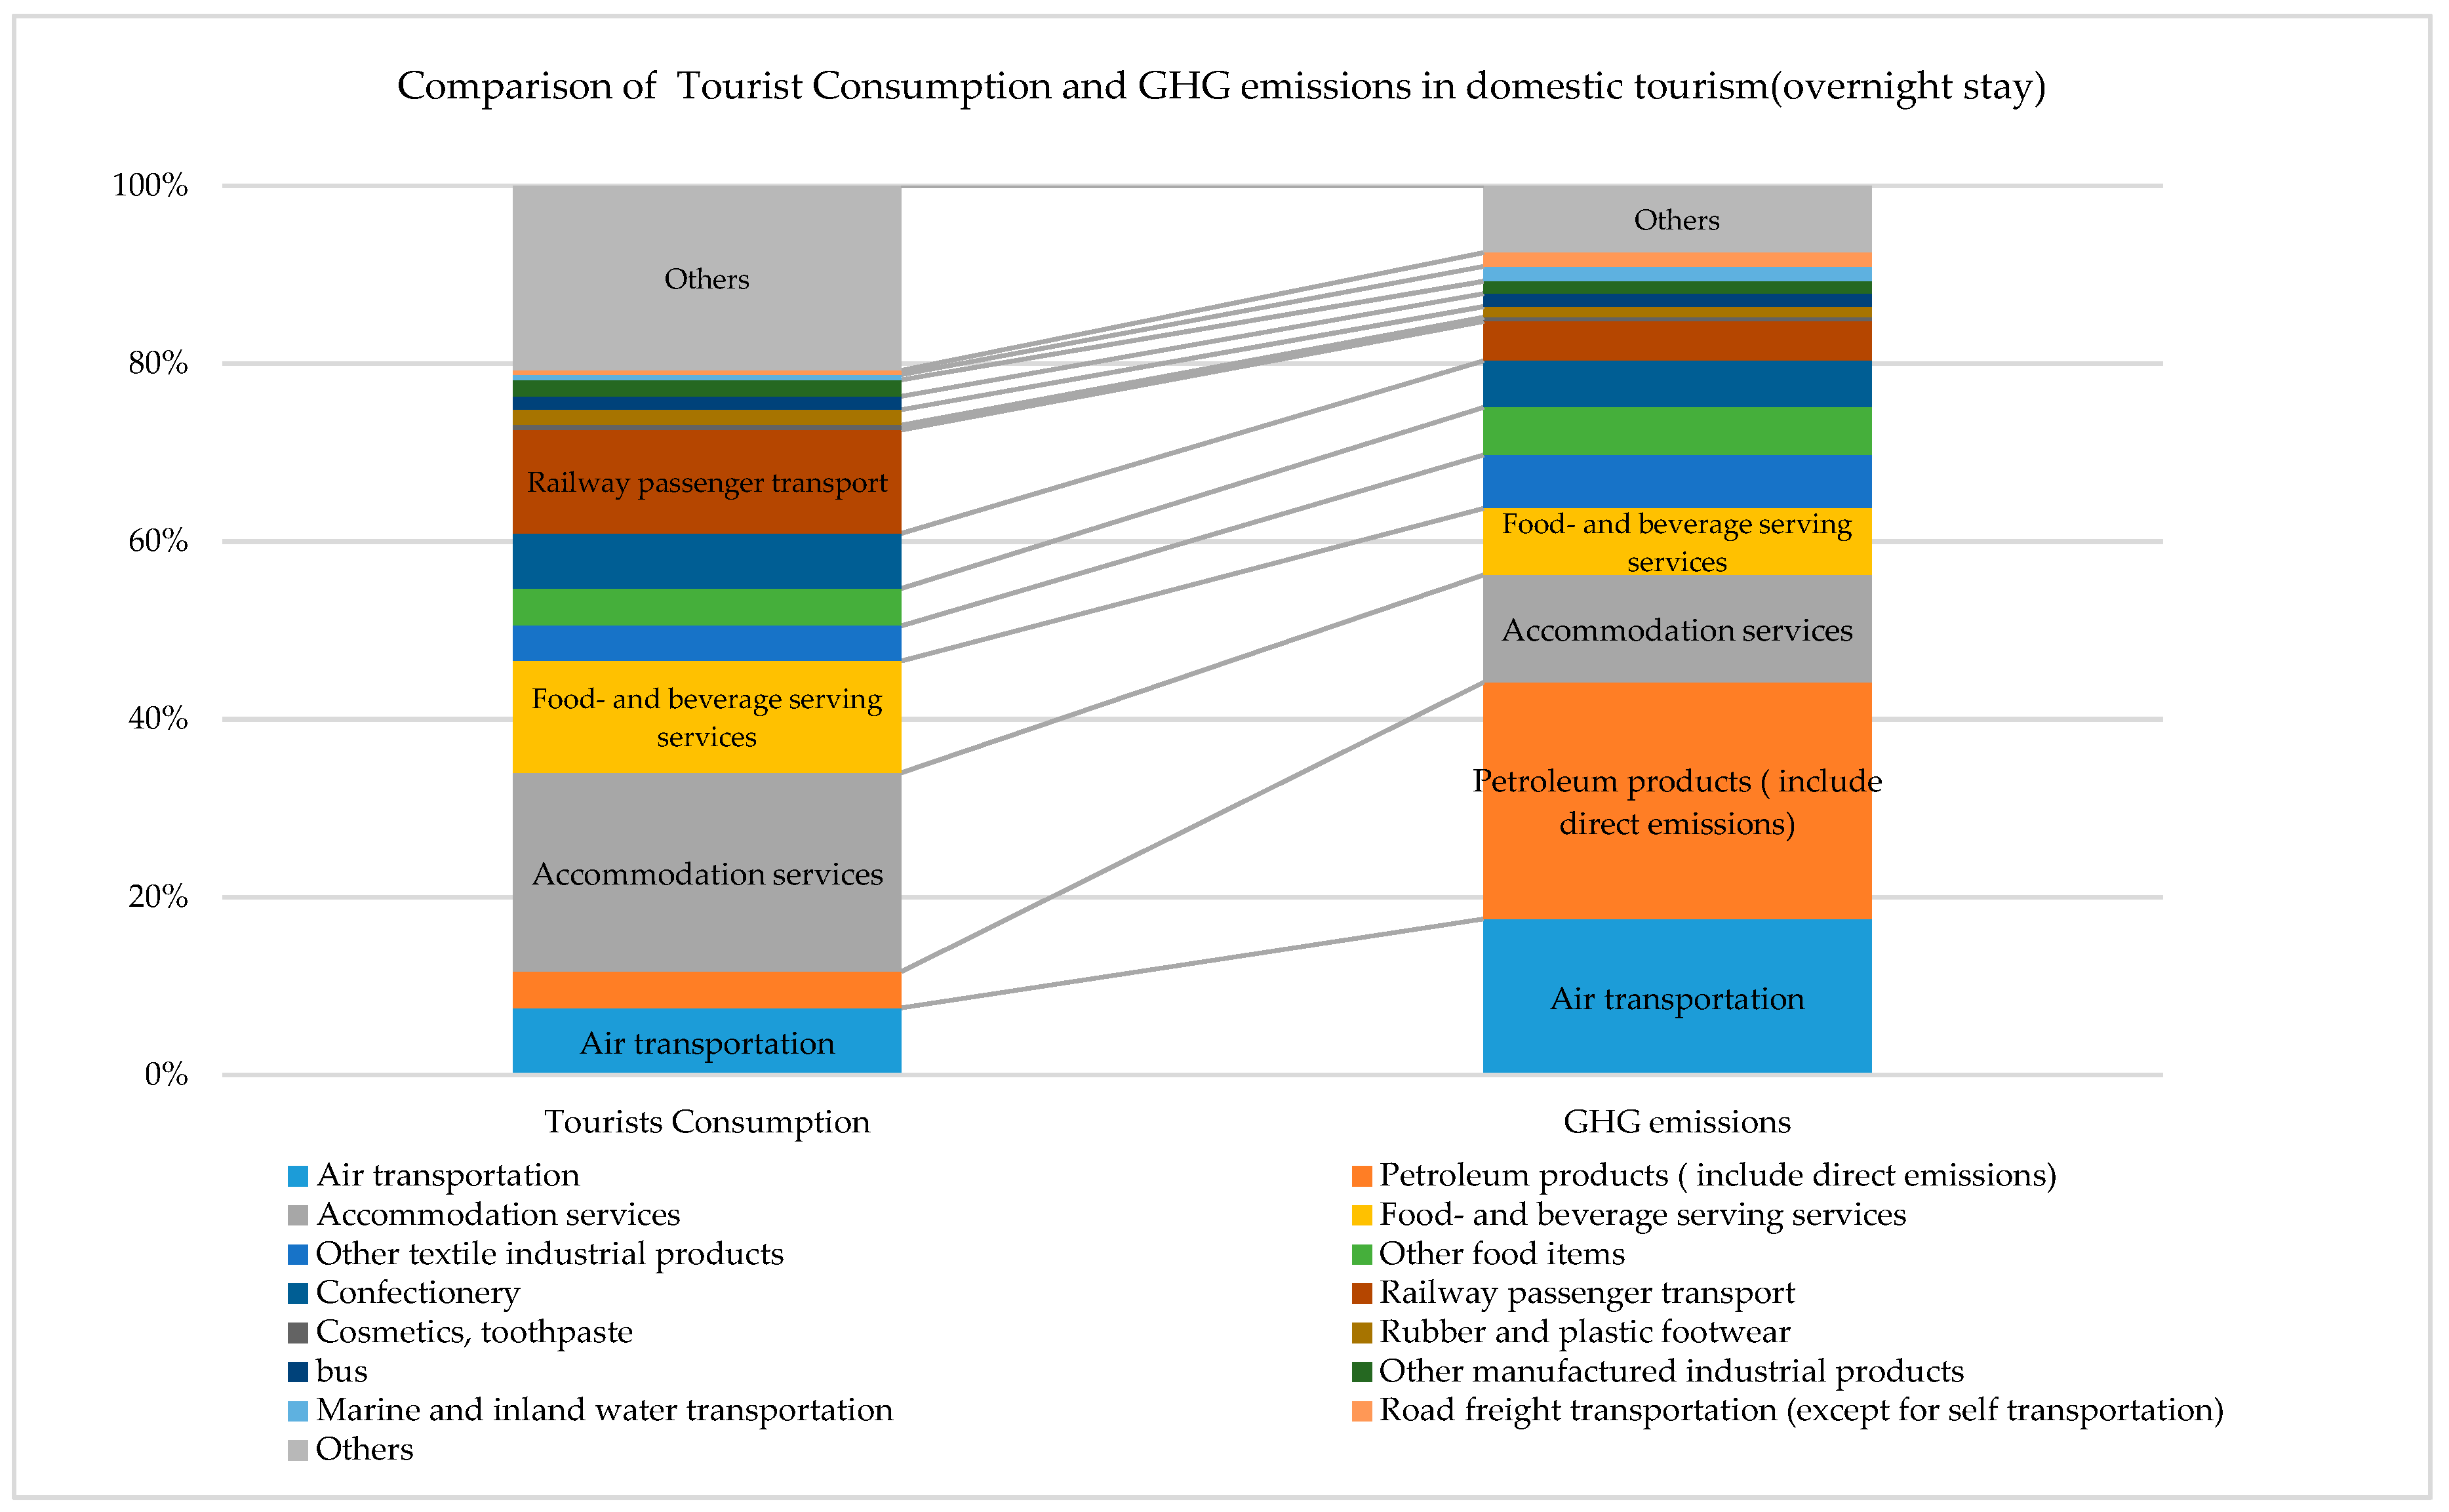
3.3.1. Overnight Stay
Figure 3 shows the comparison of travelers’ consumption and GHG emissions of domestic tourism (overnight stay). Travelers spend a great deal on accommodation, food and beverage, and railway transport, and the GHG emissions share similar tendencies. Certainly, petroleum products (include direct emissions) have a higher impact than others. Air transportation also has the fourth highest impact in this stage.
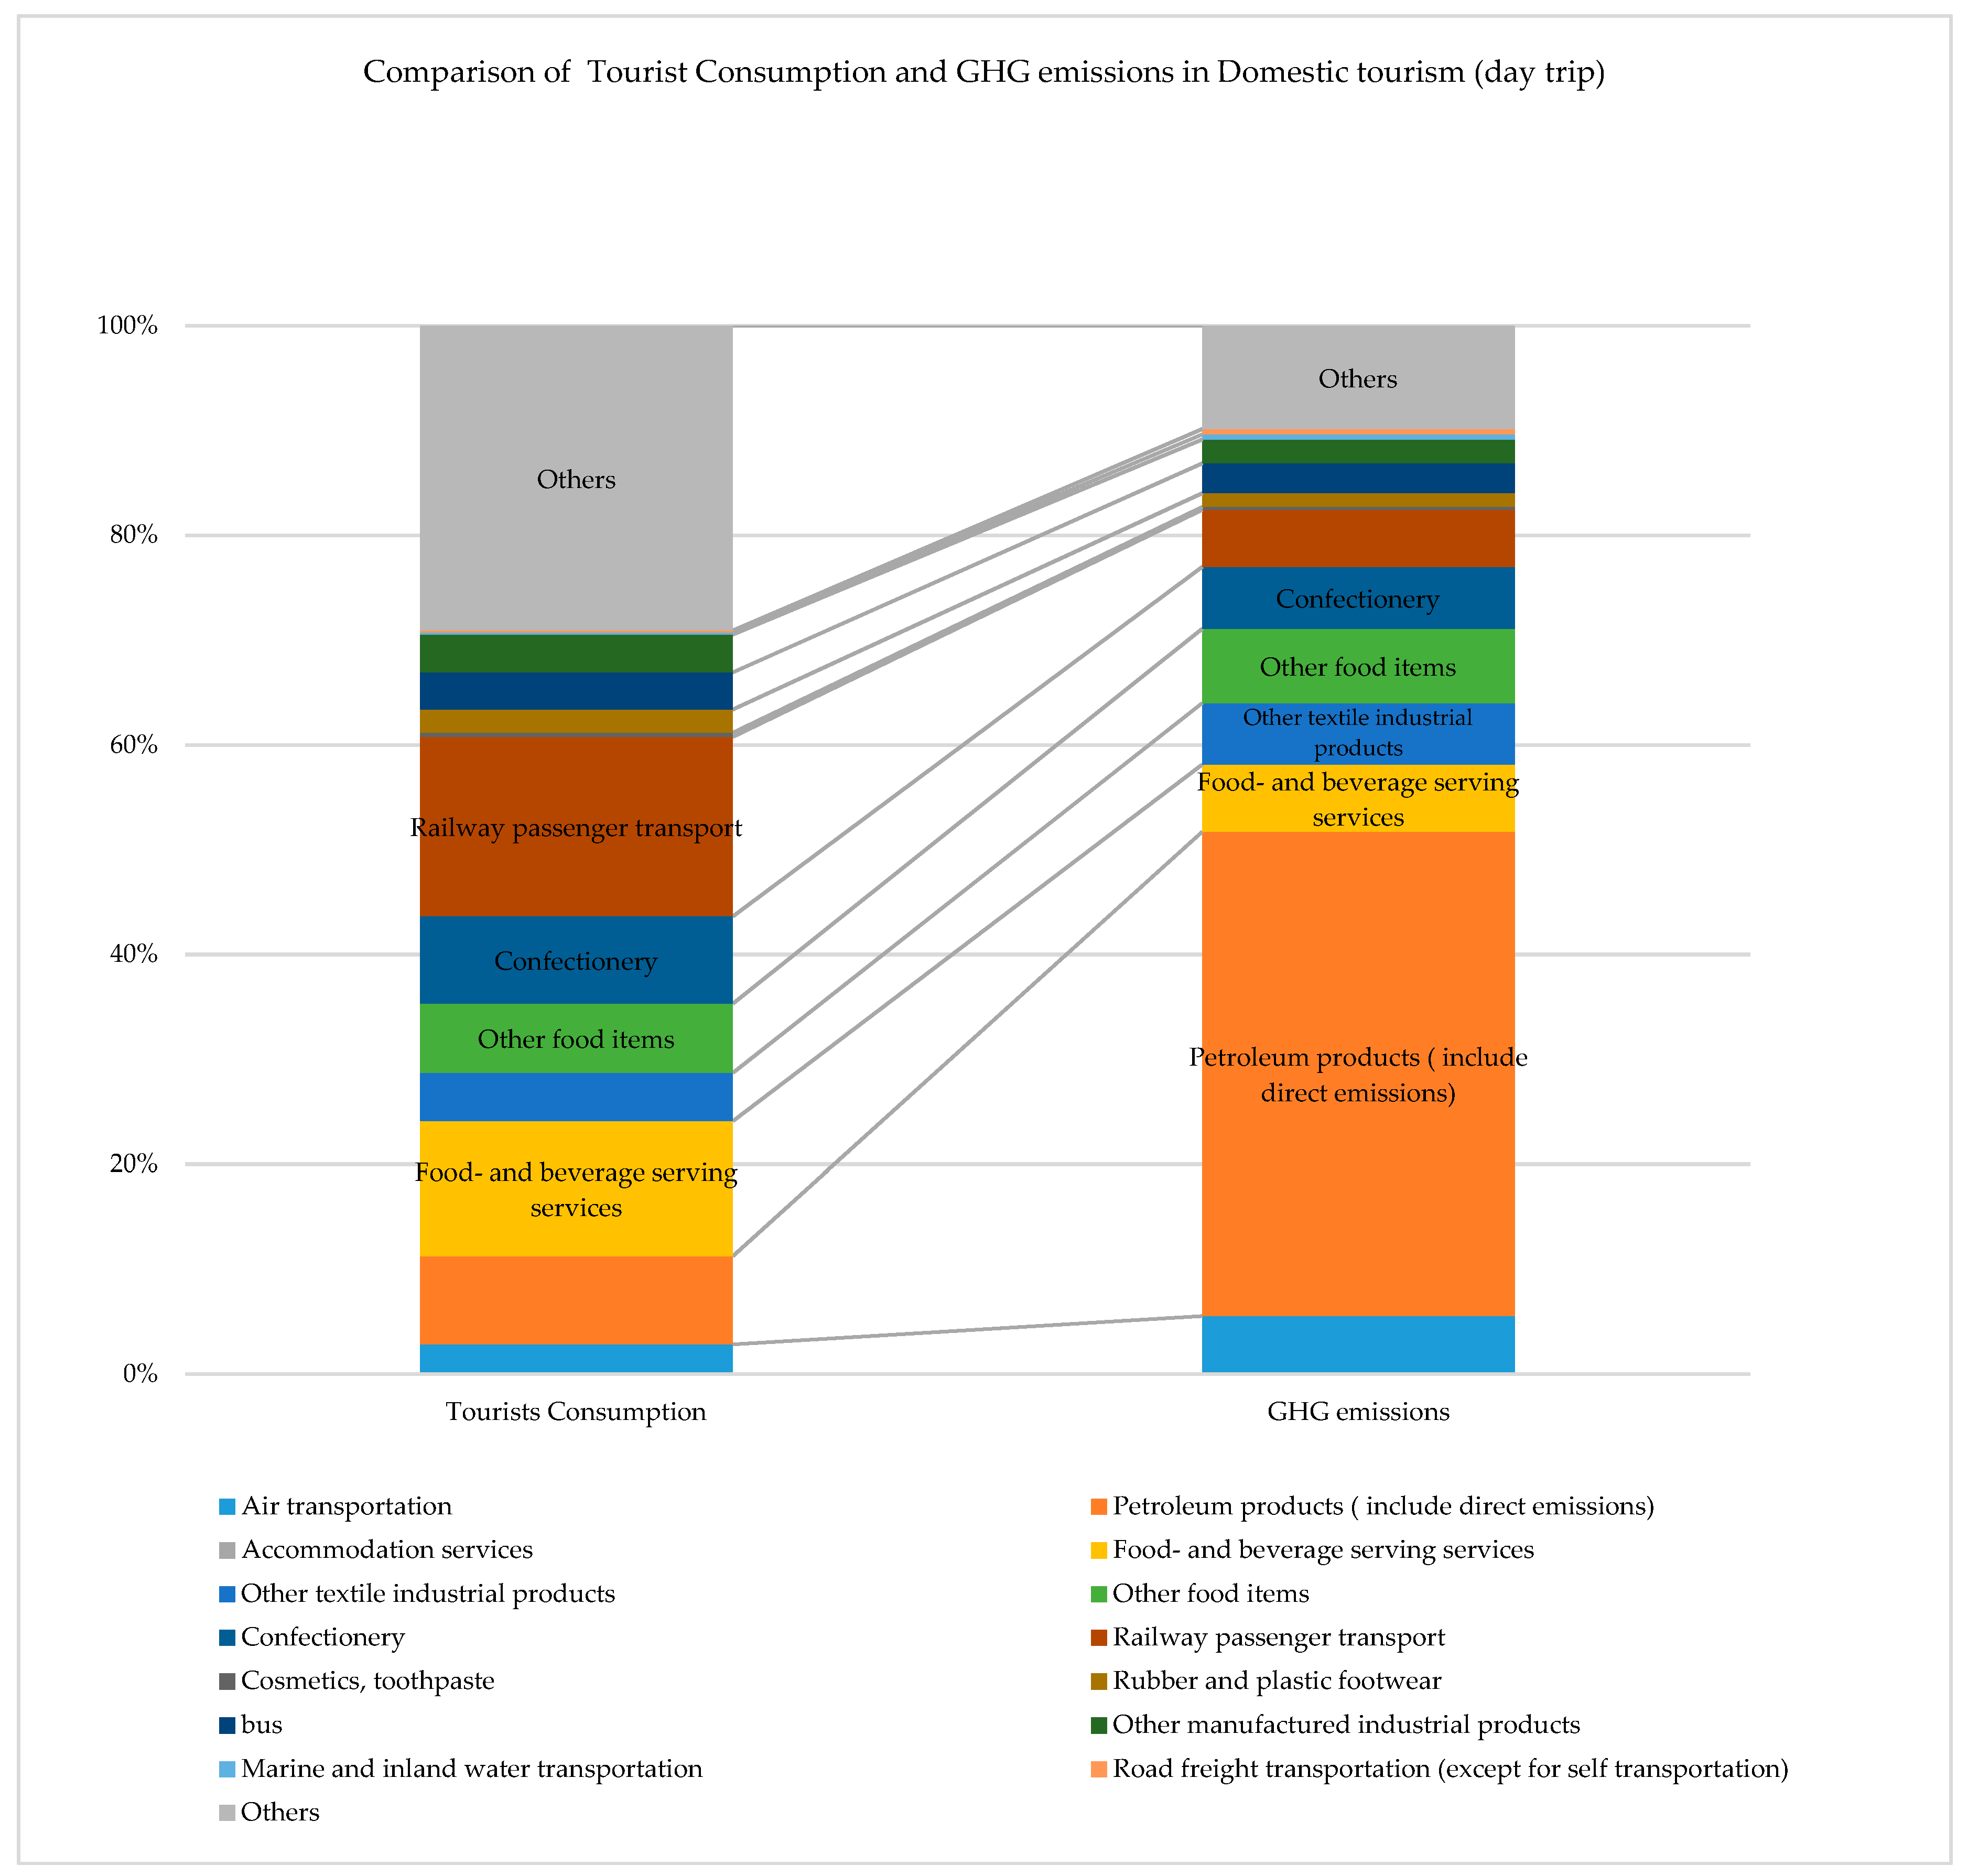
3.3.2. Day Trip
Figure 4 shows the comparison of travelers’ consumption and GHG emissions of the domestic tourism (day trip) stage. Travelers spend a lot on railway transport and food and beverage, and the GHG emissions show similar tendencies. Certainly, petroleum products (include direct emissions) have a higher impact than others.
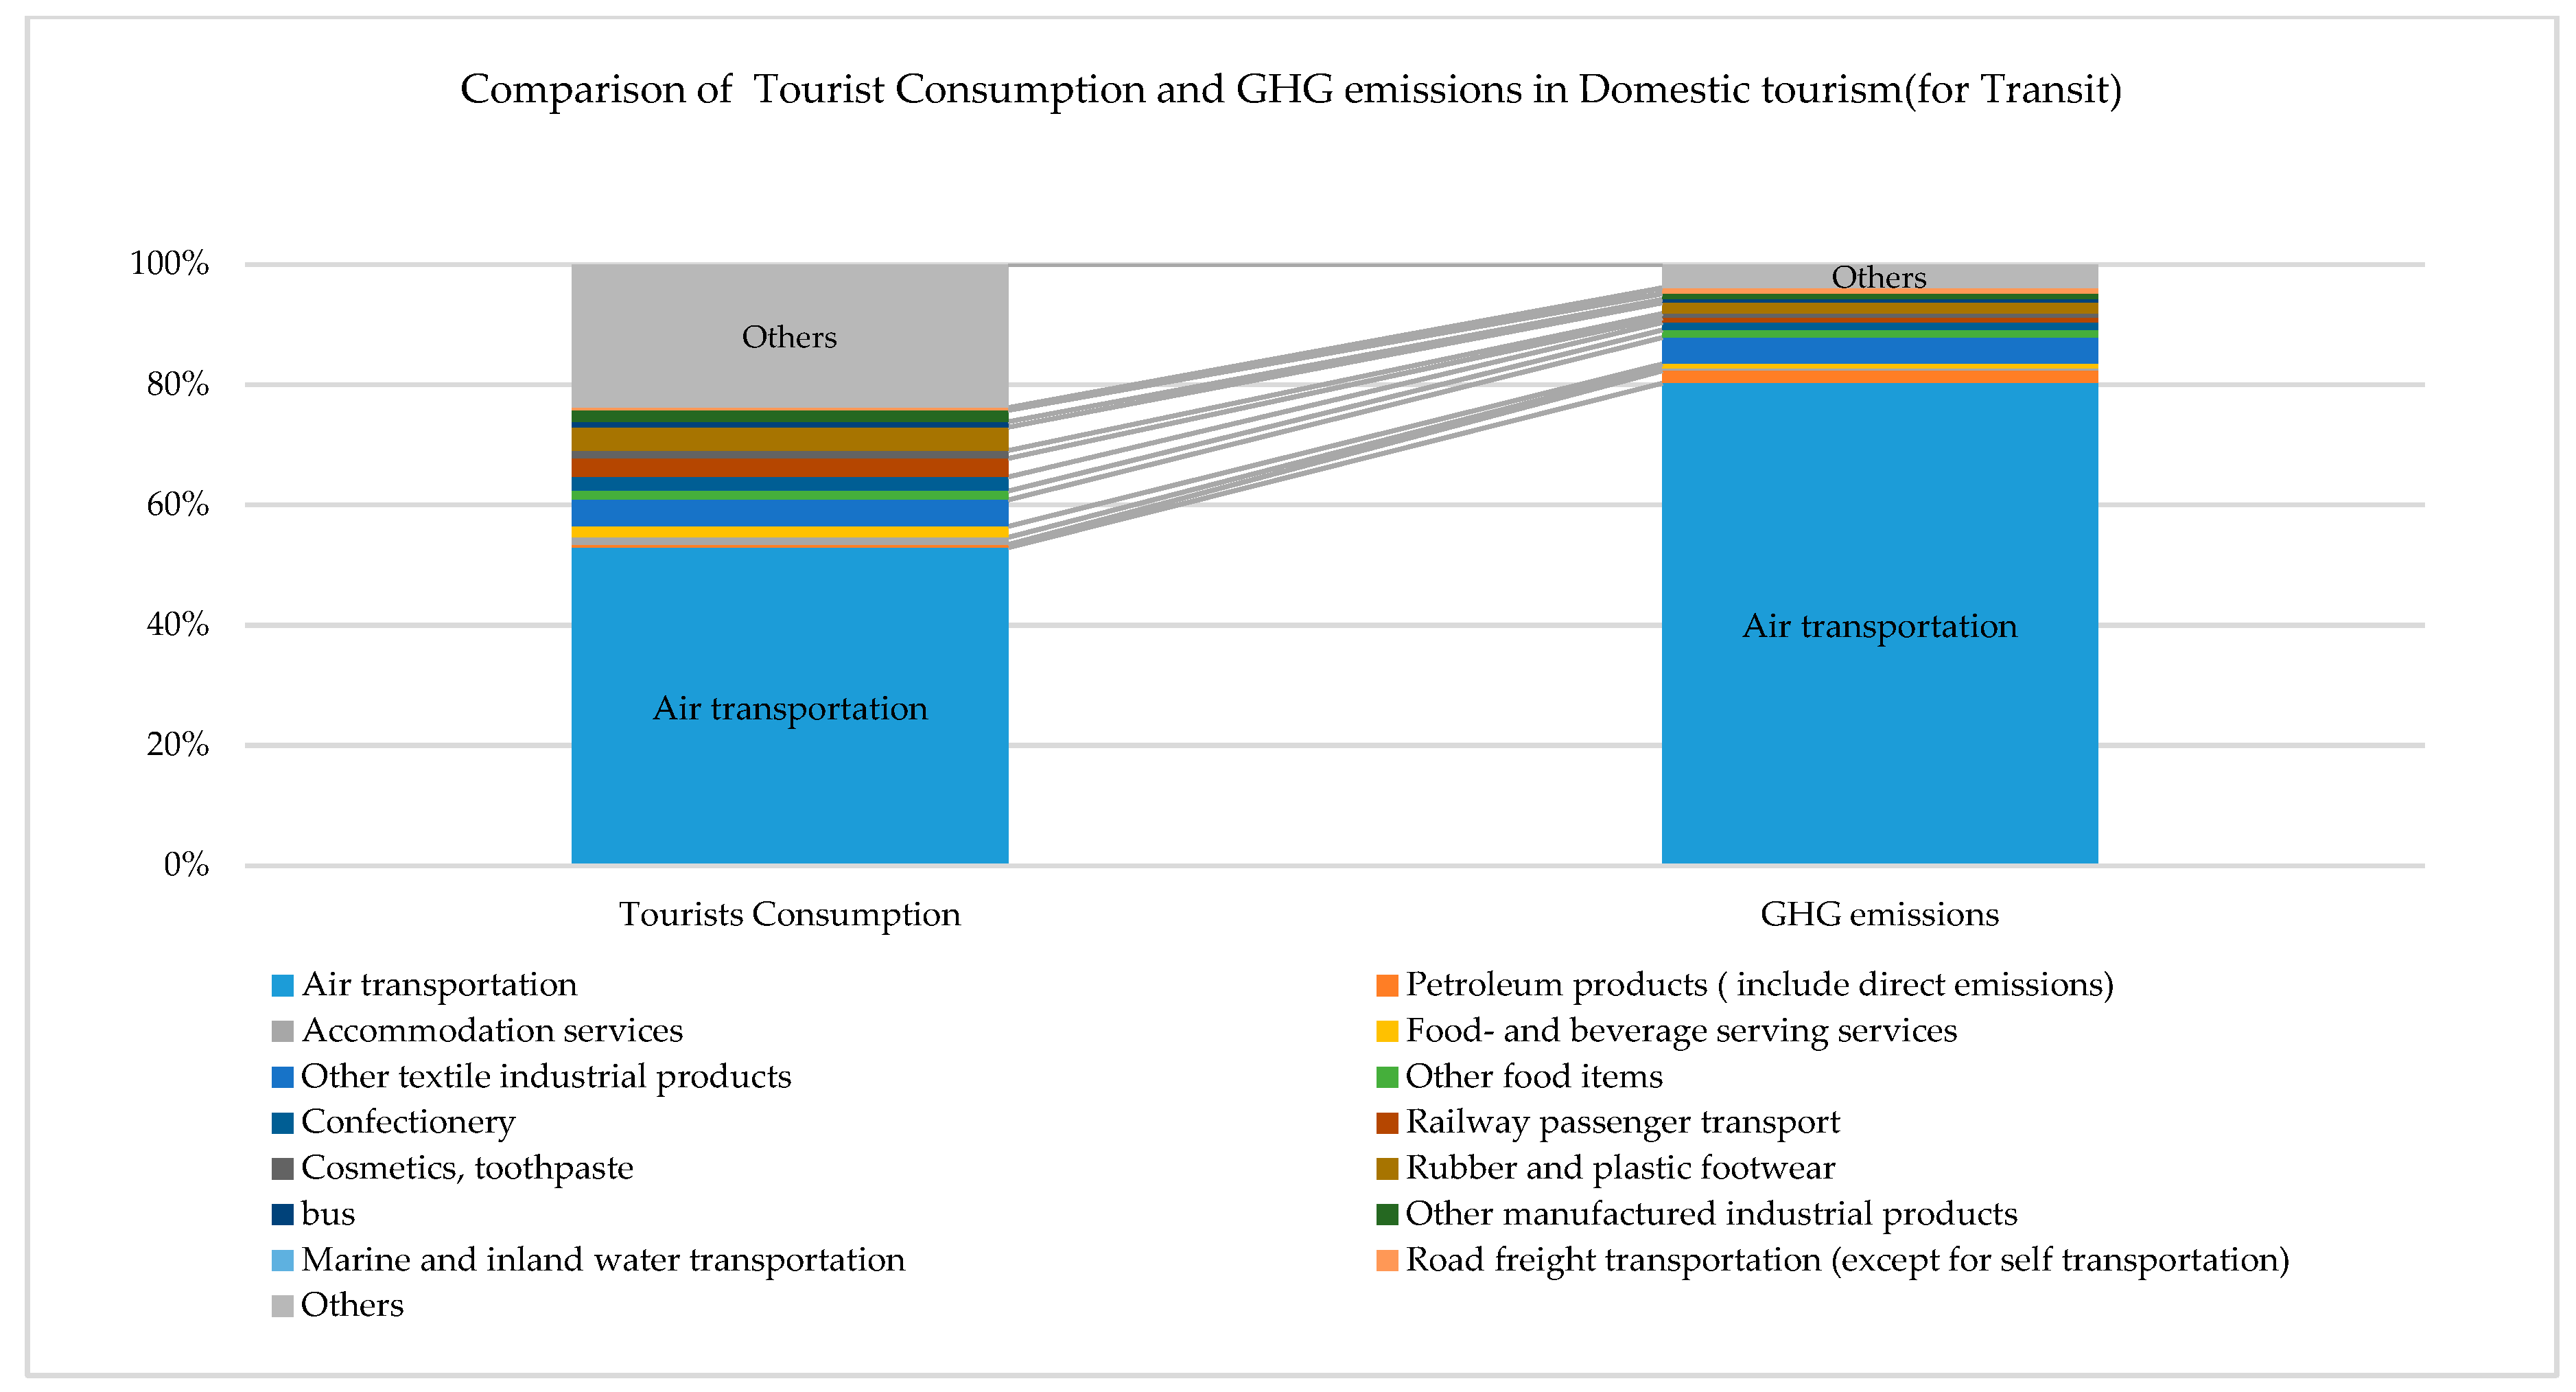
3.3.3. For Transit Overseas
Figure 5 shows the comparison of travelers’ consumption and GHG emissions of domestic tourism (for Transit). Travelers spend a great deal on air transport, and the GHG emissions show a similar tendency. Certainly, air transport has a higher impact than others. On the other hand, the ratio of rail transport is lower.
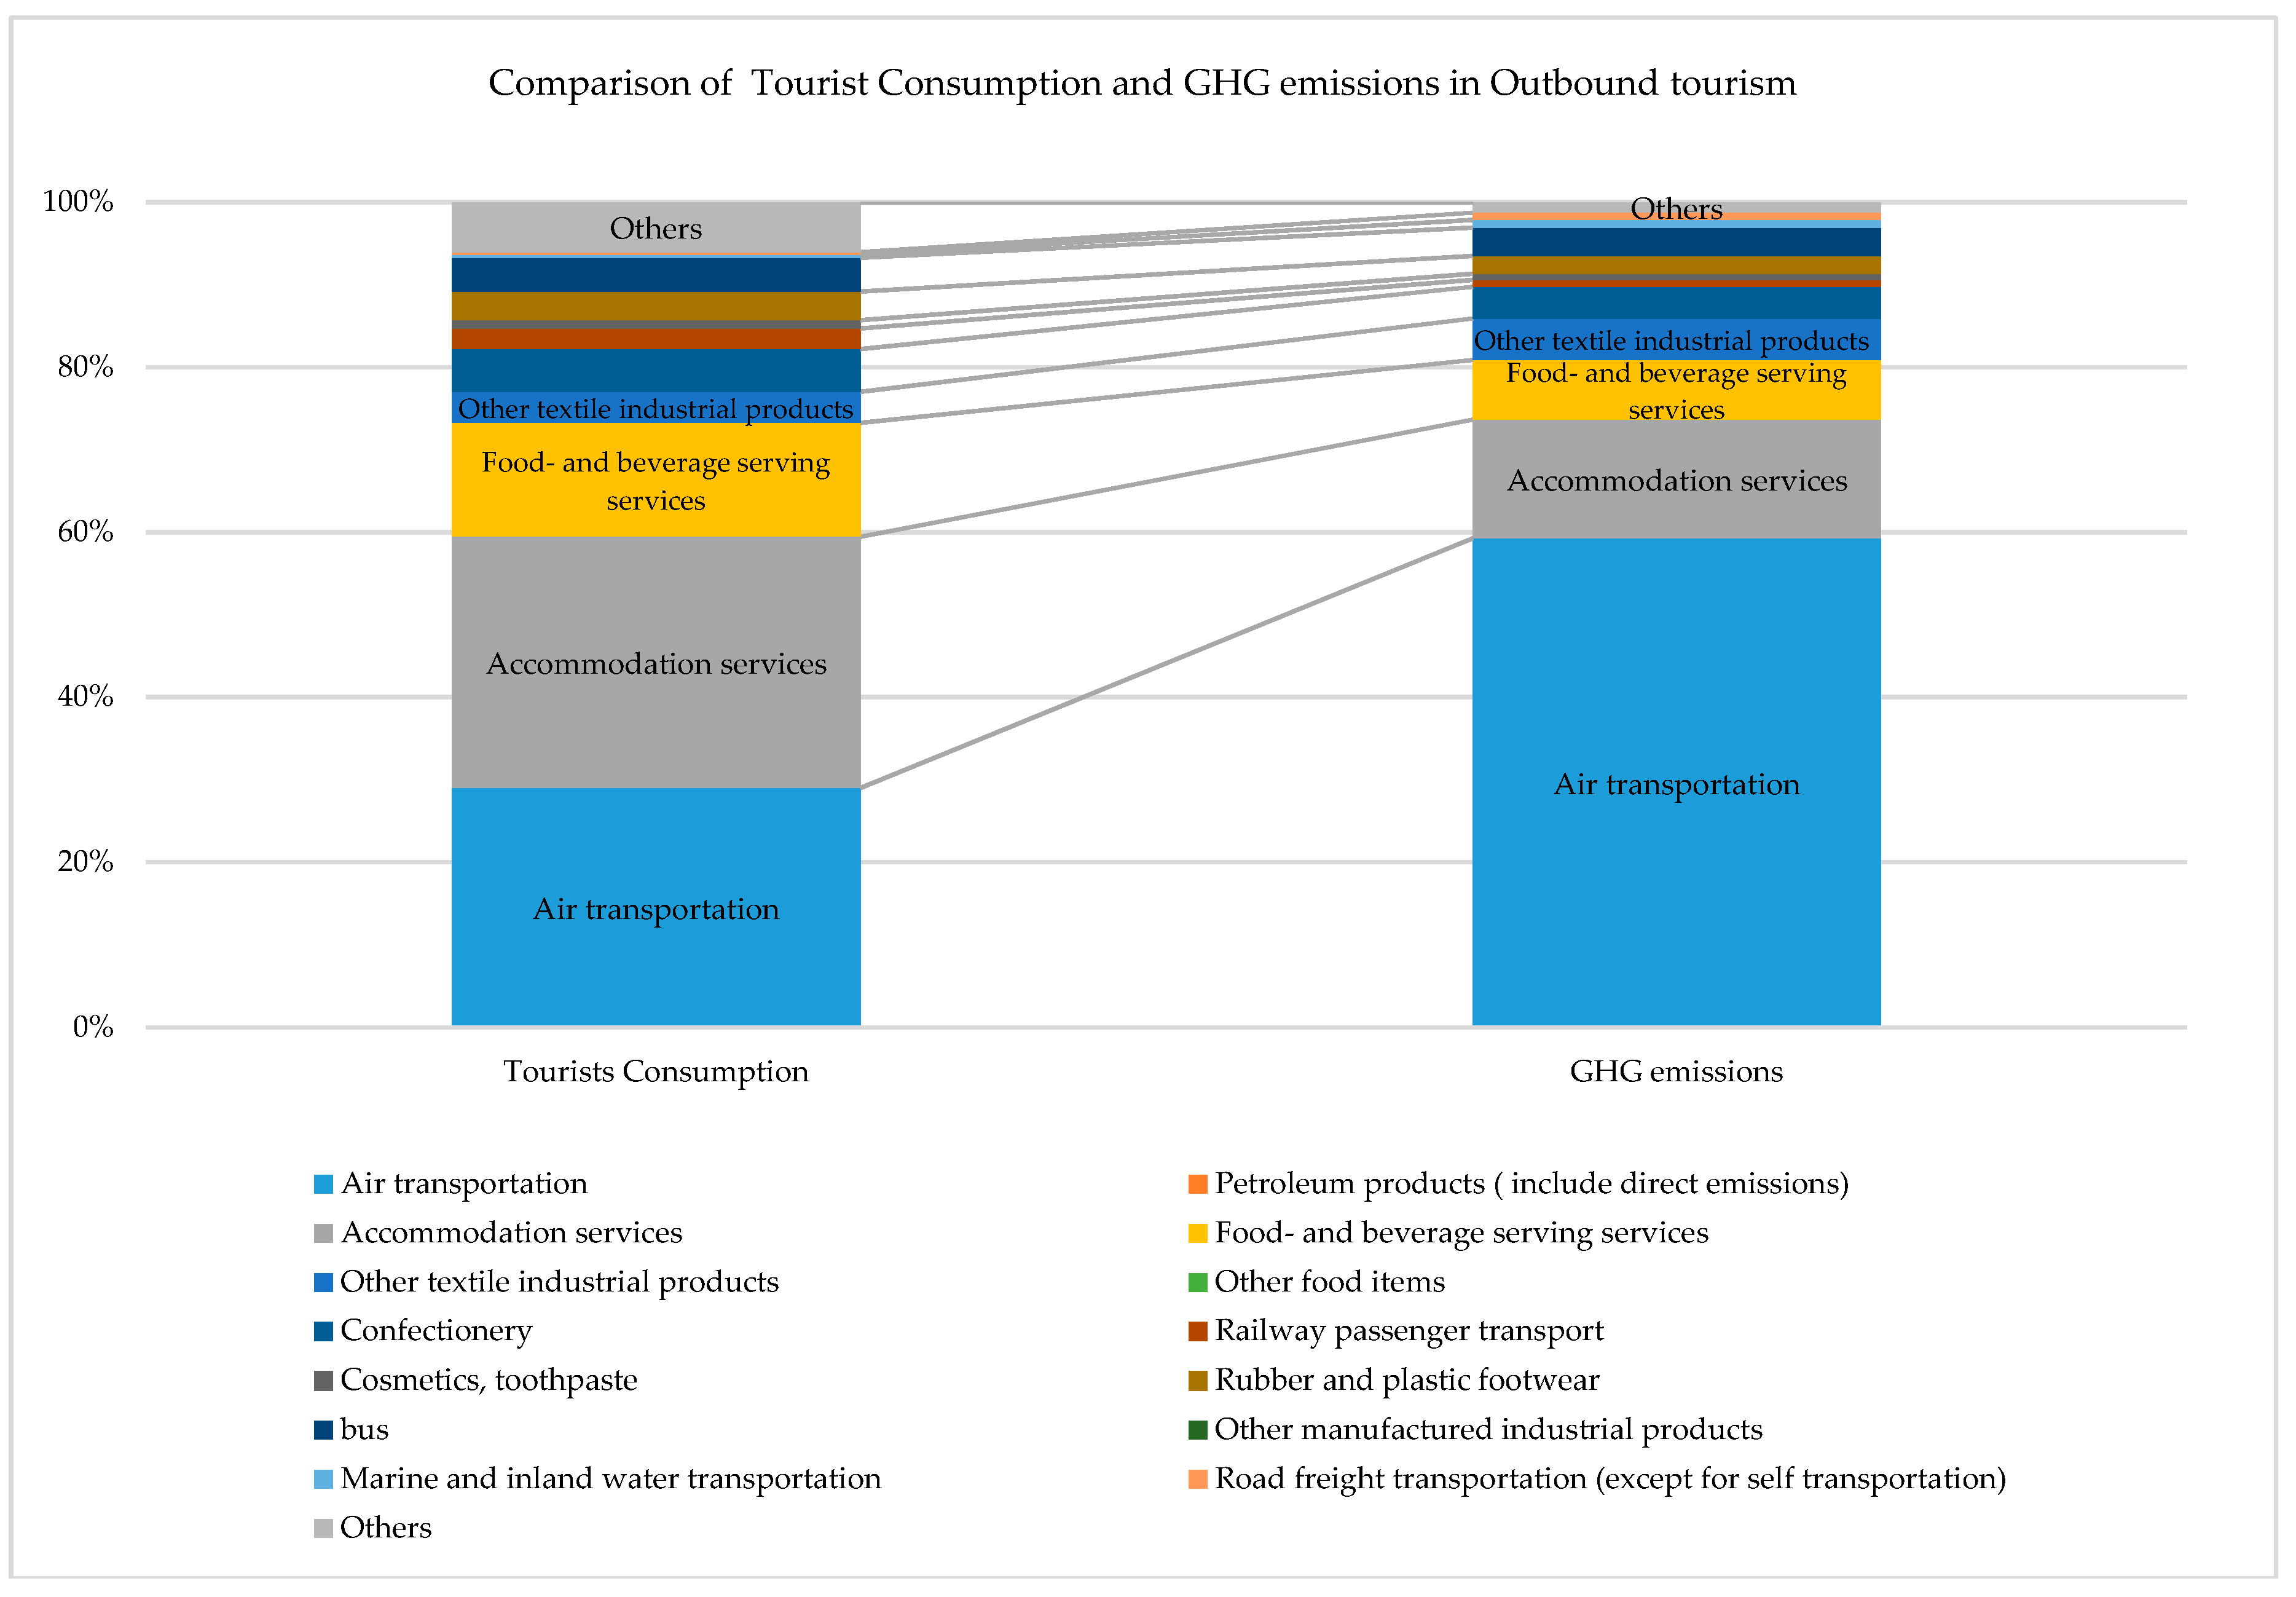
3.4. Outbound Tourism
Figure 6 shows the comparison of travelers’ consumption and the GHG emissions of the outbound stage. Travelers spend a great deal on air transport, and the GHG emissions have a similar tendency. Certainly, air transport has a higher impact than others. On the other hand, the ratio of rail transport is lower.
4. Discussion
4.1. Comparison with Existing Research
The GHG emissions of Japan in 2017, as announced by the Ministry of the Environment, were 1292 million t-CO2eq [27]. Therefore, according to the results developed in this study, tourism in Japan accounts for about 10.5% of the national CFP (Table 4).
According to the estimation from the JTA [6], the tourism GDP in 2017 was 10.7 trillion yen which is about 2.0% of Japan’s nominal GDP (545.1 trillion yen) (Table 5).
The tourism policy of the Japanese government is aimed at stimulating both inbound demand and domestic consumption; it can be estimated that the economic effects will increase further in the future [28]. Based on the results of this study and the following references, we should closely monitor the relationship between economic activity and changes in GHG emissions.
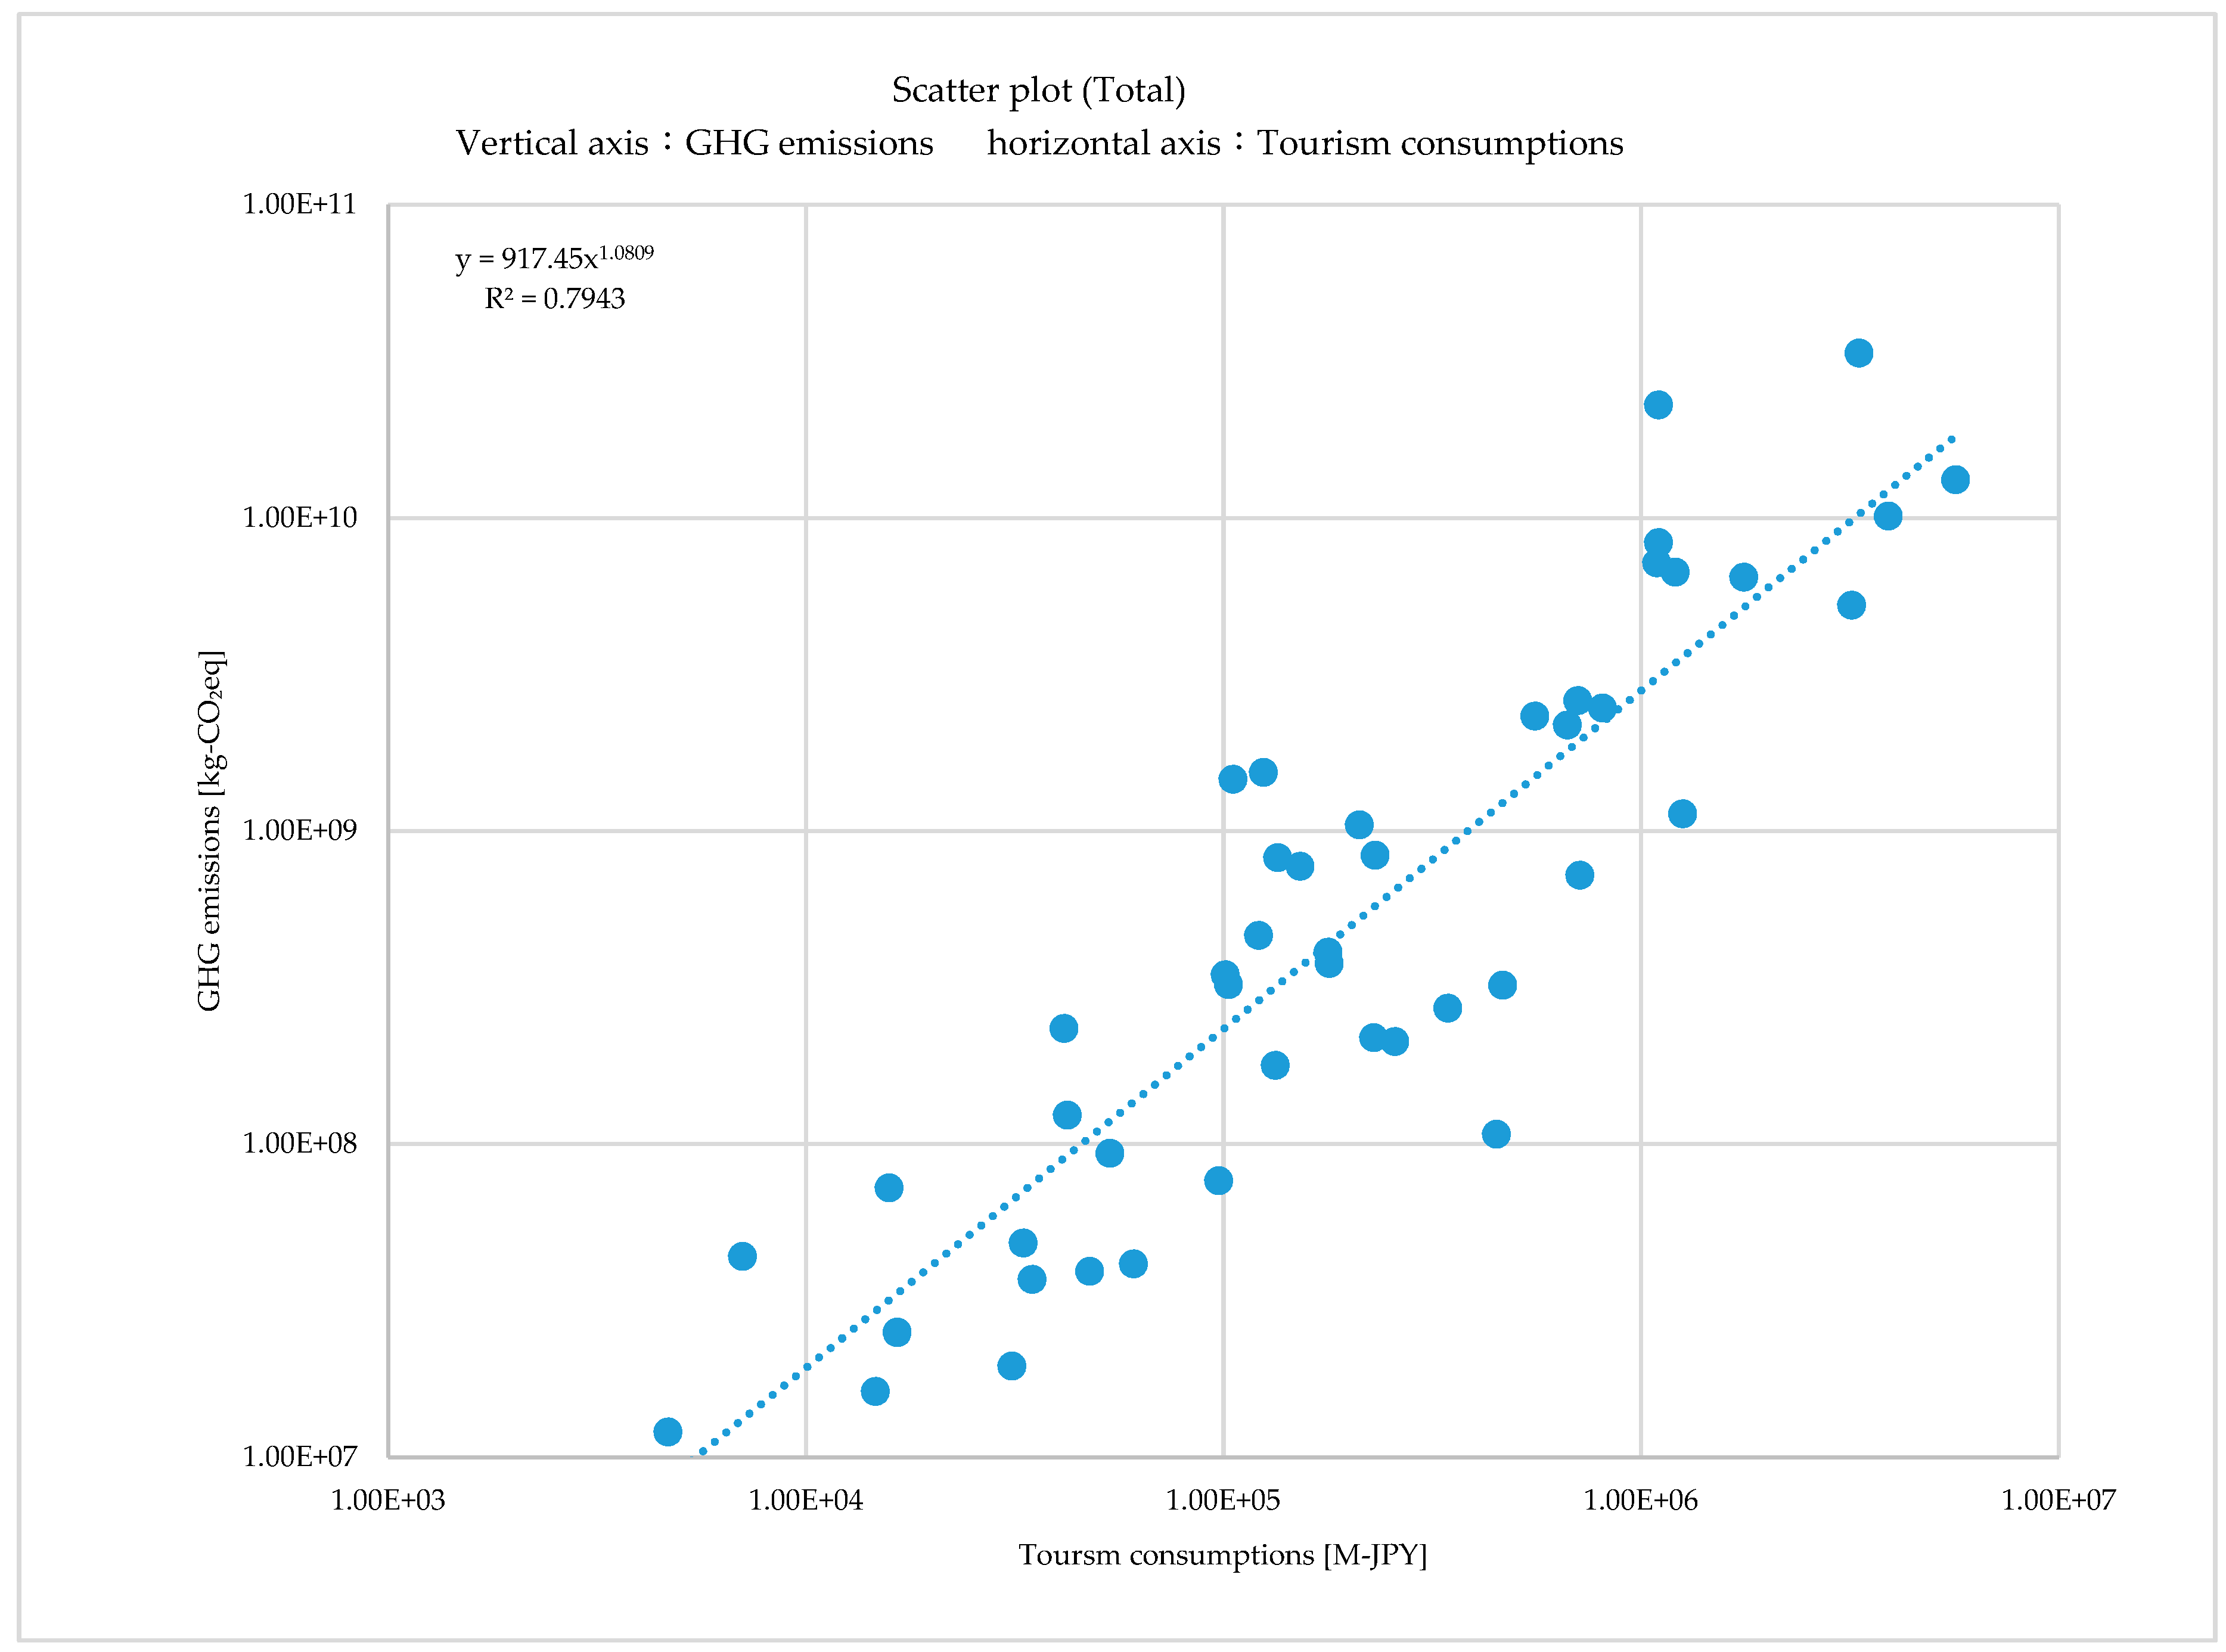
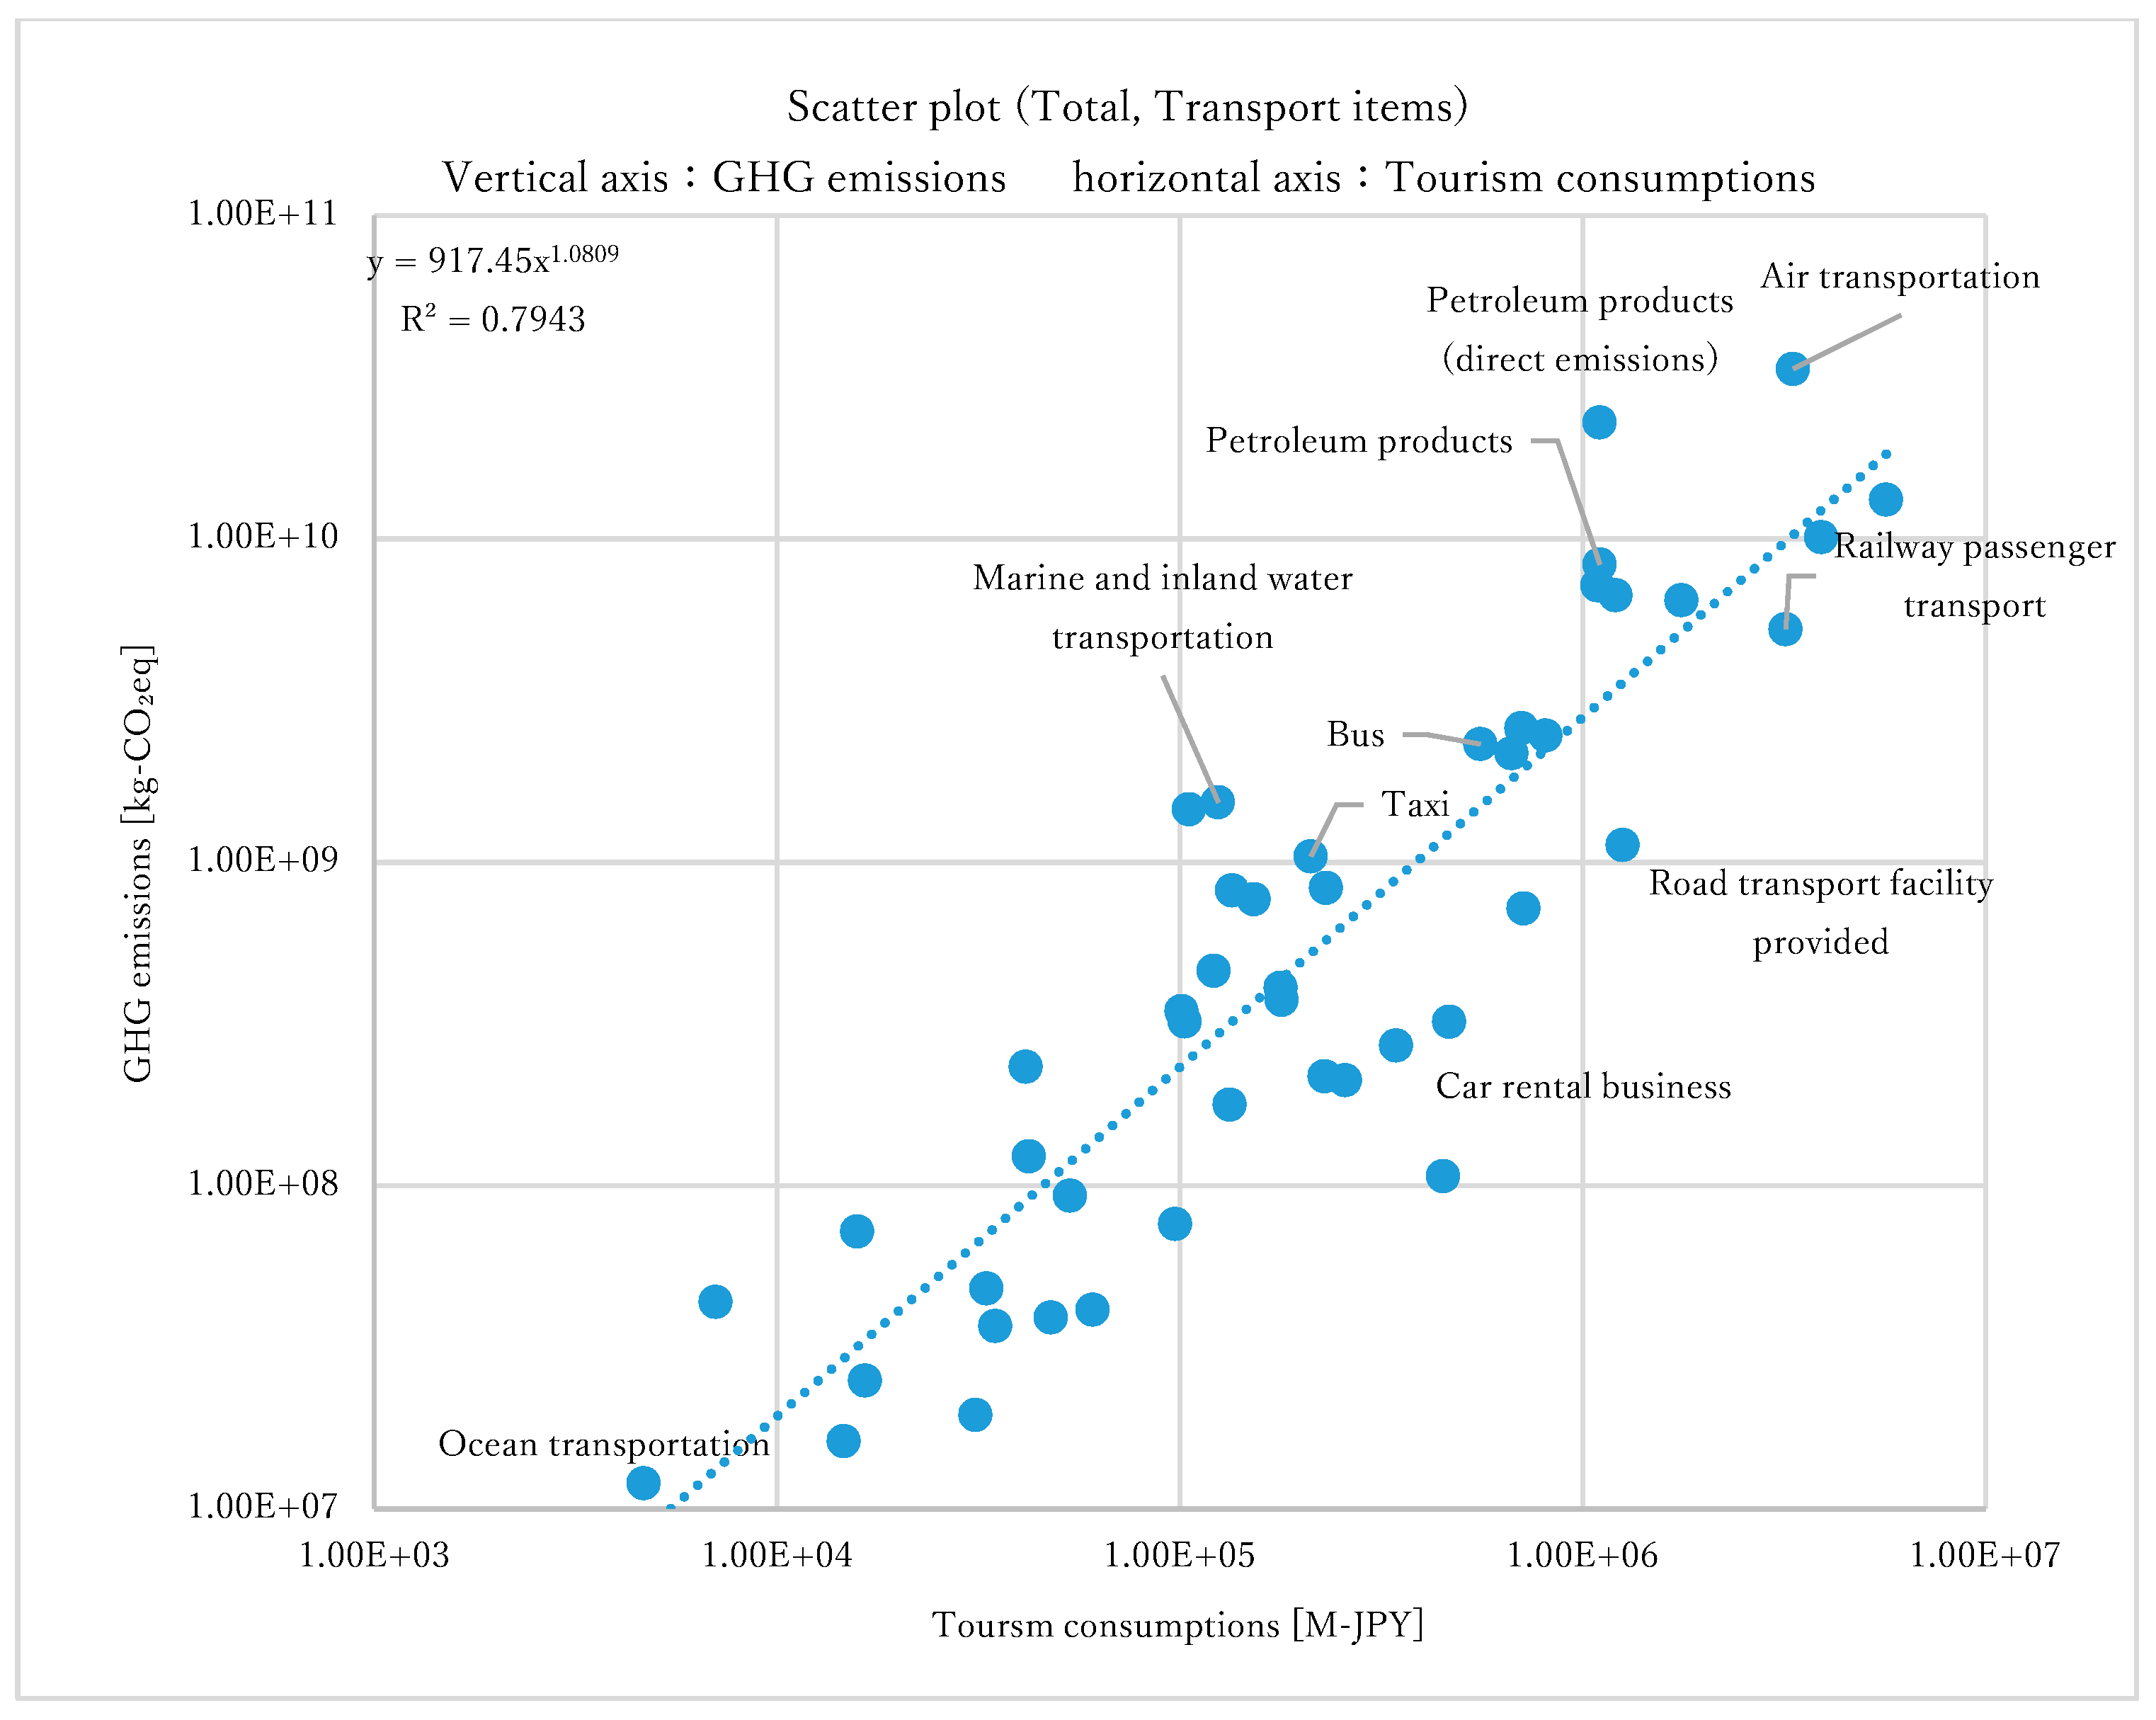
Shimizu et al. (2014) [20] stated that, in the future, the tourism industry should actively consider measures to reduce greenhouse gases, as one of the leading industries in the world. However, there are only a few certification registrations in the CFP program [17] and Eco Mark [18,19] that are used to label systems for businesses in Japan. Lenzen et al. (2018) [12] noted that the majority of CFP is emitted by travelers from high-income countries inside or outside their countries. Their results show about 8% of global GHG emissions. In addition, the surge in tourism demand is becoming an urgent issue that far exceeds the decarbonization systems of tourism-related technologies. Figure 7 shows the relationship between the GHG emissions and tourism consumption. The larger the vertical value, the higher the GHG emissions and therefore the higher the environmental impacts. The larger the horizontal value, the greater the tourism consumption and the higher the economic effects. Therefore, products and services with low GHG emissions that are largely consumed by the tourism sector can be said to be products and services that contribute to both the environment and economy. For example, it could be confirmed that accommodation and eating and drinking services have a lower environmental impact and better economic effects than air transportation. If focusing on transportation only, the economic effects of air transportation and railway passenger transport are similar; however, it can be seen that air transportation is superior in terms of the environmental burden. In addition, it can be seen that sweets related to souvenirs, other foodstuffs, and other textile industry products certainly have a small environmental impact but also a small economic effect.
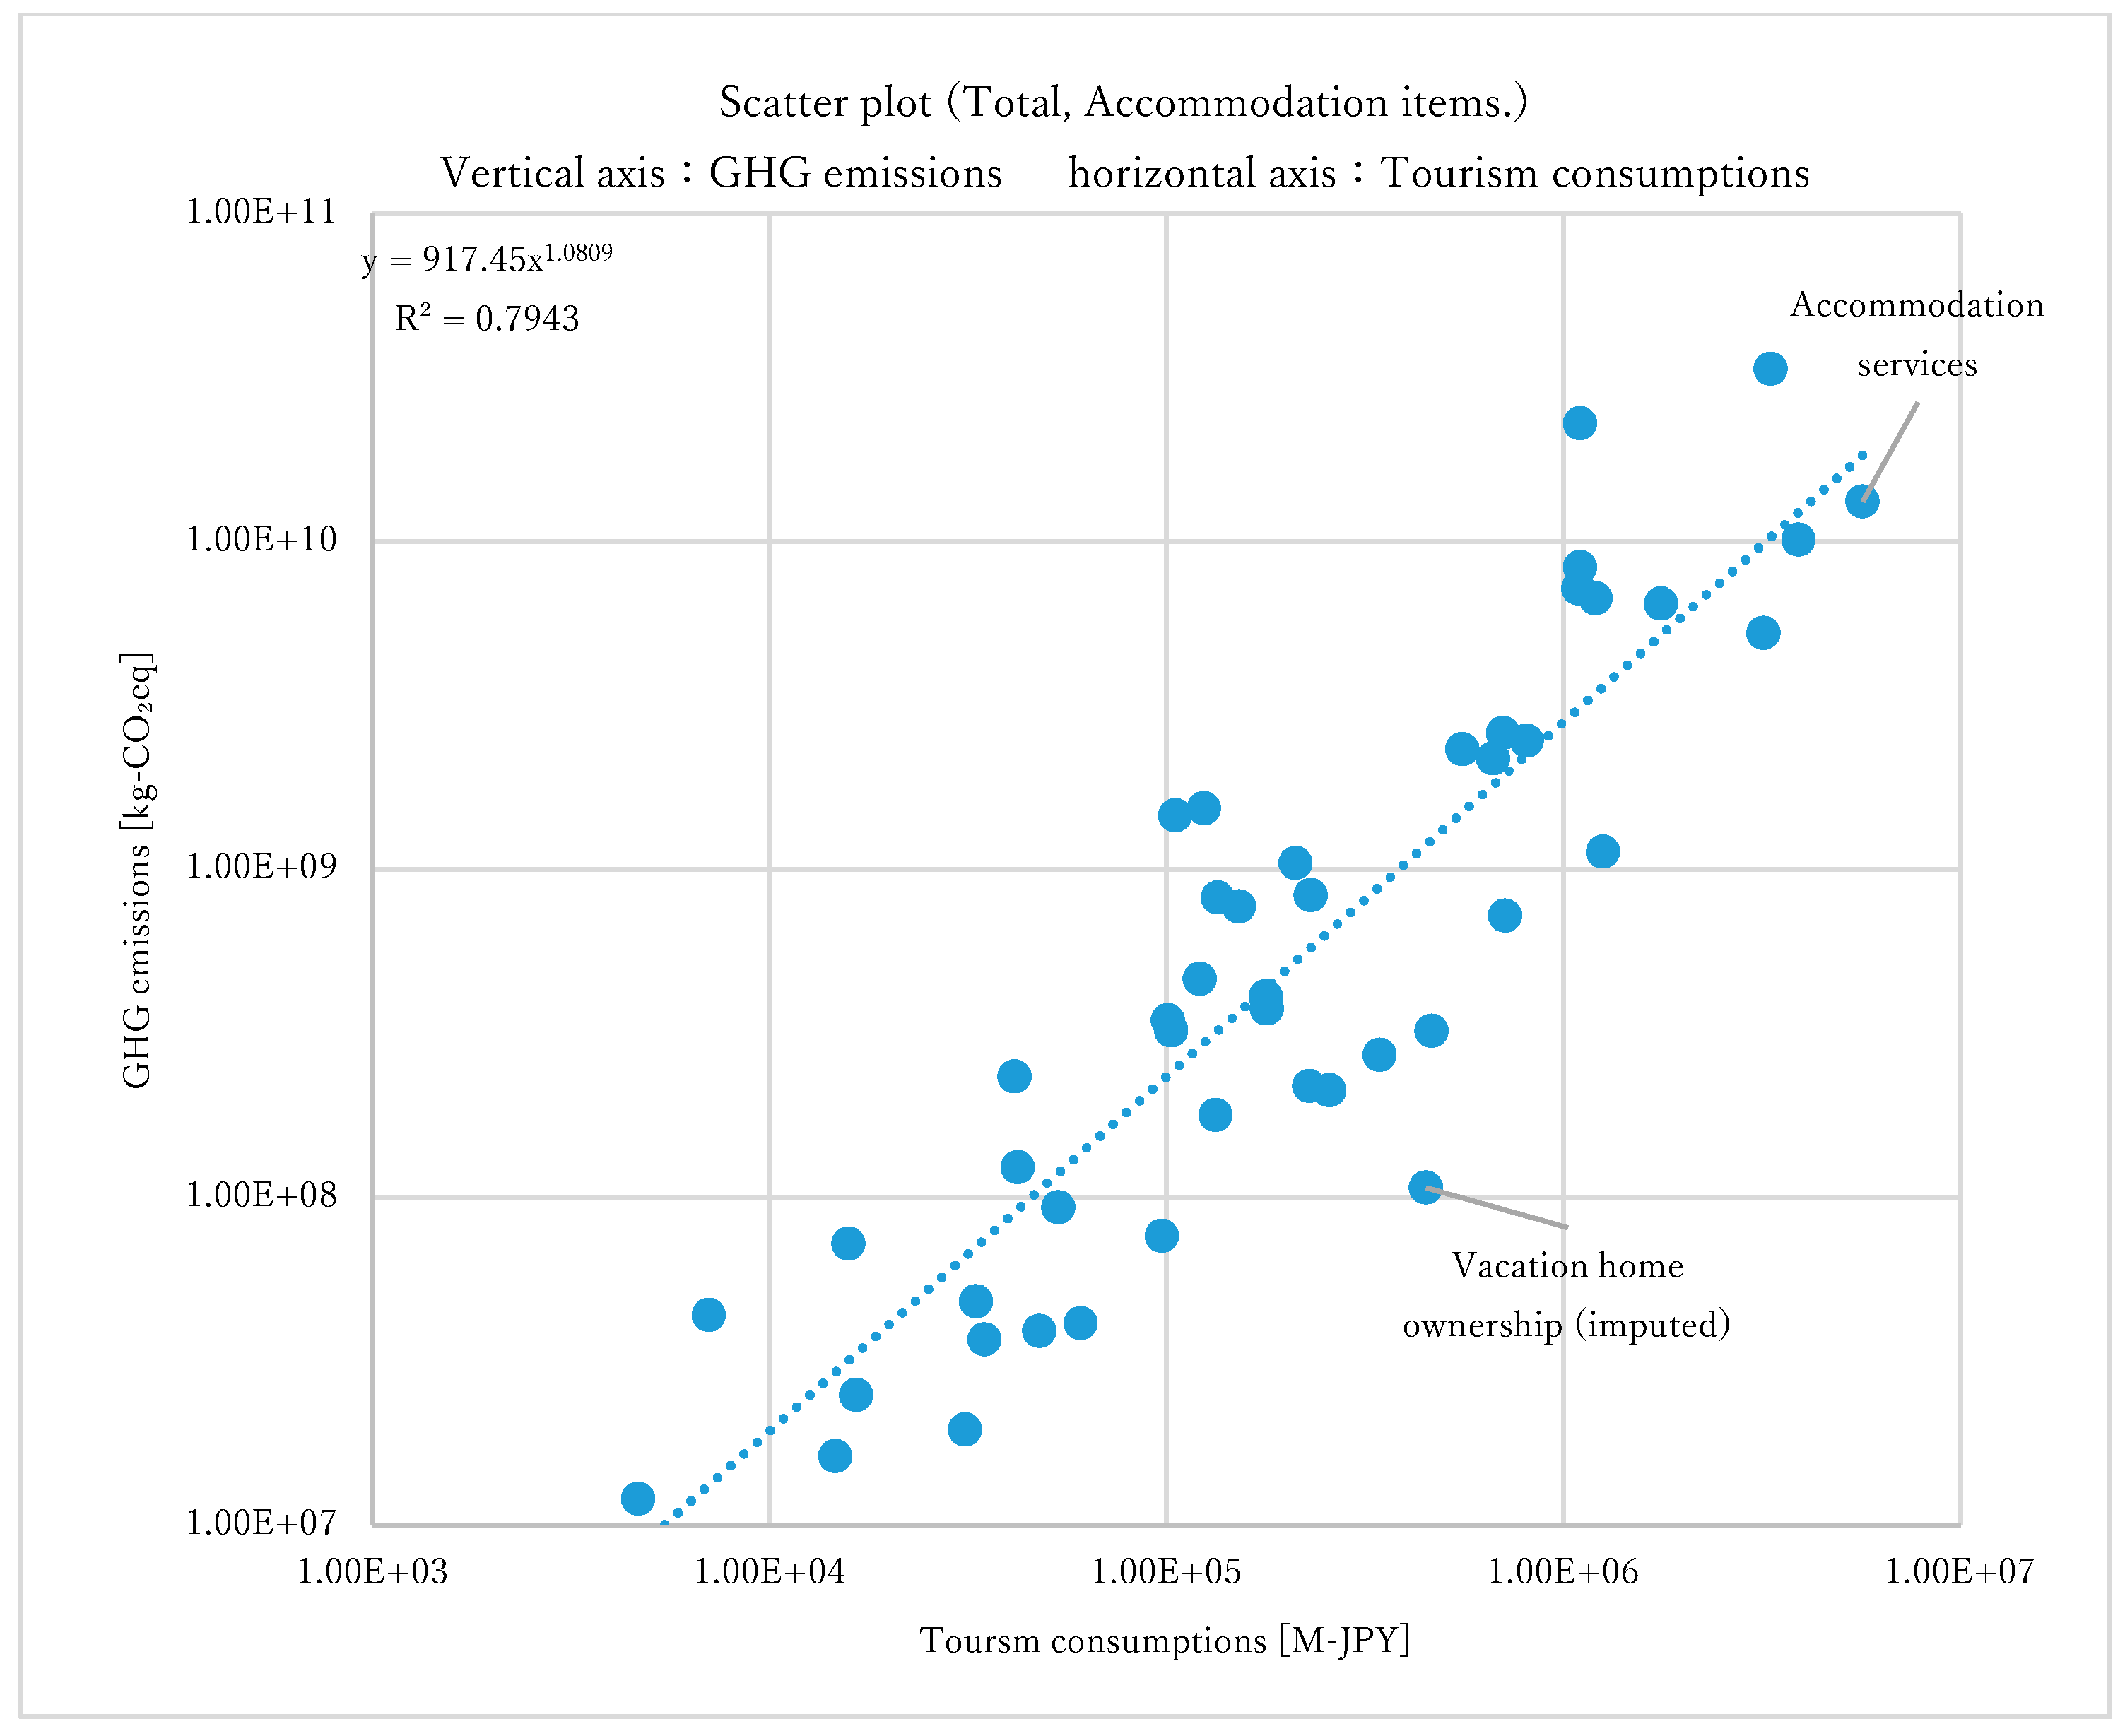
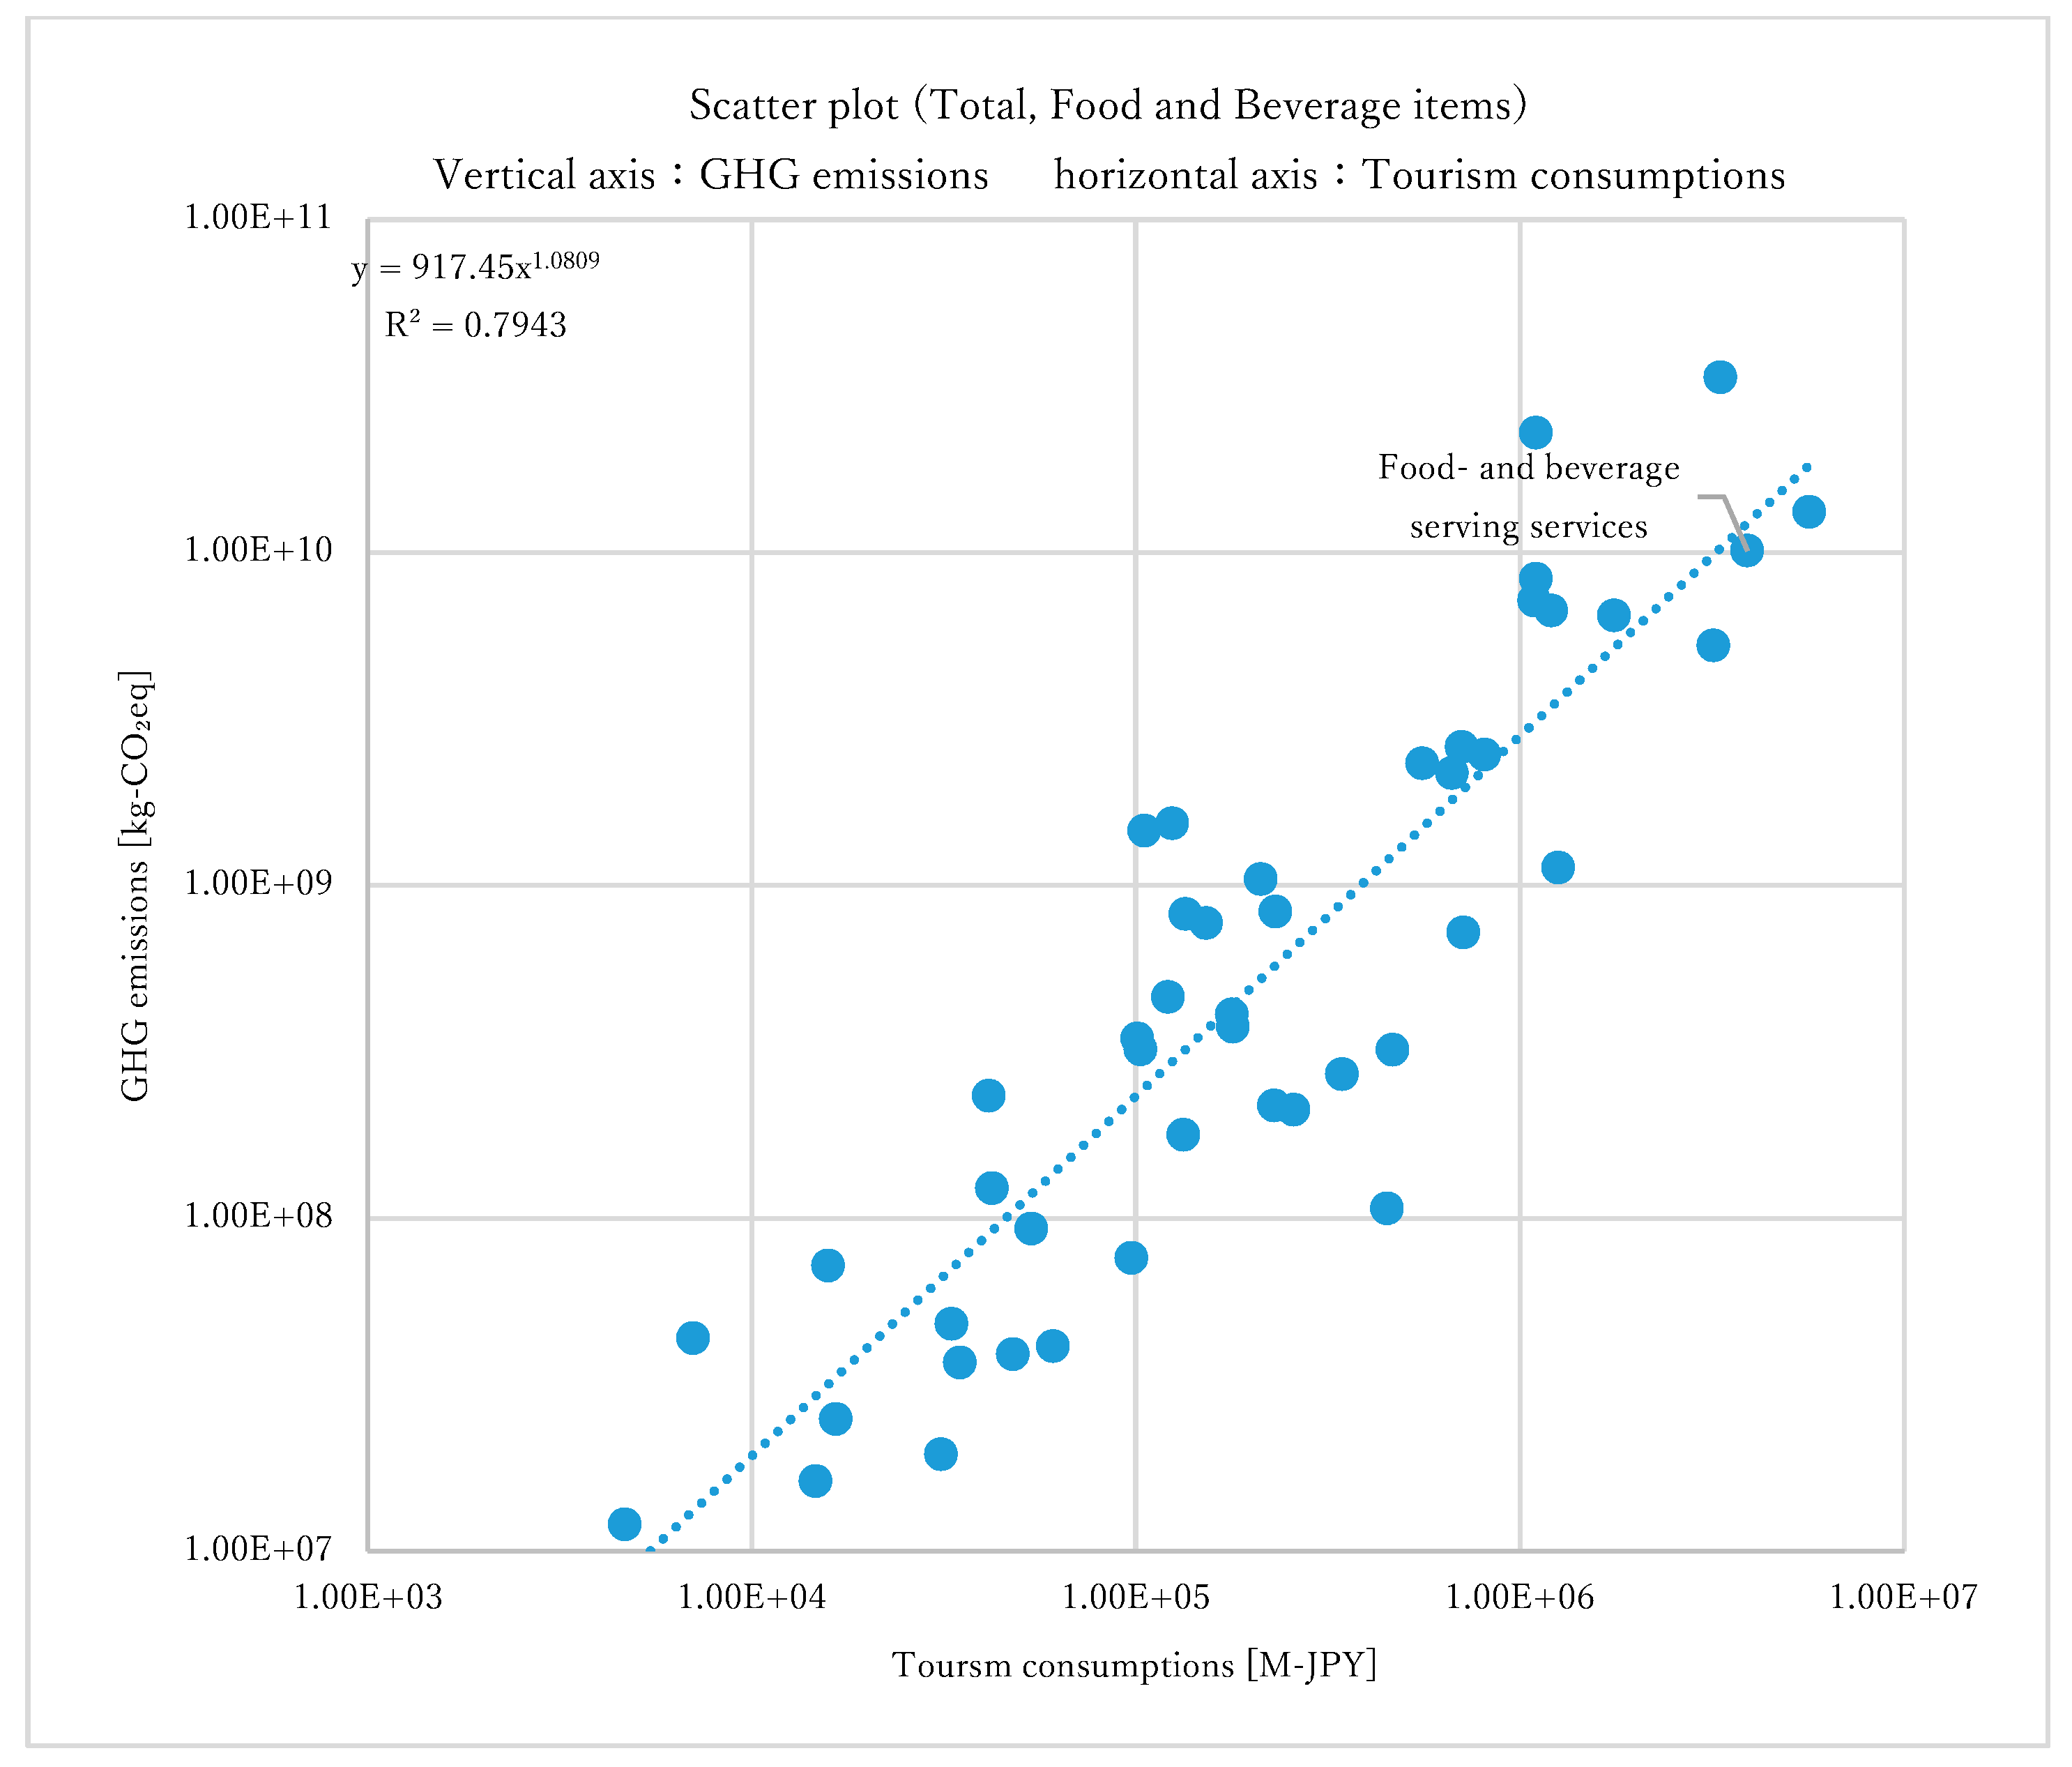
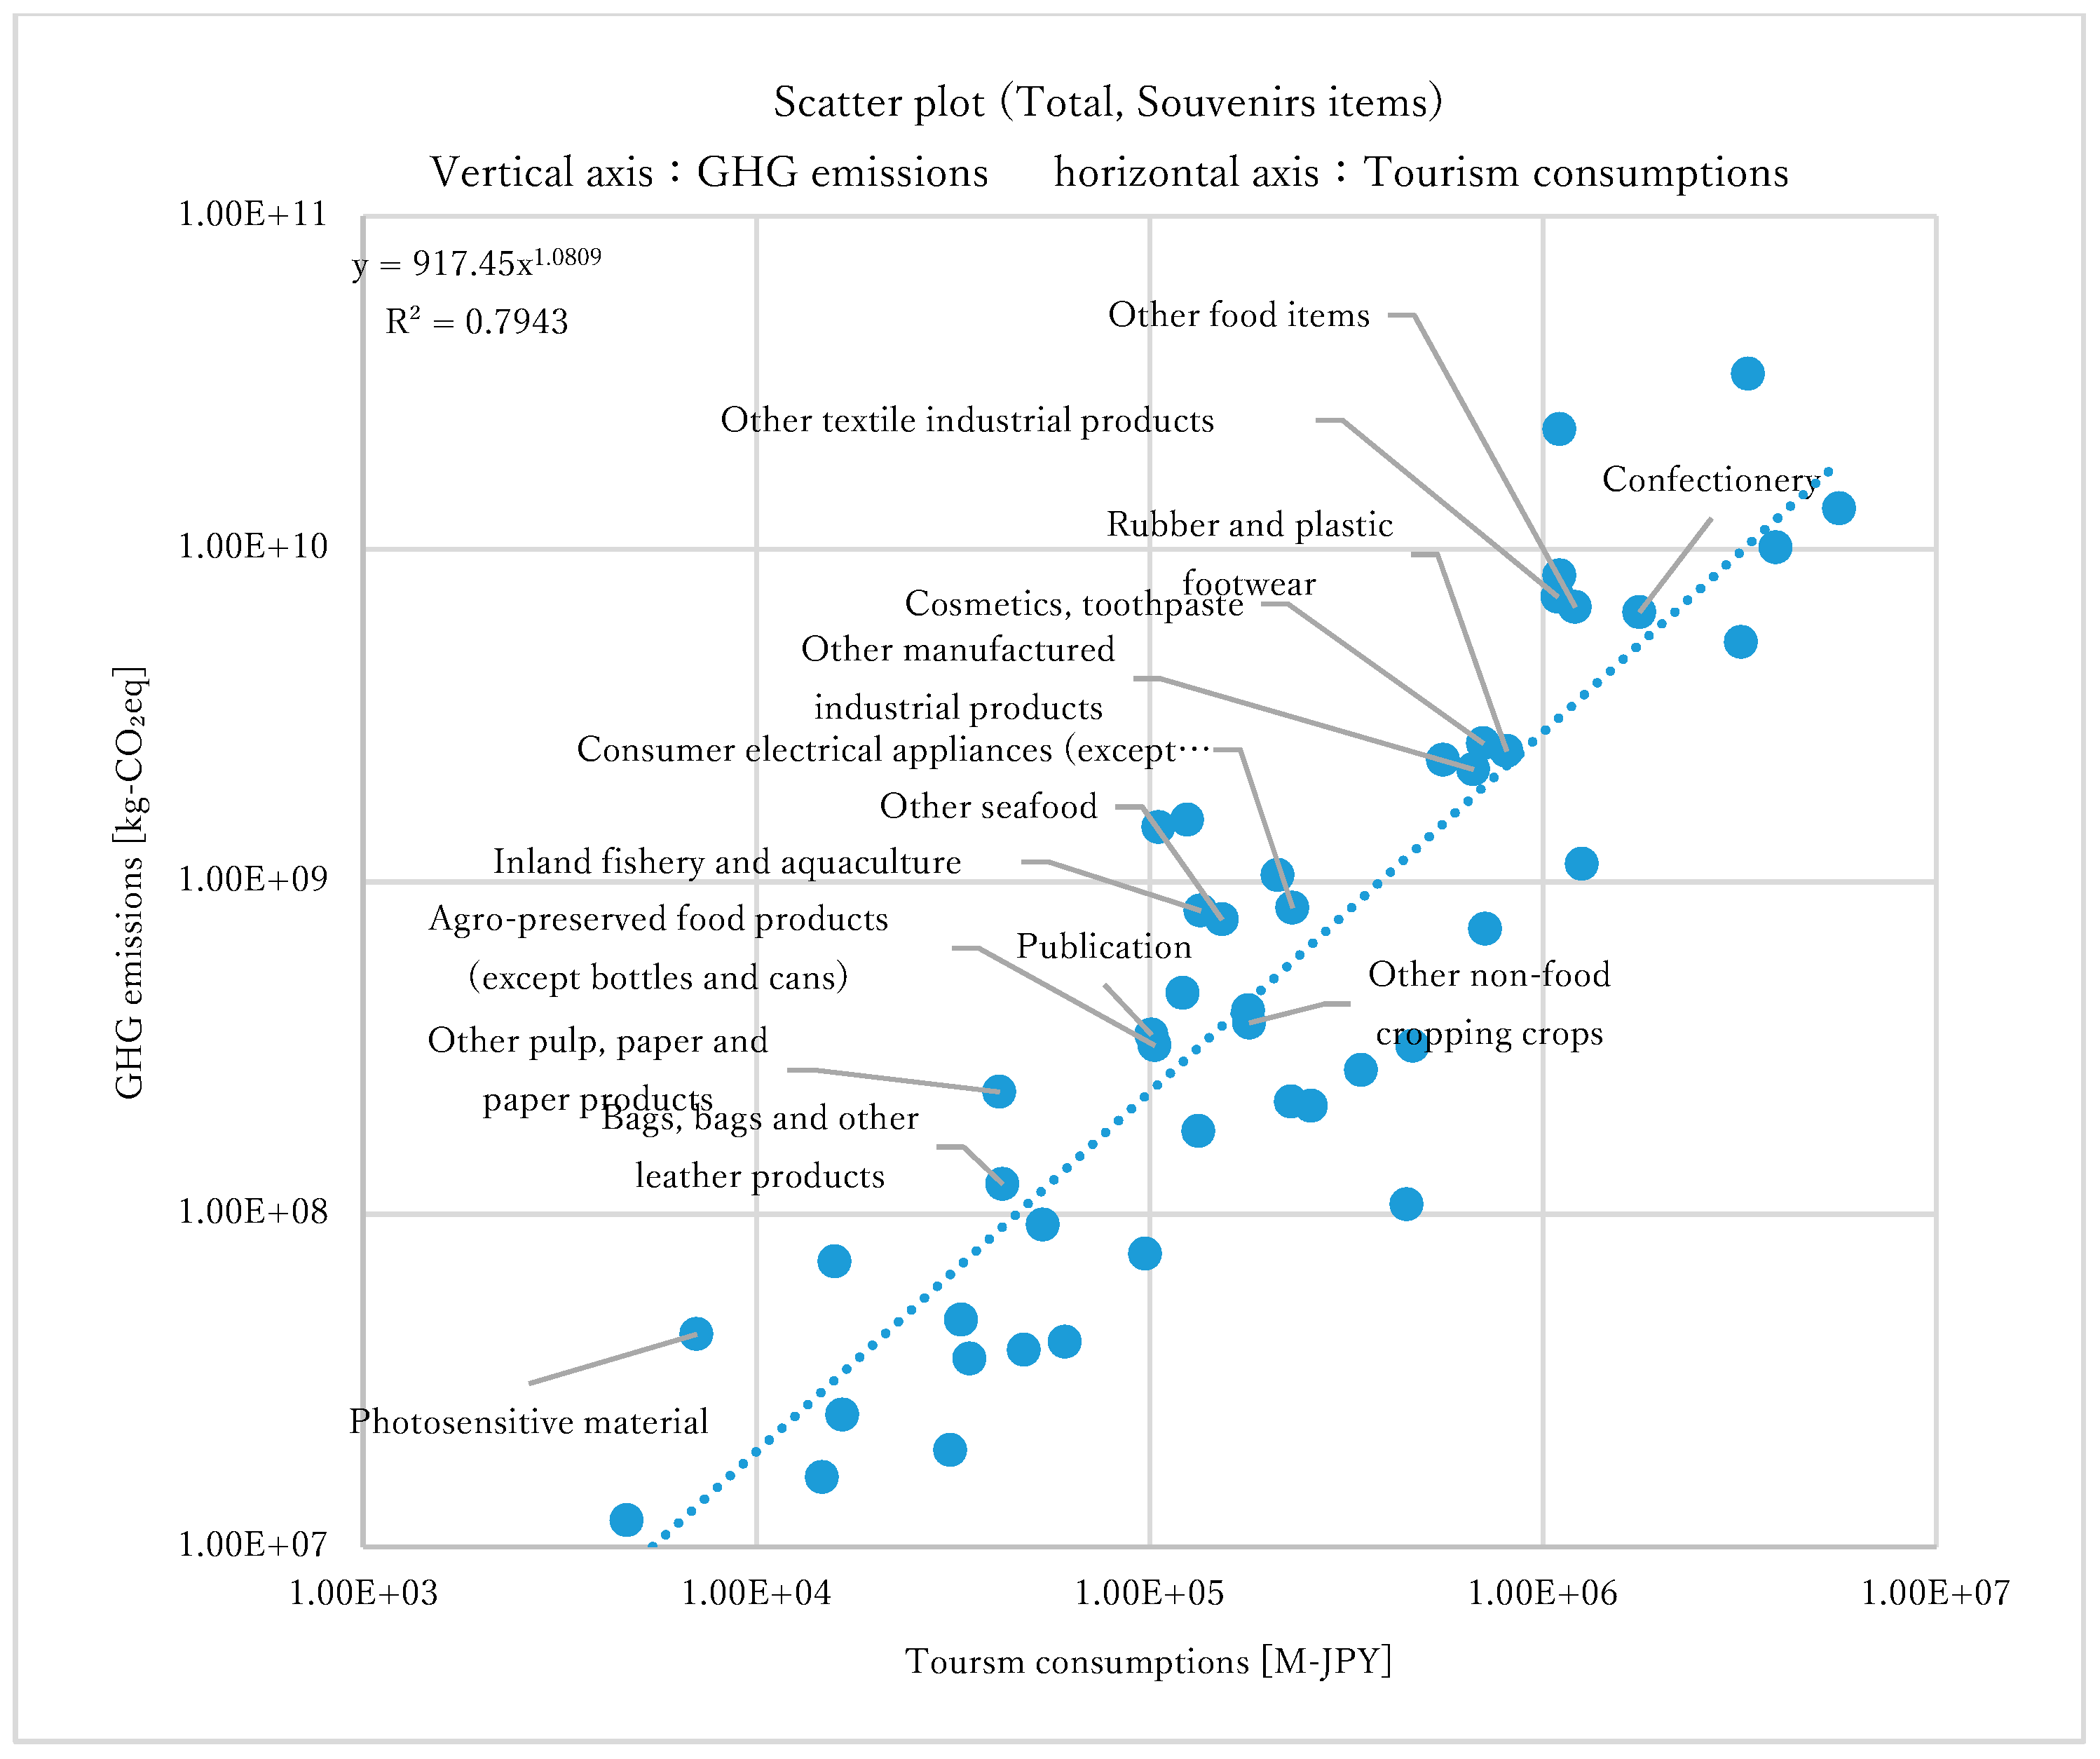
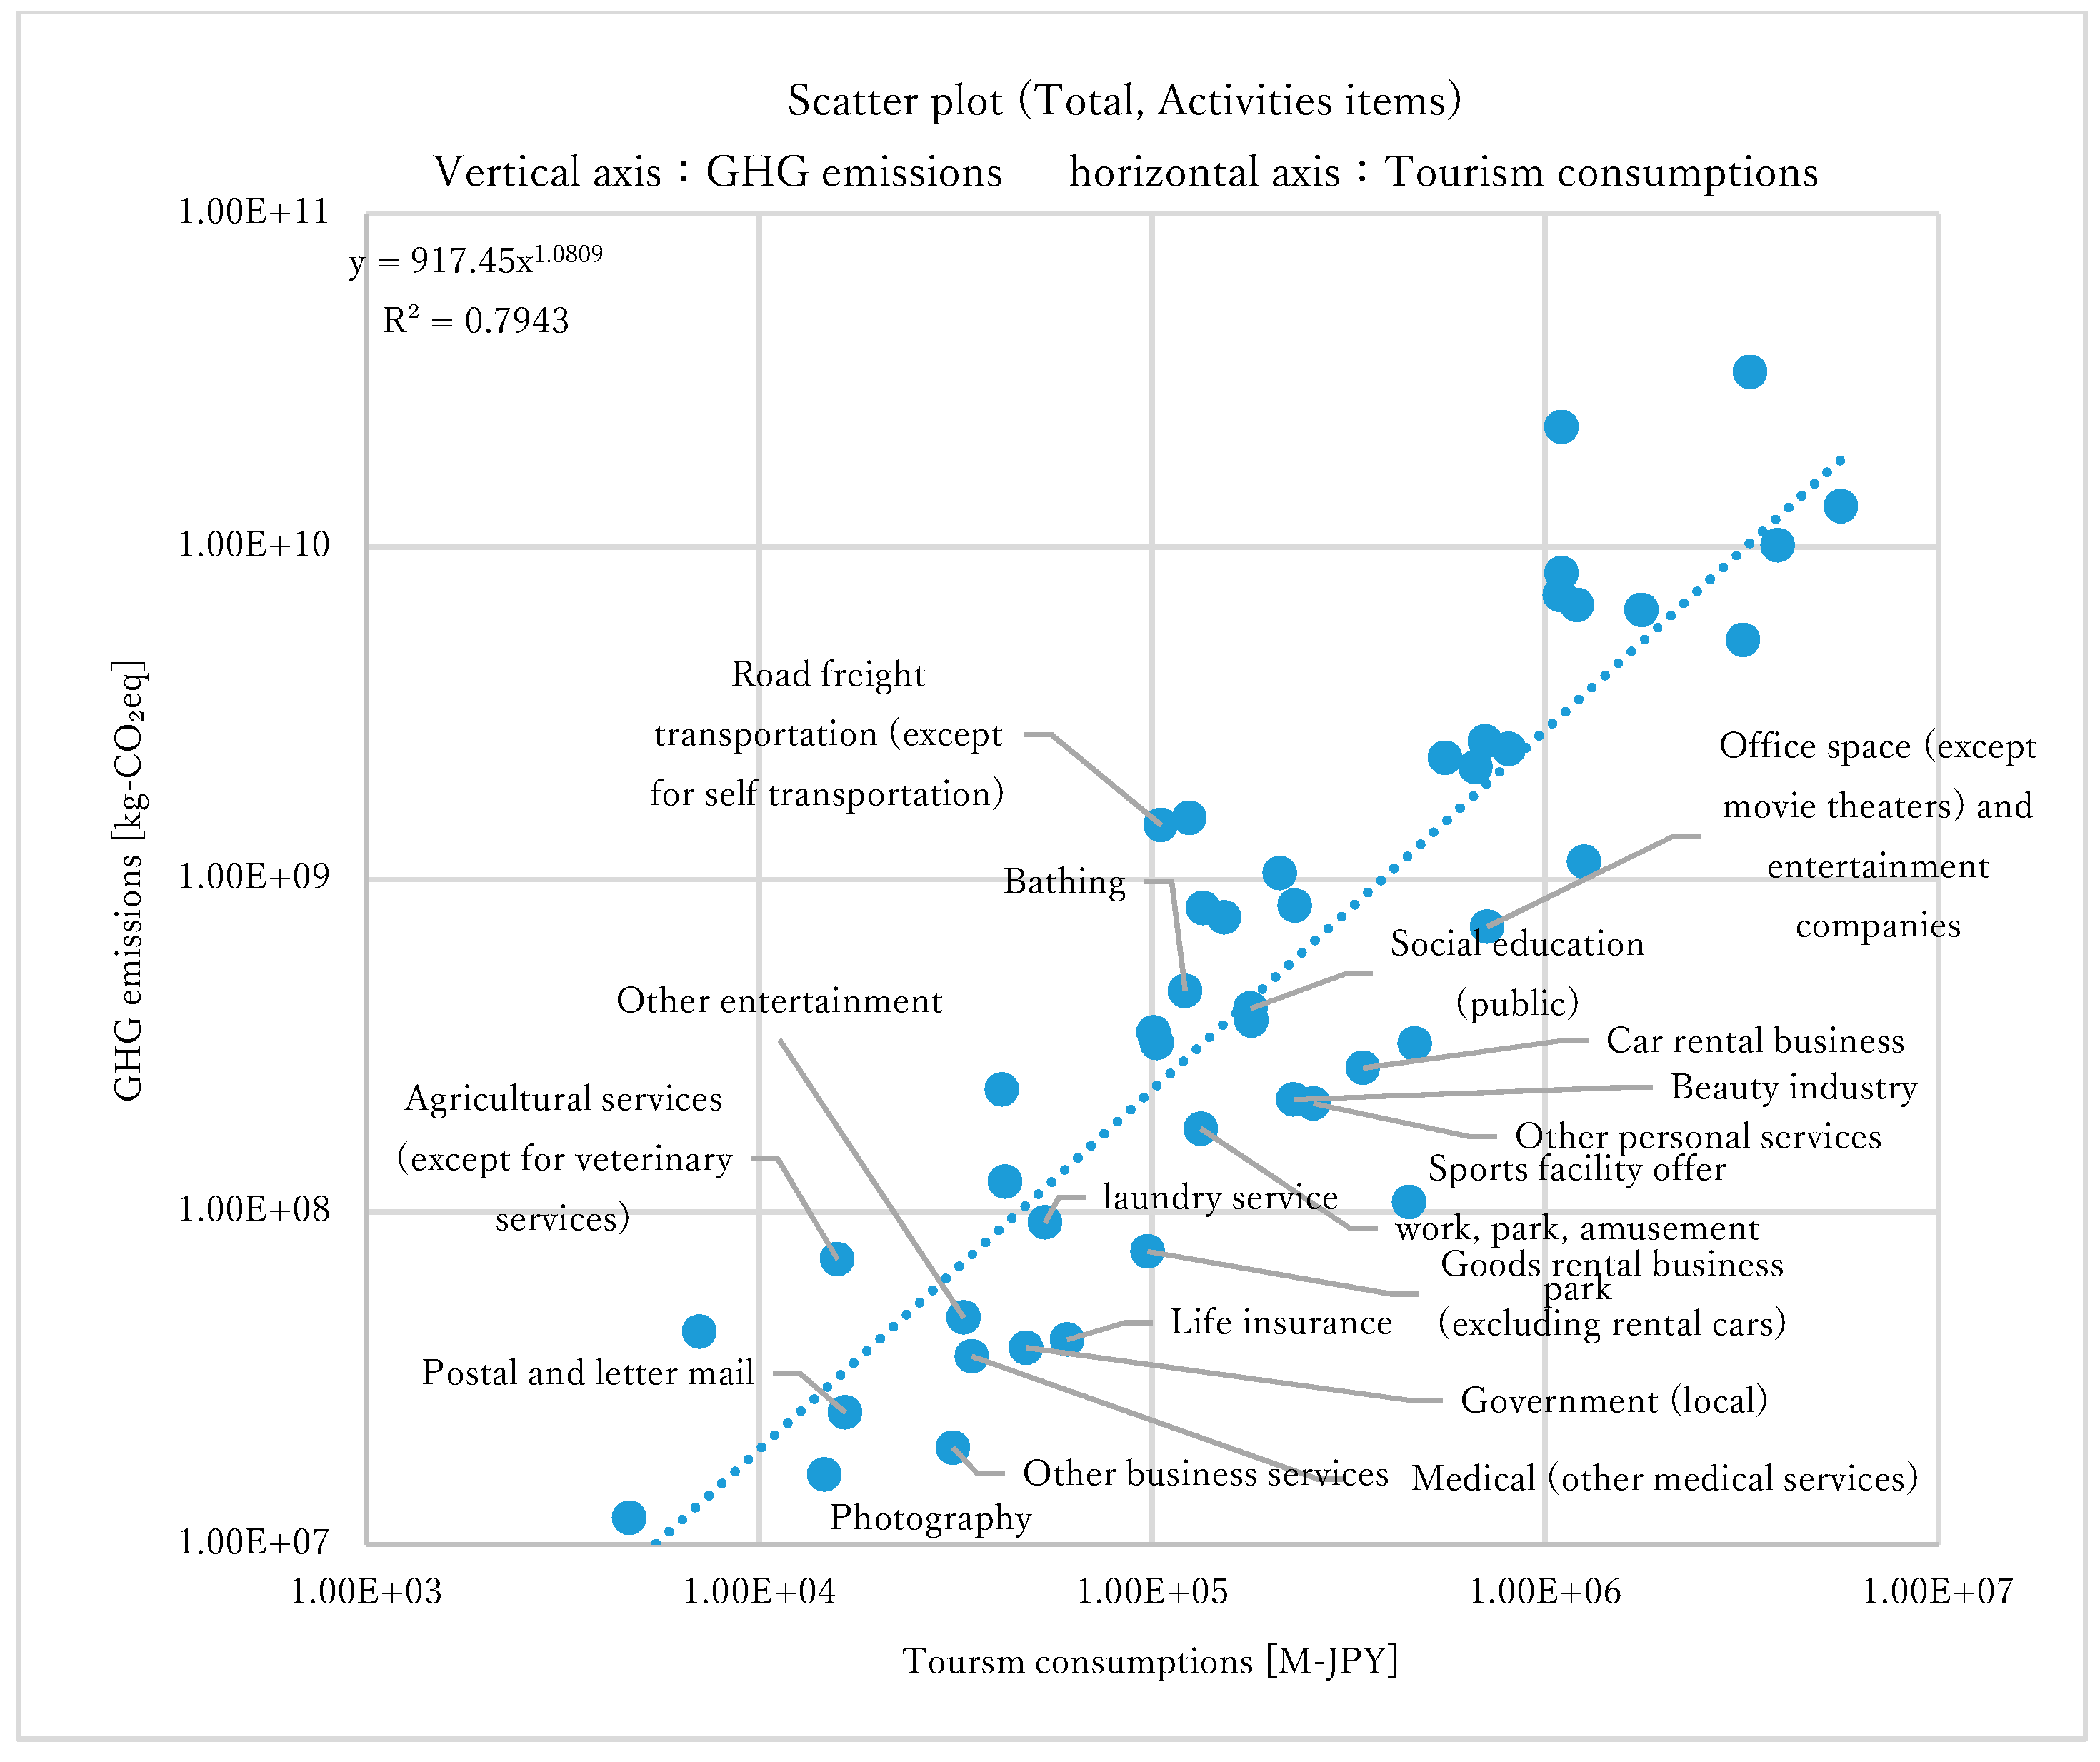
Appendix AFigure A1, Figure A2, Figure A3, Figure A4, Figure A5 and Figure A6 show Figure 7 in detail. In each figure, the items for each product category are displayed in text. For example, Appendix A, Figure A5 shows text in the figure to indicate only Souvenir items. Most items are above the linear approximation. Appendix A, Figure A6 shows text in the figure to indicate only Activity items. Many items are below the linear approximation. Thus, activities have less environmental impact than souvenirs and contribute to the economic impact. However, the Accommodation in Figure 3 is only Accommodation services and Vacation home ownership (imputed). No difference is shown here for the type of accommodation or set plan. Furthermore, the Food and beverage in Figure 4 has only one item and cannot show different types of meals.
For this reason, in Japan, it is necessary to consider measures to reduce GHG emissions for each product and service that compose tourism, such as accommodation, Food and beverage, and souvenirs, etc. In addition, it is necessary to educate the relevant operators to identify the environmental issues and actively work on reducing GHG emissions. Finally, we believe that it is an urgent issue to develop products and services that can be selected by travelers based on environmental labeling and other labeling systems. In recent years, the tourism trend has shifted from consumption of goods to experiences. The study found that it is also beneficial to increase experiential consumption to aim for a sustainable tourism style. After this, we plan to assess the environmental and economic impact of individual travel as a case study to see if this is sustainable tourism.
Filimonau et al. (2016) [11] expects that many of the LCA evaluation examples for tourism shown in the book can educate tourists to choose sustainable tourism. In Japan, there are only a few applications based on LCA methods (particularly process-based LCA) to evaluate the different components of tourism. In other countries, for example, the input–output LCA approach is used to evaluate the hotel industry by focusing not only on climate change but also on other environmental impacts (Appendix A, Table A1: Rosenblum et al. (2000)).
4.2. Limitations and Future Investigations
As an issue related to these results, it is necessary to expand the products and services that constitute tourism, from the viewpoint of evaluation with higher extensibility and comprehensiveness. In particular, this article does not include procurement, direct energy, waste, etc., of the MICE organizers. In addition, as the results differ depending on the setting of the boundary range (ex: inbound tourism/domestic tourism, local consumption, etc.), examining how to use the results is also necessary.
In the future, it is necessary to study the close link between the economic expansion and the several environmental impacts (climate change, land use, and water use, for example) of the different products and services which are consumed in the tourism industry, not only air transportation but also other services, for example, accommodation and souvenirs. Moreover, not only a mid-range view is profitable but also a long-term assessment to track the possible evolutions compared with the past.
5. Conclusions
We have established a procedure to quantitatively view the Japanese tourism industry’s CFP. In this study, we calculated the CFP, and it was found to be 136 million t-CO2eq (Figure 1). The contribution ratio of each stage was as follows: Transport 56.3%, Souvenirs 23.2%, Accommodation 9.8%, Food and Beverage 7.5%, Activities 3.0%. Then, in the breakdown, the impact had the following order: Air transport 24.7%, Petrol (direct emissions) 16.9%, Accommodation 9.8%, Food and Beverage 7.5%, Petrol 6.1%, Textile products 5.3%, Food items 4.9%, Confectionery 4.8%, Rail transport 3.9%, Cosmetics 1.9%, and Footwear 1.8%.
From the results of this study, we have shown that tourism can generate GHG emissions that contribute to climate change and to the environmental burden. In addition, we showed the tendencies of the characteristics of tourism and tourist consumption. The breakdown regards the use of air transportation and accommodation services, which are indispensable for transportation and stay, and also the contribution of food services, souvenirs, and confectionery. Through considering different types of movements (domestic and global), we were able to confirm a high contribution from the purchase and consumption of pharmaceuticals, cosmetics, shoes, and bags.
In addition, if the tourism industry is prosperous, despite a great economic effect advantage, there is a drawback, as the environmental burden increases. It is then important for travelers to be able to select products and services with a lower environmental impact.
In this study, priority was given to showing the whole of CFP in tourism and finding significant contributions other than transportation. We need to know about low-carbon consumption of products and services and changes in consumption styles over the medium to long term and consider alternatives to reduce significant contributions. However, it is necessary to thoroughly examine and discuss whether changes in travel styles will contribute to GHG reduction. It is also necessary to conduct evaluation studies on whether new travel styles contribute to sustainable tourism from the perspectives of the environment, economy, and society, including CFP evaluation.
Author Contributions
Conceptualization, Y.K. and N.I.; methodology, Y.I. and N.I.; writing—original draft preparation, Y.K. and S.K.; supervision, N.I. All authors have read and agreed to the published version of the manuscript.
Funding
This research received no external funding.
Acknowledgments
We would like to express our gratitude to Haruo Suzuki for his generous support for our study.
Conflicts of Interest
The authors declare no conflict of interest.
Appendix A

Table A1.
Existing case study and paper. The following table was added by the author based on V. Filimonau et al. 2016 [11].
Table A1.
Existing case study and paper. The following table was added by the author based on V. Filimonau et al. 2016 [11].
| Study | Object of Analysis | Primary environmental Impacts Assessed | Geographical Scope |
|---|---|---|---|
| Process-based LCA | |||
| Castellani and Sala (2012) [29] | Holiday travel, Including accommodation | A range of impacts | Italy |
| Filimonau et al. (2011a) [30] | Climate change | UK | |
| Filimonau et al. (2014) [31] | UK and France | ||
| El Hanandeh (2013) [32] | Religious travel, Including accommodation | Saudi Arabia | |
| Pereira et al. (2015) [33] | Holiday travel, Excluding accommodation | Brazil | |
| Filimonau et al. (2013) [34] | Holiday package | UK and Portugal | |
| Kuo et al. (2005) [35] | Tourist catering | A range of impacts | Taiwan |
| Michailidou et al. (2015) [36] | Tourist accommodation | Greece | |
| König et al. (2007) [37] | Portugal | ||
| Sára et al. (2004) [38] | Italy | ||
| De Camillis et al. (2008) [39] | |||
| Cerutti et al. (2014) [40] | |||
| Filimonau et al. (2011b) [41] | Climate change | UK | |
| Rosselló-Batle et al. (2010) [42] | Spain | ||
| Li et al. (2010) [43] | China | ||
| Input–output LCA | |||
| Scheepens et al. (2015) [44] | Sector of regional tourism | Climate change | The Netherlands |
| Berners-Lee et al. (2011) [45] | Large tourism business | UK | |
| Patterson and McDonald (2004) [46] | National tourism industry | New Zealand | |
| Cadarso et al. (2015) [47] | Spain | ||
| Zhong et al. (2015) [48] | China | ||
| Qin et al. (2015) [49] | Tourist destination | ||
| Manfred Lenzen (2018) [12] | Global tourism | 160 countries | |
| Rosenblum et al. (2000) [50] | National hotel industry | A range of impacts | USA |
Table A2.
Internal and national tourism consumption, by timing of purchase and products (CY2017, Unit: Billion JPY).
Table A2.
Internal and national tourism consumption, by timing of purchase and products (CY2017, Unit: Billion JPY).
| Products | Inbound | Domestic | Outbound | Total | ||
|---|---|---|---|---|---|---|
| Overnight Stay | Day Trip | TRANSIT | ||||
| Travel agencies, operators, and guides | ||||||
| Travel agencies, tour operators, and tourist guide services | 22 | 225 | 33 | 159 | 27 | 466 |
| Transport | ||||||
| Airplane (domestic, local) | 19 | 1244 | 143 | 32 | 127 | 1565 |
| Airplane (international flight) | 326 | 0 | 0 | 726 | 713 | 1765 |
| Bullet train | 292 | 1443 | 595 | 22 | 0 | 2353 |
| Railways (excluding bullet train) | 0 | 453 | 255 | 22 | 72 | 802 |
| Bus | 0 | 248 | 178 | 13 | 118 | 558 |
| Taxi | 61 | 112 | 33 | 5 | 0 | 212 |
| Ships (inner service, local) | 6 | 97 | 10 | 0 | 11 | 125 |
| Ships (outbound) | 1 | 0 | 0 | 4 | 0 | 5 |
| Car rental fee | 43 | 256 | 45 | 0 | 0 | 345 |
| Gasoline cost | 0 | 672 | 424 | 7 | 0 | 1,103 |
| Parking lot, toll road charge (except for highway charge) | 0 | 175 | 104 | 13 | 0 | 291 |
| Highway charge | 0 | 618 | 341 | 8 | 0 | 967 |
| Accommodation | ||||||
| Accommodation services | 1077 | 3,697 | 0 | 18 | 883 | 5674 |
| Vacation home ownership (imputed) | 0 | 451 | 0 | 0 | 0 | 451 |
| Food and beverage | ||||||
| Food and beverage serving services | 766 | 2077 | 646 | 26 | 400 | 3914 |
| Souvenirs | ||||||
| Agricultural products | 0 | 97 | 82 | 0 | 0 | 179 |
| Agricultural processed products | 0 | 65 | 38 | 0 | 0 | 103 |
| Marine products | 0 | 93 | 42 | 0 | 0 | 135 |
| Fisheries processed products | 0 | 105 | 48 | 0 | 0 | 153 |
| Confectionery | 137 | 1022 | 419 | 33 | 150 | 1762 |
| Other food items | 163 | 691 | 333 | 21 | 0 | 1208 |
| Fiber products | 35 | 652 | 232 | 63 | 109 | 1091 |
| Shoes, bags | 257 | 285 | 111 | 56 | 101 | 810 |
| Ceramics and glass products | 0 | 33 | 9 | 0 | 0 | 42 |
| Publication | 18 | 50 | 24 | 9 | 0 | 101 |
| Wood products and paper products | 0 | 23 | 18 | 0 | 0 | 42 |
| Medical supplies and Cosmetics | 549 | 89 | 20 | 19 | 29 | 705 |
| Film | 0 | 5 | 1 | 1 | 0 | 7 |
| Electrical equipment and related products | 107 | 71 | 25 | 21 | 8 | 231 |
| Camera, glasses, watch | 80 | 101 | 25 | 22 | 0 | 229 |
| Sports equipment · CD · stationery | 0 | 124 | 109 | 5 | 0 | 238 |
| Other manufactured products | 72 | 80 | 48 | 0 | 0 | 199 |
| Activities | ||||||
| A day spa·warm-bathing facility·beauty salon | 0 | 83 | 39 | 0 | 0 | 121 |
| Museums, museums, zoos and gardens, aquariums | 26 | 105 | 47 | 0 | 0 | 178 |
| Watching sports and Art appreciation | 9 | 82 | 93 | 0 | 44 | 228 |
| Amusement parks and expositions | 47 | 232 | 151 | 0 | 55 | 486 |
| Sports Facilities | 0 | 53 | 80 | 0 | 0 | 132 |
| Ski lift fee | 0 | 27 | 13 | 0 | 0 | 40 |
| Camp site | 0 | 0 | 1 | 0 | 0 | 1 |
| Exhibition and convention participation fee | 0 | 16 | 16 | 0 | 0 | 31 |
| Tourist farm | 0 | 7 | 8 | 0 | 0 | 16 |
| Fishing boat | 0 | 20 | 14 | 0 | 0 | 33 |
| Guide fee | 0 | 20 | 12 | 0 | 0 | 32 |
| Rental charge | 10 | 64 | 12 | 13 | 0 | 97 |
| Massage | 0 | 32 | 3 | 0 | 0 | 35 |
| Photo shoot fee | 0 | 10 | 4 | 0 | 0 | 15 |
| Mail and communication charges | 0 | 11 | 2 | 1 | 2 | 17 |
| Home delivery | 0 | 80 | 10 | 6 | 9 | 105 |
| Travel insurance · Credit card admission fee | 0 | 27 | 3 | 32 | 0 | 61 |
| Passport application fee | 0 | 0 | 0 | 41 | 0 | 41 |
| Visa application fee | 0 | 0 | 0 | 0 | 7 | 7 |
| Hairdresser/Barber | 0 | 155 | 64 | 11 | 0 | 229 |
| Develop and print photos | 0 | 31 | 14 | 5 | 0 | 49 |
| Laundry service | 0 | 38 | 13 | 3 | 0 | 53 |
| Other | 22 | 61 | 43 | 17 | 33 | 176 |
| Total | 4146 | 16,508 | 5031 | 1432 | 2897 | 30,015 |
Table A3.
Sector row code table of the input–output table items by sector, as applied in this study.
Table A3.
Sector row code table of the input–output table items by sector, as applied in this study.
| Products | Input–Output Table (I/O) Items | |
|---|---|---|
| Row Code | Sector | |
| Travel agencies, operators, and guides | ||
| Travel agencies, tour operators, and tourist guide services | 5789090 | Travel and other transportation incidental services |
| Transport | ||
| Airplane (domestic, local) | 5751010 | Air transportation |
| Airplane (international flight) | 5751010 | Air transportation |
| Bullet train | 5711010 | Railway passenger transport |
| Railways (excluding bullet train) | 5711010 | Railway passenger transport |
| Bus | 5721010 | Bus |
| Taxi | 5721020 | Taxi |
| Ships (inner service, local) | 5742010 | Marine and inland water transportation |
| Ships (outbound) | 5741010 | Ocean transportation |
| Car rental fee | 6612010 | Car rental business |
| Gasoline cost | 2111010 | Petroleum products |
| Parking lot, toll road charge (except for highway charge) | 5789010 | Road transport facility provided |
| Highway charge | 5789010 | Road transport facility provided |
| Accommodation | ||
| Accommodation services | 6711010 | Accommodation services |
| Vacation home ownership (imputed) | 5531010 | Vacation home ownership (imputed) |
| Food and beverage | ||
| Food and beverage serving services | 6721010 | Food- and beverage serving services |
| Souvenirs | ||
| Agricultural products | 116090 | Other non-food crops |
| Agricultural processed products | 1116020 | Agro-preserved food products (except bottles and cans) |
| Marine products | 172001 | Inland fishery and aquaculture |
| Fisheries processed products | 1113090 | Other seafood |
| Confectionery | 1115-030 | Confectionery |
| Other food items | 1119090 | Other food items |
| Fiber products | 1519090 | Other textile industrial products |
| Shoes, bags | 2229-010 | Rubber and plastic footwear |
| Ceramics and glass products | 2312020 | Bags, bags and other leather products |
| Publication | 5951030 | Publication |
| Wood products and paper products | 1649090 | Other pulp, paper and paper products |
| Medical supplies and Cosmetics | 2081020 | Cosmetics, toothpaste |
| Film | 2083010 | Photosensitive material |
| Electrical equipment and related products | 3321020 | Consumer electrical appliances (except air conditioners) |
| Camera, glasses, watch | 3919090 | Other manufactured industrial products |
| Sports equipment · CD · stationery | 3919090 | Other manufactured industrial products |
| Other manufactured products | 3919090 | Other manufactured industrial products |
| Activities | ||
| A day spa·warm-bathing facility·beauty salon | 6731040 | Bathing |
| Museums, museums, zoos and gardens, aquariums | 6312010 | Social education (public) |
| Watching sports and Art appreciation | 6741020 | Office space (except movie theaters) and entertainment companies |
| Amusement parks and expositions | 6741020 | Office space (except movie theaters) and entertainment companies |
| Sports Facilities | 6741040 | Sports facility offer work, park, amusement park |
| Ski lift fee | 5711010 | Railway passenger transport |
| Camp site | 6741040 | Sports facility offer work, park, amusement park |
| Exhibition and convention participation fee | 6699090 | Other business services |
| Tourist farm | 131020 | Agricultural services (except for veterinary services) |
| Fishing boat | 6741090 | Other entertainment |
| Guide fee | 6799090 | Other personal services |
| Rental charge | 6611010 | Goods rental business (excluding rental cars) |
| Massage | 6411050 | Medical (other medical services) |
| Photo shoot fee | 6799010 | Photography |
| Mail and communication charges | 5791010 | Postal and letter mail |
| Home delivery | 5722010 | Road freight transportation (except for self-transportation) |
| Travel insurance · Credit card admission fee | 5312010 | Life insurance |
| Passport application fee | 6112010 | Government (local) |
| Visa application fee | 6112010 | Government (local) |
| Hairdresser/Barber | 6731030 | Beauty industry |
| Develop and print photos | 6799090 | Other personal services |
| Laundry service | 6731010 | laundry service |
| Other | 6799090 | Other personal services |
Table A4.
CFP calculation result of I/O items of each product service in this study (Unit: kg-CO2eq).
Table A4.
CFP calculation result of I/O items of each product service in this study (Unit: kg-CO2eq).
| I/O Items | Inbound | Domestic | Outbound | Total | ||
|---|---|---|---|---|---|---|
| Overnight Stay | Day Trip | TRANSIT | ||||
| Transport | 4.37E+09 | 3.84E+10 | 1.63E+10 | 8.02E+09 | 9.21E+09 | 7.64E+10 |
| Air transportation | 3.48E+09 | 1.25E+10 | 1.44E+09 | 7.64E+09 | 8.47E+09 | 3.36E+10 |
| Petroleum products | 0.00E+00 | 5.07E+09 | 3.20E+09 | 5.10E+07 | 0.00E+00 | 8.33E+09 |
| Railway passenger transport | 4.80E+08 | 3.16E+09 | 1.42E+09 | 7.27E+07 | 1.19E+08 | 5.25E+09 |
| Bus | 0.00E+00 | 1.03E+09 | 7.42E+08 | 5.45E+07 | 4.91E+08 | 2.32E+09 |
| Marine and inland water transportation | 7.47E+07 | 1.20E+09 | 1.27E+08 | 4.75E+06 | 1.32E+08 | 1.53E+09 |
| Road transport facility provided | 0.00E+00 | 7.13E+08 | 3.99E+08 | 1.86E+07 | 0.00E+00 | 1.13E+09 |
| Taxi | 2.99E+08 | 5.55E+08 | 1.64E+08 | 2.55E+07 | 0.00E+00 | 1.04E+09 |
| Car rental business | 3.38E+07 | 2.02E+08 | 3.56E+07 | 0.00E+00 | 0.00E+00 | 2.71E+08 |
| Ocean transportation | 1.98E+06 | 0.00E+00 | 0.00E+00 | 1.00E+07 | 0.00E+00 | 1.20E+07 |
| Petroleum products (direct emissions) | 0.00E+00 | 1.40E+10 | 8.80E+09 | 1.45E+08 | 0.00E+00 | 2.29E+10 |
| Souvenirs | 5.39E+09 | 1.62E+10 | 7.00E+09 | 1.09E+09 | 1.71E+09 | 3.14E+10 |
| Other textile industrial products | 2.29E+08 | 4.29E+09 | 1.53E+09 | 4.17E+08 | 7.17E+08 | 7.18E+09 |
| Other food items | 9.01E+08 | 3.83E+09 | 1.84E+09 | 1.18E+08 | 0.00E+00 | 6.69E+09 |
| Confectionery | 5.03E+08 | 3.75E+09 | 1.53E+09 | 1.22E+08 | 5.50E+08 | 6.46E+09 |
| Cosmetics, toothpaste | 2.02E+09 | 3.30E+08 | 7.25E+07 | 6.88E+07 | 1.07E+08 | 2.60E+09 |
| Rubber and plastic footwear | 7.83E+08 | 8.68E+08 | 3.38E+08 | 1.70E+08 | 3.07E+08 | 2.47E+09 |
| Other manufactured industrial products | 4.97E+08 | 9.97E+08 | 5.92E+08 | 8.81E+07 | 0.00E+00 | 2.17E+09 |
| Consumer electrical appliances (except air conditioners) | 3.87E+08 | 2.56E+08 | 8.84E+07 | 7.48E+07 | 2.76E+07 | 8.34E+08 |
| Inland fishery and aquaculture | 0.00E+00 | 5.64E+08 | 2.55E+08 | 0.00E+00 | 0.00E+00 | 8.19E+08 |
| Other seafood | 0.00E+00 | 5.27E+08 | 2.42E+08 | 0.00E+00 | 0.00E+00 | 7.69E+08 |
| Other non-food crops | 0.00E+00 | 2.04E+08 | 1.72E+08 | 0.00E+00 | 0.00E+00 | 3.76E+08 |
| Publication | 6.33E+07 | 1.72E+08 | 8.16E+07 | 2.97E+07 | 0.00E+00 | 3.46E+08 |
| Agro-preserved food products (except bottles and cans) | 0.00E+00 | 2.03E+08 | 1.19E+08 | 0.00E+00 | 0.00E+00 | 3.22E+08 |
| Other pulp, paper and paper products | 0.00E+00 | 1.31E+08 | 1.03E+08 | 0.00E+00 | 0.00E+00 | 2.33E+08 |
| Bags, bags and other leather products | 0.00E+00 | 9.59E+07 | 2.73E+07 | 0.00E+00 | 0.00E+00 | 1.23E+08 |
| Photosensitive material | 0.00E+00 | 3.12E+07 | 7.51E+06 | 4.90E+06 | 0.00E+00 | 4.36E+07 |
| Accommodation | 2.51E+09 | 8.73E+09 | 0.00E+00 | 4.13E+07 | 2.06E+09 | 1.33E+10 |
| Accommodation services | 2.51E+09 | 8.62E+09 | 0.00E+00 | 4.13E+07 | 2.06E+09 | 1.32E+10 |
| Vacation home ownership (imputed) | 0.00E+00 | 1.07E+08 | 0.00E+00 | 0.00E+00 | 0.00E+00 | 1.07E+08 |
| Food and Beverage | 1.98E+09 | 5.37E+09 | 1.67E+09 | 6.61E+07 | 1.03E+09 | 1.01E+10 |
| Food- and beverage serving services | 1.98E+09 | 5.37E+09 | 1.67E+09 | 6.61E+07 | 1.03E+09 | 1.01E+10 |
| Cultural, Recreation, Entertainment, etc. | 1.43E+08 | 2.56E+09 | 9.74E+08 | 1.86E+08 | 2.63E+08 | 4.13E+09 |
| Road freight transportation (except for self-transportation) | 0.00E+00 | 1.11E+09 | 1.33E+08 | 8.70E+07 | 1.27E+08 | 1.46E+09 |
| Office space (except movie theaters) and entertainment companies | 5.67E+07 | 3.17E+08 | 2.47E+08 | 0.00E+00 | 1.00E+08 | 7.21E+08 |
| Bathing | 0.00E+00 | 3.14E+08 | 1.48E+08 | 0.00E+00 | 0.00E+00 | 4.62E+08 |
| Social education (public) | 6.06E+07 | 2.40E+08 | 1.08E+08 | 0.00E+00 | 0.00E+00 | 4.09E+08 |
| Beauty industry | 0.00E+00 | 1.47E+08 | 6.05E+07 | 1.04E+07 | 0.00E+00 | 2.18E+08 |
| Other personal services | 1.83E+07 | 9.18E+07 | 5.69E+07 | 1.77E+07 | 2.71E+07 | 2.12E+08 |
| Sports facility offer work, park, amusement park | 0.00E+00 | 7.05E+07 | 1.07E+08 | 0.00E+00 | 0.00E+00 | 1.78E+08 |
| laundry service | 0.00E+00 | 6.52E+07 | 2.34E+07 | 4.41E+06 | 0.00E+00 | 9.30E+07 |
| Goods rental business (excluding rental cars) | 7.67E+06 | 4.95E+07 | 9.01E+06 | 9.83E+06 | 0.00E+00 | 7.60E+07 |
| Agricultural services (except for veterinary services) | 0.00E+00 | 3.37E+07 | 3.84E+07 | 0.00E+00 | 0.00E+00 | 7.21E+07 |
| Other entertainment | 0.00E+00 | 2.84E+07 | 1.97E+07 | 0.00E+00 | 0.00E+00 | 4.81E+07 |
| Life insurance | 0.00E+00 | 1.81E+07 | 1.79E+06 | 2.14E+07 | 0.00E+00 | 4.13E+07 |
| Government (local) | 0.00E+00 | 0.00E+00 | 0.00E+00 | 3.37E+07 | 5.33E+06 | 3.91E+07 |
| Medical (other medical services) | 0.00E+00 | 3.39E+07 | 2.91E+06 | 0.00E+00 | 0.00E+00 | 3.68E+07 |
| Postal and letter mail | 0.00E+00 | 1.60E+07 | 3.65E+06 | 1.78E+06 | 3.49E+06 | 2.49E+07 |
| Other business services | 0.00E+00 | 9.82E+06 | 9.72E+06 | 0.00E+00 | 0.00E+00 | 1.95E+07 |
| Photography | 0.00E+00 | 1.13E+07 | 4.90E+06 | 0.00E+00 | 0.00E+00 | 1.62E+07 |
| Travel agencies, tour operators and guide | 1.54E+07 | 1.54E+08 | 2.29E+07 | 1.09E+08 | 1.88E+07 | 3.21E+08 |
| Travel and other transportation incidental services | 1.54E+07 | 1.54E+08 | 2.29E+07 | 1.09E+08 | 1.88E+07 | 3.21E+08 |
| Total | 1.44E+10 | 7.15E+10 | 2.60E+10 | 9.52E+09 | 1.43E+10 | 1.36E+11 |
Figure A1.
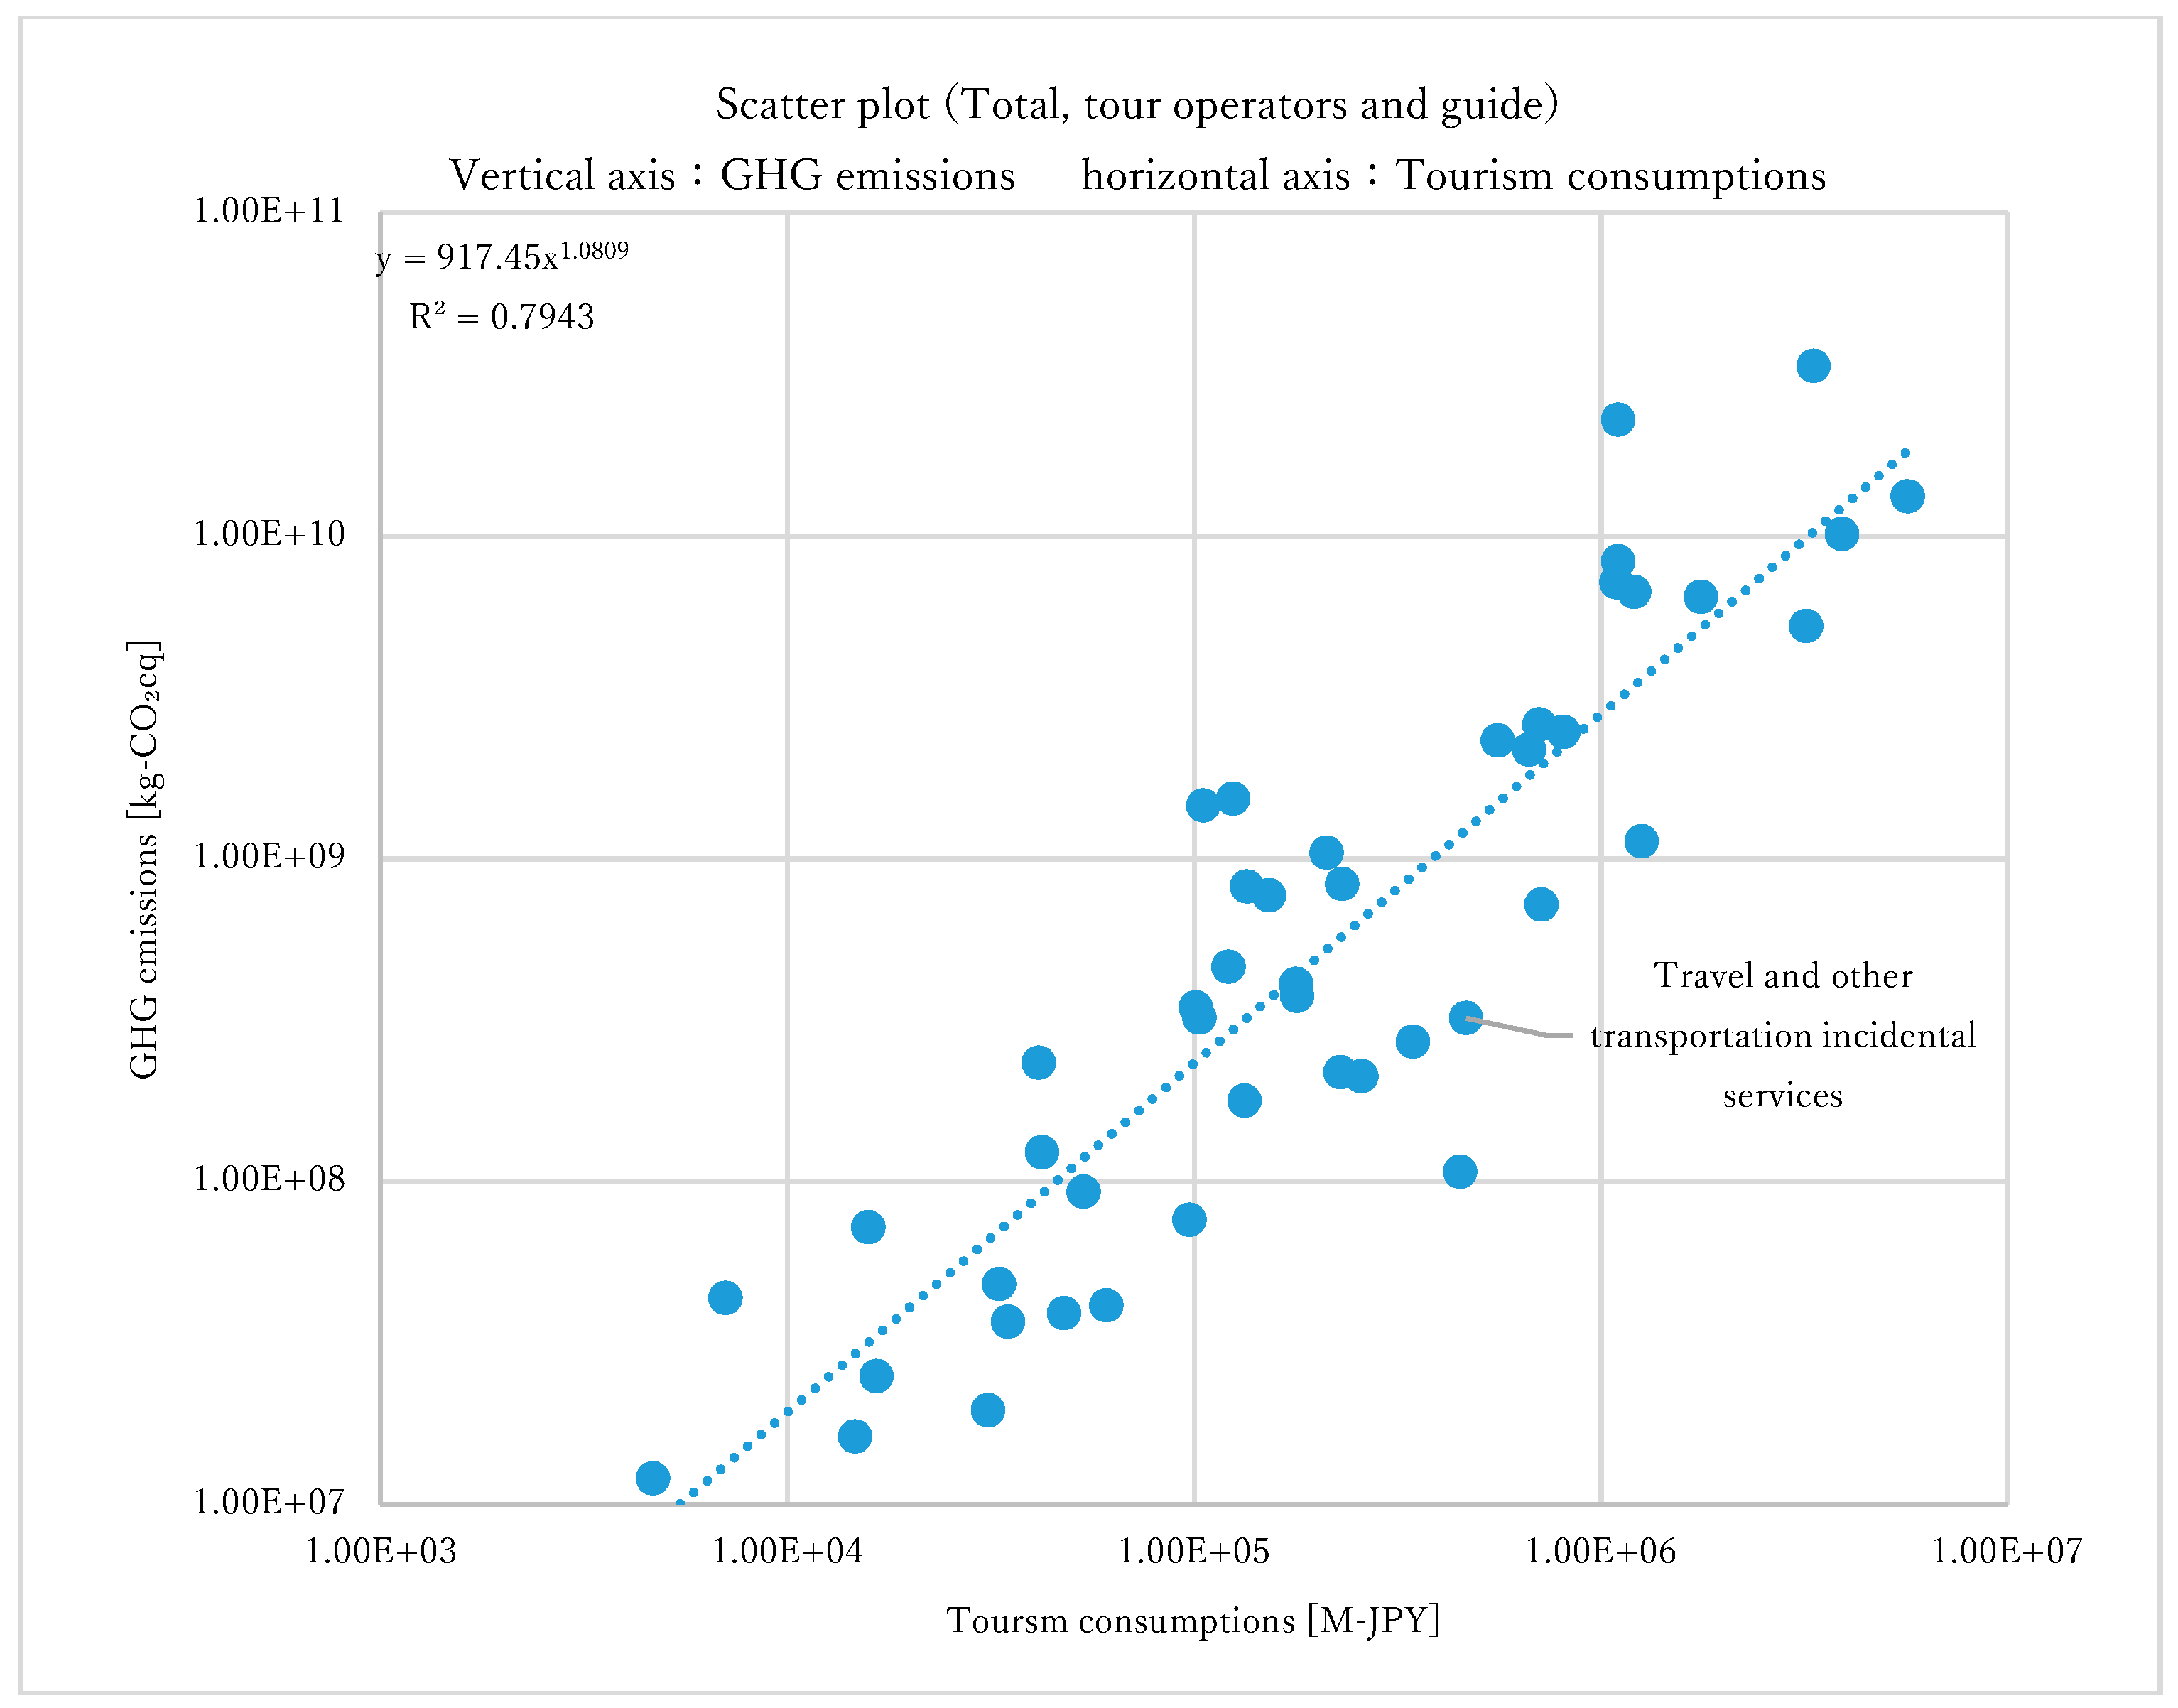
Scatter plot by product category (details of Figure 7 Scatter plot of the total GHG emissions and tourism consumption). The text in the figure indicates only the Tour operator and guide items.
Figure A1.
Scatter plot by product category (details of Figure 7 Scatter plot of the total GHG emissions and tourism consumption). The text in the figure indicates only the Tour operator and guide items.

Figure A2.
Scatter plot by product category (details of Figure 7 Scatter plot of the total GHG emissions and tourism consumption). The text in the figure indicates only the Transport items.
Figure A2.
Scatter plot by product category (details of Figure 7 Scatter plot of the total GHG emissions and tourism consumption). The text in the figure indicates only the Transport items.

Figure A3.
Scatter plot by product category (details of Figure 7 Scatter plot of the total GHG emissions and tourism consumption). The text in the figure indicates only the Accommodation items.
Figure A3.
Scatter plot by product category (details of Figure 7 Scatter plot of the total GHG emissions and tourism consumption). The text in the figure indicates only the Accommodation items.

Figure A4.
Scatter plot by product category (details of Figure 7 Scatter plot of the total GHG emissions and tourism consumption). The text in the figure indicates only the Food and Beverage items.
Figure A4.
Scatter plot by product category (details of Figure 7 Scatter plot of the total GHG emissions and tourism consumption). The text in the figure indicates only the Food and Beverage items.

Figure A5.
Scatter plot by product category (details of Figure 7 Scatter plot of the total GHG emissions and tourism consumption). The text in the figure indicates only the Souvenir items.
Figure A5.
Scatter plot by product category (details of Figure 7 Scatter plot of the total GHG emissions and tourism consumption). The text in the figure indicates only the Souvenir items.

Figure A6.
Scatter plot by product category (details of Figure 7 Scatter plot of the total GHG emissions and tourism consumption). The text in the figure indicates only the Activities items.
Figure A6.
Scatter plot by product category (details of Figure 7 Scatter plot of the total GHG emissions and tourism consumption). The text in the figure indicates only the Activities items.

References
- Japan Tourism Agency (JTA). Promotion of Attracting and Holding MICE. Available online: http://www.mlit.go.jp/kankocho/shisaku/kokusai/mice.html (accessed on 13 August 2019).
- United Nations World Tourism Organization (UNWTO). Definition. Available online: https://unwto-ap.org/why/tourism-definition/ (accessed on 13 August 2019).
- 2017 International Year of Sustainable Tourism for Development. Available online: http://www.tourism4development2017.org/about/ (accessed on 14 August 2019).
- United Nations World Tourism Organization (UNWTO). Sustainable Tourism for Development Guidebook–Enhancing capacities for Sustainable Tourism for Development in Developing Countries; UNWTO: Madrid, Spain, 2013. [Google Scholar]
- Ministry of Land, Infrastructure, Transport and Tourism (Japan). Survey on Tourism and Environment. 2008. Available online: https://www.mlit.go.jp/common/000059329.pdf (accessed on 14 August 2019).
- Japan Tourism Agency. The Japan Tourism White Paper (2017). (Announcement 12 June 2019). Available online: http://www.mlit.go.jp/common/001237338.pdf (accessed on 14 August 2019).
- Martín Martín, J.M.; Guaita Martínez, J.M.; Salinas Fernández, J.A. An analysis of the factors behind the citizen’s attitude of rejection towards tourism in a context of overtourism and economic dependence on this activity. Sustainability 2018, 10, 2851. [Google Scholar] [CrossRef] [Green Version]
- Martin, J.M.M.; Martinez, J.M.G. Entrepreneurs’ attitudes toward seasonality in the tourism sector. Int. J. Entrep. Behav. Res. 2019. [Google Scholar] [CrossRef]
- Martínez, J.M.G.; Martín, J.M.M.; Fernández, J.A.S.; Mogorrón-Guerrero, H. An analysis of the stability of rural tourism as a desired condition for sustainable tourism. J. Bus. Res. 2019, 100, 165–174. [Google Scholar] [CrossRef]
- Martinez, J.M.G.; Martín, J.M.M.; Fernández, J.A.S. Innovation in the Measurement of Tourism Competitiveness. In Analyzing the Relationship Between Innovation, Value Creation, and Entrepreneurship; IGI Global: Valencia, Spain, 2020; pp. 268–288. [Google Scholar]
- Filimonau, V. Life Cycle Assessment (LCA) and Life Cycle Analysis in Tourism; Springer International Publishing: Cham, Switzerland, 2016. [Google Scholar]
- Lenzen, M.; Sun, Y.; Faturay, F.; Ting, Y.; Geschke, A.; Malik, A. The carbon footprint of global tourism. Nat. Climate Chang. 2018, 8, 522–528. [Google Scholar] [CrossRef]
- New Tourism Study Group of The Institute of Life Cycle Assessment, Japan. Available online: https://www.ilcaj.org/lcahp/kenkyukai-2.php (accessed on 14 August 2019).
- Ito, Y.; Morimoto, R.; Shibahara, N.; Kato, H. CO2 Emission Factor of Transport Systems for Carbon Footprint in Tourism. In Proceedings of the 6th Meeting of the Institute of Life Cycle Assessment, Sendai, Japan, 2 March 2011; pp. 32–33. [Google Scholar]
- Tamari, Y.; Morimoto, R.; Inaba, A. The Estimation Method of CO2 Emission for Hotel Accommodation in the Tourism. In Proceedings of the 6th Meeting of the Institute of Life Cycle Assessment, Sendai, Japan, 2 March 2011; pp. 36–37. [Google Scholar]
- Kazama, R.; Morimoto, R.; Inaba, A. The Estimation Method of CO2 Emission for Meal in the Tourism. In Proceedings of the 6th Meeting of the Institute of Life Cycle Assessment, Sendai, Japan, 2 March 2011; pp. 38–39. [Google Scholar]
- Japan Environmental Management Association for Industry. Certified Carbon Footprint Communication Program CFP-PCR:PA-DO-01; Japan Environmental Management Association for Industry: Tokyo, Japan, 2014. [Google Scholar]
- Japan Environment Association Eco Mark Office. Product Certification Standards “Service”: Hotel/Ryokan (Ver.2.0); Japan Environment Association Eco Mark Office: Tokyo, Japan, 2019. [Google Scholar]
- Japan Environment Association Eco Mark Office. Product Certification Standards “Service”: Restaurant (Ver.1.0); Japan Environment Association Eco Mark Office: Tokyo, Japan, 2017. [Google Scholar]
- Shimizu, T.; In, S. Estimation of CO2 Emission Volume by Japanese and Korean Tourism Industries. Int. J. Tour. Sci. 2015, 8, 71–79. [Google Scholar]
- International Standard, ISO 14044: 2006(E). Environmental Management—Life Cycle Assessment–Requirements and Guidelines, 1st ed.; ISO: Geneva, Switzerland, 2006. [Google Scholar]
- Leontief, W.W. Input–Output Economics, 2nd ed.; Oxford University Press: New York, NY, USA, 1986. [Google Scholar]
- Hondo, H. Application of input–output table in LCA. J. Econ. Struct. 2008, 16, 5–15. [Google Scholar]
- Japan Tourism Agency (JTA). Research study on economic impacts of tourism in Japan (2017 Edition). 2019. Available online: http://www.mlit.go.jp/kankocho/siryou/toukei/shouhidoukou.html#cp3 (accessed on 14 August 2019).
- Kondo, Y. Estimation of 2011 Waste Input–output Table for Japan. J. Life Cycle Assess. Jpn. 2019, 15, 33–41. [Google Scholar] [CrossRef]
- Japan Tourism Agency (JTA). Survey of Consumption Trends for Foreign Visitors to Japan (Part 3) (2017 Edition). 2018. Available online: http://www.mlit.go.jp/kankocho/siryou/toukei/syouhityousa.html (accessed on 14 August 2019).
- Ministry of the Environment Government of Japan. Calculation Results of Greenhouse Gas Emissions 2016. Available online: https://www.env.go.jp/earth/ondanka/ghg-mrv/emissions/results-h28.html (accessed on 14 August 2019).
- Japan Tourism Agency (JTA). Press/interview (Announcement 30 March 2016). Available online: https://www.mlit.go.jp/kankocho/news08_000281.html (accessed on 14 August 2019).
- Castellani, V.; Sala, S. Ecological Footprint and Life Cycle Assessment in the sustainability assessment of tourism activities. Ecol. Indic. 2012, 16, 135–147. [Google Scholar] [CrossRef]
- Filimonau, V.; Dickinson, J.; Robbins, D.; Reddy, M.V. A critical review of methods for tourism climate change appraisal: Life cycle assessment as a new approach. J. Sustain. Tour. 2011, 19, 301–324. [Google Scholar] [CrossRef]
- Filimonau, V.; Dickinson, J.; Robbins, D. The carbon impact of short-haul tourism: A case study of UK travel to Southern France using life cycle analysis. J. Clean. Prod. 2014, 64, 628–638. [Google Scholar] [CrossRef] [Green Version]
- El Hanandeh, A. Quantifying the carbon footprint of religious tourism: The case of Hajj. J. Clean. Prod. 2013, 52, 53–60. [Google Scholar] [CrossRef]
- Pereira, R.P.T.; Glaydston, M.B.; Filimonau, V. The carbon implications of local visitor travel in Brazil: A case of the Rio de Janeiro and São Paolo itinerary. J. Clean. Prod. 2017, 141, 256–266. [Google Scholar] [CrossRef] [Green Version]
- Filimonau, V.; Dickinson, J.; Robbins, D.; Reddy, M.V. The role of ‘indirect’ greenhouse gas emissions in tourism: Assessing the hidden carbon impacts from a holiday package tour. Transp. Res. Part A 2013, 54, 78–91. [Google Scholar] [CrossRef]
- Kuo, N.W.; Hsiao, T.Y.; Lan, C.F. Tourism management and industrial ecology: A case study of food service in Taiwan. Tour. Manag. 2005, 26, 503–508. [Google Scholar] [CrossRef]
- Michailidou, A.V.; Vlachokostas, C.; Maleka, D.; Feleke, E.; Moussiopoulos, N. Life cycle impact approach to promote sustainable tourism: A case study from Greek hotels. In Proceedings of the 14th International Conference on Environmental Science and Technology, Rhodes, Greece, 3–5 September 2015. [Google Scholar]
- König, H.; Schmidberger, E.; de Cristofaro, L. Life cycle assessment of a tourism resort with renewable materials and traditional techniques. Presented at the ‘Portugal SB07, Sustainable Construction, Materials and Practice—Challenge of the Industry for the New Millennium’ Conference, Lisbon, Portugal, 12–14 September 2007. [Google Scholar]
- Sára, B.; Raggi, A.; Petti, L.; Scimìa, E. Implementation of LCA to services: Case studies in the hospitality industry. In Proceedings of the 6th International Conference on EcoBalance, Tsukuba, Japan, 25–27 October 2004. [Google Scholar]
- De Camillis, C.; Petti, L.; Raggi, A. LCA: A key-tool for Sustainable Tourism? In Proceedings of the 8th International Conference on EcoBalance, Tokyo, Japan, 10–12 December 2008. [Google Scholar]
- Cerutti, A.K.; Beccaro, G.L.; Bruun, S.; Donno, D.; Bonvegna, L.; Bounous, G. Assessment methods for sustainable tourism declarations: The case of holiday farms. J. Clean. Prod. 2016, 111, 511–519. [Google Scholar] [CrossRef]
- Filimonau, V.; Dickinson, J.E.; Robbins, D.; Huijbregts, M.A.J. Reviewing the carbon footprint analysis of hotels: Life Cycle Energy Analysis (LCEA) as a holistic method for carbon impact appraisal of tourist accommodation. J. Clean. Prod. 2011, 19, 1917–1930. [Google Scholar] [CrossRef]
- Rosselló-Batle, B.; Moiá, A.; Cladera, A.; Martínez, V. Energy use, CO2 emissions and waste throughout the life cycle of a sample of hotels in the Balearic Islands’. Energy Build. 2010, 42, 547–558. [Google Scholar] [CrossRef]
- Li, P.; Huang, J.H.; Mo, Y.F.; Yang, G.H. Carbon footprint calculation and analysis of accommodation services in four-star hotels of Kunming. Tour. Trib. 2010, 25, 27–34. [Google Scholar]
- Scheepens, A.E.; Vogtländer, J.G.; Brezet, J.C. Two life cycle assessment (LCA) based methods to analyse and design complex (regional) circular economy systems. Case: Making water tourism more sustainable. J. Clean. Prod. 2016, 114, 257–268. [Google Scholar] [CrossRef]
- Berners-Lee, M.; Howard, D.C.; Moss, J.; Kaivanto, K.; Scott, W.A. Greenhouse gas footprinting for small businesses—The use of input–output data. Sci. Total Environ. 2011, 409, 883–891. [Google Scholar] [CrossRef]
- Patterson, M.G.; McDonald, G. How Clean and Green is New Zealand Tourism? Lifecycle and Future Environmental Impacts; Manaaki Whenua Press: Lincoln, New Zealand, 2004. [Google Scholar]
- Cadarso, M.-Á.; Gómez, N.; López, L.-A.; Tobarra, M.-Á.; Zafrilla, J.-E. Quantifying Spanish tourism’s carbon footprint: The contributions of residents and visitors: A longitudinal study. J. Sustain. Tour. 2015, 23, 922–946. [Google Scholar] [CrossRef]
- Zhong, Y.; Shi, S.; Li, S.; Luo, F. Empirical research on construction of a measurement framework for tourism carbon emission in China. Chin. J. Popul. Resour. Environ. 2015, 13, 240–249. [Google Scholar] [CrossRef]
- Qin, Y.; Li, X.; Rong, P. Urban tourism carbon accounting based on improved EIO-LCA model: A case study of Kaifeng City in Henan Province. Prog. Geogr. 2015, 34, 132–140. [Google Scholar]
- Rosenblum, J.; Horvath, A.; Hendrickson, C. Environmental implications of service industries. Environ. Sci. Technol. 2000, 34, 4669–4676. [Google Scholar] [CrossRef] [Green Version]
Figure 1.
Breakdown of the carbon footprint (CFP) by each life cycle stage. The above figure shows the greenhouse gas (GHG) emissions and shows the contribution of the impact in each life stage. Table A4 shows the CFP calculation results for the items of each product service.
Figure 1.
Breakdown of the carbon footprint (CFP) by each life cycle stage. The above figure shows the greenhouse gas (GHG) emissions and shows the contribution of the impact in each life stage. Table A4 shows the CFP calculation results for the items of each product service.

Figure 2.
Comparison of traveler’s consumption and the GHG emissions of inbound tourism.

Figure 3.
Comparison of traveler’s consumption and the GHG emissions of domestic tourism (overnight stay).
Figure 3.
Comparison of traveler’s consumption and the GHG emissions of domestic tourism (overnight stay).

Figure 4.
Comparison of traveler’s consumption and the GHG emissions of domestic tourism (day trip).
Figure 4.
Comparison of traveler’s consumption and the GHG emissions of domestic tourism (day trip).

Figure 5.
Comparison of traveler’s consumption and the GHG emissions of domestic tourism (for Transit).
Figure 5.
Comparison of traveler’s consumption and the GHG emissions of domestic tourism (for Transit).

Figure 6.
Comparison of traveler’s consumption and the GHG emissions of the outbound tourism stage.

Figure 7.
Scatter plot of the total GHG emissions and tourism consumption. Appendix A Figure A1, Figure A2, Figure A3, Figure A4, Figure A5 and Figure A6 shows plots of details for each product and service (e.g., tour operators and guides, transport, accommodation, food and beverage, souvenirs, activities).

Table 1.
Scope of the evaluation data. The items evaluated in this study are displayed as “○”, and “N” means NOT appliciatable.“P” in the table is an abbreviation of preparation for travel, “W” means while traveling, and “A” means after travel.
Table 1.
Scope of the evaluation data. The items evaluated in this study are displayed as “○”, and “N” means NOT appliciatable.“P” in the table is an abbreviation of preparation for travel, “W” means while traveling, and “A” means after travel.
| Inbound Tourism | Domestic Tourism | Domestic Tourism | Domestic Tourism | Outbound Tourism | ||||||||||||
|---|---|---|---|---|---|---|---|---|---|---|---|---|---|---|---|---|
| Overnight Stay | Day Trip | Transit | ||||||||||||||
| Life cycle stage | P | W | A | P | W | A | P | W | A | P | W | A | P | W | A 3 | |
| Products and services | Travel agencies, tour operators and guide | N | ◯ | N | N | ◯ | N | N | ◯ | N | N | ◯ | N | N | ◯ | N |
| Transport | N | ◯ | N | N | ◯ | N | N | ◯ | N | N | ◯ | N | N | ◯ | N | |
| Accommodation | N | ◯ | N | N | ◯ | N | N | N 2 | N | N | ◯ | N | N | ◯ | N | |
| Food and beverage | N | ◯ | N | ◯ | ◯ | N | ◯ | ◯ | N | ◯ | ◯ | N | ◯ | ◯ | N | |
| Souvenirs | N | ◯ | N | ◯ | ◯ | N | ◯ | ◯ | N | ◯ | ◯ | N | ◯ | ◯ | N | |
| Activities (including others 1) | N | ◯ | N | ◯ | ◯ | ◯ | ◯ | ◯ | ◯ | ◯ | ◯ | ◯ | ◯ | ◯ | N | |
1 This includes not only Cultural services, Recreation, and other entertainment services, but also other services. 2 Day trips are not included for non-staying trips. 3 After is included in “for transit” of domestic tourism, “N” is set in this table.
Table 2.
The amount of consumption for items subject to evaluation. The input–output table (I/O) classification codes corresponding to each Tourism Satellite Accounts (TSA) inventory item were applied. See Appendix A, Table A2 and Table A3 for details.
Table 2.
The amount of consumption for items subject to evaluation. The input–output table (I/O) classification codes corresponding to each Tourism Satellite Accounts (TSA) inventory item were applied. See Appendix A, Table A2 and Table A3 for details.
| Category of Products and Services | Inbound Tourism | Domestic Tourism | Domestic Tourism | Domestic Tourism | Outbound Tourism | Total (B-JPY) | Rate (%) |
|---|---|---|---|---|---|---|---|
| Overnight Stay | Day Trip | Transit | |||||
| Travel agencies, tour operators, and guides | 22 | 225 | 33 | 159 | 27 | 466 | 1.6% |
| Transport | 748 | 5320 | 2128 | 852 | 1041 | 10,090 | 33.6% |
| Accommodation | 1077 | 4148 | 0 | 18 | 883 | 6125 | 20.4% |
| Food and beverage | 766 | 2077 | 646 | 26 | 400 | 3914 | 13.0% |
| Souvenirs | 1418 | 3587 | 1583 | 250 | 397 | 7234 | 24.1% |
| Activities | 115 | 1151 | 641 | 128 | 150 | 2185 | 7.3% |
| Total (Billion-JPY) | 4146 | 16,508 | 5031 | 1432 | 2897 | 30,015 | 100.0% |
| Rate (%) | 13.8% | 55.0% | 16.8% | 4.8% | 9.7% | 100% | - |
Table 3.
A summary of the top contributors of each travel type, ranking the items in terms of GHG emissions. From the results in Figure 2, Figure 3, Figure 4, Figure 5 and Figure 6., the top five highest contributions in each stage are displayed.
| Inbound Tourism | Domestic Tourism | Domestic Tourism | Domestic Tourism | Outbound Tourism | |
|---|---|---|---|---|---|
| Overnight Stay | Day Trip | Transit | |||
| 1 | Air transport | Petrol (direct emissions) | Petrol (direct emissions) | Air transport | Air transport |
| 2 | Accommodation | Air transport | Petrol | Textile products | Accommodation |
| 3 | Cosmetics | Accommodation | Food items | Footwear | Food and beverage |
| 4 | Food and beverage | Food and beverage | Food and beverage | Petrol (direct emissions) | Textile products |
| 5 | Food items | Petrol | Confectionery | Confectionery | Confectionery |
Table 4.
Comparison between the results of this study and the annual total CO2eq emissions in Japan. This article is based on the Japan Tourism Agency (JTA) statistical data [24] compiled from January to December, and the Ministry of the Environment’s published values [27] are compiled from April to March. A comparison was made for confirming the contribution from the tourism sector.
| Case | GHG emission of Japan (Fixed Report) in FY 2017 | This Case Result (Data of 2017) |
|---|---|---|
| Object | The whole of Japan | Tourism consumption of Japan |
| Amount of emission million t-CO2eq | 1292 | 136 |
| Ratio (%) | 100 | 10.5 |
Table 5.
Comparison between Japan’s gross domestic product (GDP) and the tourism GDP (United Nations World Tourism Organization (UNWTO) standard).
Table 5.
Comparison between Japan’s gross domestic product (GDP) and the tourism GDP (United Nations World Tourism Organization (UNWTO) standard).
| Case | GDP | Japan Tourism Agency (JTA) |
|---|---|---|
| Object | The whole of Japan (2017) | Tourism consumption of Japan (2017) |
| Amount of GDP trillion-JPY | 545.1 | 10.7 |
| Ratio (%) | 100 | 2.0 |
© 2020 by the authors. Licensee MDPI, Basel, Switzerland. This article is an open access article distributed under the terms and conditions of the Creative Commons Attribution (CC BY) license (http://creativecommons.org/licenses/by/4.0/).
Share and Cite
MDPI and ACS Style
Kitamura, Y.; Ichisugi, Y.; Karkour, S.; Itsubo, N. Carbon Footprint Evaluation Based on Tourist Consumption toward Sustainable Tourism in Japan. Sustainability 2020, 12, 2219. https://doi.org/10.3390/su12062219
AMA Style
Kitamura Y, Ichisugi Y, Karkour S, Itsubo N. Carbon Footprint Evaluation Based on Tourist Consumption toward Sustainable Tourism in Japan. Sustainability. 2020; 12(6):2219. https://doi.org/10.3390/su12062219
Chicago/Turabian StyleKitamura, Yusuke, Yuki Ichisugi, Selim Karkour, and Norihiro Itsubo. 2020. "Carbon Footprint Evaluation Based on Tourist Consumption toward Sustainable Tourism in Japan" Sustainability 12, no. 6: 2219. https://doi.org/10.3390/su12062219
Note that from the first issue of 2016, this journal uses article numbers instead of page numbers. See further details here.