1. Introduction
As cities face increasing pressure from densification trends, eco-green coordinated development among cities is a common problem facing global urban agglomerations [
1]. The process of ecological green development in different regions of the world is different, and is divided into five aspects in general: the connotation construction of the ecological civilization system, promoting the formation of green development methods and lifestyles, solving outstanding ecological and environmental problems, strengthening ecological restoration and environmental risk prevention and control and improving the modernization capability of ecological environment governance.
Rapid urbanization and economic development have caused many problems for the environment and society [
2,
3]. Sustainable urbanization is an effective way to promote sustainable urban development [
4,
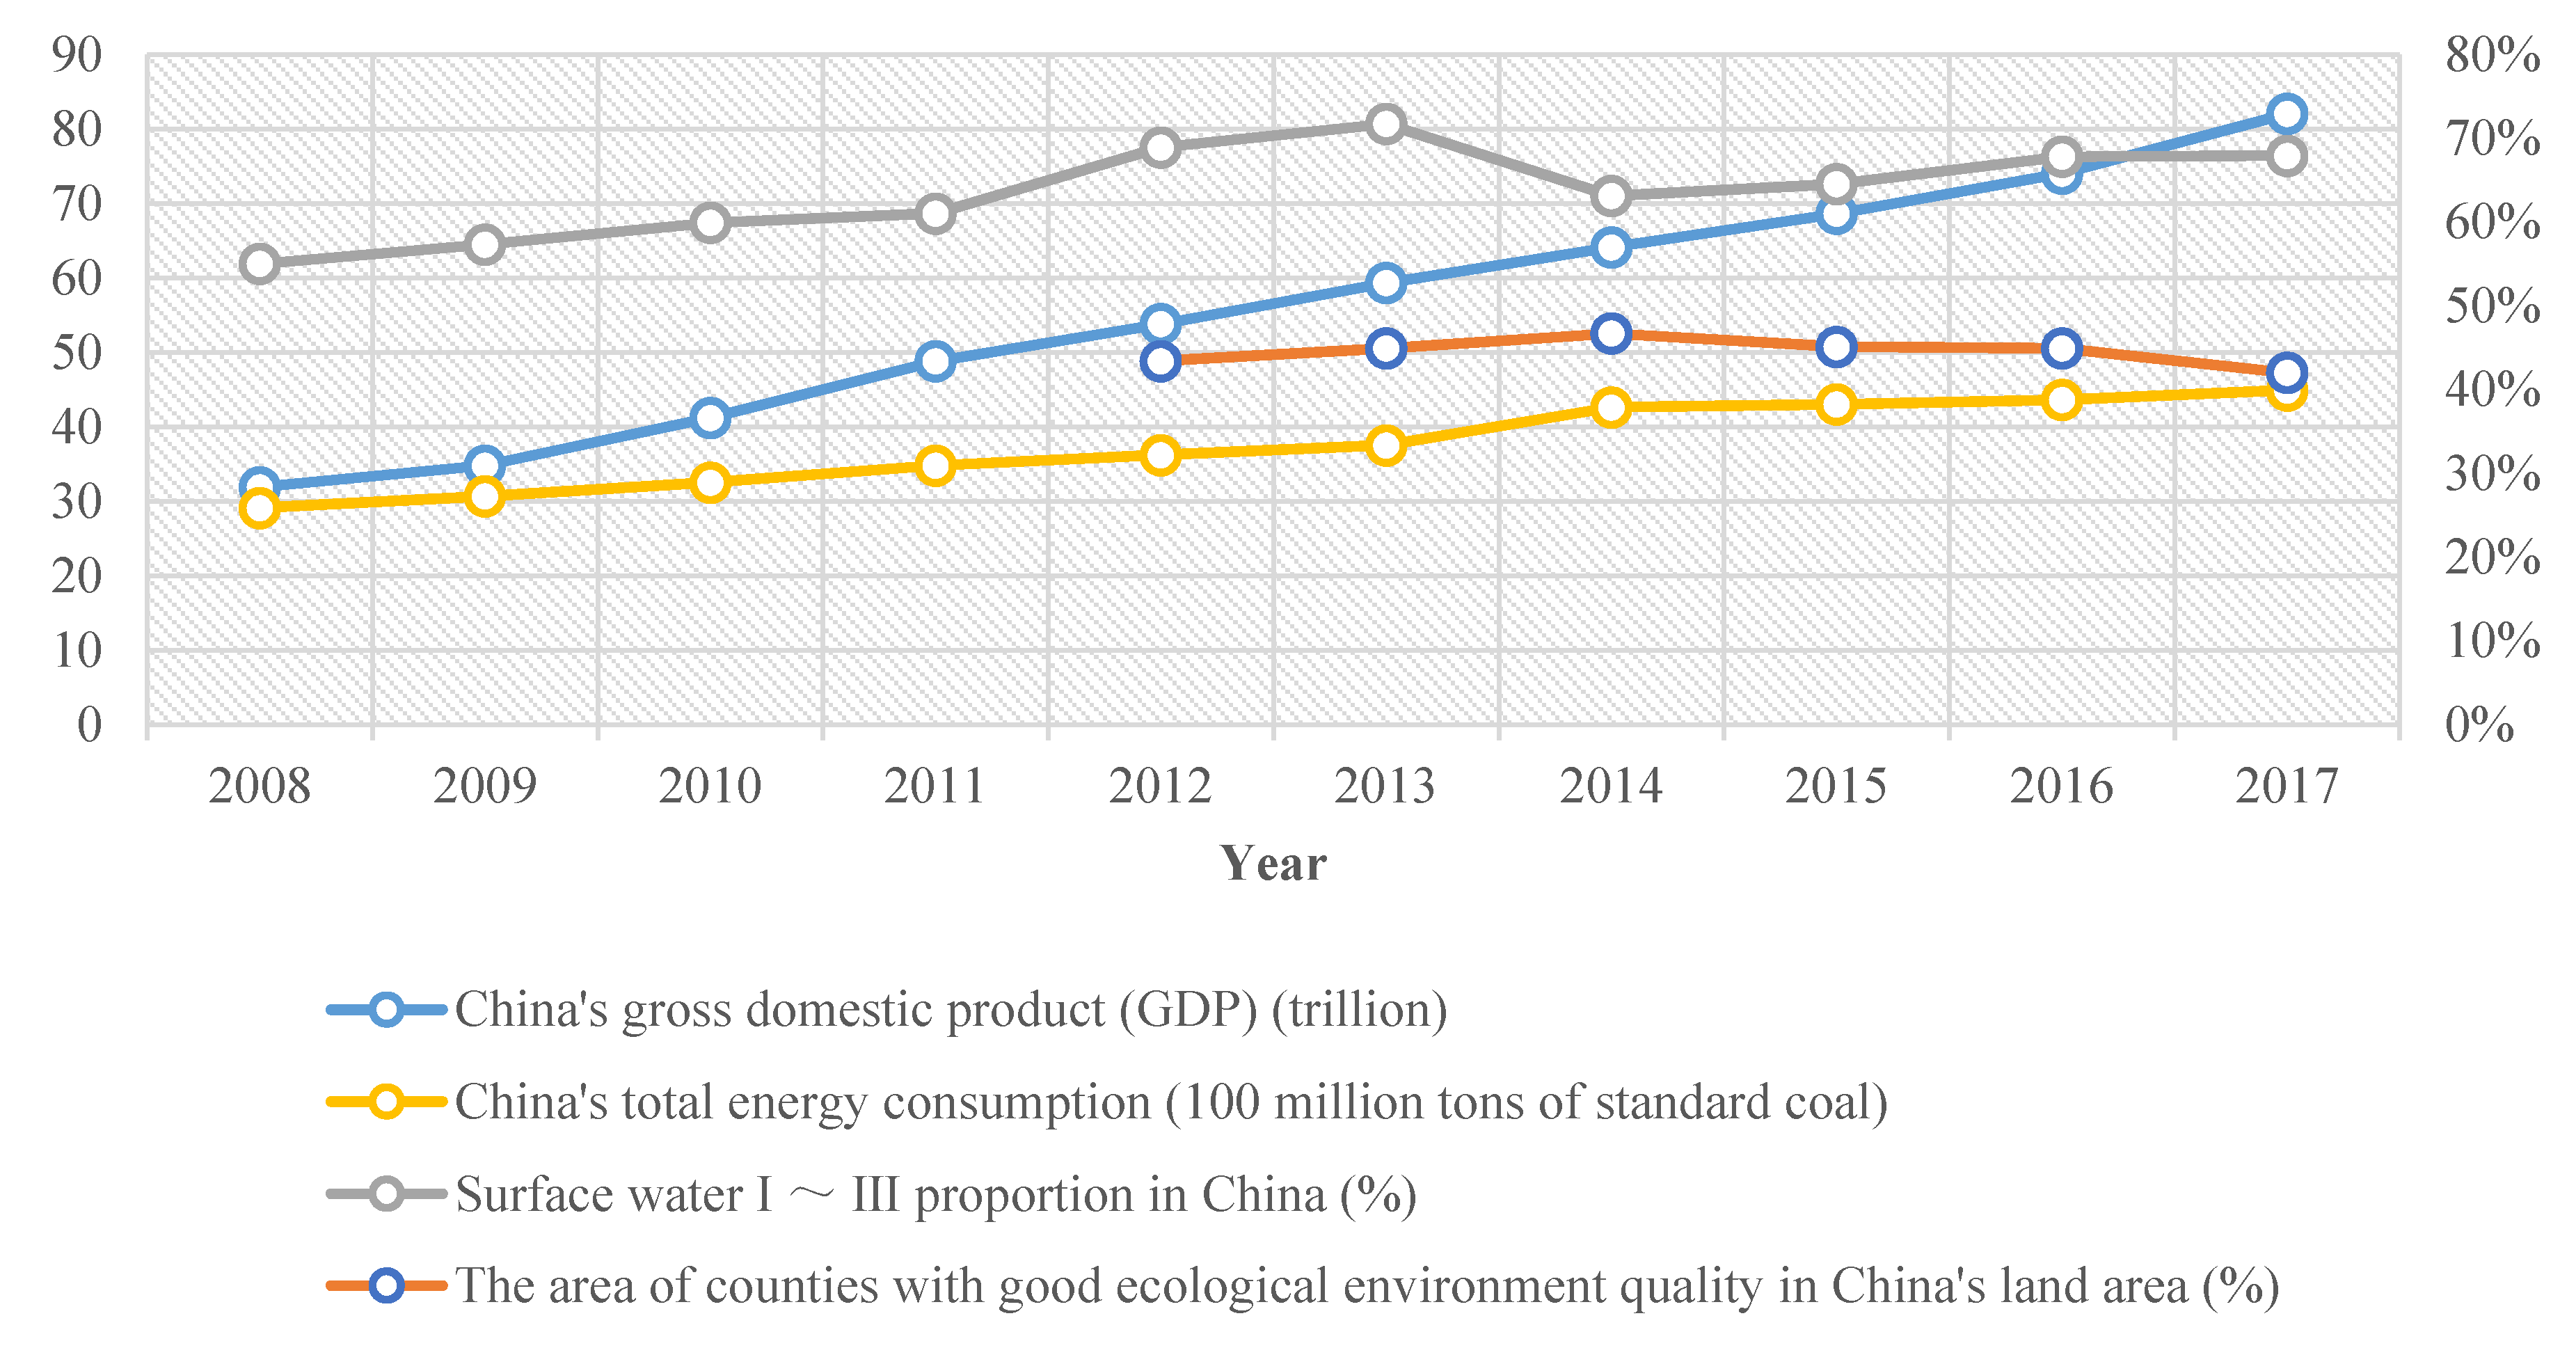
5]. China’s rapid economic growth has also produced severe environmental pollution, such as water [
6,
7,
8] and air pollution [
9,
10], energy shortages [
11,
12] and loss of biodiversity[
13] (see
Figure 1). These environmental problems have seriously affected cities’ sustainable development and even created health risks.
In order to achieve the sustainable development goals and resolve the gap between resources, environment and socio-economic development, China proposed a “green” strategy as early as 2015, which further clarifies the specific path to achieve an ecological civilization, raises the construction of an ecological civilization to the national level and highlights the importance of an ecological civilization [
14]. In order to achieve effective economic growth by using resources within the scope of the resources and environmental carrying capacity (RECC), China’s ecological civilization should focus on the environmental protection of ecosystems [
14], and China’s ecological green development should focus on environmental protection for high-quality economic development. Therefore, the problem of ecological green developments is not only a problem of a province or a city, but it is even more important to promote ecological and environmental cooperation in the region.
Many areas have experimented with various aspects of ecological green development in cities and have gained a lot of experience [
15,
16]. In recent years, a multi-ecological environmental protection prevention and control system has been continuously established, and the regional ecological green collaborative protection of multi-city clusters has been gradually strengthened [
17,
18,
19,
20]. Therefore, it is necessary to scientifically evaluate the current state of green development in various regions and explore the multiple factors and development differences that affect the development of regional ecological green integration, which has important practical significance for ecological environmental protection and high-quality economic development. Many scholars have conducted detailed research on the sustainable development of cities [
21,
22,
23,
24,
25,
26]. The results have shown that the rational use of natural resources and the protection of the environment are essential to the ecological green development of regional cities. We mainly focus on the connotation of ecological green synergy, the evaluation index system and evaluation methods for the coordinated development of regional ecological green programs.
The connotation of ecological green comes from the concept of “sustainable development”. Sustainable development was first proposed at the United Nations Conference in 1972. In 1992, Agenda 21 was approved at the United Nations Conference on Environment and Development held in Rio de Janeiro, and its purpose was to promote sustainable human development. Since then, the concept of sustainable development has been widely used in many studies, especially in urban development research. Urbanization includes spatial expansion [
21,
27], green buildings [
16], urban population growth [
28] and socio-economic activities [
29,
30]. The rapid urban population growth and decentralization have caused many problems, such as social inequality, informal settlements and slums, land scarcity and climate change, each of which has a negative impact on the sustainable development of a city. The 1996 Localization Agenda for the 21st Century identified four aspects of sustainability: social, economic, environmental and institutional. In recent years, the research on the connotation of ecological green integration has mainly focused on sustainable development governance [
22], green development [
25], urban green economy [
31,
32] and ecological environmental protection [
33], and many scholars have explored related concepts and theoretical bases for these contents.
The research on an ecological green evaluation index system includes green development level [
34,
35,
36,
37], green industry level [
36], the spatial–temporal pattern of ecological green development [
38,
39], social welfare [
40] and other dimensions. The factors affecting ecological green development include green growth efficiency, industrial greening level, resource carrying capacity, economic growth, social welfare, green wealth and ecological governance. In terms of the evaluation methods for ecological green development, the research is mainly based on the index method [
41], data envelopment method, spatial measurement method [
21,
27], principal component analysis, cluster analysis method, TOPSIS method [
42], scenario analysis method and function model method.
In the evaluation of complex environments, the evaluation information may involve qualitative and quantitative information, which is called heterogeneous multi-attribute decision making [
43]. Its types mainly include intuitionistic fuzzy numbers, triangular fuzzy numbers, real number interval numbers and linguistic variables. The coordinated development evaluation problem of regional eco-green programs can be formulated as a heterogeneous multi-criteria decision making (HMCDM) problem where the evaluation information can involve qualitative information and quantitative information, and the weights of the interdependent criteria cannot be subjectively obtained [
44]. In general, there are few studies on the construction and calculation of regional coordinated development indicator systems from the perspective of ecological green developments [
45,
46].
However, a large amount of research results focused on a single type of multi-attribute decision-making problem [
47], and there is less research on the importance index of qualitative and quantitative information (heterogeneous information) in decision-making problems [
48]. In addition, due to the complexity of the real environment and the limitations of the models it relies on, the subjective and objective weighting methods of the classic attribute weights have significant limitations. Therefore, this paper studies the general definition of the importance index in heterogeneous multi-attribute decision-making based on the subjective and objective comprehensive integration weighting method, and gives the definition and evaluation method of a heterogeneous multi-attribute index based on closeness.
The structure of this paper is as follows: Part 2 constructs an evaluation index system for the regional ecological green coordinated development; Part 3 constructs heterogeneous multi-attribute decision model; Part 4 reports on the empirical study on the coordinated development of urban ecological green developments in the Yangtze River Delta region; Part 5 further discusses the managerial implication of the study findings; and Part 6 concludes the paper and provide relevant policy recommendations.
2. Index System
2.1. Evaluation Index System of Regional Ecological Green Coordinated Development
The evaluation index system of the regional eco-green coordinated development can be defined as a series of interconnected indicators that can dynamically and accurately reflect the state of regional ecological green synergy. In order to accurately measure the level of regional ecological green integration and build a relatively complete set of preferred index systems, we screened the evaluation indicators that reflect regional ecological green integration from key ecological green indicators. We have followed the principles of sensitivity of the indicator data, representativeness of content, comprehensiveness of scope, measurability of indicators, utility of data and stability of the system.
The level of urbanization and the increase in per capita disposable income of urban residents can significantly promote regional ecological green development [
4]. With the advancement of urbanization, the spatial layout of cities has been continuously optimized, and the functions of cities have been continuously improved. The construction of livable cities directly promotes the improvement of urban ecological green development. With the improvement of urbanization level, cities have gathered a large number of high-quality talents, and the increasing consumption potential of cities has provided a continuous driving force for economic development [
49]. From the perspective of the city’s ecological green development, if the total population size exceeds the environmental capacity or even the carrying capacity, the environmental pressure of the city will increase, the promotion role of the urban population will gradually weaken and it will even become a constraint on the sustainable development of the city.
Regional scientific and technological development will greatly promote the improvement of ecological green development [
50]. High technology can improve the comprehensive utilization of resources and the ratio of input to output. High technology can promote the development and utilization of new energy sources, reduce the pressure on energy security, increase the proportion of clean energy utilization, reduce the proportion of fossil energy consumption in total energy consumption and further improve the energy consumption structure. High technology can also promote the improvement of environmental pollution management capacity and management efficiency, thereby reducing industrial pollution emissions and helping to improve environmental quality.
Excessive resource consumption is not conducive to the improvement of the regional ecological green development level [
14,
35]. The rational use of resources will not hinder the ecological green development of cities, and the resource consumption mode should meet the development concepts and requirements of new industrialization and greening. The improvement of the environmental protection level will strongly promote the improvement of the regional ecological green development level. Driven by the central government’s proactive fiscal policy and incentive tax policy, regional cities will actively control environmental pollution and gradually increase the proportion of environmental protection expenditure in environmental pollution control. It is possible to improve the performance of pollution control by innovating collaborative environmental pollution control and horizontal compensation mechanisms. It can also reduce corporate tax burden through tax competition and encourage polluting enterprises to attach importance to pollution control.
As shown in
Table 1, the system includes four dimensions of coordinated development of the regional ecological environment, economic environment, social environment and policy environment.
2.2. Heterogeneous Multi-Criteria Characteristics of Indicators
The degree of coordinated development of the ecological environment takes into account ecological pressure, ecological overload, resource utilization and a moderate population, so there are six indicators: green coverage rate (%), total population (10,000 people), land utilization (%) [
51], SO
2 emissions per unit of GDP (kg/10,000 RMB) [
52], wastewater discharge per unit of GDP (kg/10,000 RMB) [
8,
9] and efficient utilization of energy resources.
The degree of coordinated development of the green economic environment is mainly considered, so six indicators are set: the environmental protection patent applications ratio (%), technology expenditure (%), GDP per capita (RMB), urban residents’ per capita disposable income (RMB), investment in environmental pollution treatment (100 million RMB) [
35] and retail sales of per capita social consumer goods (100 million RMB).
The degree of coordinated development of the social environment mainly considers the medical environment, education environment, transportation environment and natural environment. Therefore, six indicators are set: the excellent rate of ambient air quality (%), the number of doctors per 10,000 people [
23], college students per 10,000 people, harmless treatment rate of domestic waste (%), per capita urban road area (square meters) and recycling resource utilization rate [
14].
The degree of coordinated development of the policy environment mainly considers the introduction of regional integration policies and the cooperation of integrated institutions. Therefore, two indicators are set for the introduction of integrated planning or agreement, the composition of the leadership of the integrated decision-making organization and the coordination efficiency.
The criteria involved in regional ecological green development assessment have complex and diverse interrelationships. For example, regions with rapid economic growth may bring the cost of environmental degradation. The indicators involved in this indicator system include quantitative indicators and qualitative indicators. For quantitative indicators, they are usually expressed in real numbers, but this article studies the long-term dimension. Therefore, such integrated indicators will fluctuate within a certain time range. For qualitative indicators, the efficient utilization of energy resources is characterized by certain fluctuations over time, so triangular fuzzy numbers should be used to represent them. Recycling rates, the composition of integrated decision-making leadership personnel and coordination efficiency cannot be measured using numerical measures. According to the language description of relevant experts, it is measured in the form of linguistic values. When evaluating the implementation of integrated planning or agreements, experts give good, average and poor evaluations. Therefore, it is more appropriate to use intuitionistic fuzzy numbers. Therefore, the indicators in this paper mainly include four categories: interval numbers, triangular fuzzy numbers, binary semantic information and intuitive fuzzy numbers.
In order to improve the integrity and effectiveness of ecological green development assessments, sustainability dimensions and standards must be integrated, and their interdependence must be considered [
53]. As the number of assessment criteria for ecological green development is usually large and not necessarily expressed in common metrics, the sustainability assessment of regional cities can be formulated accordingly as a multi-criteria decision (MCDM) issue [
44]. A widely used approach to deal with the MCDM problem is to use the multi-attribute utility theory (MAUT)-based methods to generate a cardinal preference of the alternatives (e.g., cities) based on the utility of each alternative in relation to each criterion [
44]. MAUT-based methods have been used to address issues related to sustainability [
54,
55,
56,
57]. In the MAUT-based approach, the criteria are considered to be independent of each other, and usually an additive utility function is used. In general, the utility or overall satisfaction of each option can be obtained by summarizing the relative importance or weight of the criterion relative to the goal of the decision problem and the performance level of the alternatives relative to each criterion.
Despite the fact that the MAUT-based method is simple and intuitive, the assumption of standard independence may not be applicable to solve the MCDM problem when considering that the phenomenon of interaction between standards is crucial for decision-making. The criteria interrelationships can be very subtle and complicated so that they can hardly be subjectively determined by decision makers. As such, this study proposes a heterogeneous multi-attribute decision-making method based on closeness, which is used to evaluate the regional ecological green coordinated development.
3. Methods
3.1. Heterogeneous Decision Problem Importance Index
Determining the importance of attributes in multi-attribute decision-making has always been the core of decision-making problems. Research on the importance of attributes in multi-attribute decision-making has attracted widespread attention from many scholars. Generally, in simple models, the weighted average method is a common method for multi-attribute decision problems. The weights used in the aggregation can be regarded as the standard importance index, and Choquet integrals are usually used for aggregation [
57]. The Shapley value (a concept borrowed from game theory) is used as the attribute’s importance index.
In complex environmental decision-making problems, evaluation information may involve qualitative and quantitative information, which is called heterogeneous multi-attribute decision-making. Its types mainly include intuitionistic fuzzy numbers, triangular fuzzy numbers, real number interval numbers and linguistic variables. Different scholars have carried out multi-angle researches on problems with different attributes. Needle triangle fuzzy decision scholars use triangle intuitionistic fuzzy Choquet integral operator integration to get the comprehensive attribute value of the scheme, objectively determine the fuzzy measure of the attribute set, and then propose a corresponding decision method. Aiming at the multi-criteria decision problem with evaluation information as interval intuitionistic fuzzy numbers, scholars have proposed a new decision method based on the correlation coefficient of interval intuitionistic fuzzy numbers [
58,
59]. Aiming at the problem of multi-attribute group decision-making in multi-granularity languages, a new method of unification based on uncertain linguistic variables has been learned [
60]. In addition, studies have integrated information such as linguistic, intuitionistic fuzzy numbers and interval intuitionistic fuzzy numbers into interval intuitionistic fuzzy numbers, and have proposed hybrid decision-making.
The sustainability evaluation problem of regional ecological green coordinated development can be formulated as a heterogeneous multi-criteria decision-making (HMCDM) problem. So, how does one quantify the heterogeneous multi-attribute ecological green index in the form of an importance index? This article analyzes the general definition of an importance index in heterogeneous multi-attribute decision-making. The calculation method of the importance index of heterogeneous multi-attribute decision-making based on closeness is given.
For heterogeneous multi-attribute decision problems, let , . Let denote a set of m decision schemes, and denote a set of n attributes. Among them, represents the i alternative, i∈M; represents the j attribute, j ∈ N. There are five main types of attribute values: real numbers, interval numbers, triangular fuzzy numbers, binary semantic information and intuitionistic fuzzy numbers. Si is used to represent the attribute values corresponding to real numbers, interval numbers, triangular fuzzy numbers, binary semantic information and intuitionistic fuzzy numbers, then the attribute set is expressed as , and (i, j = 1,2, …, 5; i ≠ j). Let and denote the benefit-type and cost-type attribute sets in Si, and satisfy the constraints , .
Then the decision maker’s evaluation of the attribute is
where
is the evaluation value of real numbers;
is the evaluation value of interval numbers;
is the evaluation value of triangular fuzzy numbers;
is the evaluation value of binary semantic information;
is a set of language tags about the index
; and
is the evaluation value of intuitionistic fuzzy numbers.
Let function v be a utility function with respect to the attribute set
S, whose value represents the decision maker’s preference for different alternatives. The value function v on the set
S is similar to the utility function
v in cooperative game theory. The value function
v can be regarded as a multiple game. The importance index of the attribute should reflect the degree to which the attribute affects the output. Since this impact may depend on the role of other attributes, an average impact should be adopted. The importance index of an attribute is related to the amount of change in
v caused by a change in the attribute value. Using
ϕ to represent the importance index, the general expression of the importance index of the attribute
i relative to
v is
where
is the coefficient (weight) of the attribute
i in the set
S,
. If the weight
depends only on
, then
3.2. Heterogeneous Multi-Criteria Decision Model Based on Closeness
In the multi-attribute decision problem, the preference information of the decision maker is generally given, and there is a positive and ideal solution for each attribute value of the decision plan. Closeness represents the closeness between each attribute value. The closer the attribute value is to the positive ideal solution, the greater the contribution of the attribute [
58,
61]. Therefore, the degree of importance of an attribute can be defined by relative closeness, so that the determination of the importance index can reflect both the subjective and objective requirements and the consistency of the transformation trend.
3.2.1. Standardization of Heterogeneous Information
Because the dimensions of each attribute value are different, each attribute value needs to be standardized. According to the benefit and cost attributes, the normalization methods are as follows:
The normalization of the interval number
is shown in Equation (4).
The normalization of the triangular fuzzy number
is shown in Equation (5).
Let the basic language tag set be
, where the normalization of
is as shown in Equation (6).
Intuitionistic fuzzy number Aij = <μij, νij> (j ∈ S4)is between 0 and 1, so we do not need to normalize.
3.2.2. Relative Closeness of Heterogeneous Information
In heterogeneous multi-attribute decision-making, the closeness of decision-making schemes is usually reflected by the degree of closeness. In order to compare solutions, we calculate the positive and negative ideal solutions of heterogeneous information as two reference points, denoted as
and
, respectively. The positive ideal solution
refers to the solution with the most satisfactory properties, and the negative ideal solution
refers to the solution with the least satisfactory properties. We calculate the positive ideal solution of the four types of indicators involved in this paper, as shown in Equation (7).
where
,
,
,
,
,
,
,
.
Similarly, we calculate the negative ideal solution of the four types of indicators involved in this paper, as shown in Equation (8).
where
,
,
,
,
,
,
,
.
Suppose the relative closeness of the decision maker’s decision preferences on option
i with respect to the positive ideal solution of heterogeneous information is
Dij, which is shown in Equation (9).
The relative degree of closeness
reflects the closeness of the decision plan
i to the positive ideal solution.
and
represent the distances of the attribute values of the decision members to the plan
i (
i = 1,2, …, n) from
and
; that is,
3.2.3. Heterogeneous Multi-Criteria Model Calculation
Because the relative closeness reflects the closeness of the attribute value to the positive ideal solution, its value can be approximated as the contribution of the attribute. The smaller the
value, the higher the degree of closeness and the greater the contribution; the larger the
value, the lower the degree of closeness and the smaller the contribution. The relative closeness is further processed so that the larger the value is, the higher the closeness is, and this is used as the utility function
v to calculate the importance index of heterogeneous multiple-attribute decision-making. Let
; the calculation of the heterogeneous multi-attribute model based on closeness is shown in Equation (12).
3.3. The Regional Ecological Green Coordinated Development Index
After obtaining the heterogeneous multi-attribute decision weights based on the closeness degree, the regional ecological green collaborative development index is calculated according to the linear fitting formula, as shown in Equation (13).
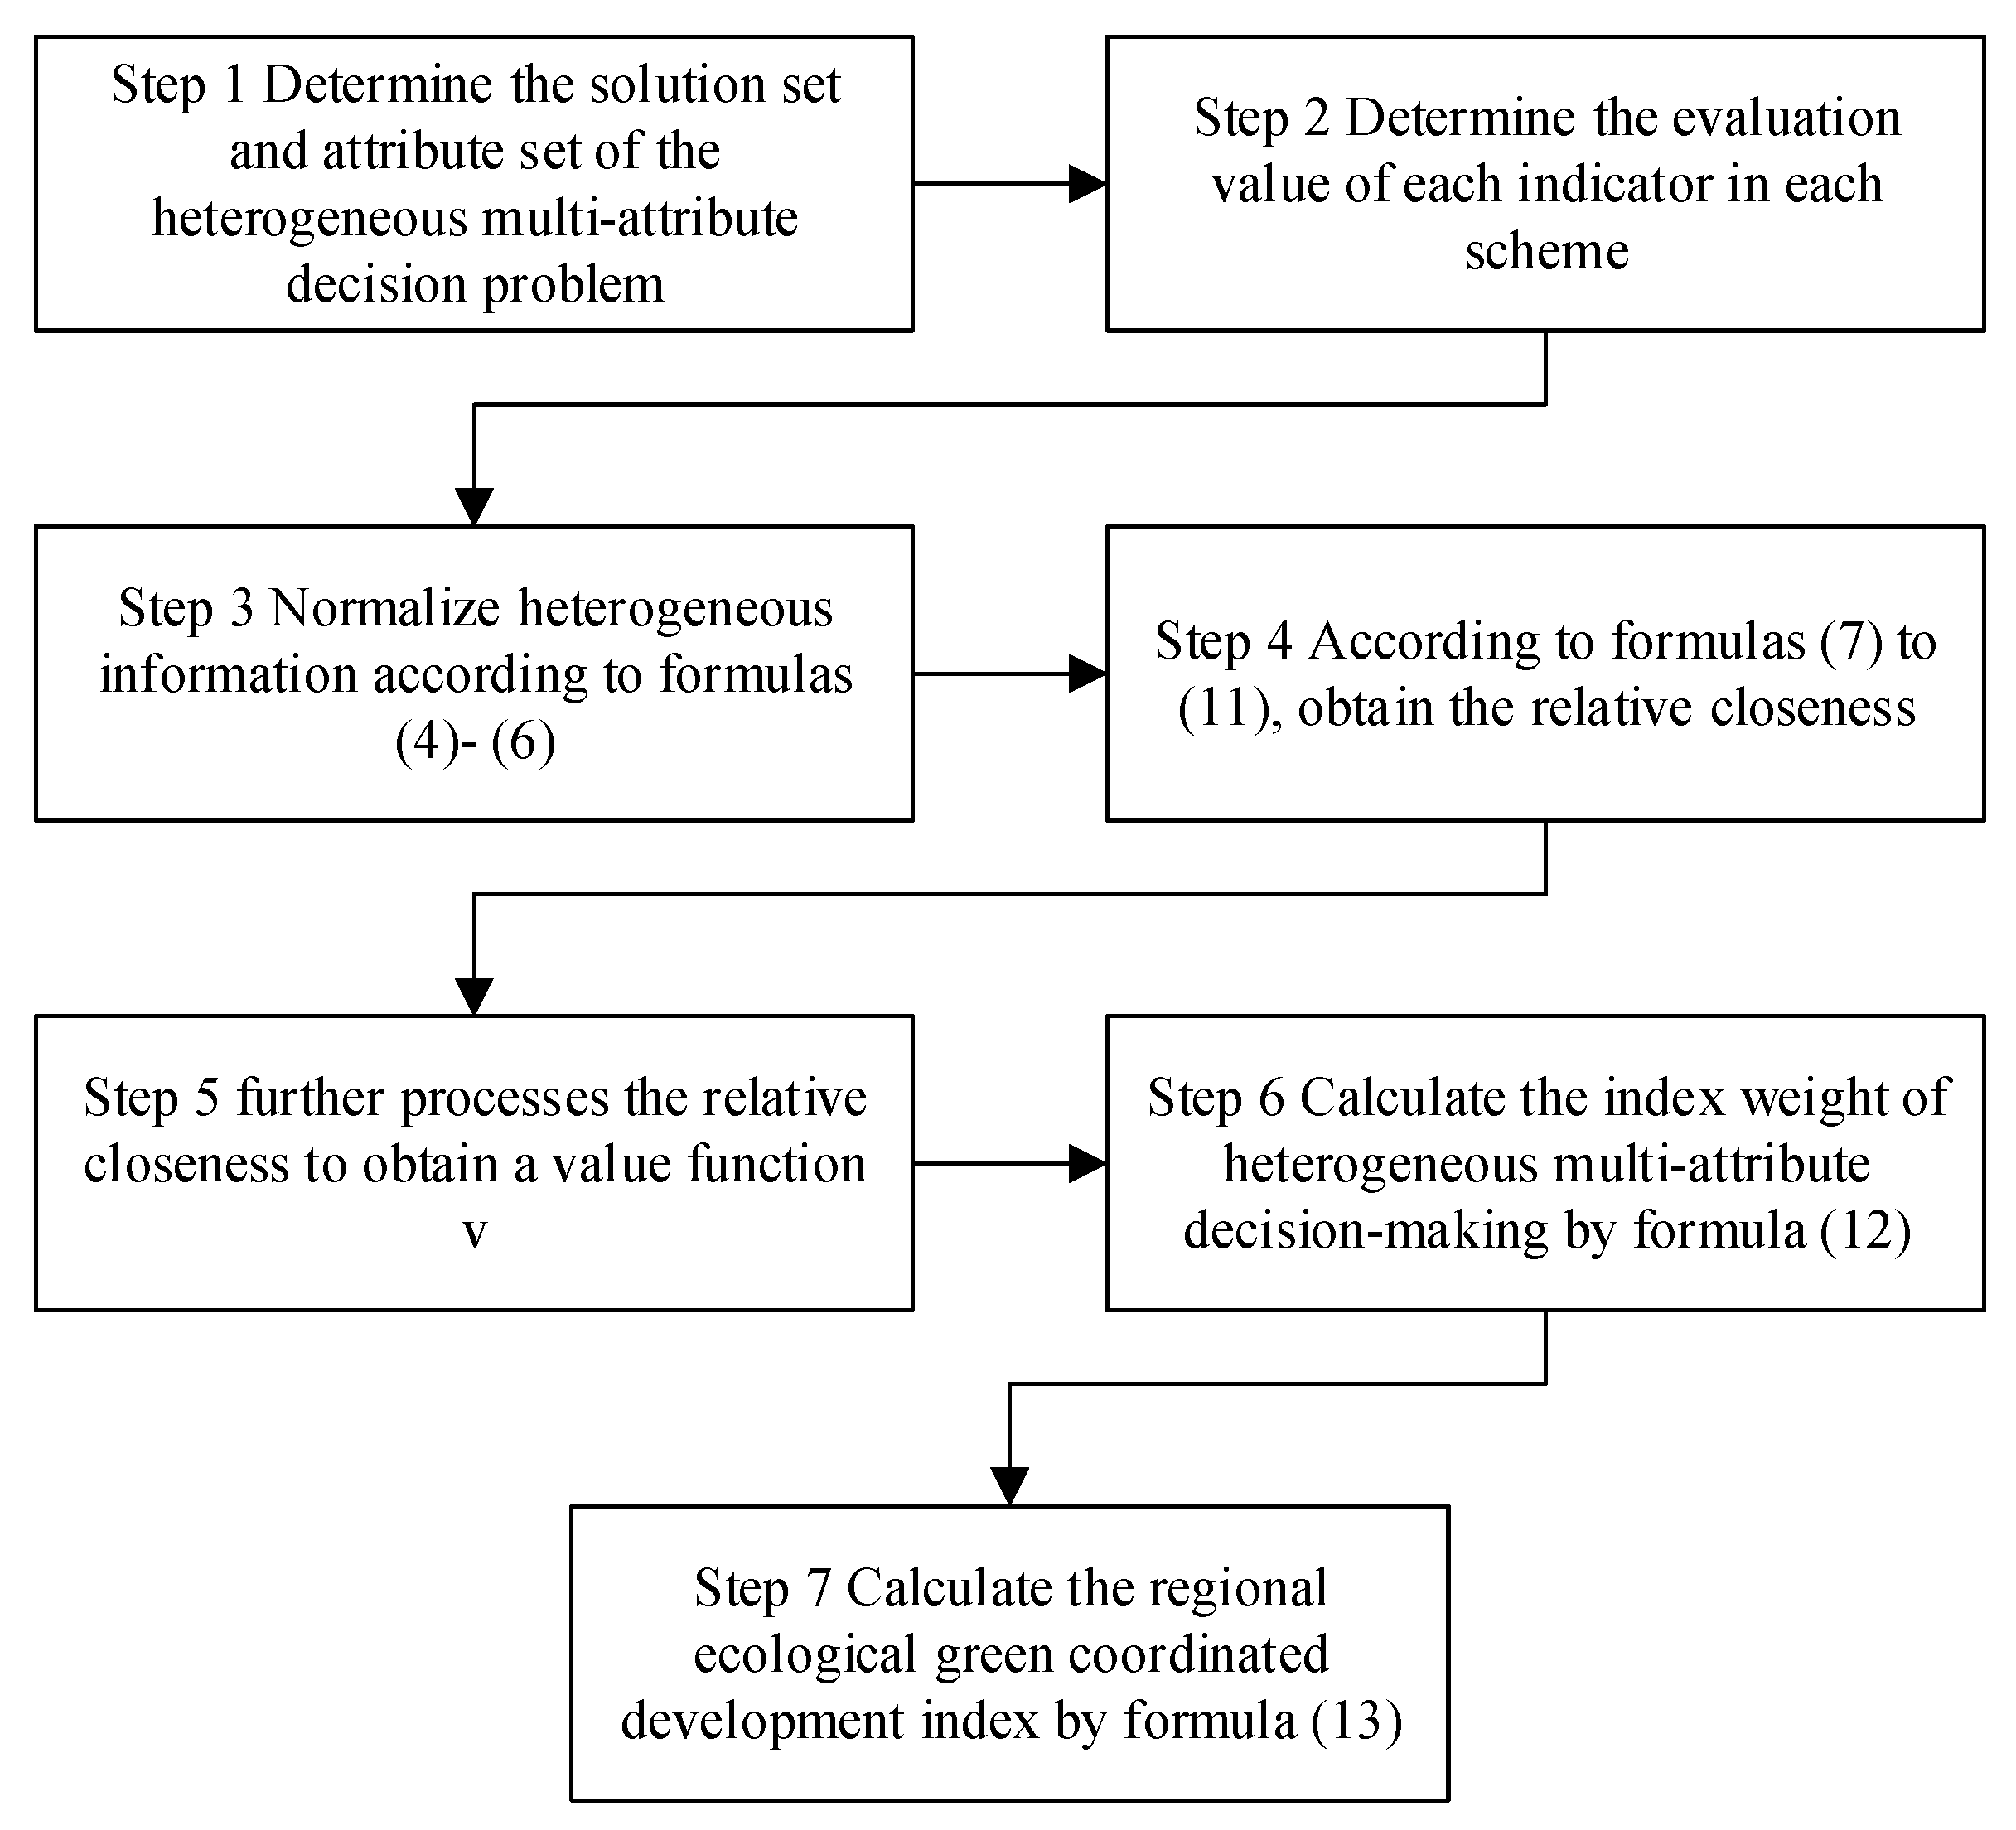
From the above, the weighting and aggregation process can be summarized into the following steps:
Step 1: Determine the solution set
and attribute set
of the heterogeneous multi-attribute decision problem. Step 2: Determine the evaluation value of each indicator in each plan through expert opinion, language variables and statistical methods. Step 3: Normalize the heterogeneous information according to Equations (4) to (6). Step 4: According to Equations (7) to (11), calculate the positive and negative ideal solutions of heterogeneous information, and find the relative closeness. Step 5: Further processes the relative closeness as a value function v. Step 6: According to Equation (12), calculate the index weight of heterogeneous multi-attribute decision-making based on closeness. Step 7: Calculate the regional ecological green coordinated development index by Equation (13).
Figure 2 shows the weighting and aggregation process.
3.4. Research Scope and Data Sources
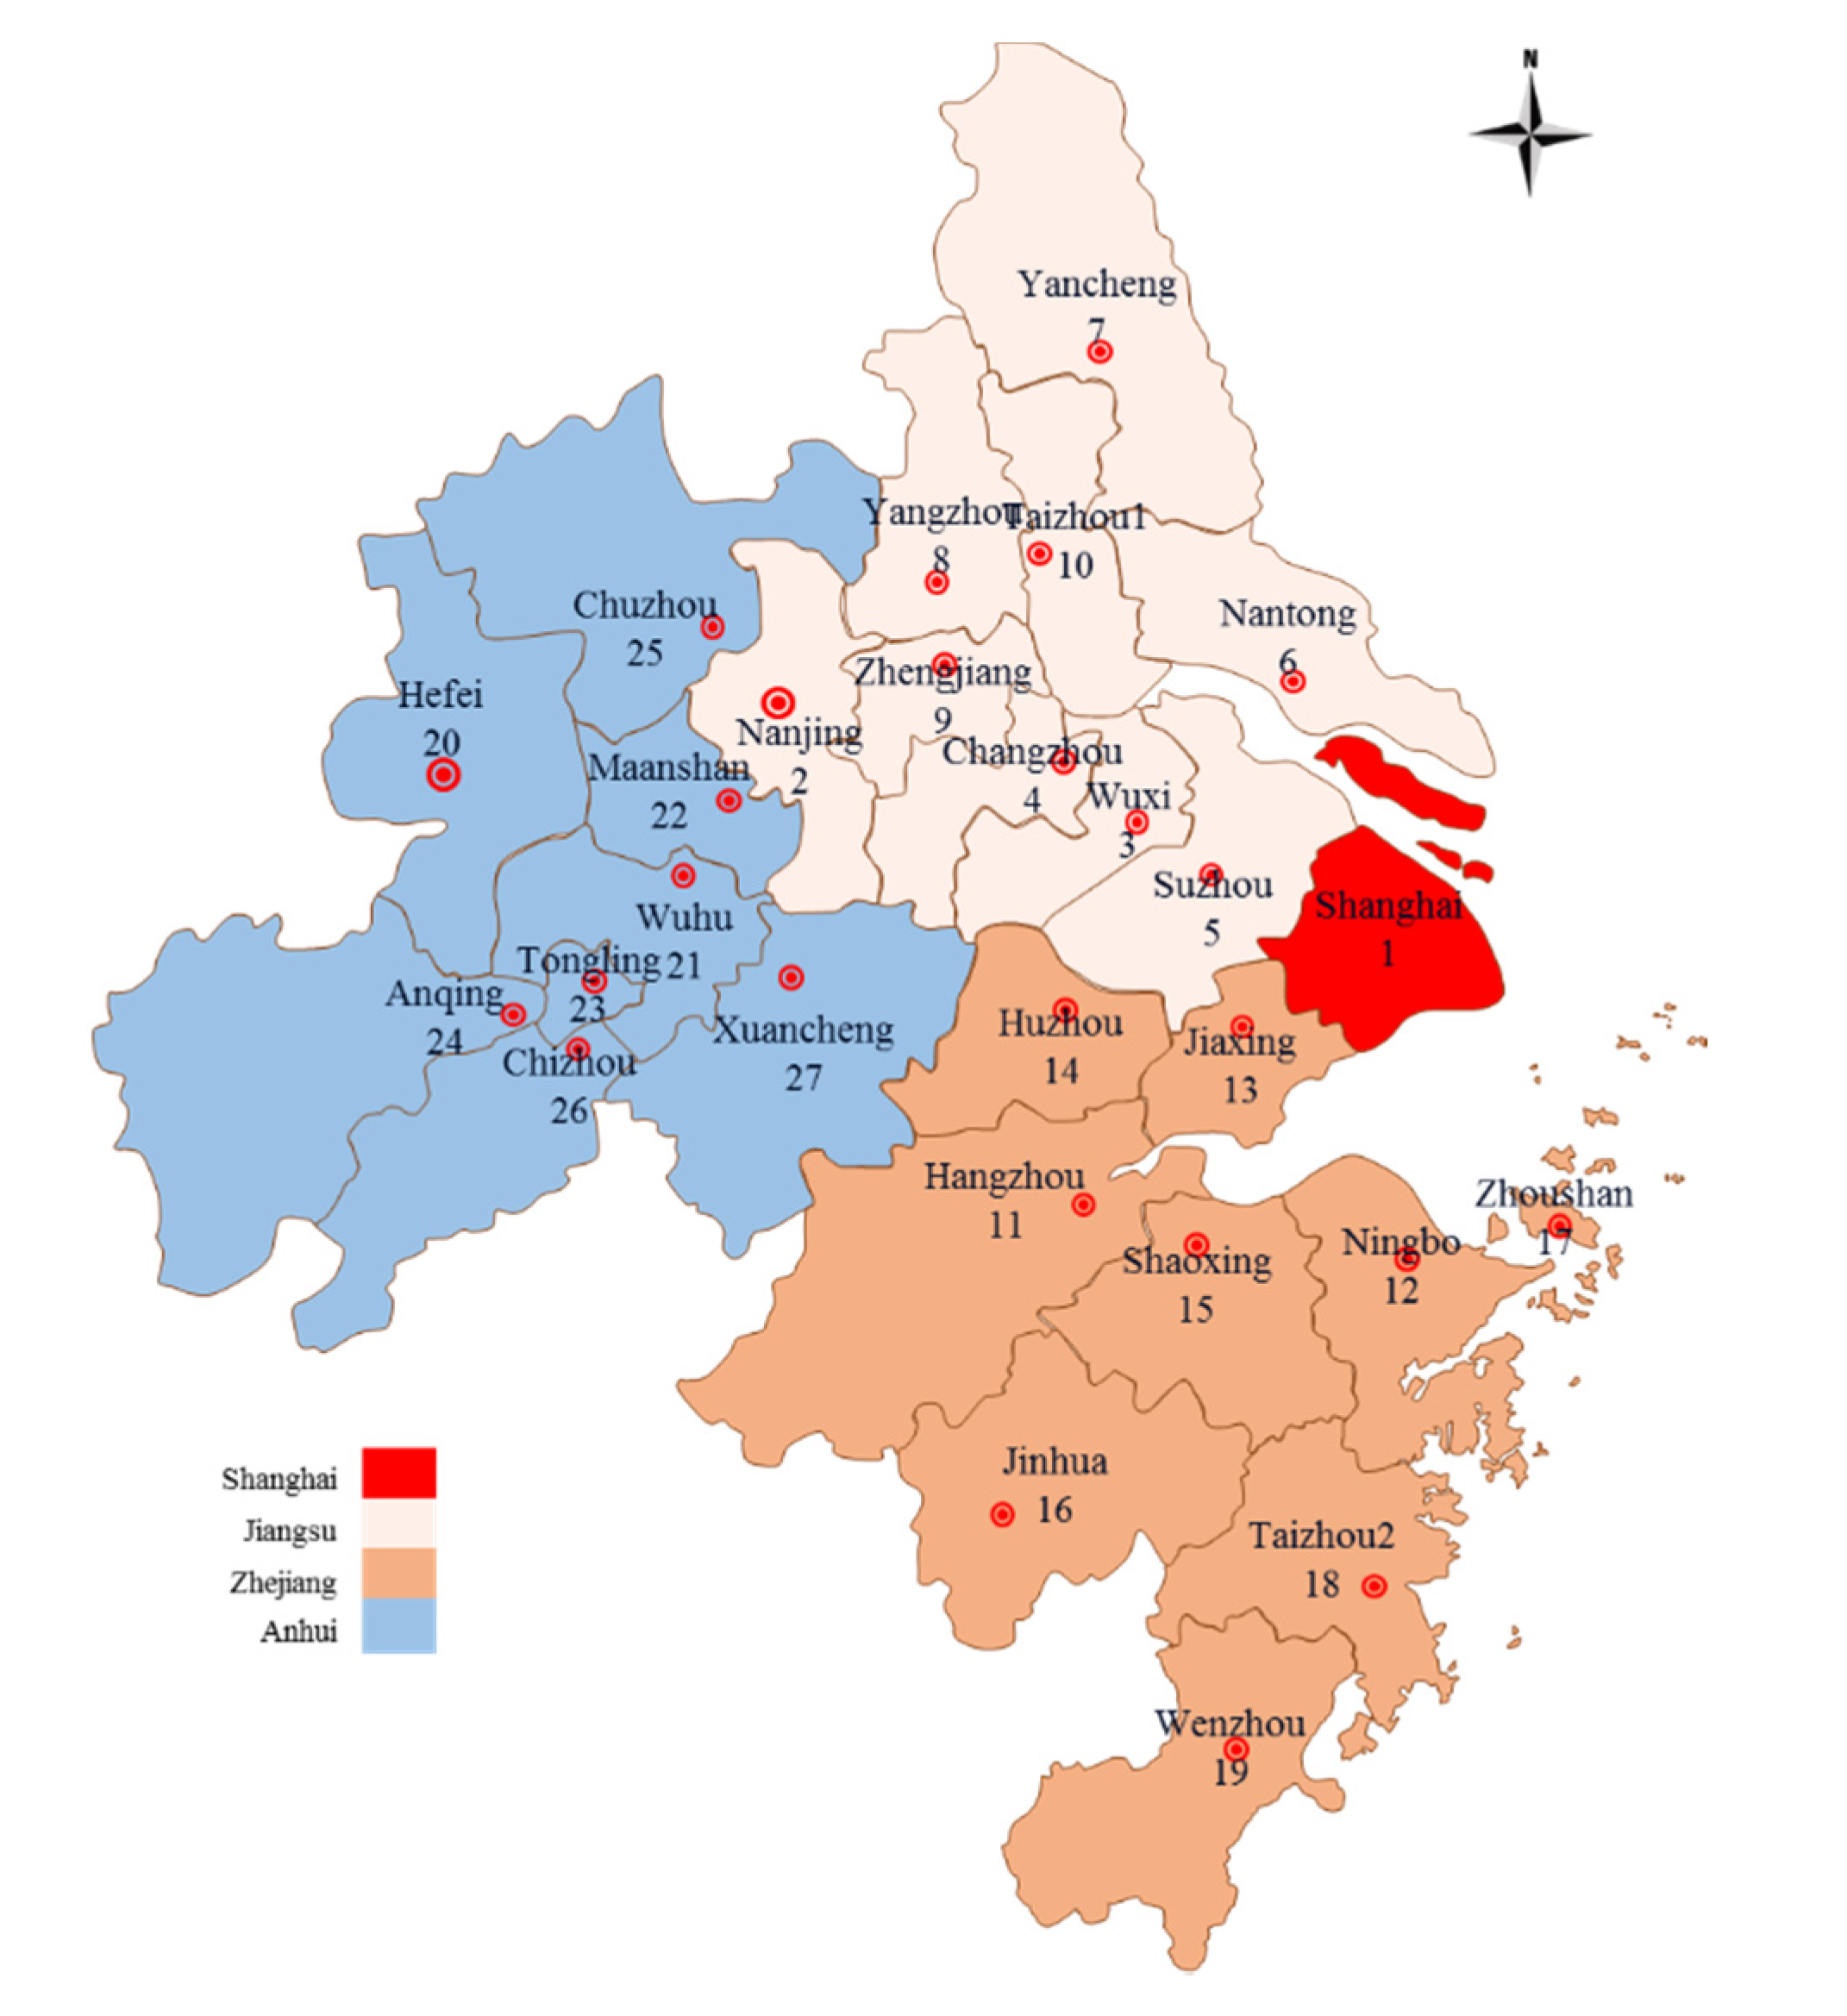
The Yangtze River Delta urban agglomeration covers Shanghai, Jiangsu Province, Zhejiang Province and Anhui Province. The “Yangtze River Delta Urban Agglomeration Development Plan” specifies that the central area of the Yangtze River Delta urban agglomeration covers 27 cities. There are nine cities in Jiangsu Province: Nanjing, Wuxi, Changzhou, Suzhou, Nantong, Yangzhou, Zhenjiang, Yancheng and Taizhou. There are nine cities in Zhejiang Province: Hangzhou, Ningbo, Wenzhou, Huzhou, Jiaxing, Shaoxing, Jinhua, Zhoushan and Taizhou. There are eight cities in Anhui Province: Hefei, Wuhu, Ma’anshan, Tongling, Anqing, Chuzhou, Chizhou and Xuancheng. Because the English names of the cities of Taizhou City in Jiangsu Province and Taizhou City in Zhejiang Province are the same, Taizhou in Jiangsu Province is named Taizhou1, and Taizhou in Zhejiang Province is named Taizhou2. The distribution of the cities is shown in
Figure 3.
The quantitative data came from the China City Statistical Yearbook (2008–2017) and cities’ Statistical Yearbooks, Economic Yearbooks, Economic Statistics Yearbooks, Statistical Bulletins and part of the environmental data from the Ministry of Environmental Protection Data Center. Part of the missing data in the historical data was processed by interpolation. The qualitative indicators came from the expert evaluation of regional integration in the Yangtze River Delta.
4. Empirical Study
4.1. Index Calculation
First, the level of ecological green integration in the 27 regions was evaluated, where the attribute set was , the intuitive fuzzy number , the triangular fuzzy number , the interval number and the linguistic variable .
Through expert opinion, language variables and statistical methods, we determined the evaluation value of each indicator in each scheme, and then normalized the heterogeneous information, calculated the positive and negative ideal solutions of the heterogeneous information and obtained the relative closeness.
Based on the difference of closeness, the weight of each indicator calculated by the quality multi-attribute model was (0.053, 0.062, 0.052, 0.035, 0.036, 0.057, 0.042, 0.085, 0.074, 0.032, 0.084, 0.062, 0.040, 0.055, 0.051, 0.022, 0.059, 0.032, 0.034, 0.033).
Finally, the weighted average method was used to obtain the ecological green integration index of the Yangtze River Delta urban agglomeration from 2008 to 2017, as shown in
Table 2.
4.2. Result Analysis
Judging from the comprehensive index of the coordinated development of ecological green developments in the Yangtze River Delta region, the overall level of the coordinated development of ecological green integration in the urban agglomerations in the central area of the Yangtze River Delta has been increasing year by year, as shown in
Figure 4. Comparing the urban ecological green coordinated development index of the Yangtze River Delta central area in 2008, 2013 and 2017, we also find the same conclusion, as shown in
Figure 5.
However, the cross section of the coordinated development of ecological green developments among the urban agglomerations in the central area of the Yangtze River Delta is obviously different, as shown in
Figure 6.
According to the 2017 data, the size of the 27 cities’ ecological green coordinated development index is sorted in ascending order and can be divided into four parts: the first part contains Shanghai, with an index greater than 0.9; the second part contains Yangzhou, Hangzhou, Wuxi, Tongling, Changzhou, Shaoxing, Huzhou, Yancheng, Maanshan, Jinhua, Anqing, Chizhou and Wuhu, whose index is between 0.8000 and 0.8999; the third part contains Taizhou2, Xuancheng, Nanjing, Luzhou and Taizhou1, whose index is between 0.7000 and 0.7999; and the fourth part contains Hefei, Jiaxing and Nantong, whose indices are between 0.6000 and 0.6999.
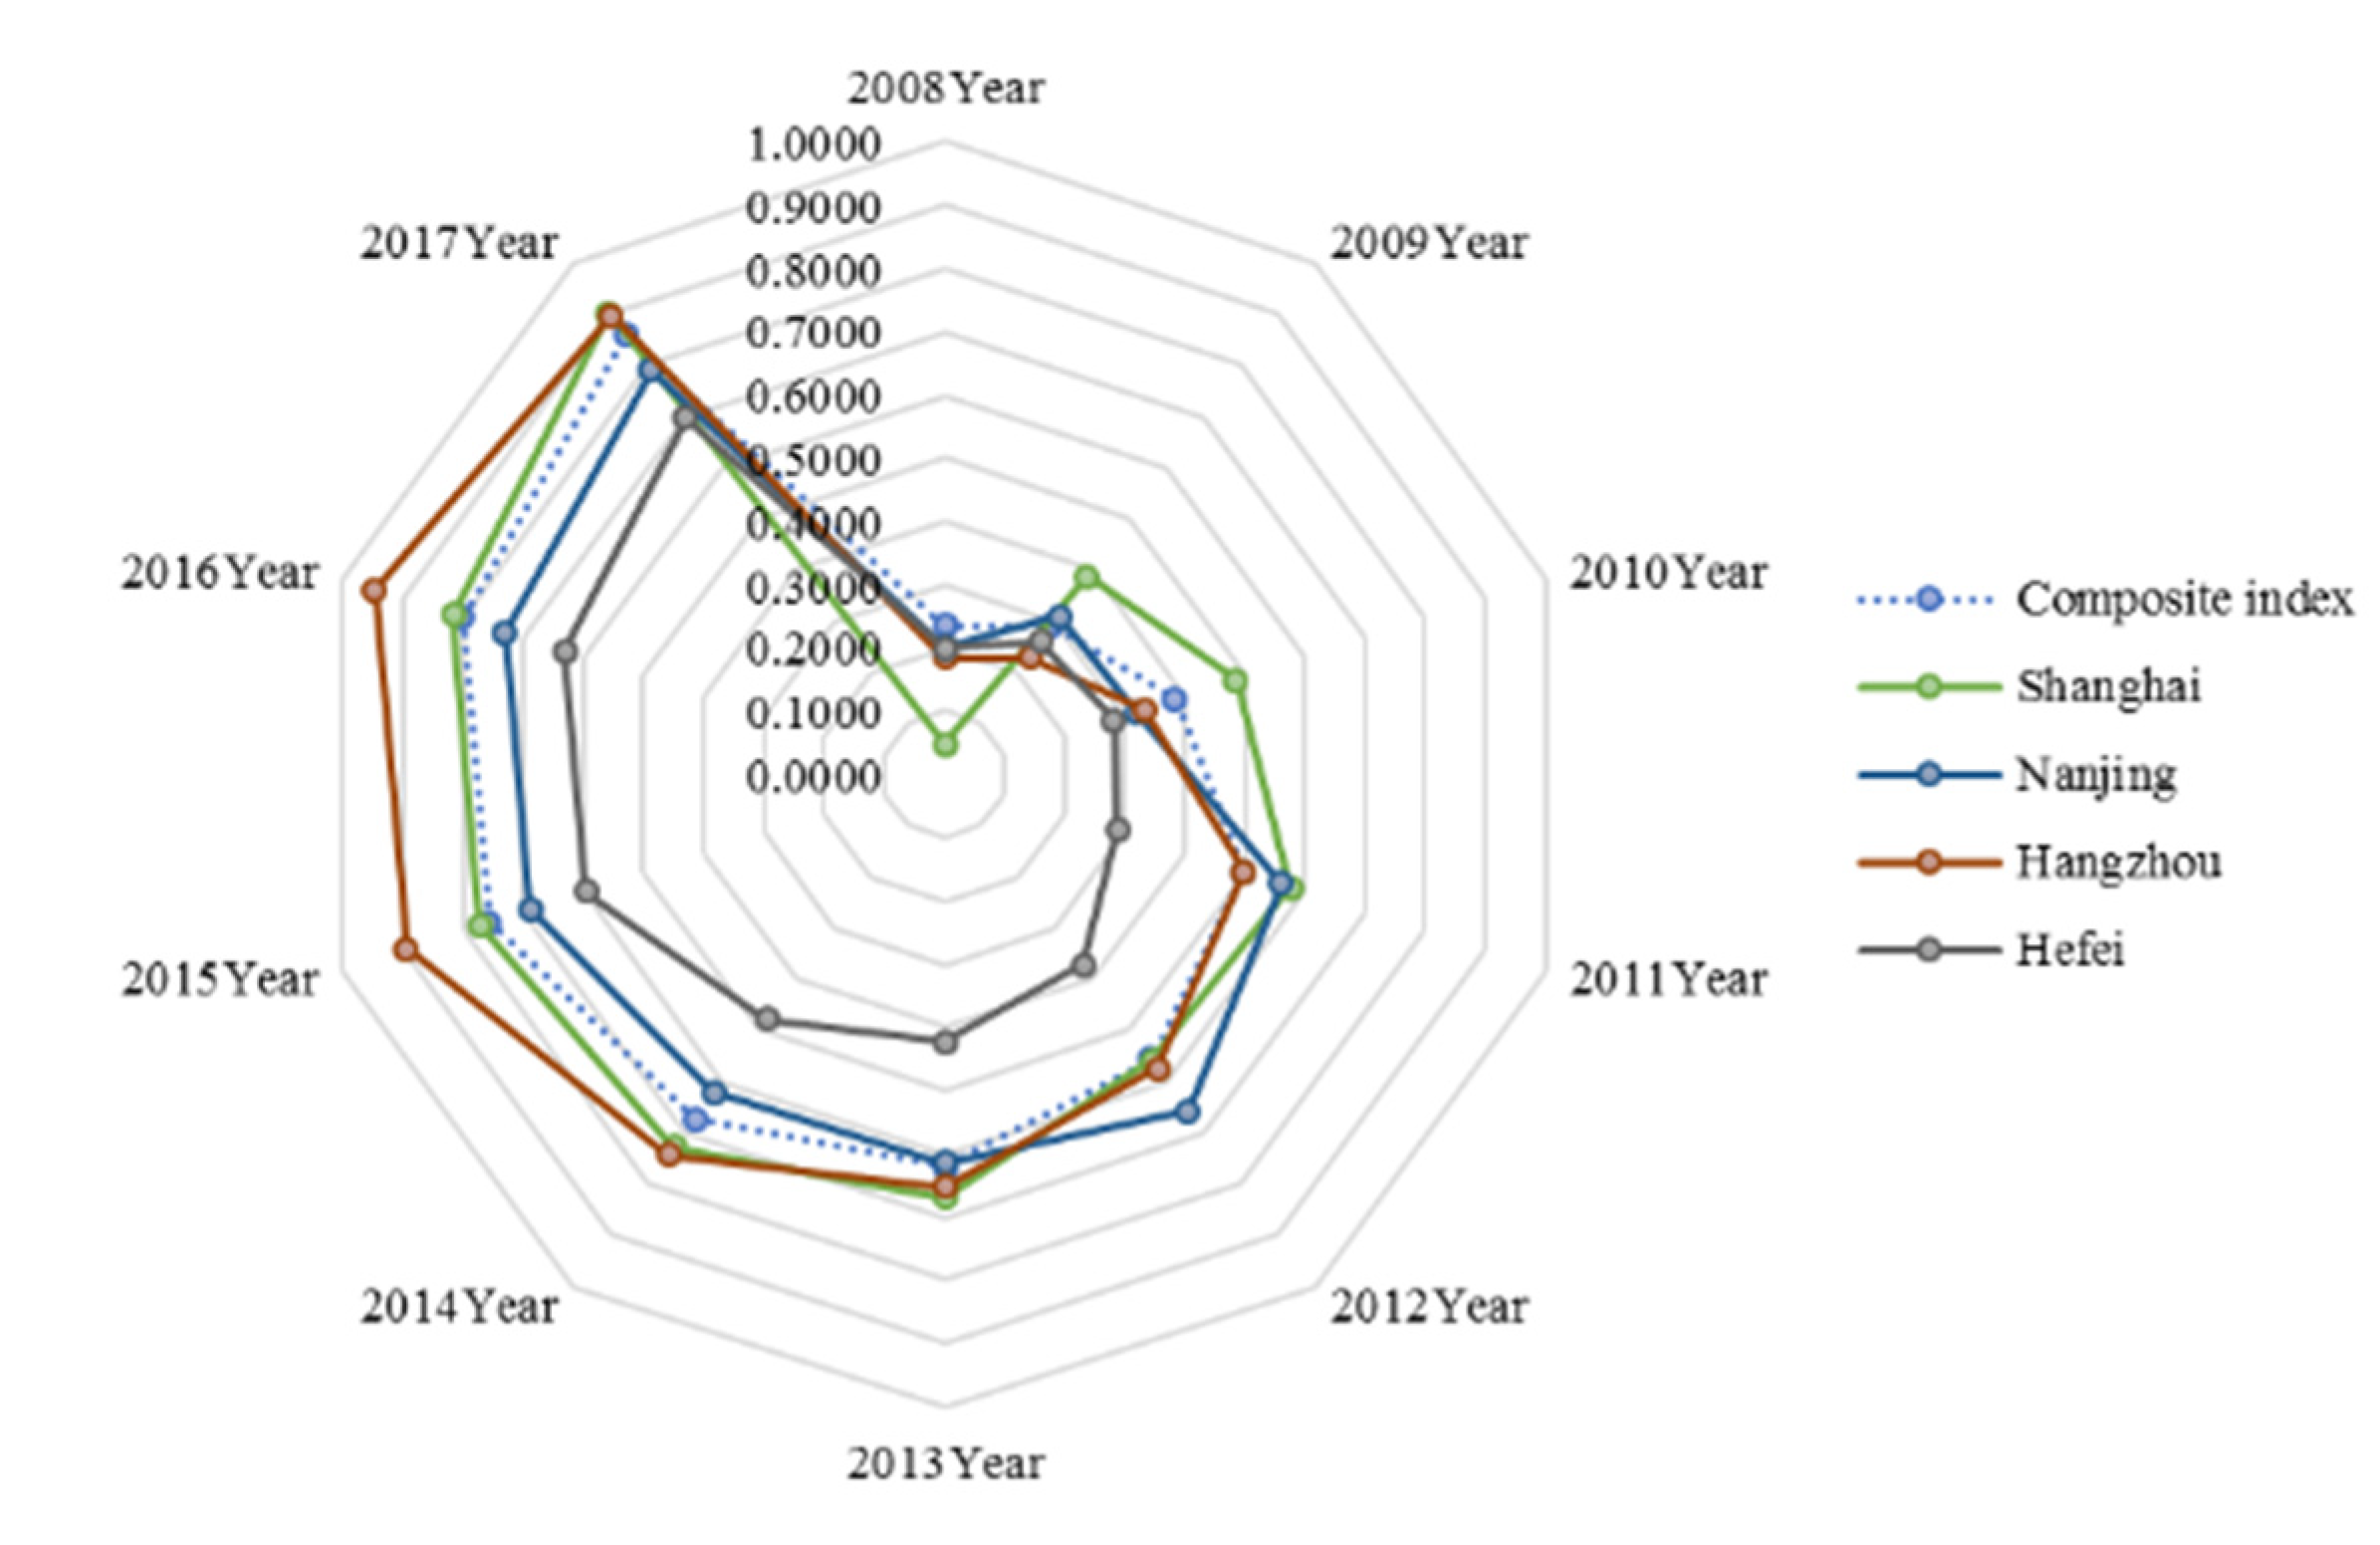
Overall, there is a significant gap in the level of coordinated development of ecological green among the 27 cities in the Yangtze River Delta, with the index mainly concentrated between 0.3700 and 0.5900. For provincial capitals, only Shanghai is located in the first part, whereas Hangzhou and Nanjing are located in the second and third parts, respectively, and Hefei is located in the fourth part, as shown in
Figure 6. It indicates that the more developed cities’ greening level may be relatively high, and the reason may be that cities with a strong economy experienced the environmental Kuznets curve earlier, thus attaching importance to ecological restoration and environmental protection, making the ecological green index higher.
But this is not absolutely affected by the economy. We see that the levels of coordinated development of ecological greening in cities such as Yangzhou, Hangzhou, Wuxi, Tongling, Changzhou, Shaoxing, Huzhou, Yancheng, Maanshan, Jinhua, Anqing, Chizhou, Wuhu and other cities are all higher. Therefore, in addition to the economic impact, the level of coordinated development of ecological greening in urban agglomerations is more closely related to the urban ecological environment, livable environment and government policy coordination.
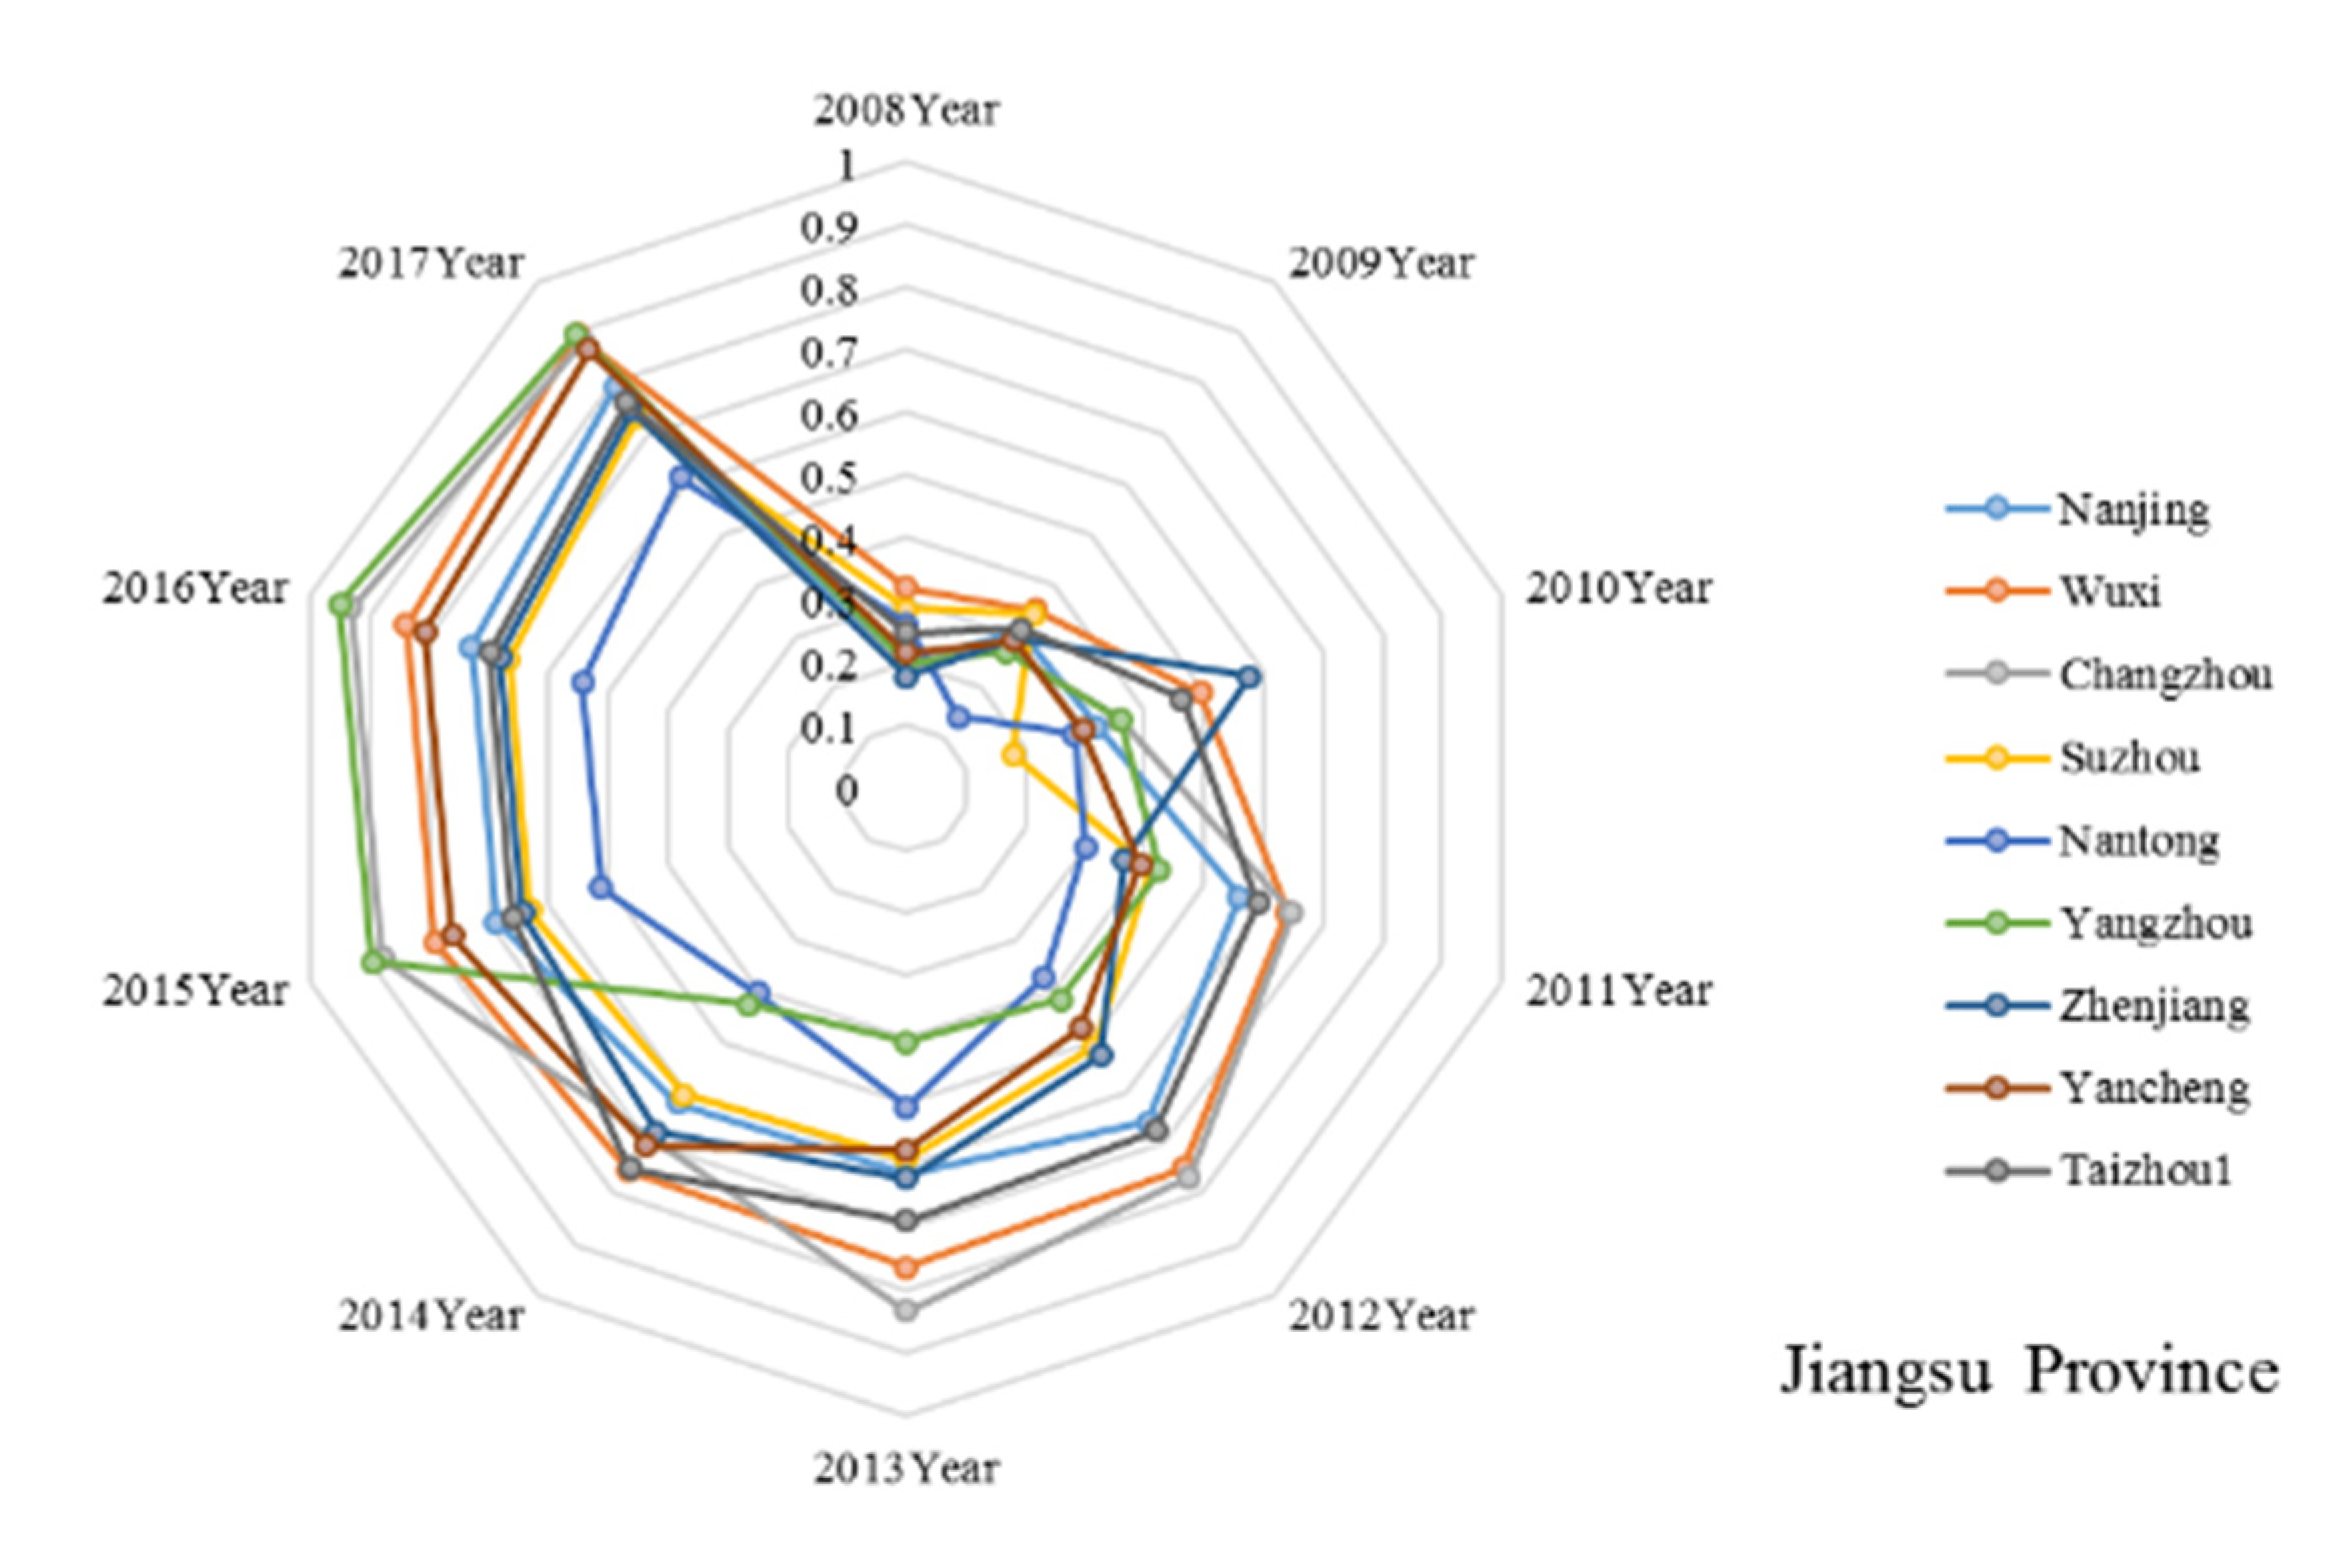
We separately analyzed the ecological green coordinated development index of nine cities in Jiangsu Province, and found that the early levels of ecological green coordinated development in the nine cities were staggered. From 2008 to 2010, the cities with higher levels of ecological green coordinated development were Wuxi, Suzhou, Changzhou and Taizhou1. From the index of the past three years, the top five levels of coordinated development of ecological greening were in Yangzhou, Changzhou, Wuxi, Yancheng and Nanjing, as shown in
Figure 7.
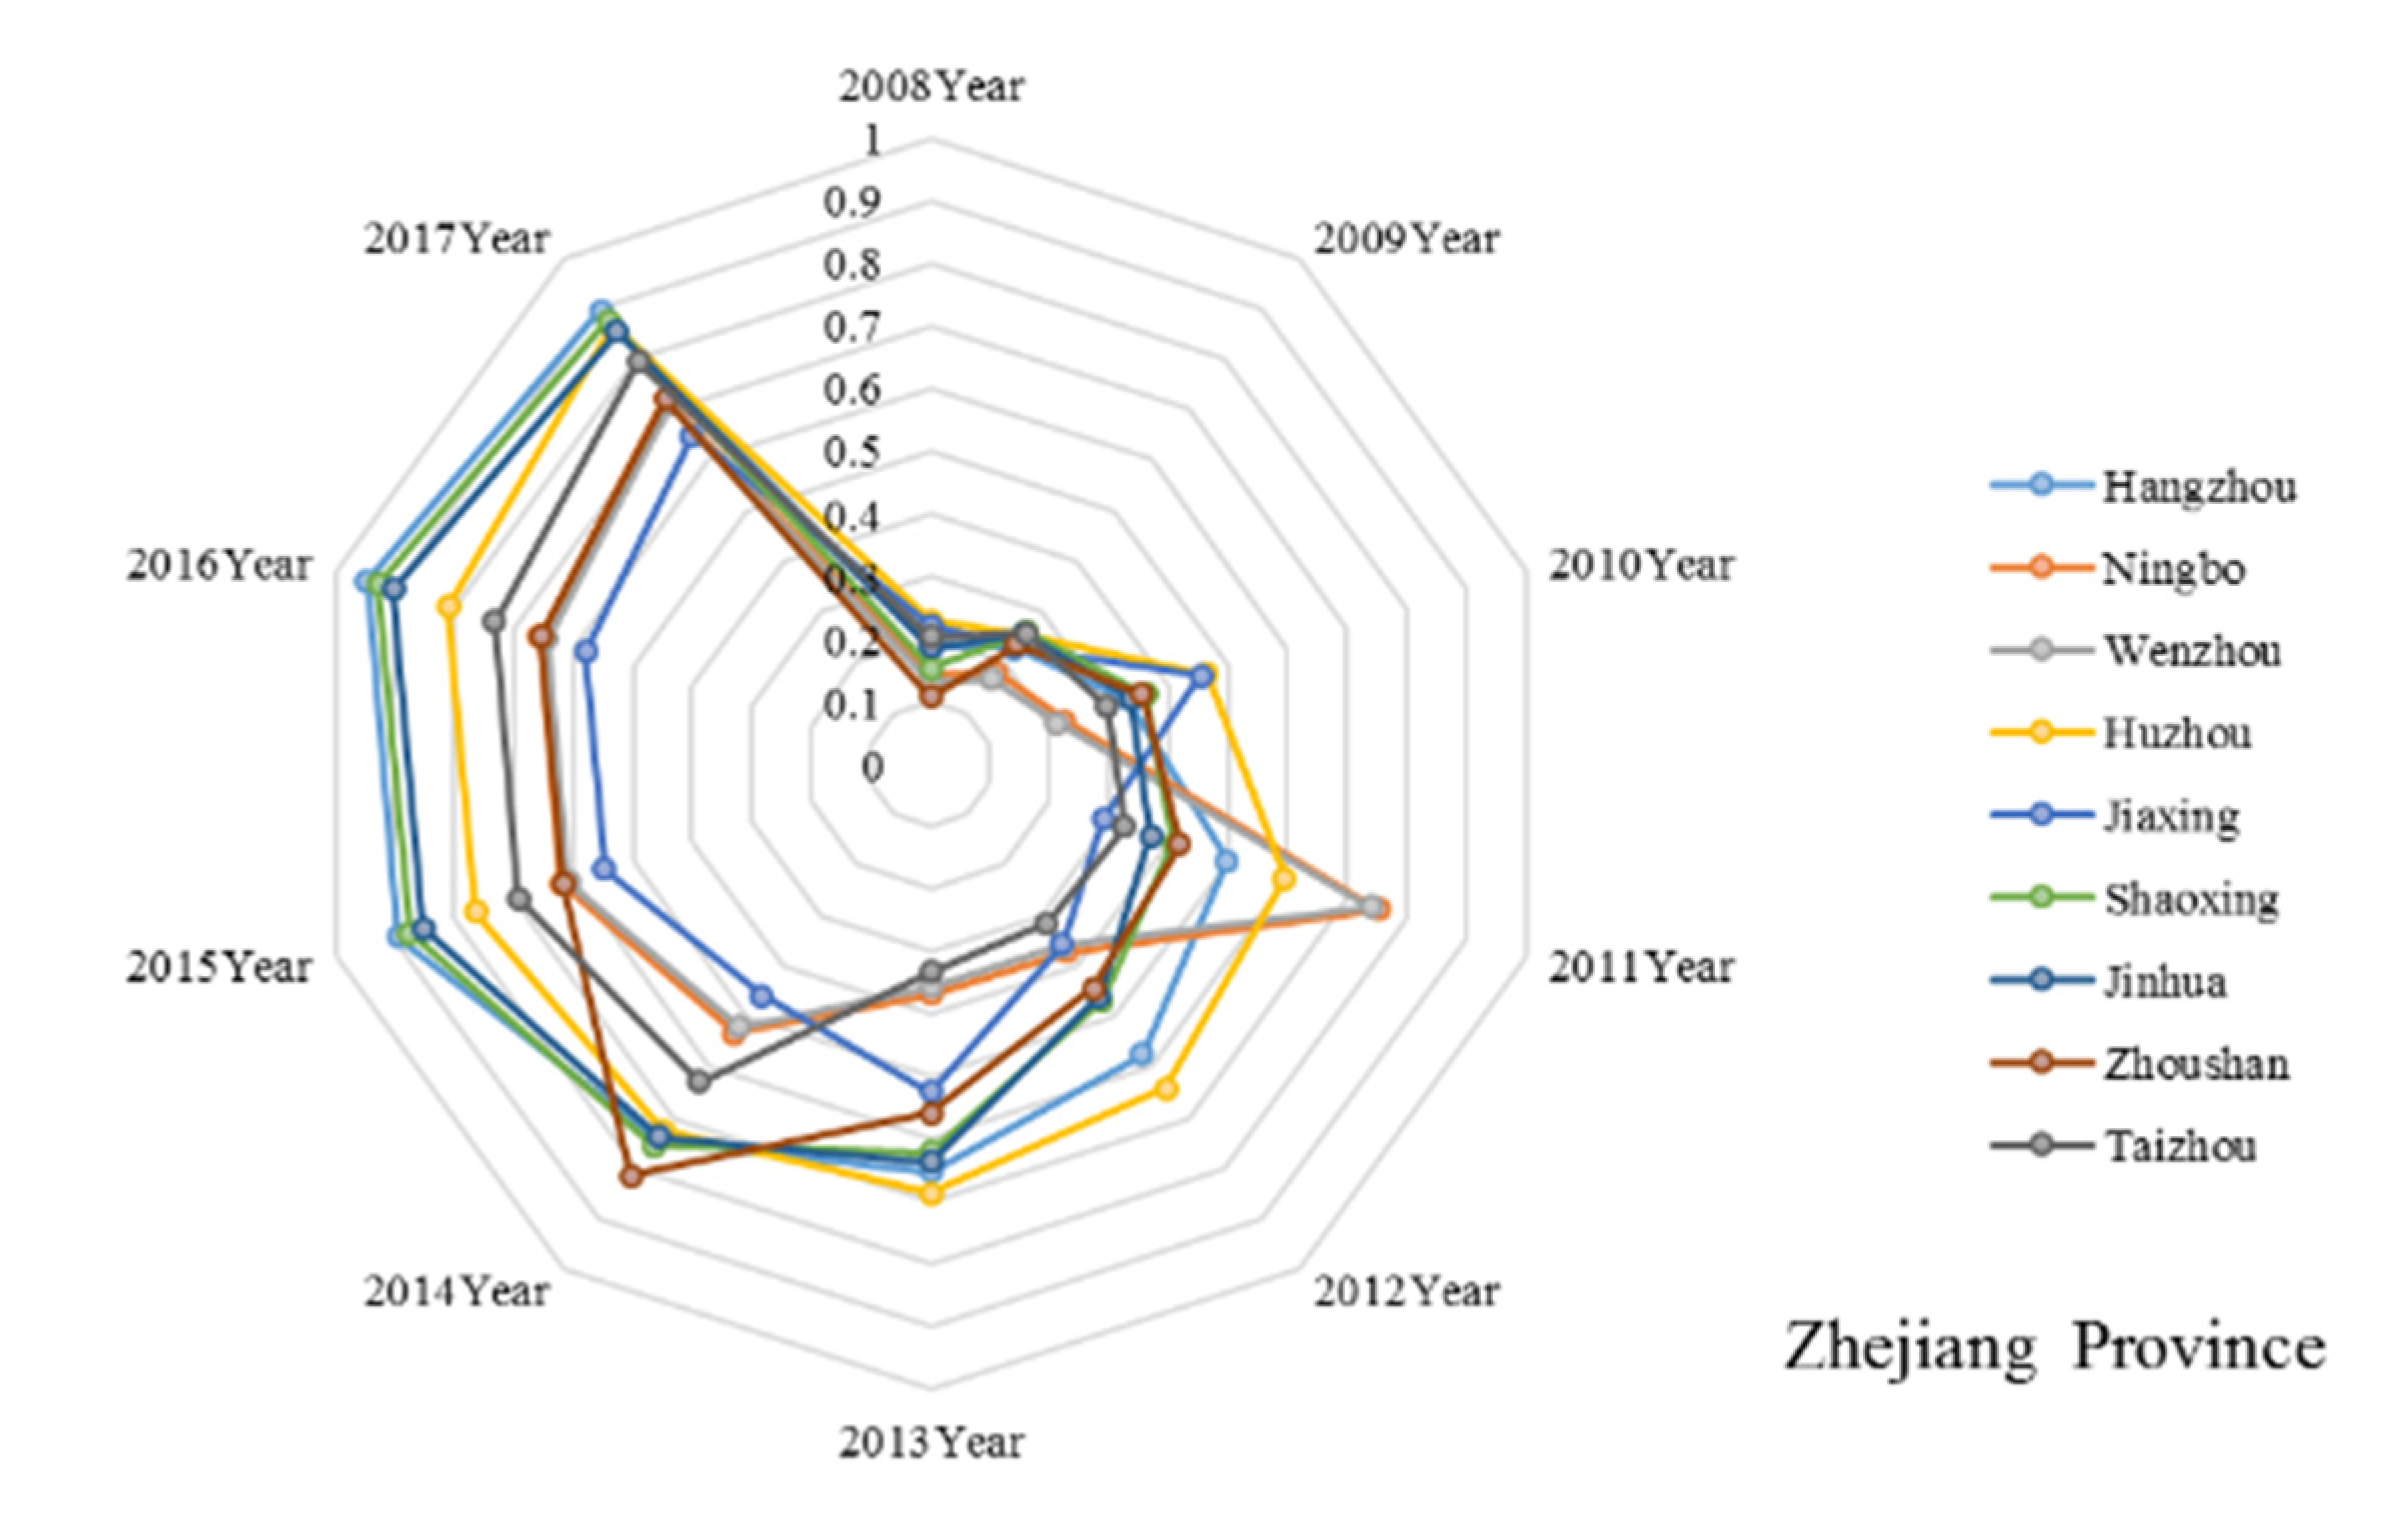
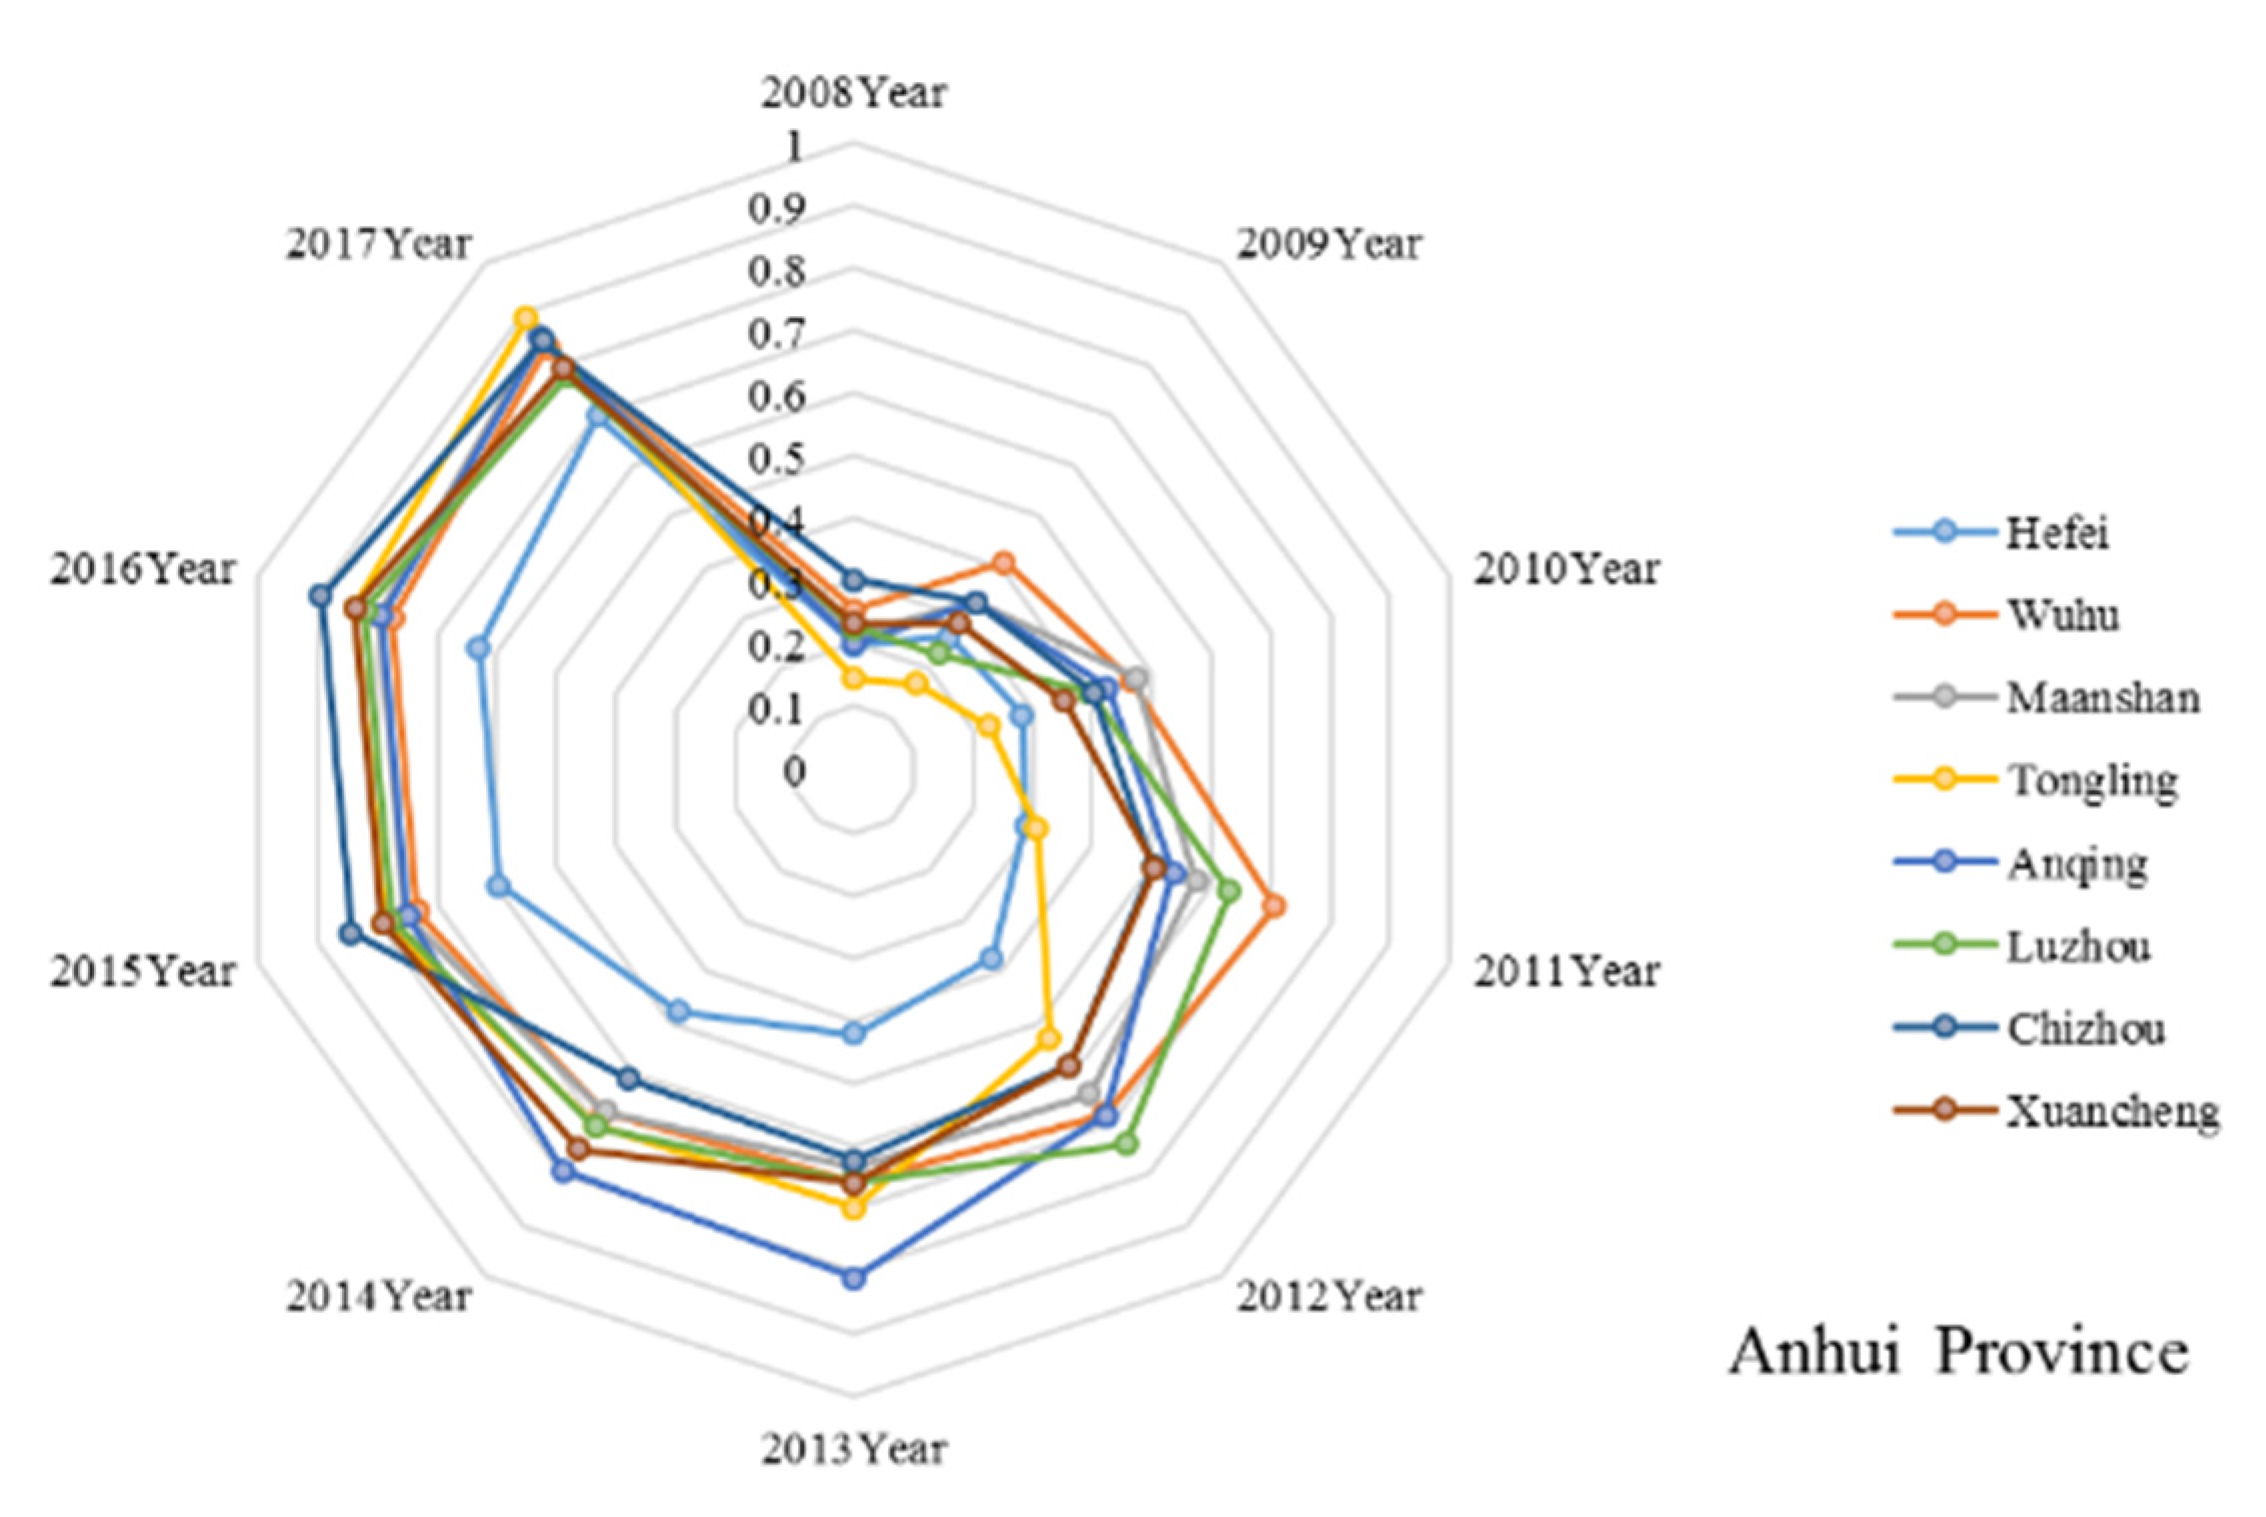
We also separately analyzed the ecological green coordinated development index of nine cities in Zhejiang Province as shown in
Figure 8, and eight cities in Anhui Province, and found that the cities with higher levels of ecological green coordinated development in Zhejiang Province are Hangzhou, Shaoxing, Jinhua, Huzhou and Anhui Province, as shown in
Figure 9. The results showed that cities with higher levels of green coordinated development are Chizhou, Tongling, Anqing, Xuancheng and Wuhu, as shown in
Figure 8. As the capital city of Zhejiang Province, Hangzhou has good synergy between economic development and ecological protection. Although Hefei is the capital city of Anhui Province, its synergy between economic development and ecological protection is low.
5. Discussion
By measuring the ecological green development indexes of 27 cities in the central area of the Yangtze River Delta from 2008 to 2017, the main findings are as follows:
The main driving force for the improvement of the level of regional ecological green coordinated development is the high-quality economic development; that is, the green growth of the urban economy is conducive to the improvement of the level of ecological green coordinated development. From the perspective of the environmental Kuznets curve theory, some city marks in the Yangtze River Delta urban agglomeration have been reflected on the right side of the environmental Kuznets curve. With the rapid economic development of the Yangtze River Delta urban agglomeration, the city’s own economic strength has increased, and investment in environmental governance and ecological protection has also increased, which is conducive to improving the quality of the ecological environment [
62]. At the same time, under the strong supervision of the National Green Development Strategy and the Ministry of Ecology and Environmental Protection [
19], the more prominent air pollution in China and the Yangtze River Delta region has also eased in recent years. According to the data of China’s Eco-Environment Status Bulletin in 2018, the compliance rate of ambient air quality in 338 prefecture-level cities and above in China increased 6.5% from 2017, and the average number of excellent days in 41 cities in the Yangtze River Delta region was 74.1%, an increase of 2.5% from 2017.
The increase in the urbanization level and per capita GDP income of regional cities can indirectly promote the coordinated development of regional ecological green developments. The impetus for the ecological and green coordinated development of the Yangtze River Delta urban agglomeration indirectly comes from the advancement of urbanization, the continuous optimization of urban spatial layout and the construction of livable cities. Regional scientific, technological development and environmental protection technology can improve the comprehensive utilization rate of resources; they promote the utilization rate of new energy development and increase the utilization rate of clean energy, thereby increasing the level of regional ecological green coordinated development.
The main obstacles to the degree of coordinated development of regional ecological green developments are high energy consumption, high pollution [
63] and high emissions [
63,
64] in industrial development. The characteristics of China’s industrial structure and heavy chemical industry are obvious. Industry is the basis for promoting economic growth and increasing government revenue. The heavy industry structure in the Yangtze River Delta region is also relatively obvious. Labor-intensive, pollution-intensive and inefficient production enterprises do not meet the development concept of ecological green development [
64], which significantly reduce the level of ecological green coordinated development in the Yangtze River Delta urban agglomeration. Therefore, the “Outline of Yangtze River Delta Regional Integration Development Plan” issued in December 2019 clearly proposed to promote the formation of a new pattern of regional coordinated development and strengthen the joint protection and co-management of the ecological environment. On the one hand, they need to combine the big data concepts of Industrial Internet with intelligent manufacturing to transform traditional production methods, and adjust the industrial structure in the process of promoting new industrialization and implementing the Industrial Internet in cities in the Yangtze River Delta region. On the other hand, it is necessary to promote the green transformation of new industries in accordance with the requirements of resource conservation and environmental friendliness.
Other obstacles to the degree of regional ecological green coordinated development come from excessive consumption of resources and overload of the total population. Excessive consumption of resources is not conducive to the improvement of the greening level of the Yangtze River Delta urban agglomeration. Excessive resource consumption brings large pollution problems, which does not meet the concept of green development. Affected by regional economic integration and the division of labor in the international value chain, many high-energy-consuming industries are clustered in the Yangtze River Delta region and other economic belts in China, exacerbating pollution emissions, thereby preventing the coordinated development of regional urban ecological green developments. The way to reduce resource consumption in the future is to increase investment in scientific and technological development and environmental protection technology.
In addition, the improvement of environmental protection awareness and the enhancement of collaborative management efficiency are also conducive to the improvement of the level of regional ecological green collaborative development. In the process of regional ecological green coordinated development, cities or regions with higher development levels must play a leading role. Cities with a high level of ecological green coordinated development make use of the ecological environment contradictions and dilemmas faced in the process of economic development, and combine their own advanced experience to solve the ecological environment problems of developed countries. It can form a replicable and popularizable development model.
According to the environmental Kuznets curve (EKC) theory, environmental quality degrades as economic income increases. When the level of economic income rises to a certain level, the environment improves as the economic income increases. The theory indicates that the relationship between environmental quality and income is an inverted U-shape. Part of China’s regions and cities are still on the left side of the environmental Kuznets curve. Stimulated by the traditional economy, China’s Yangtze River Delta urban agglomeration has rapid economic development, and it is unavoidable to exacerbate pollution emissions, which is negative towards of environmental quality.
In the context of the current digital economy and Industrial Internet development, the implementation of new industrialization and new urbanization has further accelerated the economic development of the Yangtze River Delta urban agglomeration. Many cities in the Yangtze River Delta urban agglomeration have sufficient funds to invest in pollution control, and the level of urban ecological green coordinated development will be increased accordingly.
At present, China’s urbanization is the largest, fastest and most far-reaching urbanization in the world. Multiple regions in China are gestating and forming a large market, with urban agglomerations as the main form of three levels, including three world-class urban agglomerations, as well as secondary regional urban agglomerations centered on provincial capitals and small and medium-sized city clusters with characteristic towns as the network nodes. This will have an important demonstration effect on ecological greening and high-quality economic development in other regions, and bring new growth points for global green economic development.
China’s experience in achieving the coordinated development of the economic, social and ecological environment systems is worthy of reference for more developing countries, including from the aspects of cooperation goals, cooperation mechanisms and international cooperation projects, through the realization of regional ecological green coordinated development to gradually achieve the goal of global sustainable development.


