Article

Impacts of Climate Change and Population Growth on River Nutrient Loads in a Data Scarce Region: The Upper Awash River (Ethiopia)

1
School of Geography and the Environment, University of Oxford, Oxford OX1 3QY, UK
2
Geology Department, State University of New York College at Cortland, Cortland, NY 13045, USA
3
Water and Land Resources Centre, Addis Ababa University, P.O. Box 20474/1000 Addis Ababa, Ethiopia
4
AWASH Basin Development Authority, P.O. Box 20474/1000 Addis Ababa, Ethiopia
*
Author to whom correspondence should be addressed.
Sustainability 2021, 13(3), 1254; https://doi.org/10.3390/su13031254
Submission received: 18 December 2020 / Revised: 20 January 2021 / Accepted: 22 January 2021 / Published: 25 January 2021
(This article belongs to the Special Issue Sustainable Water Quality Management in the Changing Environment)

Abstract

:
Assessing the impact of climate change and population growth on river water quality is a key issue for many developing countries, where multiple and often conflicting river water uses (water supply, irrigation, wastewater disposal) are placing increasing pressure on limited water resources. However, comprehensive water quality datasets are often lacking, thus impeding a full-scale data-based river water quality assessment. Here we propose a model-based approach, using both global datasets and local data to build an evaluation of the potential impact of climate changes and population growth, as well as to verify the efficiency of mitigation measures to curb river water pollution. The upper Awash River catchment in Ethiopia, which drains the city of Addis Ababa as well as many agricultural areas, is used as a case-study. The results show that while decreases in runoff and increases in temperature due to climate change are expected to result in slightly decreased nutrient concentrations, the largest threat to the water quality of the Awash River is population growth, which is expected to increase nutrient loads by 15 to 20% (nitrate) and 30 to 40% (phosphorus) in the river by the second half of the 21st century. Even larger increases are to be expected downstream of large urban areas, such as Addis Ababa. However, improved wastewater treatment options are shown to be efficient in counteracting the negative impact of population growth and returning water pollution to acceptable levels.

1. Introduction

Sustainable Development Goals (SDG 6.3) are focused on ensuring countries close the currently existing water resource and water quality gaps, so that people have better access to potable water. This will lead to improved health, reduced child deaths and improvements in sustainable livelihoods. This is especially important in developing countries such as Ethiopia, which lacks resources and the economic capacity to meet the water demand. Ethiopia is a largely rural-based economy, with 80% of the population living outside of cities, and only 3.5 million people living in the capital city, Addis Ababa, out of 110 million inhabitants [1]. Migration of people to the cities is highly likely in the next 30 years as people strive to improve their personal livelihoods [2,3].
The Awash River water quality has been reviewed by Degefu et al. [4], who analysed the water quality of the upper Awash River through a benthic macroinvertebrate-based assessment. They found that the upper Awash River has poor water quality levels due to current farming practices, untreated effluents from factories and poor provision of sanitation facilities to the riparian communities. Furthermore, Prabu [5] found that the use of polluted water from an Awash tributary, the Akaki River, resulted in metal contamination of arable soil and crops. Awash catchment lakes such as Lake Beseka will have a significant impact on water quality by raising salinity levels in the river downstream of lake discharges [6]. Alemayehu [7] and Yimer and Geberkidan [8] identified domestic and untreated industrial wastewater as the main threat to the water quality of the Akaki River. The poor economy and lack of proper waste disposal systems in Ethiopia has led industry and the population to discharge waste illegally within water bodies, thus making the case for improved waste management and wastewater treatment. Similar conclusions were reached by Awoke [9], who advocated urgent action to implement intersectoral collaboration for water resource management that will eventually lead toward integrated watershed management in the Awash catchment.
Climate can also significantly affect water quality in rivers [10,11] altering river flows and hence dilution, creating enhanced storm events with consequent flushing of nutrients, pathogens and chemicals into rivers, and altering instream biochemical processes. Increasing climate extremes can cause huge economic damage and have impact on vulnerable groups, deepening poverty or triggering major human displacement [12,13]. Irrigation is increasing crop production in Ethiopia, but crop production is also threatened by extremes of climate [14,15]. Such climate extremes also affect ecosystems with reduced flows and damage to wetlands and river ecosystems. These also have a disproportionate impact on the vulnerable livelihoods that depend on these environments [16,17].
Nutrients are important as they have a significant impact on the ecosystems of rivers, creating algal blooms that affect water supply and even blooms of highly toxic cyanobacteria [18]. Furthermore, there are direct health effects of nitrates in waters which need to be reduced or avoided if possible. Sources of nutrients can be both point source from domestic and industrial effluent discharges, or from rural runoff from villages and grazing animals. Moreover, large irrigation areas utilise increasingly large quantities of fertilizers and chemicals and much of this will get flushed into river systems. A major issue in understanding the links among environment, climate change and water use is the relative paucity of data. This issue makes quantitative analysis of water resource systems more difficult.
In this paper we aim to fill this gap by using a combination of global datasets as well as locally collected data in order to evaluate water flows and river water quality in the Awash River Basin in Ethiopia [6,19]. We make use of the Integrated Catchment (INCA) model [20,21,22] of flow and nutrients in order to assess nutrient issues along the Awash, addressing the impact of Addis Ababa at the headwaters of the Awash and rural diffuse runoff from waste disposal and animal populations downstream. We evaluate scenarios of climate change to look at extremes and consider the population growth, in particular the movement or migration of people to Addis Ababa, in order to evaluate future impacts. We also explore mitigation measures to assess how clean up strategies can improve the situation in the future. Such scenarios and assessments can then be used by government and water managers to address these serious issues for either national policy or river basin management. The novelty in this paper is that it is the first time a dynamic process-based model of flow and nutrients has been developed for the Awash river system and the first time a set of climate, population and mitigation scenarios have been investigated.

2. Methods

2.1. The INCA Model

The INCA (INtegrated CAtchment) model is one of the most used catchment-scale water quality models in the scientific literature [23]. It was developed in the late 1990s as a Flow and Nitrogen model [20]. It was subsequently updated to add other water quality variables such as phosphorus [24,25]. It has been recently used for several applications, in the UK [26,27,28,29] and all over the world [30,31,32,33,34]. In this study, the INCA-N 1.0.15 (INCA nitrogen) and INCA-P 1.4.11 (INCA phosphorus) versions were used. The model structure is described in detail in [24,25]. For the sake of brevity and simplicity, only a short and summarised description is reported in this paper.
INCA is a semi-distributed physically based but dynamic flow and quality model. Its hydrological sub-model simulates the transformation of rainfall into runoff and the propagation of water through a river network. INCA does not compute evapotranspiration and canopy interception, and therefore needs daily time series of precipitation, temperature, hydrologically effective rainfall and soil moisture deficit as inputs. Precipitation and temperature are obtained from measurements, while hydrologically effective rainfall and soil moisture deficits are estimated using another hydrological model, PERSiST [35]. PERSiST (the Precipitation, Evapotranspiration and Runoff Simulator for Solute Transport) is a semi-distributed catchment-scale rainfall-runoff model specifically designed to provide input series for the INCA family of models. It is based on a user-specified number of linear reservoirs and reproduces a variety of hydrological processes, such as snow melt, direct runoff generation, soil storage, aquifer storage and stream network movement.
The INCA nitrogen sub-model simulates the nitrogen cycle in catchments, from the main sources (atmospheric deposition, fertilisers, wastewater) to the river network. Both nitrate and ammonium are considered as common forms of nitrogen in catchments. Some of the processes modelled are soil processes and include denitrification, nitrification, immobilisation, mineralisation and leaching towards the river system and aquifers. Instream biochemical processes such as nitrification and denitrification are also incorporated into the model equations. Analogously, the INCA phosphorus sub-model simulates the phosphorus cycle from the main sources of phosphorus, both diffuse (fertilisers) and point (wastewater), and the main processes involving phosphorus, such as sorption/desorption [36].

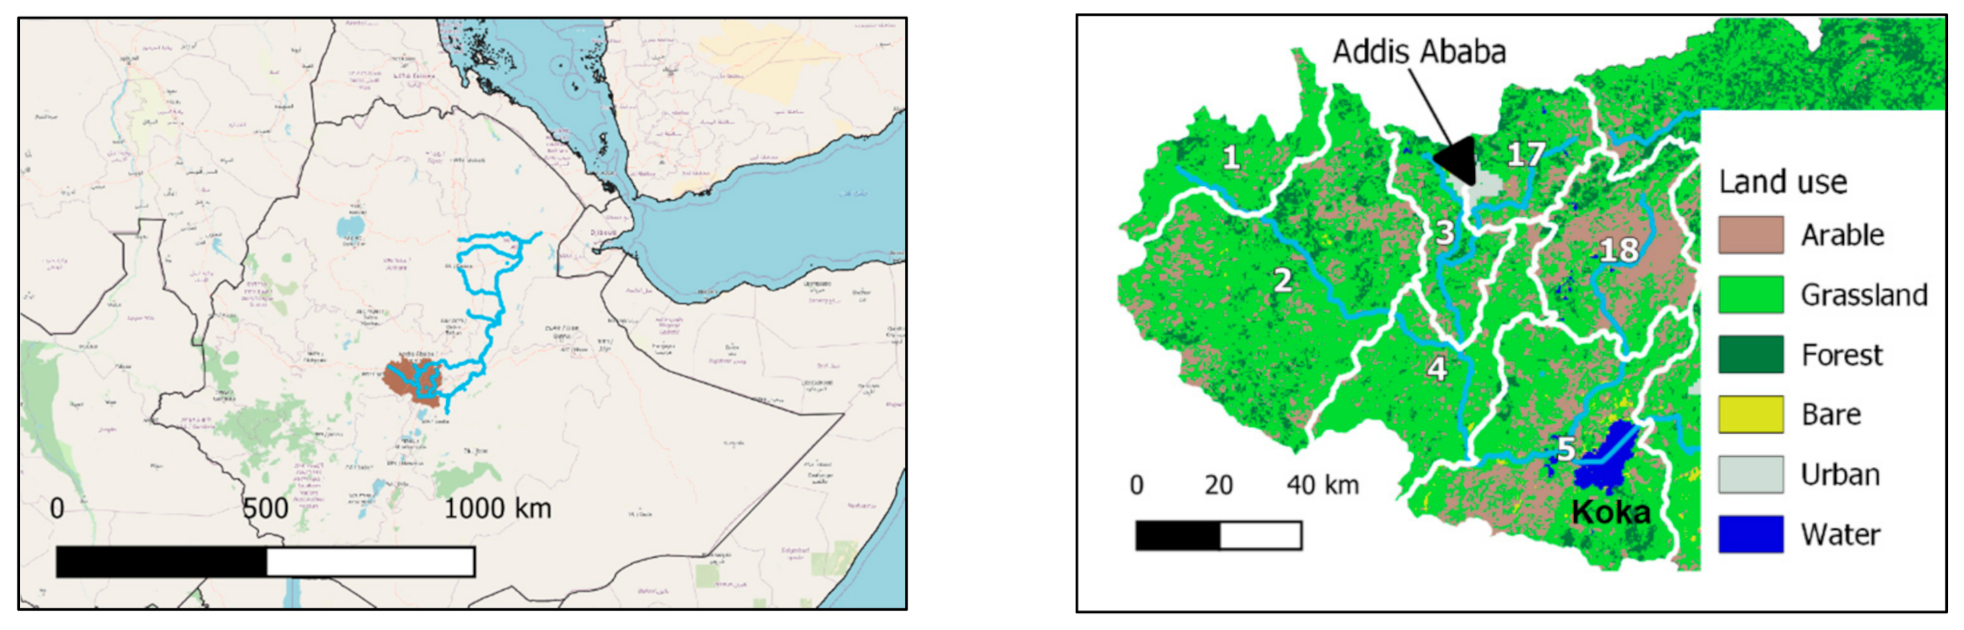
2.2. The Awash River Catchment

The Awash River originates from the highlands of central Ethiopia, at an altitude of about 3000 m above sea level. It flows through the Great Rift Valley and follows the valley for the rest of its course to Lake Abe on the border with the Djibouti Republic. The total length of the river is about 1200 km and its catchment area is 114,000 km2 [37], of which 54% drains to the main river or its tributaries. The climate of the Awash River Basin varies from humid subtropical over central Ethiopia to arid over the Afar lowlands.
This study focuses on the upper Awash River catchment (i.e., the part of the catchment that drains to the Koka Reservoir), as shown in Figure 1. Figure 1 shows the location of the Upper Awash catchment, which covers an area of 11,600 km2 (10% of the basin), and includes the city of Addis Ababa, the capital of Ethiopia. The land use of this catchment is characterised by extensive grassland but also large areas of arable land, as shown in Figure 1), and a large urban area in its northern part of the city of Addis Ababa, which is drained by the River Akaki. Most of the water used for irrigation is drawn from the River Awash or from the Koka Reservoir.

2.3. Sources of Data

As a source of daily rainfall data for the INCA model, the Climate Hazards Group Infrared Precipitation with Stations v2.0 (CHIRPS [38]) was used [19]. CHIRPS is a global dataset of rainfall that blends satellite-based and gauge-based rainfall estimates with a 0.05° resolution. It is particularly useful in data-scarce regions such as the Awash catchment, as it complements the few rain gauges available with satellite-borne data. Daily temperature data were obtained from a network of local weather stations. Both precipitation and temperature were obtained for the time period 1986–2016.
Land use information was derived from the GlobCover land use maps [39]. GlobCover is an ESA (European Space Agency, Paris, France) from the 300 m MERIS sensor on board the ENVISAT satellite mission. The elevation information was obtained from the Shuttle Radar Topography Mission (SRTM), as described by Jarvis [40]). SRTM is an international research effort to obtained digital elevation models on a near-global scale from 56° S to 60° N. Atmospheric deposition data were obtained from the global map of atmospheric nitrogen deposition 1993 [41], distributed by the Distributed Active Archive Centre for Biogeochemical Dynamics of the Oak Ridge National Laboratory (DAAC ORNL, Oak Ridge, TN, USA). The effluent inputs were derived based on the population density, obtained from the Gridded Population of the World (GPW) of the Socioeconomic Data and Applications Centre (SEDAC) [42]. In the Awash catchment, a large part of the diffuse input of nitrogen and phosphorus is represented by animal production (i.e., the use of animal manure as fertiliser as well as the depositions of freely grazing livestock). Data regarding the number of grazing animals per district were provided by the Awash River Basin Authority [43], and the total nutrient input per sub-catchment was computed based on literature values of annual rates of production per animal.
Daily streamflow data were obtained from three local stations managed by the Awash Basin Authority, located at the downstream end of sub-catchments 2, 4 and 18 of the INCA catchment structure, as shown in Figure 1. Streamflow data cover the period 1986–2016, with few gaps. Water quality data were also obtained from measurements carried out by the Awash River Water Authority at two locations (downstream end of reach 5 and 18).

2.4. Modelling Approach

The INCA model was set up for the whole of the Awash catchment but, because of the lack of downstream data and the presence of the large Koka Dam, only the upper Awash catchment is considered here. The upper section of the river system has been divided into seven sub-catchments and hence seven river reaches, as shown in Figure 1 and Table 1. Four reaches lie on the main stem of the Awash river (1, 2, 4 and 5) and the other three on tributaries. The characteristics of the reaches (area, land use and population) are shown in Table 1. The urban areas of Addis Ababa are located in sub-catchments 3 and 17.
For every sub-catchment, time series of daily precipitation and temperature were generated by averaging the original precipitation and temperature data over each sub-catchment. The model was calibrated by adjusting the most influent model parameters to reproduce observed streamflow and water quality. Following [44], a Monte Carlo calibration procedure was implemented by generating randomly 10,000 parameter sets, within a range of feasible values based on the INCA model parameters of other catchments, and a model run was completed for each parameter set. The selection of the best parameter sets was based on the Kling-Gupta efficiency (KGE [45], computed on monthly flows and concentrations of nitrate and phosphorus at all the locations where observations are available. The calibrated parameters were: (i) hydrological module parameters: direct runoff residence time, soil water residence time, ground water residence time, threshold soil zone flow, rainfall excess proportion, maximum infiltration rate and discharge/velocity relationship coefficient and exponent; (ii) INCA-N model parameters: denitrification rate in soil and river, nitrification rate in soil and river, mineralisation rate in soil and immobilisation rate in soil; (iii) INCA-P model parameters: sorption coefficients for soil, river and bed sediment processes. For more information regarding the model parameters, the reader is referred to the original INCA publications [24,25]. The model was calibrated over the time period 1986–2000 and validated over the period 2001–2016.
Once the model was calibrated and validated, several scenarios were run to assess the impact of climate change, population growth and effluent pollution mitigation. The impact of climate change was assessed by employing the change factor method [46]. This method consists of analysing the changes to atmospheric variables (and in particular to precipitation and temperature) predicted by climate models for the area of study (for example, changes in the mean, in the seasonality, in the extremes, etc.) and then applying the same changes to the input time series of the baseline simulation (in this case, the calibration/validation 1986–2016 time period) to obtain resulting time series of altered flow and nutrient loads. This methodology has the advantage that the model results do not need to be bias corrected, which is an advantage for areas such as Eastern Africa, where climate projections can indeed identify patterns of climatic changes but have a poor resolution. In this study, the change factors identified by Taye et al. [19] for the Awash catchment were used. Taye et al. [19] used three climate models from the Coupled Models Inter-comparison Project phase 5 (CMIP5), three future periods (2006–2030, 2031–2055 and 2056–2080) and the RCP8.5 (representative concentration pathway 8.5) emission scenario and estimated future water availability in the Awash catchment. We selected these models based on their historical skill in the Awash using both their atmosphere-only and coupled model simulations of rainfall and temperature [47]. This is important to note because the model projections used in this study will not represent the full range of future projections (from the CMIP5 ensemble) for the region, but they represent a set of futures from models that have good skill in the historical period (last 25 years).
Taye et al [19] estimated change factors for precipitation and temperature as the difference between values in the baseline conditions and values for the future time slices. In particular, change factors were estimated in a spatially distributed manner (i.e., over a regular grid) and on a monthly scale (i.e., a different value for every month of the year). In the present study, the average change factors for the period 2031–2055 and 2056–2080 were used to alter the baseline temperature and precipitation series and create potential future climate series to be used as input for the INCA model, in order to obtain values of streamflow and nutrient loads impacted by climate change. Figure 2 shows the resulting monthly average precipitation and temperature time series for the upper Awash catchment. Note, there is a significant increase in temperature predicted by the climate models, but this reflects the worst-case scenario as represented by the RCP8.5 scenario selected by the climate modellers.
The impact of population growth was accounted for by altering the effluent flows from sewage treatment plants proportionally to the population projections contained in the World population trends of the United Nations [1]. This report indicates an average increase of 58% for the 2031–2055 period and of 110% for the 2056–2080 in Ethiopia. Therefore, the effluent flows previously computed based on the current population were increased accordingly, keeping the effluent concentration of nutrient at the same level (i.e., assuming that no changes in wastewater treatment are applied). Figure 3 shows the projected population growth for Ethiopia.

2.5. Mitigation Measures and Scenario Analysis

When considering mitigation measures, the most likely is an improvement in the treatment of effluents at sewage treatment plants. Typically, across the world, the move from primary and secondary treatment to incorporate tertiary treatment can reduce nutrient loads by approximately 50% [48], although this will vary depending on the particular technology adopted. The impact of wastewater pollution reduction (mitigation) was estimated by analysing a scenario in which the concentration of nutrients in the wastewater is reduced by half the baseline scenario. Therefore, this paper analyses whether a significant improvement of wastewater treatment abilities would translate in an equally significant improvement in river water quality.
In summary, the following scenarios were analysed:
(1)
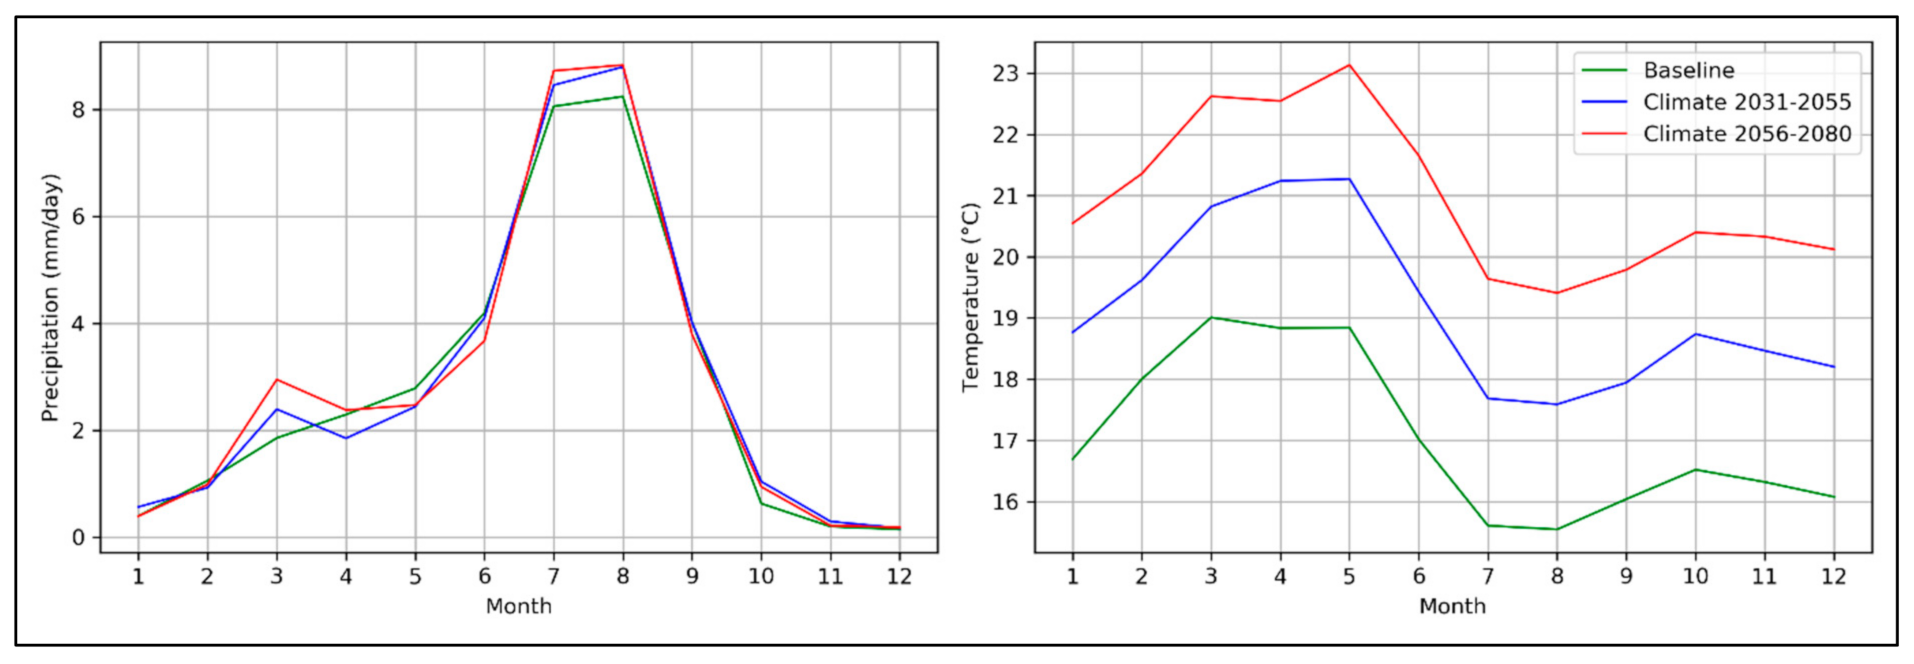
Baseline (1986–2016 observed precipitation and temperature as input, current population, current wastewater treatment levels);
(2)
Climate change 2031–2055 (1986–2016 precipitation and temperature altered with 2031–2055 change factors as input, current population, current wastewater treatment levels);
(3)
Climate change 2056–2080 (1986–2016 precipitation and temperature altered with 2056–2080 change factors as input, current population, current wastewater treatment levels);
(4)
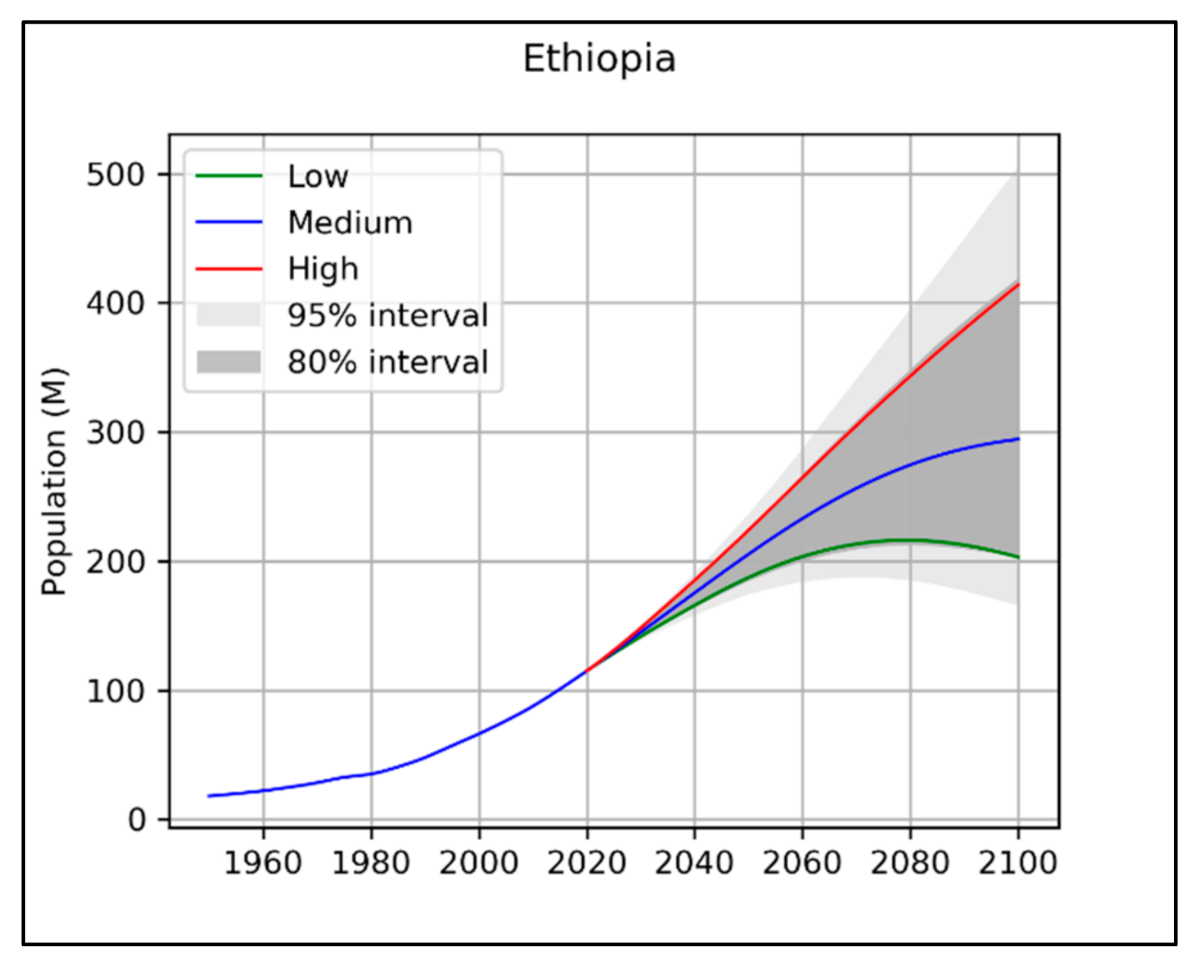
Climate change 2031–2055 plus population growth (1986–2016 precipitation and temperature altered with 2031–2055 change factors as input, 2031–2055 population, current wastewater treatment levels);
(5)
Climate change 2056–2080 plus population growth (1986–2016 precipitation and temperature altered with 2056–2080 change factors as input, 2056–2080 population, current wastewater treatment levels);
(6)
Climate change 2031–2055 plus population growth plus mitigation (1986–2016 precipitation and temperature altered with 2031–2055 change factors as input, 2031–2055 population, improved wastewater treatment);
(7)
Climate change 2056–2080 plus population growth plus mitigation (1986–2016 precipitation and temperature altered with 2056–2080 change factors as input, 2056–2080 population, improved wastewater treatment).
While in scenarios 4, 5, 6 and 7 the population growth was assumed homogeneous in space, in reality the population is growing at an uneven pace in rural and urban areas [2,3]. Urban areas are attracting more and more population, while population in rural areas is not growing or is even decreasing. Indeed, between 1990 and 2019 the proportion of the population living in urban areas has increased from 12.6 to 21.2% (World Bank 2020—http://data.worldbank.org). For this reason, the effect of uneven population growth and urbanisation was also explored, by assuming that the population in rural areas remains the same as present, while the population in urban areas (reaches 3 and 17) grows [1].

3. Results

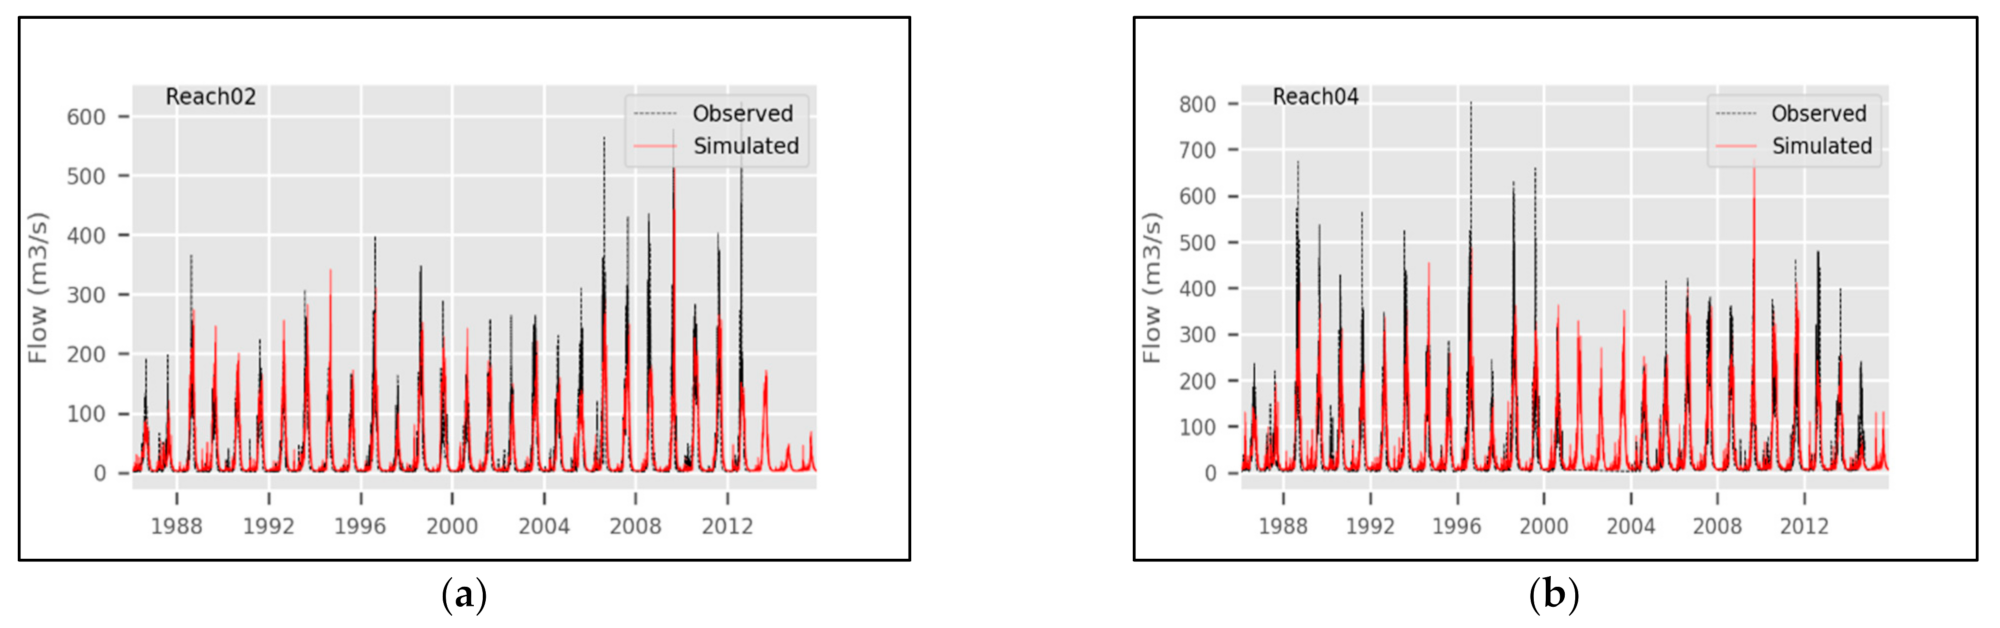
3.1. Model Implementation

The INCA model was calibrated and validated to reproduce observations of stream flow and nutrient concentrations. Based on the parameter set selection criteria outlined above, 15 parameter sets were selected as the best model set-ups. Figure 4 and Figure 5 show the results of the model for the historical period, and Table 2 shows the goodness of fit indices of the model validation (note that, since an ensemble of 15 model parameter sets was used, there are 15 model results, and the figures and tables report the range of results rather than a single figure). The Kling-Gupta efficiency (KGE) was used to assess model success, combining the three components of Nash-Sutcliffe efficiency (NSE) of model errors (i.e., correlation, bias, ratio of variances or coefficients of variation) in a more balanced way. The KGE has been widely used for calibration and evaluation hydrological models in recent years [45] The model reproduces very well the observed flow, while the reproduction of the nutrient concentrations and loads is less satisfactory, partly because of the limited dataset available for calibration and validation.

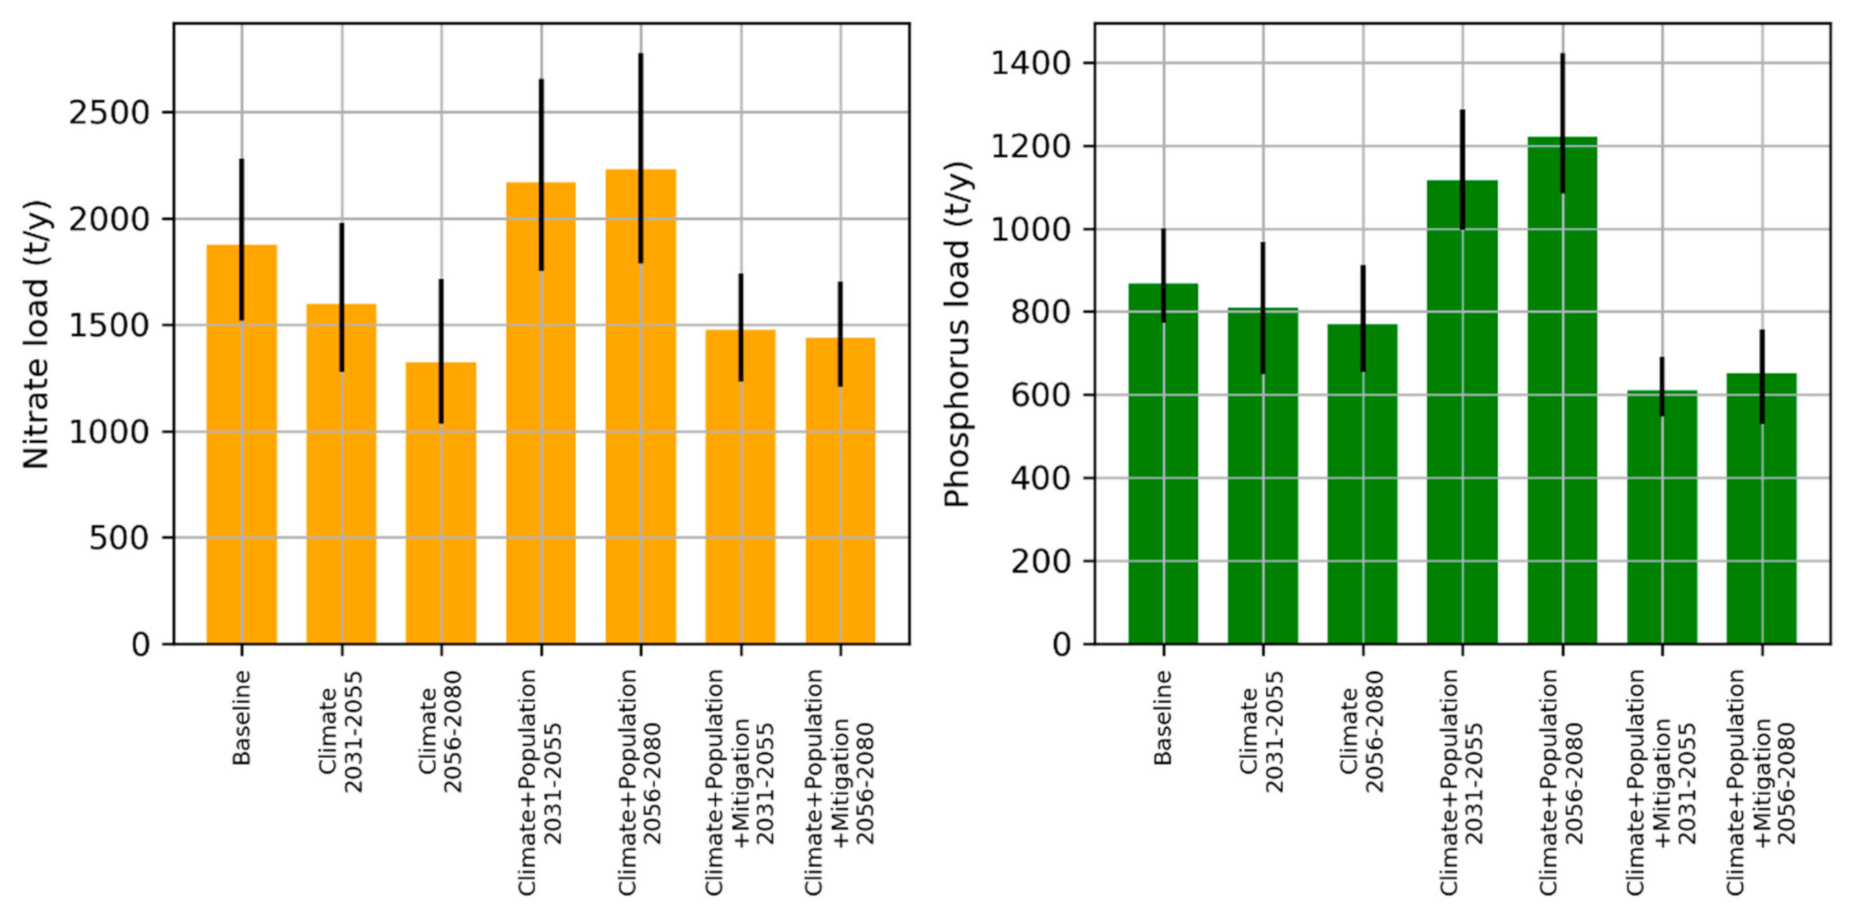
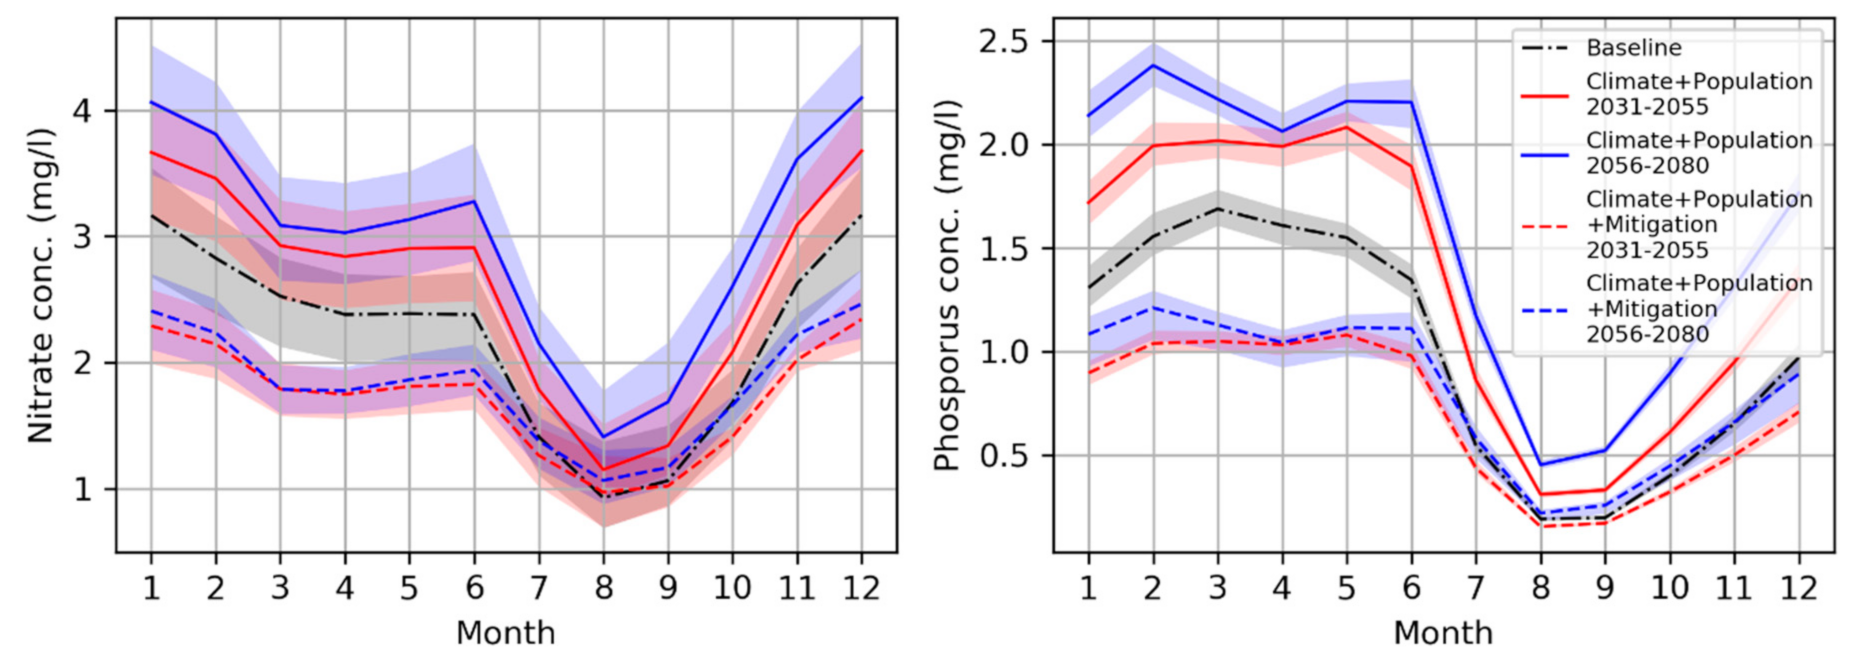
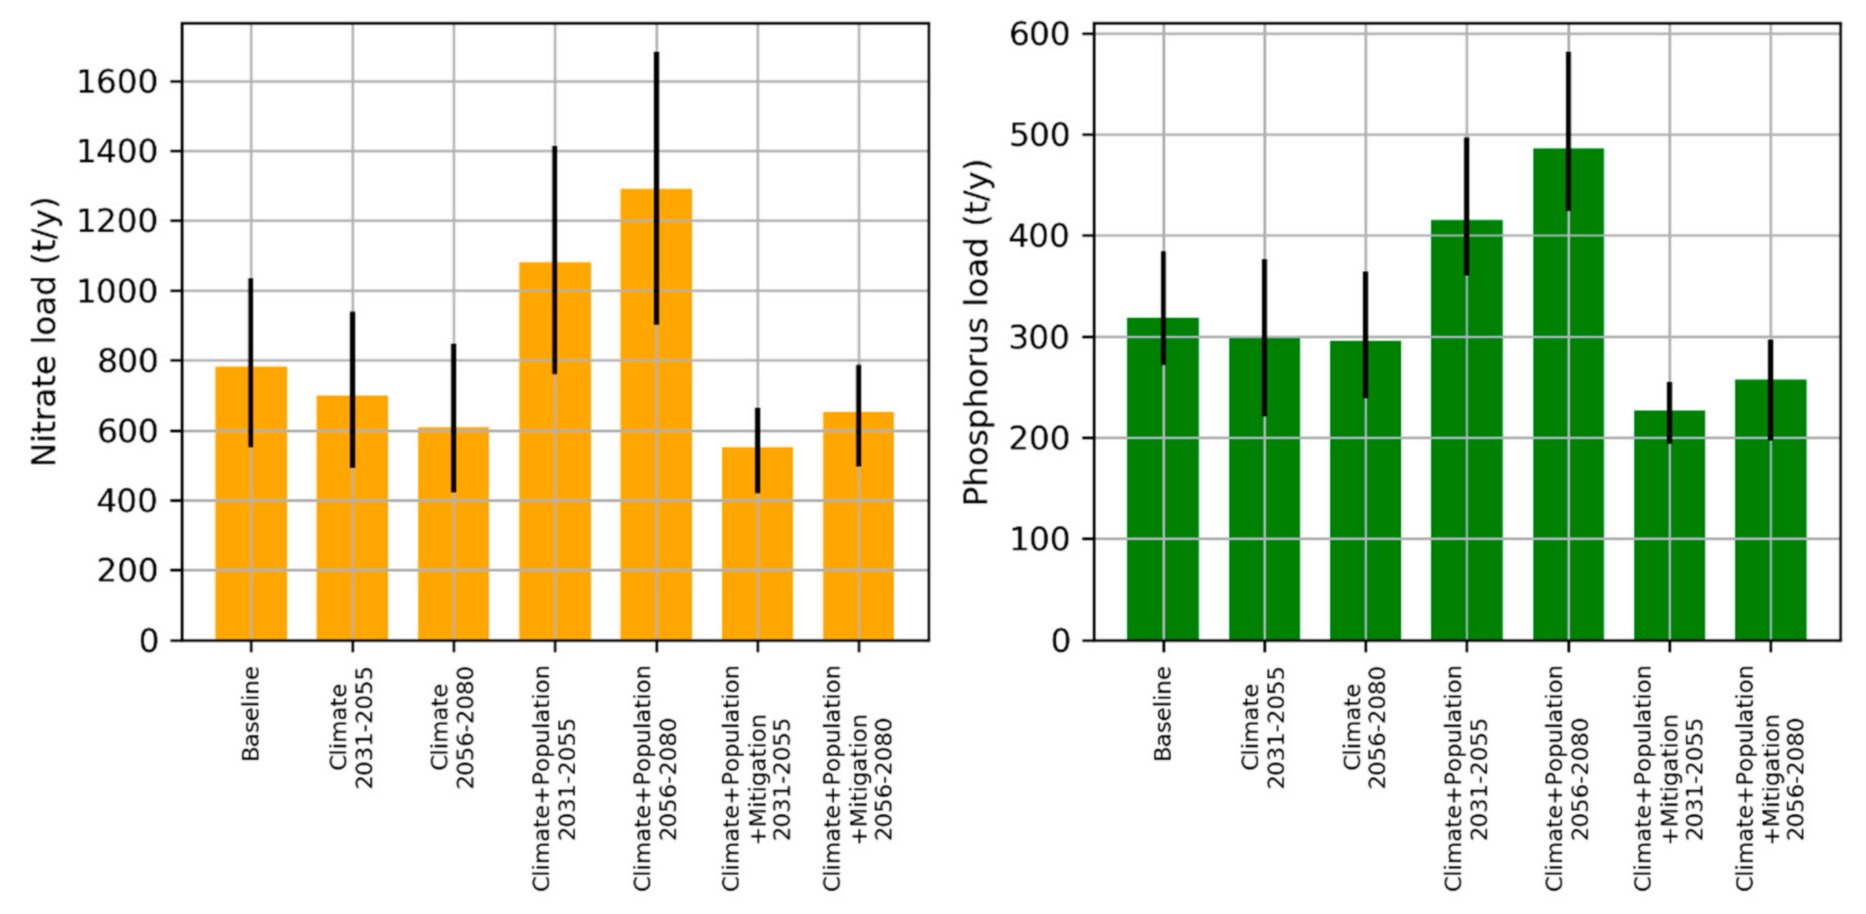
3.2. Future Scenarios

Scenarios of future climate, population and wastewater treatment were analysed using the calibrated and validated INCA model. Figure 6 shows the resulting annual loads of nitrate and phosphorus for several combinations of future climate, population growth (considered spatially homogeneous) and wastewater treatment at the lowermost reach of the upper Awash (i.e., the inlet of Koka Reservoir). The values are also reported in Table 3, along with their variation from the baseline scenario. It can be noticed that future climate is expected to lower the total loads of nutrients, due to a decreased runoff and soil moisture (caused mainly by the increase in temperature and, consequently, in evapotranspiration), while population growth is expected to cause an average increase in nitrate loads of 15% and in phosphorus load of 28% compared to the baseline scenario for the 2031–2050 time period (although the net increase caused by population, without accounting for changes in climate, is larger, 35% for nitrate and 41% for phosphorus, due to the fact that the climate change signal is of opposite sign of the signal of population growth). Halving the nutrient concentration in the wastewater would obtain a very significant impact on nutrient loads, as it would counter the effect of population growth and reduce the nutrient loads by 23% (nitrate) and 28% (phosphorus) compared to the baseline scenario, and despite the increased pressure to the river system caused by population growth.
Figure 7 shows the monthly variation of the nutrient concentration in the River Awash under some of the scenarios described above. While the seasonal pattern of nutrient variation is predicted to be substantially the same, the largest variations are predicted to be during dry season, when low flows reduce the dilution effects. This poses a risk for water supply for drinking and irrigation purposes at a time of the year when it is fundamental for livelihoods of people, industry and communities in the catchment. Figure 7 shows quite significant increases in nitrate and phosphorus in the river system driven by population increase and changes in temperature, rainfall patterns and flow.
The figures and tables above show the impact of climate change, population growth and mitigation at Lake Koka, assuming spatially homogeneous population growth. As stated in Section 2.4, the impact of urbanisation was also analysed, by considering that all the population exceeding current levels migrate to the city of Addis Ababa. While this scenario of population growth does not have a much different impact on the water quality at the outlet of the upper Awash catchment (inlet of Koka reservoir, reach 5) compared to the homogeneous population growth scenario, it does have a significant impact on the water quality of both the Little and Great Akaki Rivers which carry the effluents from Addis Ababa (reach 3, see Figure 1). Figure 8 shows the impact of the different scenarios on nutrient loads in the Akaki River considering uneven population growth. Comparing this figure to Figure 6, it can be noticed that the relative effect of the population growth scenario is larger. For example, it increases the nitrate load by 37% and the phosphorus load by 32% by the time period 2031–2055, and by 65% and 55% respectively by the time period 2056–2080, although mitigation still seems efficient in curbing water pollution.

4. Discussion and Conclusions

As shown in Figure 4 and Figure 5, the model calibration and validation performance is very good from the point of view of the flow reproduction, while the nutrient concentration and load prediction is less satisfactory, due to the scarcity of data. This is actually quite common in water quality studies where flow data tends to be monitored fairly accurately and on an hourly or daily basis, but rivers are sampled infrequently (e.g., monthly) for water quality analysis. Thus, uncertainty increases with water quality modelling, but even limited data can be used to ensure the models are reflecting the main dynamics of the river system.
In this study, we have undertaken two approaches to reduce model uncertainty and increase the reliability of the model results. The first is to use a physically-based model, whose reliability has been tested in several catchments all over the world, both under scenarios of good data availability [26,28] and in data-scarce regions [33,34]. The second one is to calibrate the model using a Monte Carlo-based objective technique and using an ensemble of 15 model parameter sets rather than a single realisation of the model, to account for parametric uncertainty [18,49]. Such measures are always advisable when conducting quantitative assessments of environmental variables and have the advantage of providing a representation of the model results uncertainty. However, they are certainly limited and cannot completely go without comprehensive and reliable datasets of locally collected measurements. One recommendation from this study is to increase the monitoring systems so that an increased sampling frequency can enhance the analysis of water quality in the Awash River System. An enhanced water quality monitoring system is fundamental to assist decision making and decision support tools for catchment managers and policy makers.
Despite the large uncertainty of the nutrient load figures resulting from the model, the relative changes from the baseline can be interpreted as more reliable than the absolute values. This is because some of the model biases are constant under all scenarios and thus can be eliminated when computing percentage variations from the baseline. A further sign of reliability of the relative changes computed from the model is that all model parameter sets consistently indicate the same variation from the baseline (with small differences). Therefore, the percentage variations indicated in Table 3 can be taken with more confidence than the absolute values. They show that the climate change signal, which is likely to reduce rainfall and increase evapotranspiration [19,50], is likely to reduce runoff and therefore to reduce diffuse nutrient loads from agricultural areas. However, the reduction is predicted to be small, especially for phosphorus, for which the diffuse-source input has a relatively low importance compared to the inputs from wastewater effluents. Furthermore, the model results indicate that the expected variation of nutrient loads triggered by climate change are all within the range of uncertainty of the model forecasts (see the uncertainty bars in Figure 6, which describe the variance of the model results), thus suggesting that the amplitude of the climate change impact signal is within the variability of the natural processes under baseline climatic conditions.
Conversely, the model results indicate that the impact of population growth and urbanisation will have a greater influence than climate change on river water quality. In this case, the effect of population growth seems to be much clearer and beyond the expected natural variability of the processes. Hence, the model results suggest that a strong deterioration of the water quality is to be expected under population growth scenarios, especially in the Akaki River, which drains the city of Addis Ababa, where the nutrient loads could increase by up to one third (nitrate) and more than 50% (phosphorus) compared to the baseline conditions, greatly increasing the potential for eutrophication. This could, in turn, trigger problems for the use of water by riparian communities, in terms of drinking water supply for human and livestock consumption, for irrigation and in terms of suitability of the river as a wastewater recipient. All these factors could further contribute to the movement of rural population to the metropolitan area of Addis Ababa.
This paper has also analysed the impact of potential mitigation measures. While the actual effect of real mitigation measures cannot be analysed in this paper, because the real extent of such measures strictly depends on policy assumptions that are beyond the scope of this paper, the model results seem to suggest that investing in improved wastewater technology is an efficient way to tackle river water pollution in the Awash. However, it must be noted that the model results must be interpreted as potential scenarios of future impacts rather than real forecast, and their reliability should be reassessed once more detailed data about wastewater treatment technology become available.
The results of this paper and their uncertainty also make the case for producing a much larger literature on climate change and land use change/population growth impacts on river water quality, especially in data scarce regions and developing countries such as Ethiopia. No previous analytical studies of climate change and population growth impacts are available for comparison in this area. Therefore, the present paper should be interpreted as a first step towards a more comprehensive assessment of the effects of climate and anthropogenic stressors on water quality. This is an issue of paramount importance for livelihoods and for the future of rapidly developing countries such as Ethiopia.
As this study has proven, applying quantitative techniques in data scarce regions of the world has many limitations. Nevertheless, it is a useful exercise as a way to demonstrate what analysis is possible and in order to illustrate the value of global data sets. Also, models need to assess the uncertainty around any predictions caused by limited data sets, as well as parametric uncertainty concerning the calibration and validation of models. In this paper we have made use of global datasets such as GlobCover [39] and CHIRPS [38] to fill regional data gaps, and the Monte Carlo analysis has been used to assess the uncertainty issues. Another area of uncertainty is that of future climate change, although the global atmospheric models are getting better all the time. Here we have used a change factor analysis for climate change and this overcomes the problems of coarse resolution climate projections and lack of data for bias correction. Further research is certainly needed, together with new global or regional datasets, to tackle such an important issue.

Author Contributions

Conceptualization, G.B., P.G.W., K.J.C.; methodology, G.B., P.G.W., E.D., M.T.T., L.J.; validation, G.B.; investigation, Y.A.Y., L.J.; writing—review and editing, G.B., P.G.W., L.J., M.T.T., E.D., F.A.H., Y.A.Y., K.J.C. All authors have read and agreed to the published version of the manuscript.

Funding

UK Foreign: Commonwealth and Development Office (FCDO) for the benefit of developing countries (Programme Code 201880).

Institutional Review Board Statement

Not Applicable.

Acknowledgments

This document is an output from the Oxford University Projects ‘Improving Security for the Poor ‘(REACH) programme funded by UK Aid from the UK Foreign, Commonwealth and Development Office (FCDO) for the benefit of developing countries (Programme Code 201880). However, the views expressed, and information contained in it are not necessarily those of or endorsed by FCDO, which can accept no responsibility for such views or information or for any reliance placed on them.

Conflicts of Interest

The authors declare no conflict of interest.

References

  1. United Nations. World Population Prospects; Department of Economics and Social Affairs, United Nations: New York, NY, USA, 2019. [Google Scholar]
  2. Arsiso, B.K.; Mengistu Tsidu, G.; Stoffberg, G.H.; Tadesse, T. Influence of urbanization-driven land use/cover change on climate: The case of Addis Ababa, Ethiopia. Phys. Chem. Earth 2018, 105. [Google Scholar] [CrossRef]
  3. Van Rooijen, D.J.; Biggs, T.W.; Smout, I.; Drechsel, P. Urban growth, wastewater production and use in irrigated agriculture: A comparative study of Accra, Addis Ababa and Hyderabad. Irrig. Drain. Syst. 2010, 24. [Google Scholar] [CrossRef] [Green Version]
  4. Degefu, F.; Lakew, A.; Tigabu, Y.; Teshome, K. The water quality degradation of upper Awash River, Ethiopia. Ethiop. J. Environ. Stud. Manag. 2013, 6. [Google Scholar] [CrossRef]
  5. Prabu, P.C. Impact of heavy metal contamination of Akaki river of Ethiopia on soil and metal toxicity on cultivated vegetable crops. Electron. J. Environ. Agric. Food Chem. 2009, 8, 818–827. [Google Scholar]
  6. Yimer, Y.A.; Jin, L. Impact of Lake Beseka on the Water Quality of Awash River, Ethiopia. Am. J. Water Resour. 2020, 8, 21–30. [Google Scholar] [CrossRef]
  7. Alemayehu, T. The impact of uncontrolled waste disposal on surface water quality in Addis Ababa, Ethiopia. SINET Ethiop. J. Sci. 2001, 24. [Google Scholar] [CrossRef]
  8. Yimer, Y.A.; Geberkidan, A. The Pollution Status of Awash River Basin (Ethiopia) Using Descriptive Statistical Techniques. Am. J. Water Resour. 2020, 8, 56–68. [Google Scholar]
  9. Awoke, A.; Beyene, A.; Kloos, H.; Goethals, P.L.M.; Triest, L. River Water Pollution Status and Water Policy Scenario in Ethiopia: Raising Awareness for Better Implementation in Developing Countries. Environ. Manag. 2016, 58. [Google Scholar] [CrossRef]
  10. Whitehead, P.G.; Wilby, R.L.; Battarbee, R.W.; Kernan, M.; Wade, A.J. A review of the potential impacts of climate change on surface water quality. Hydrol. Sci. J. 2009, 54, 101–123. [Google Scholar] [CrossRef]
  11. Whitehead, P.G.; Wade, A.J.; Butterfield, D. Potential impacts of climate change on water quality and ecology in six UK rivers. Hydrol. Res. 2009, 40, 113–122. [Google Scholar] [CrossRef]
  12. Kumssa, A.; Jones, J.F. Climate change and human security in Africa. Int. J. Sustain. Dev. World Ecol. 2010, 17. [Google Scholar] [CrossRef]
  13. Hope, K.R. Climate change and poverty in Africa. Int. J. Sustain. Dev. World Ecol. 2009, 16, 451–461. [Google Scholar] [CrossRef]
  14. Kurukulasuriya, P.; Kala, N.; Mendelsohn, R. Adaptation and Climate Change Impacts: A Structural Ricardian Model of Irrigation and Farm Income in Africa. Clim. Chang. Econ. 2011, 2. [Google Scholar] [CrossRef]
  15. Bryan, E.; Deressa, T.T.; Gbetibouo, G.A.; Ringler, C. Adaptation to climate change in Ethiopia and South Africa: Options and constraints. Environ. Sci. Policy 2009, 12. [Google Scholar] [CrossRef]
  16. Minale, A.; Rao, K. Hydrological Dynamics and Human Impact on Ecosystems of Lake Tana, Northwestern Ethiopia. Ethiop. J. Environ. Stud. Manag. 2011, 4. [Google Scholar] [CrossRef] [Green Version]
  17. Deressa, T.T.; Hassan, R.M.; Ringler, C.; Alemu, T.; Yesuf, M. Determinants of farmers’ choice of adaptation methods to climate change in the Nile Basin of Ethiopia. Glob. Environ. Chang. 2009, 19. [Google Scholar] [CrossRef] [Green Version]
  18. Bussi, G.; Whitehead, P.G.; Bowes, M.J.; Read, D.S.; Prudhomme, C.; Dadson, S.J. Impacts of climate change, land-use change and phosphorus reduction on phytoplankton in the River Thames (UK). Sci. Total Environ. 2016, 572, 1507–1519. [Google Scholar] [CrossRef] [Green Version]
  19. Taye, M.T.; Dyer, E.; Hirpa, F.A.; Charles, K. Climate Change Impact on Water Resources in the Awash Basin, Ethiopia. Water 2018, 10, 1560. [Google Scholar] [CrossRef] [Green Version]
  20. Whitehead, P.G.; Wilson, E.; Butterfield, D. A semi-distributed integrated nitrogen model for multiple source assessment in catchments (INCA): Part I—model structure and process equations. Sci. Total Environ. 1998, 210–211, 547–558. [Google Scholar] [CrossRef]
  21. Whitehead, P.G.; Wilson, E.; Butterfield, D.; Seed, K. A semi-distributed integrated flow and nitrogen model for multiple source assessment in catchments (INCA): Part II—application to large river basins in south Wales and eastern England. Sci. Total Environ. 1998, 210–211, 559–583. [Google Scholar] [CrossRef]
  22. Whitehead, P.G.; Dolk, M.; Peters, R.; Leckie, H. Water Quality Modelling, Monitoring, and Management. In Water Science, Policy, and Management; Wiley: Hoboken, NJ, USA, 2019; pp. 55–73. [Google Scholar]
  23. Fu, B.; Merritt, W.S.; Croke, B.F.W.; Weber, T.R.; Jakeman, A.J. A review of catchment-scale water quality and erosion models and a synthesis of future prospects. Environ. Model. Softw. 2019, 114, 75–97. [Google Scholar] [CrossRef]
  24. Wade, A.J.; Whitehead, P.G.; Butterfield, D. The Integrated Catchments model of Phosphorus dynamics (INCA-P), a new approach for multiple source assessment in heterogeneous river systems: Model structure and equations. Hydrol. Earth Syst. Sci. 2002, 6, 583–606. [Google Scholar] [CrossRef] [Green Version]
  25. Wade, A.J.; Durand, P.; Beaujouan, V.; Wessel, W.; Raat, K.J.; Whitehead, P.G.; Butterfield, D.; Rankinen, K.; Lepisto, A. A nitrogen model for European catchments: INCA, new model structure and equations. Hydrol. Earth Syst. Sci. 2002, 6, 559–582. [Google Scholar] [CrossRef]
  26. Bussi, G.; Whitehead, P.G. Impacts of droughts on low flows and water quality near power stations. Hydrol. Sci. J. 2020, 65, 898–913. [Google Scholar] [CrossRef]
  27. Bussi, G.; Janes, V.; Whitehead, P.G.; Dadson, S.J.; Holman, I.P. Dynamic response of land use and river nutrient concentration to long-term climatic changes. Sci. Total Environ. 2017, 590–591, 818–831. [Google Scholar] [CrossRef] [PubMed]
  28. Mortazavi-Naeini, M.; Bussi, G.; Elliott, J.A.; Hall, J.W.; Whitehead, P.G. Assessment of Risks to Public Water Supply From Low Flows and Harmful Water Quality in a Changing Climate. Water Resour. Res. 2019, 55, 10386–10404. [Google Scholar] [CrossRef] [Green Version]
  29. Bussi, G.; Darby, S.E.; Whitehead, P.G.; Jin, L.; Dadson, S.J.S.J.; Voepel, H.E.H.E.; Vasilopoulos, G.; Hackney, C.R.; Hutton, C.; Berchoux, T.; et al. Impact of dams and climate change on suspended sediment flux to the Mekong delta. Sci. Total Environ. 2021, 755, 142468. [Google Scholar] [CrossRef]
  30. Whitehead, P.G.; Barbour, E.; Futter, M.N.; Sarkar, S.; Rodda, H.; Caesar, J.; Butterfield, D.; Jin, L.; Sinha, R.; Nicholls, R.; et al. Impacts of climate change and socio-economic scenarios on flow and water quality of the Ganges, Brahmaputra and Meghna (GBM) river systems: Low flow and flood statistics. Environ. Sci. Process. Impacts 2015, 17, 1057–1069. [Google Scholar] [CrossRef]
  31. Whitehead, P.G.; Jin, L.; Bussi, G.; Voepel, H.E.; Darby, S.E.; Vasilopoulos, G.; Manley, R.; Rodda, H.; Hutton, C.; Hackney, C.; et al. Water quality modelling of the Mekong River basin: Climate change and socioeconomics drive flow and nutrient flux changes to the Mekong Delta. Sci. Total Environ. 2019, 673, 218–229. [Google Scholar] [CrossRef] [Green Version]
  32. Jin, L.; Whitehead, P.G.; Appeaning Addo, K.; Amisigo, B.; Macadam, I.; Janes, T.; Crossman, J.; Nicholls, R.J.; McCartney, M.; Rodda, H.J.E. Modeling future flows of the Volta River system: Impacts of climate change and socio-economic changes. Sci. Total Environ. 2018, 637–638, 1069–1080. [Google Scholar] [CrossRef]
  33. Whitehead, P.G.; Bussi, G.; Hossain, M.A.; Dolk, M.; Das, P.; Comber, S.; Peters, R.; Charles, K.J.; Hope, R.; Hossain, S. Restoring water quality in the polluted Turag-Tongi-Balu river system, Dhaka: Modelling nutrient and total coliform intervention strategies. Sci. Total Environ. 2018, 631–632, 223–232. [Google Scholar] [CrossRef] [PubMed]
  34. Whitehead, P.G.; Bussi, G.; Peters, R.; Hossain, M.A.; Softley, L.; Shawal, S.; Jin, L.; Rampley, C.P.N.; Holdship, P.; Hope, R.; et al. Modelling heavy metals in the Buriganga River System, Dhaka, Bangladesh: Impacts of tannery pollution control. Sci. Total Environ. 2019, 697, 134090. [Google Scholar] [CrossRef] [PubMed]
  35. Futter, M.N.; Erlandsson, M.A.; Butterfield, D.; Whitehead, P.G.; Oni, S.K.; Wade, A.J. PERSiST: A flexible rainfall-runoff modelling toolkit for use with the INCA family of models. Hydrol. Earth Syst. Sci. 2014, 18, 855–873. [Google Scholar] [CrossRef] [Green Version]
  36. Jackson-Blake, L.; Wade, A.J.; Futter, M.; Butterfield, D.; Couture, R.M.; Cox, R.M.; Crossman, J.; Ekholm, P.; Halliday, S.; Jin, L.; et al. The INtegrated CAtchment model of Phosphorus dynamics (INCA-P): Description and demonstration of new model structure and equations. Environ. Model. Softw. 2016, 83, 356–386. [Google Scholar] [CrossRef] [Green Version]
  37. Hailemariam, K. Impact of climate change on the water resources of Awash River Basin, Ethiopia. Clim. Res. 1999, 12, 91–96. [Google Scholar] [CrossRef] [Green Version]
  38. Funk, C.; Peterson, P.; Landsfeld, M.; Pedreros, D.; Verdin, J.; Shukla, S.; Husak, G.; Rowland, J.; Harrison, L.; Hoell, A.; et al. The climate hazards infrared precipitation with stations—a new environmental record for monitoring extremes. Sci. Data 2015, 2, 150066. [Google Scholar] [CrossRef] [PubMed] [Green Version]
  39. Bontemps, S.; Defourny, P.; Bogaert, E.V.; Arino, O.; Kalogirou, V.; Perez, J.R. GLOBCOVER 2009-Products Description and Validation Report; European Space Agency: Paris, France, 2009. [Google Scholar]
  40. Jarvis, A.; Reuter, H.I.; Nelson, A.; Guevara, E. Hole-Filled SRTM for the Globe Version 4. 2008. Available online: http://srtm.csi.cgiar.org (accessed on 2 May 2019).
  41. Dentener, F.J. Global Maps of Atmospheric Nitrogen Deposition 1860, 1993, and 2050, Data Set; Oak Ridge National Laboratory Distributed Active Archive Center: Oak Ridge, TN, USA, 2006. [Google Scholar]
  42. CIESIN. University, Center for International Earth Science Information Network—CIESIN—Columbia. In Documentation for the Gridded Population of the World, Version 4 (GPWv4); NASA Socioeconomic Data and Applications Center (SEDAC): Palisades, NY, USA, 2016. [Google Scholar]
  43. Awash River Basin Authority. Awash River Basin Water Allocation Modeling and Conflict Resolution Study Project, WP3 Water Demand; Awash River Basin Authority: Melka Werer, Ethiopia, 2017. [Google Scholar]
  44. Bussi, G.; Dadson, S.J.; Prudhomme, C.; Whitehead, P.G.; Prudhomme, C. Modelling the future impacts of climate and land-use change on suspended sediment transport in the River Thames (UK). J. Hydrol. 2016, 542, 357–372. [Google Scholar] [CrossRef] [Green Version]
  45. Gupta, H.V.; Kling, H.; Yilmaz, K.K.; Martinez, G.F. Decomposition of the mean squared error and NSE performance criteria: Implications for improving hydrological modelling. J. Hydrol. 2009, 377, 80–91. [Google Scholar] [CrossRef] [Green Version]
  46. Diaz-Nieto, J.; Wilby, R.L. A comparison of statistical downscaling and climate change factor methods: Impacts on low flows in the River Thames, United Kingdom. Clim. Chang. 2005, 69, 245–268. [Google Scholar] [CrossRef]
  47. Dyer, E.; Washington, R.; Teferi Taye, M. Evaluating the CMIP5 ensemble in Ethiopia: Creating a reduced ensemble for rainfall and temperature in Northwest Ethiopia and the Awash basin. Int. J. Climatol. 2020, 40, 2964–2985. [Google Scholar] [CrossRef] [Green Version]
  48. Chapra, S.C. Surface Water Quality Modeling; Waveland Pr Inc.: Boston, MA, USA, 2008; ISBN 0-07-011364-5. [Google Scholar]
  49. Whitehead, P.G.; Bussi, G.; Bowes, M.J.; Read, D.S.; Hutchins, M.G.; Elliott, J.A.; Dadson, S.J. Dynamic modelling of multiple phytoplankton groups in rivers with an application to the Thames river system in the UK. Environ. Model. Softw. 2015, 74, 75–91. [Google Scholar] [CrossRef]
  50. Hirpa, F.A.; Alfieri, L.; Lees, T.; Peng, J.; Dyer, E.; Dadson, S.J. Streamflow response to climate change in the Greater Horn of Africa. Clim. Chang. 2019, 156, 341–363. [Google Scholar] [CrossRef] [Green Version]
Figure 1. The Upper Awash River catchment: location (left), land use and model structure (right). The numbers indicate the integrated catchment (INCA) identification numbers for the sub-catchments.
Sustainability 13 01254 g001
Figure 2. Monthly precipitation and temperature (current and projections).
Sustainability 13 01254 g002
Figure 3. Projected population growth [1].
Sustainability 13 01254 g003
Figure 4. Flow model results simulated versus observed for Reaches 2 (a) and 4 (b) on the Awash River.
Sustainability 13 01254 g004
Figure 5. Water quality model results for nitrate and phosphorus at Reaches 5 and 18 (the red shaded area indicates the whole range of the 15 model ensemble results).
Sustainability 13 01254 g005
Figure 6. Variation of nitrate load and total phosphorus load of the Awash River at the inlet of Lake Koka depending on the scenarios considered in this study. Population growth is considered homogeneous in space.
Sustainability 13 01254 g006
Figure 7. Variation of the monthly nitrate and phosphorus concentration of the Awash River at the inlet of Lake Koka for five scenarios.
Sustainability 13 01254 g007
Figure 8. Variation of the annual nitrate load and total phosphorus load of the Akaki River at the confluence with the Awash River (bottom section of reach 3) depending on the scenarios considered in this study, assuming uneven population growth and migration of rural population toward the city of Addis Ababa.
Sustainability 13 01254 g008
Table 1. INCA reach and sub-catchment characteristics.
INCA IDSub-Catchment Area (km2)Land Use—Arable (%)Land Use—GRASSLAND/Mixed (%)Land Use—Forest (%)Land Use—Water (%)Land Use—Bare (%)Land Use—Urban (%)Population
19358848000165,119
23565187210000820,511
37721966100131,991,568
4147313824010229,943
5256126614720440,405
1788419561400101,457,636
18143147447100383,597
Table 2. Goodness-of-fit indices for the INCA model implementation in the Upper Awash River catchment (KGE: Kling-Gupta Efficiency [45]).
ReachVariableKGE Range (Validation Period)
2Monthly flow0.78–0.89
4Monthly flow0.73–0.89
17Monthly flow0.53–0.60
5Monthly average nitrate concentration0.36–0.41
5Monthly average phosphorus concentration0.60–0.63
18Monthly average phosphorus concentration0.41–0.46
Table 3. Variation of the annual nitrate and phosphorus load of the Awash River at the inlet of Lake Koka and variations compared to the baseline. Population growth is considered homogeneous in space.
Time PeriodPopulationMitigationAnnual Nitrate Load (tonnes/year)Variation Compared to Baseline 1986–2016 (%)Annual Phosphorus Load (tonnes/year)Variation Compared to Baseline
1986 to 2016
(%)
1986–20162020no1519–2281 773–999
2031–20552020no1279–1977−16 to −14%649–967−17 to −4%
2056–20802020no1035–1714−32 to −25%655–913−16 to −9%
2031–20552031–2055no1753–265615 to 16%997–128728 to 28%
2056–20802056–2080no1790–277917 to 21%1084–142340 to 42%
2031–20552031–2055yes1233–1739−19 to −24%548–691−30 to −31%
2056–20802056–2080yes1209–1705−21 to −26%528–757−32 to −25%
Publisher’s Note: MDPI stays neutral with regard to jurisdictional claims in published maps and institutional affiliations.

