1. Introduction
A range of concepts and ideas are introduced to enable sustainable development and eco-efficiency is by many seen as a central idea [
1,
2]. Eco-efficiency is seen both as a concept and as a tool where the basic idea is to produce more with less impact on nature, measured as reduced emissions or reduced raw material consumption, or both [
3,
4].
The concept of eco-efficiency has developed quickly since it was introduced and measures of eco-efficiency are used at different scales, both temporal and spatial [
2,
4]. In addition to encouraging more efficient use of resources, two distinct areas for eco-efficiency assessments can be identified; as a tool to measure performance at a system level (process, product, company
etc.), and as a tool to compare different alternatives (benchmarking). In both situations the underlying motivation is to improve business performance.
Much research is done on what motivates business to put environmental issues on the agenda [
4,
5,
6,
7,
8,
9,
10]. The findings can be summarized in four distinct drivers; consumer pressure, potential cost savings, legislation, and ethics.
As eco-efficiency has developed, the focus has primarily been on exploration of potential cost savings. However, eco-efficiency has a great potential also for assessment of the potential in (new) regulations. Several authors claim that authorities should set targets for environmental improvements, while the industry should be given the opportunity to decide how these targets should be fulfilled to ensure maximum opportunity for innovations [
11,
12]. Measures on eco-efficiency can be useful here. The environmental dimension can be used to assess whether environmental improvements are met (e.g., 10% reduction of greenhouse gasses), whereas the value dimension can be used to assess the probability for changes in the products and production processes. Cropper and Oates [
13] focus on the two-step process necessary for reaching the environmental goals; first the targets for environmental quality must be set, and then a regulatory system must be designed and put in place to monitor the achievement of this target.
In this paper the potential influence possible new regulations could have on a case study of furniture production in Norway is explored. Different scenarios for improvements in environmental performance are presented and the economic consequences of these for the manufacturer and/or customer are analysed. This is combined with possible new regulation where the potential for initiating environmental improvements as a consequence is explored.
2. Background
It is commonly acknowledged that companies do what is profitable, either in a short or long term perspective or, preferably, both [
14]. This is often not congruent with the most environmental friendly options [
15]. As a consequence, the present market is not able to cope with all environmental challenges and as a profound example Nicholas Stern [
16] concluded that climate change is the greatest market failure the world has ever seen, and it interacts with other market imperfections.
Even environmental improvements that generate cost savings, tend not to be implemented if there are large investments involved and the savings has a long term perspective [
4]. Investments will then be allocated elsewhere and the eco-efficiency potential will not be realised.
Regulations have the potential to change the eco-efficiency performance of products and new regulations can thus motivate alterations within existing production systems. New and more environmental friendly solutions can become profitable if the regulations are adequate formulated. Two distinct types of regulations can be identified, namely public (juridical) regulations and regulations imposed by the industry sector themselves [
17]. Here the focus is on public regulations.
Bleischwitz
et al. [
15] identify three policy levers in the materials cycle where public regulation can impose changes in the environmental performance; (1) taxation on raw materials, and licenses to operate and agreements on exploitation of raw materials, (2) integrated product policy (IPP) and quotas for recycled inputs, and (3) regulation on landfills, pollution taxes, taxes on emission from incineration and technical standards for end-of-life treatment.
With present environmental and financial challenges, there seems to be a need for more regulations and in particular regulations that are tailored to impose environmental improvements [
18,
19]. Dahlsrud [
19] have studied different industries and concluded that even companies with high norms on social responsibility will not go far beyond regulations if this will generate extra costs. The conclusion is that new regulations are vital to generate changes that are needed for sustainable production and consumption patterns.
Eco-efficiency assessments of the potential of new regulations can here be useful, using eco-efficiency as a strategic tool [
20]. In this paper the focus is on how to actually figure out how such regulations could be formulated.
3. Case and Methodology
Michelsen
et al. [
21] performed a case study on environmental performance of six different models of conference chairs. The flagship model of one of the producers involved turned out to have the highest environmental impact of the analysed models.
The main use of the chair is in conference rooms, waiting rooms
etc, and has a total weight of 6.81 kg. It is assumed by the manufacturer that the product can be used for 20 years.
Table 1 shows the main components of the chair. In addition, 3 kg of cardboard is used for packaging.
Table 1.
Main materials in the case chair.
Table 1.
Main materials in the case chair.
| Component | Weight |
|---|
| Steel frame | 1.92 kg |
| Beech plywood | 3.54 kg |
| Beech | 0.44 kg |
| Polyurethane (PUR) | 0.65 kg |
| Other materials | 0.56 kg |
Michelsen [
22] developed and analysed five different scenarios for improving the environmental performance of this particular chair; three scenarios with an alteration of the product itself through changes in different components, and two scenarios with alterations of the end-of-life (EOL) phase. These scenarios can to some extent be combined. The scenarios are summarized in
Table 2 (see Michelsen [
22] for further details and assumptions).
Environmental performance of the original product as well as the scenarios was assessed using the computer program SimaPro, selecting Eco-indicator 99 (E)/Europe EI 99 E/E as the impact assessment method (See
http://www.pre.nl/ for more information on the computer program SimaPro). Eco-Indicator 99 is a damage oriented method for Life Cycle Impact Assessment [
34] with several options for normalisation and damage factors. Here, European values are used as normalisation values, and damage factors are set in an egalitarian perspective [
34]. (See Goedkoop and Spriensma [
34] for more information on the method). Data on raw materials production were largely based on database values. It was assumed that the content of recycled steel in steel frames is 23% and cardboard for packaging is produced with 100% recycled fibres. Transport and energy consumption is included.
According to Vassbotn and Bjerke [
23], landfill is the most likely waste scenario for furniture in Norway, and this was used as EOL treatment in the original situation. Database values were used for landfill for all materials except wood. Emission values for wood were taken from Sandgren
et al. [
24]. In the original case, this gave an environmental impact of 2,030 mPts for the life cycle of the chair (Using Eco-Indicator 99 all environmental impact is measured in a single score, normally denoted Pts or mPts (milli Pts) [
34]). See Michelsen [
22] for other further assumptions and details.
Table 2.
Description of scenarios for improving the environmental performance of the case chair.
Table 2.
Description of scenarios for improving the environmental performance of the case chair.
| Scenario | Short description |
|---|
| Scenario A | Reducing the amount of polyurethane in the product with 20% |
| Scenario B | Partly replacing polyurethane with a renewable compound |
| Scenario C | Omitting upholstery completely; both polyurethane and fabrics used on the seat are excluded, but more lacquer is needed to get an appropriate finish of the seat |
| Scenario D | Introducing dismantling and recycling activities; the chair is taken to a dismantling facility, steel is recycled, wood is incinerated with energy recovery and the rest goes to landfill. Other EOL is similar to the original situation |
| Scenario E | Introducing take-back with reuse of steel components; it is assumed that 80% of the chairs are returned to the manufacturer and 50% of the returned steel frames can be reused, the others are recycled. Other EOL is similar to the original situation |
Value performance of the original product as well as for the scenarios was assessed as life cycle costs (LCC) of the products. LCC is defined as the sum of the price of the product, the expected costs during use and the average costs for disposal or other end-of-life treatment [
4]. The manufacturer uses the following equation to calculate the recommended retail price:
where
LC stands for labour costs in production and
PC for purchasing costs. This is multiplied by 1.15 to include indirect costs and divided by 0.7 to include the desired margin for the company. The factor
k represents the costs and margins for transport and retail. The recommended retail price for the original product was 2,894 Norwegian kroner (NOK) [100 NOK ≈ 11.90 € (November 2009)] at the time of cost assessment.
Costs during use could be related to cleaning and repair. In the present case study it was assumed that there were no costs related to such activities. It was also assumed that the chairs are disposed at a landfill after use [
23]. In this case, the costs of delivery to a landfill in Oslo were used as disposal costs. At the time of writing, this is NOK 1422 per tonne (taxes not included;
http://www.renovasjonsetaten.oslo.kommune.no/ [in Norwegian]).
Michelsen [
22] concluded that the changes in life cycle costs following scenario A are negligible, and for the rest of the scenarios, except C that will give a reduced seating comfort, all will result in increased life cycle costs following Equation 1. The changes in environmental performance and LCC for the different scenarios are shown in
Table 3.
According to Biebeler
et al. [
18] and Dahlsrud [
19], changes that give an increased cost are not very likely to be implemented. Four potential new or modified regulations are thus identified and the most likely consequences if they are implemented, analysed. These are primarily targeted to scenario D and E since these have the highest potential for environmental improvement without reducing the seating comfort. These potential new regulations give rice to new cost calculations for the present product and thus alterations in changes in LCC for the scenarios in
Table 3.
Table 3.
Changes in environmental and value performance following the different scenarios.
Table 3.
Changes in environmental and value performance following the different scenarios.
| Scenario | ΔmPt | ΔNOK |
|---|
| Scenario A | –30 | 0 |
| Scenario B | –50 | 130 |
| Scenario C | –240 | –144 |
| Scenario D | –330 | 130 |
| Scenario E | –280 | 94 |
Table 4.
Potential new regulations intended to impose improvements in the environmental performance of the case chair.
Table 4.
Potential new regulations intended to impose improvements in the environmental performance of the case chair.
| Regulation | Short description |
|---|
| Regulation 1 | Introduce a CO2-tax on all product related emissions, assuming a CO2 tax on 354 NOK/tonne (the maximum* level of CO2 tax introduced in Norway) |
| Regulation 2 | Increase tax on delivery of waste, assuming more than a doubling of tax up to 3,000 NOK/tonne |
| Regulation 3 | Introduce a tax on raw material consumption, several options possible |
| Regulation 4 | Introduce an extended producer responsibility |
4. Results and Discussion
The total emission of greenhouse gasses from the life cycle of original product is 35.7 kg CO
2-equiv. [
21]. Assuming a CO
2-tax on 354 NOK/tonne (
Table 4), this will cause an increased cost of slightly above 12 NOK/chair. In addition, none of the proposed scenarios would reduce the emissions of greenhouse gases with more than 60%, giving a potential for cost savings on less than 8 NOK/chair.
Given the increased costs of the scenarios presented in
Table 3, it is thus not likely that a CO
2-tax in line with the present level would cause any other changes than a slight increase of product price and/or a slight decrease of the manufacturer’s profit. If a CO
2-tax should make the scenarios B, D or E profitable, the CO
2-tax must be more than 10 times the level of present CO
2-taxes in Norway. This is not realistic and a CO
2-tax is obviously not an option if the motivation is to impose environmental improvements in line with the alternatives shown in
Table 2.
The second alternative for regulations (
Table 4) is to increase the tax on waste delivery. Here it is assumed that this tax is more than doubled. This gives an increase of the life cycle cost of the product of about 10 NOK. This is far less than the additional costs identified in the scenarios for possible environmental improvements (
Table 3). The most likely outcome is thus an increased life cycle cost of the product.
In scenario D only PUR and some materials that are present in small quantities will go to landfill, in total 1.21 kg. If the landfill tax should make this profitable compared with the present situation, the landfill tax must produce 20,000 NOK/tonne, which is an unrealistic level. The conclusion is thus that an increase of the landfill tax is not an option if the target is to ensure environmental improvements in line with the alternatives shown in
Table 2.
Scenario E is the only scenario with reuse of materials. In this scenario, the steel consumption is reduced with 40%, i.e., 0.77 kg for each chair. If this scenario is to be profitable due to a tax on steel consumption, the tax must be on 122 NOK/kg steel used. This is at present an unrealistic level. In line with the previous suggested taxes, also a tax on material consumption is thus not likely to cause any changes in the life cycle of the product.
Of the identified options for new regulations shown in
Table 4, the only option left is the introduction of an extended producer responsibility with explicit take-back legislation. This will force the manufacturers to look more in detail into the possibilities in scenario D and E. In fact, this was discussed in a Norwegian white paper already in 1999 [
25] where it was suggested that producer responsibility should be introduced for more product groups, and furniture was one of the groups explicitly mentioned. The idea was also included in a public review three years later [
26], but so far not implemented.
According to the LCC calculations in
Table 3, scenario D and scenario E will both give increased costs. Take-back legislation will however force changes and the present situation is no longer an option. This is in contrast to the other suggested regulations (1–3 in
Table 4) where it is possible to pay the added costs and do no changes of the environmental performance of the product.
Also, take-back and recycling is often taken care of by non-profit business organisations,
i.e., not giving a contribution to the company’s margin [
27]. If this is done, substantial cost reductions are possible. In the cost scenarios in
Table 3, additional costs related to take-back and recycling were included like any other costs and calculated following equation 1. It is, however, possible to assume that the dismantling could be done as a non-profit activity, with no margin for the dismantler included. The cost calculation would then follow the following equation:
where
aLC stands for the additional labour costs for the dismantling effort and
aPC stands for additional purchasing costs. This presupposes that the work in the dismantling facility is as efficient as that at the end producer’s and carries the same level of indirect costs, which again presupposes that large numbers of items are dismantled.
Following this equation, scenario D gives an increased LCC on 33 NOK/chair, while scenario E actually gives a reduced LCC on 142 NOK/chair (see Michelsen [
22] for assumptions and details).
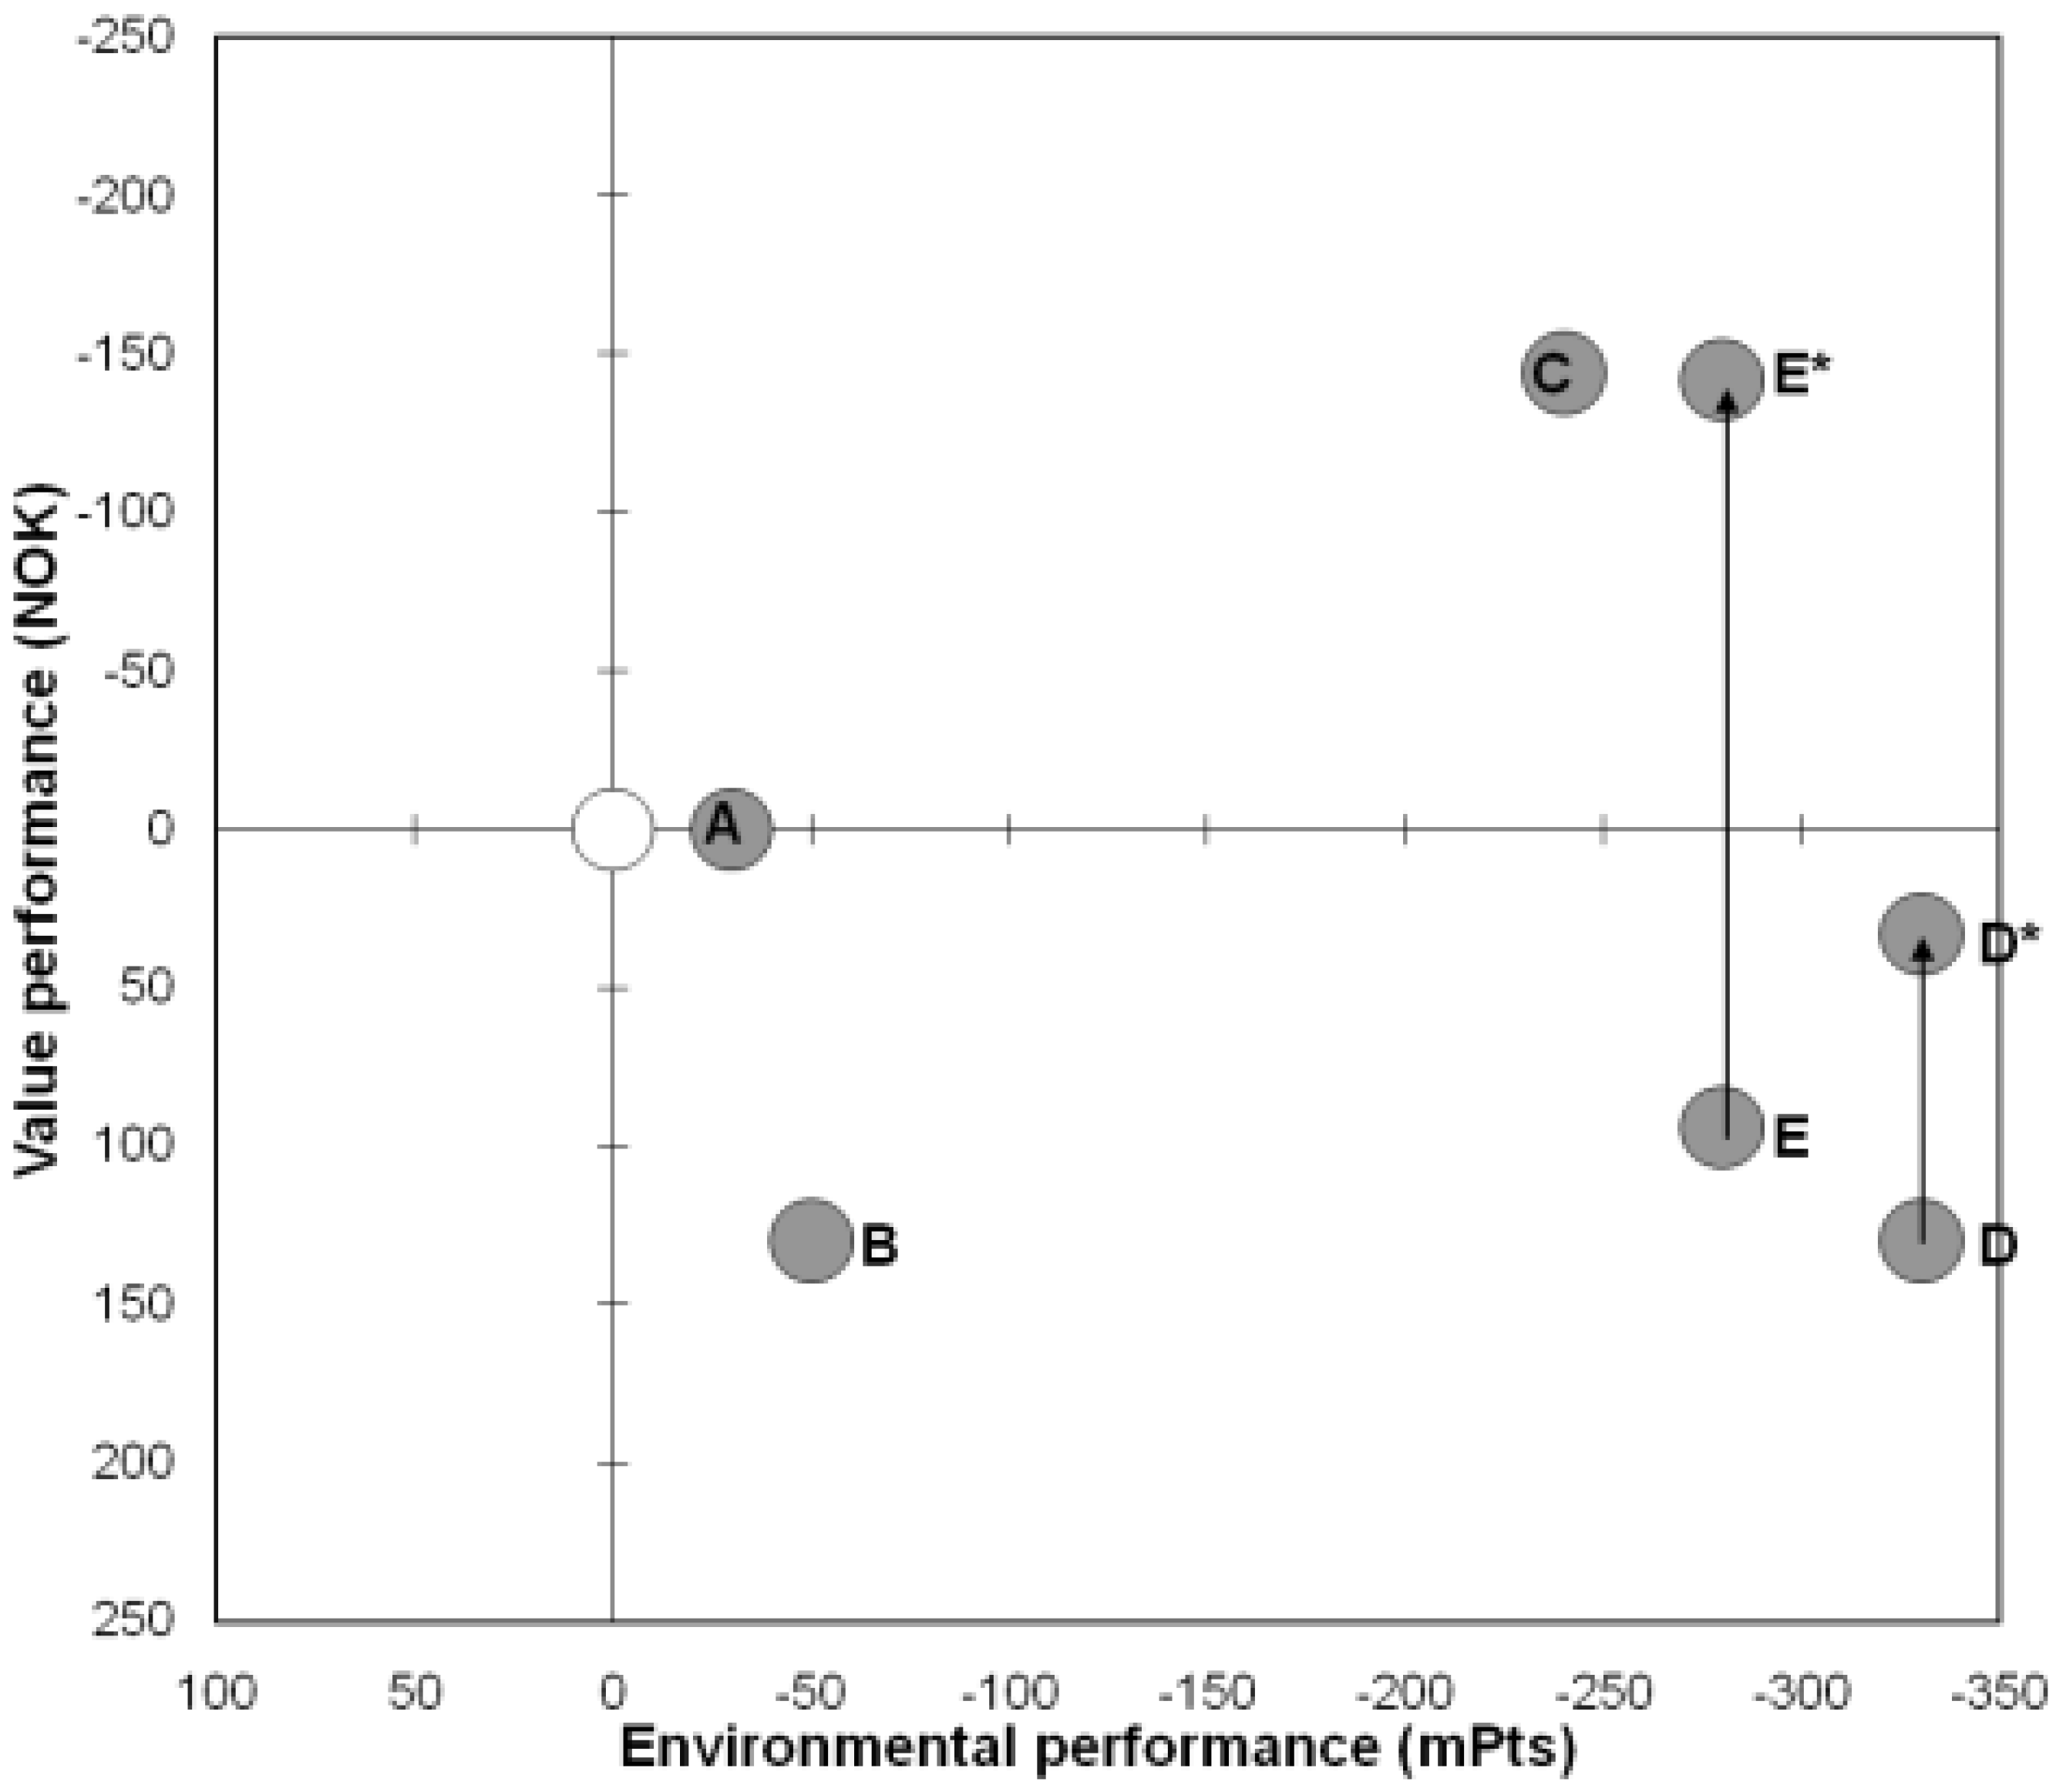
Figure 1 gives an overview over changes in environmental performance and LCC following the different scenarios.
There are potentials for savings in addition to this. First, it is assumed that the transport of used chairs is carried out by a transport company on a case-to-case basis. It should be possible to reduce the costs related to this substantially in a real situation. Improved performance in reverse logistics is reported in several studies on take-back systems [
28,
29]. Second, experiences from other sectors also show that the costs are often reduced when such regulations are introduced due to technological innovations [
27,
30].
Figure 1.
Changes in environmental and value performance following the different scenarios. In the scenarios marked * the cost calculations follow equation (2) where costs related to take-back and dismantling are included as non-profit activities.
Figure 1.
Changes in environmental and value performance following the different scenarios. In the scenarios marked * the cost calculations follow equation (2) where costs related to take-back and dismantling are included as non-profit activities.
Establishment of a non-profit organisation that could take care of the take-back system of furniture in Norway also seems as a realistic option; such organisations are established in other industries in Norway taking care of used products and materials [
27] and there is no obvious reason why this could not be done for furniture industry as well [
25,
26].
An alternative to scenario D and E is the possibility of a second hand market. Handfield
et al. [
31] show how this was the outcome of take-back solutions on furniture in USA. Given the functional unit in the analyses, every year of use beyond the assumed 20 years reduces the environmental impact significantly. One additional year beyond the assumed 20 will give a 5% decrease in environmental impact for every year the chair has been used. This is thus one of the most effective ways of improving the environmental performance [
32]. However, this should be regarded as a supplement for directed end-of-life treatment and not an alternative; prolong the period of use, but still ensure a dismantling and EOL treatment as planned. Thus, design for recyclability is an important outcome of prospects for take-back responsibilities [
30].


