Article

Developing a Sustainability Assessment Model: The Sustainable Infrastructure, Land-Use, Environment and Transport Model

School of Urban Development, Queensland University of Technology, 2 George Street, Brisbane, Queensland 4001, Australia
*
Author to whom correspondence should be addressed.
Sustainability 2010, 2(1), 321-340; https://doi.org/10.3390/su2010321
Submission received: 7 December 2009 / Accepted: 11 January 2010 / Published: 18 January 2010
(This article belongs to the Special Issue Environmental Sustainability and the Built Environment)

Abstract

:
Measuring the comparative sustainability levels of cities, regions, institutions and projects is an essential procedure in creating sustainable urban futures. This paper introduces a new urban sustainability assessment model: “The Sustainable Infrastructure, Land-use, Environment and Transport Model (SILENT)”. The SILENT Model is an advanced geographic information system and indicator-based comparative urban sustainability indexing model. The model aims to assist planners and policy makers in their daily tasks in sustainable urban planning and development by providing an integrated sustainability assessment framework. The paper gives an overview of the conceptual framework and components of the model and discusses the theoretical constructs, methodological procedures, and future development of this promising urban sustainability assessment model.

1. Introduction

In recent years climate change and other rising environmental concerns and problems have put sustainable urban development on the top of the agenda in almost every city across the world [1,2]. The increased and urgent environmental agenda has engendered the need for employing sustainability assessment frameworks as key mechanisms for measuring the impacts of development on the environment, and as key policy instruments for supporting the transition to a sustainable urban development path [3,4]. Particularly during the last decade, sustainability assessment via indicators and indexing methods has gained recognition. This is mainly because of the visualisation of phenomena and the highlighting of trends based on reliable variables being highly considered as logical approaches in determining comparative sustainability levels [5]. Among the experts, there is a common agreement on using sustainability indicators for assessment, provided that they are selected and applied carefully and appropriately [6]. Indicators help in the performance assessment of the development, and of the overall effectiveness of partnerships to improve economic, social and environmental well-being of urban settings. Beyond the assessment purpose, sustainability indicators are also crucial in developing awareness of urban and environmental problems, and in advocating the need for achieving sustainable urban development [7].
Following the wide acceptance of the sustainable urban development notion, finding an accurate way to assess and measure comparative sustainability levels of existing and future developments has become an important issue [8,9], and, there have been various studies which have proposed different methods for sustainability assessment [10,11,12,13]. A thorough review of some of these assessment tools are presented by Karol and Brunner, particularly scrutinising six key neighbourhood scale sustainability assessment tools—the Cascadia Scorecard, the LEED (Leadership in Energy and Environmental Design) for Neighbourhood Development Rating System, One Planet Living (OPL), the South East England Development Agency (SEEDA) Checklist, SPeAR® (Sustainable Project Appraisal Routine), and VicUrban Master Planned Community Assessment Tool [14].
Although there are various sustainability assessment methodologies, models and tools developed so far, only a few have an integral approach that takes into account all of the environmental, economic and social aspects. According to Singh et al. [5] “…in most cases the focus is on one of the three aspects. Although, it could be argued that they could serve supplementary to each other, sustainability is more than an aggregation of the important issues, it is also about their inter-linkages and the dynamics developed in a system. This point will be missing if tried to use them supplementary and it is one of the most difficult parts to capture and reflect in measurements…”
Hacking et al. [15] advocate that the confusion inherent in sustainability assessment methods might be avoided by gathering all these methods under a broad umbrella of “sustainability assessment appraisal” and forming a more precisely defined method based on sustainability indicators. The literature indicates limitations of the existing assessment models and sustainable urban development requests, which are rapidly increasing in sophistication, and this creates an urgent need for more effective assessment methods and tools [16,17].
In line with these sentiments, this paper reports a study that develops a comprehensive sustainability assessment model entitled “The Sustainable Infrastructure, Land-use, Environment and Transport Model (SILENT)”, which aims to provide a more effective sustainability assessment by taking all of the major aspects affecting sustainability into account: environmental, economic and social. The SILENT Model is developed as an advanced geographic information system and indicator-based urban sustainability indexing model. The model considers the sustainability of land-use, environment, transport systems and infrastructure with a triple bottom line approach, and uses similar steps of the OECD Composite Indicators Methodology [18].
This paper is organised in four sections. Following this introduction, secondly, we highlight the nature and importance of indicator-based comparative urban sustainability assessment, which is increasingly recognised as a successful sustainability assessment method. Thirdly, we present the conceptual and methodological approach of the SILENT Model. In this section, we also introduce the four key components of the model: conceptual, indicator, indexing and policy-support bases of the model. Lastly, we outline potential policy implications and plans for further development of the SILENT Model.

2. Indicator-Based Comparative Urban Sustainability Assessment

As Meadows [19] notes, indicators arise from values and, in turn, they create values; therefore, the biggest advantage of an indicator-based comparative urban sustainability assessment model is the quantifiability of the comparative sustainability levels. Another instrumental purpose of using sustainability indicators is that “…by visualising phenomena and highlighting trends, indicators simplify, quantify, analyse and communicate otherwise complex and complicated information…” [20]. Depending on these qualities, indicators have attracted a wide range of interest, and this has led to generation of a large number of relatively successful urban sustainability assessment practices. The main difficulty faced while using indicators is to find a common unit and method of measurement leading to comparison of performance of a setting or policy package. Over the last decade, there has been an increasing effort to structure an indicator system and monitoring process to accurately formulate an integrated urban sustainability monitoring and assessment strategy.
In such a strategy, even though the ecological footprint is not a composite indicator, because both composite indicators and the ecological footprint collapse all sustainability issues into a single number, the ecological footprint approach is considered useful in finding a common unit for measurement [21]. The ecological footprint documents the extent to which human economic activities stay within the regenerative capacity of the biosphere. It considers consumption or production perspectives related to the activities of cities, corporations and individuals, and their role in non-renewable resource depletion. This approach is popular because its standardised measurement—global hectares—can be employed when making urban and project based comparisons [22]. This generalised and comparable measurement is often used by public and private institutions, and this is seen as a positive development in urban policy analysis [23]. As emphasised by McManus and Halighton [23], the ecological footprint concept contributes to focusing on and minimising consumption patterns and changing global aspects of these patterns.
From a local perspective, sustainability indicators reflect large scale environmental and economic considerations, as well as local social issues relevant to urban sustainability. In general, catchments, habitats of endangered species and natural reserve areas form environmentally sensitive regions, and environmental sustainability considerations are highlighted at the local and regional scales. In terms of economic activities and urban communities, a divergent range of spatial units, such as; from metropolitan areas to small scale infill areas, are the main subjects of local level sustainability studies. In these studies, there is a growing concern to balance environmental, economic and social dimensions of sustainability [24]. The sustainability of local economy, residential and industrial consumption, recycling, energy security, renewable energy use, local pollution, preservation of ecologically sensitive areas, accessibility to urban services, demographic changes, immigration and integration of social groups, social and gender equity, urban poverty, quality of life, sense of community, public security, participation in local decision making process, education, literacy, and public health are among the key indicator categories that can be found in nearly all sustainability assessment endeavours at the local level.
The scope and contents of local indicators differ from one project to another. However, the primary intention of a sustainability assessment is to include the most prominent local indicators in the assessment model. An assessment model with a comprehensive coverage of key issues provides findings that, in an extensive and inclusive decision making platform, could support the development of policies and actions for a more sustainable urban future [25,26,27].
In order to measure the comparative level of sustainability accurately, sustainability indicators ought to be carefully selected. On the theoretical front, indicators should relate to sustainability and represent all necessary sustainability domains (i.e., economic, environmental, social, and also institutional). On the practical front, they should have appropriate parameters that would make assessment possible. Lautso et al. [28] define the key indicator selection issues as relevance, representativeness, policy and predictability. Furthermore, indicators need to be scientifically valid, responsive to the changes in the system, understandable, and flexible enough to encompass new knowledge and public perceptions [29]. In relation to the data availability and quality, indicators should be as few as possible; however, no essential indicator should be omitted for purposes of brevity. Even if these qualities are context-dependent and not exhaustive, as Hak et al. [30] state, “…features of a robust indicator include a simple and unified method, commonly agreed issues and targets of wide applicability, transparency in the process, and agreement between partners on the process…”
Most indicator-based approaches only highlight issues, and do not provide an answer to the question of why the level of sustainability differs from one place to another. In other words, in most of these approaches, the link between theory and practice has not been well established. Therefore, it is important that key indicators need to be supplemented by qualitative and quantitative information on impact and performance levels. In this regard, a good sustainability assessment practice example is The Bellagio Principles developed by the International Institute of Sustainable Development [2]. These principles serve as guidelines for the assessment process, including the selection and design of indicators, their interpretation, and the communication of results, to provide a link between theory and practice.

3. The SILENT Model

Unsustainable urban development occurs mostly as a result of the inherent interdependence between urban form, transportation and infrastructure, and their impacts on the environment. Therefore, for this research our operational definition of urban sustainability is “the long term viability of urban living that minimises the negative impacts of urban demography, land use, urban form and transport on the environment”. As explained in the previous sections, sustainability assessment plays an important role in portraying unsustainable urban development as well as good sustainability practices. Considering the constrains and limitations of existing sustainability assessment methods, and the tools depicted and discussed in the literature, this paper reports a study that develops a local level comprehensive sustainability assessment model. “The Sustainable Infrastructure Land-use Environment and Transport Model (SILENT)” is an advanced geographic information system (GIS) and indicator-based urban sustainability indexing model. The spatial indexing nature of the model is particularly useful for the analysis and the visualisation of comparative sustainability levels of urban localities. As a spatial indexing endeavour, the specific aim of the model is to incorporate all related domains affecting urban sustainability (i.e., demography, land-use, environment, transport and infrastructure) into a practical assessment method that informs planning and decision making processes. The SILENT Model is developed by following four logical steps similar to the OECD’s Composite Indicators Methodology [18].
Firstly, a relevant measurement method to evaluate performance of urban sustainability is selected. As the background provided in the earlier literature review sections suggests, an indicator-based sustainability approach is selected due to its conceptual consistency and practical simplicity. Additionally, the SILENT Model uses performance indicators selected from the current planning schemes that reflect local sustainability concerns (i.e., Gold Coast City Planning Scheme’s sustainability indicators). Secondly, to gauge the comparative sustainability levels of the urban settings, a number of indicator categories, sets, individual indicators and parameters are employed (see Appendices 1). By using relevant indicators, the model analyses and pictures the comparative sustainability levels mainly based on the composite effects of urban form, transport and infrastructure interrelationship and their impacts on the environment. The third step is aggregating the values of each area by individual indicators to form a composite index. This step includes associating different indicators to form a composite index by assigning and considering each indicator’s individual weightings. To do this, a number of statistical procedures are applied. Although at the first glance the SILENT Model looks like only a composite indexing system, actually it also benefits from multivariate analysis in forming the indicator base of the model. At this initial practice, reported in this paper, only factor analysis is employed as a multivariate analysis technique, however, along with factor analysis a stepwise regression method is also possible to be used in order to determine the best fitting sets of indicators to identify sustainability levels. Finally, the model outputs—the spatial sustainability composite index values—are prepared for use in the benchmarking and policy making processes. As well as revealing the existing comparative levels of urban sustainability, the model can also be used to estimate the sustainability outcomes of alternative development scenarios.
The main characteristic of the SILENT Model is that it uses a grid-based system and divides the study area into small grid cells (e.g., 100 × 100 m). The grid-based analysis is particularly popular in accessibility indexing studies due to its strengths in condensing the analysis into comparable same size analysis units—for example, LUPTAI [31]. The model assigns values of various attributes of urban settings into each grid cell by using an indicator-based assessment system. The completion of value assignment to each grid cell for each indicator forms a composite index in both tabular and dynamic visual forms (that are tables and GIS maps) to display the results of the sustainability assessment performance of the locality. The model is also equipped to be run for policy and scenario testing. The nature of the iterative use of the SILENT Model provides a dynamic and process-dependent sustainability evaluation.
The structure of the SILENT Model is illustrated in Figure 1 below. There are four constituent parts of the model: conceptual base of the model; construction of the indicator base of the model; urban sustainability indexing base of the model; and the policy and decision support base of the model. These constituent parts of the model are explored in detail below.
The concept of sustainability and its spatial or urban structure dimension constitute the theoretical foundation of the SILENT Model. In terms of sustainable urban development and sustainable communities, urban form, mobility pattern and infrastructure provision are the primary issues connected to the environmental domain of sustainability. Urban policy considerations are generally delineated by land-use and transportation plans and infrastructure investments. Naturally, all endeavours related to urban development carry infrastructure and service considerations into the planning activities. Therefore, the question remaining is: how to define and measure the interrelated qualities of this construct to portray interventions designed to form more sustainable communities. Indicators and indices are frequently used means for generating sustainability policies and making comparison among different aspects of the sustainability performance. Even if they are widely used tools, the theory behind the indicator-based description of urban sustainability (with scientific reasoning) frames the structure of the research and has immense importance for the robustness and reliability of methods. Even though there is no unified method in the indicator-based sustainability assessment, the literature contains a considerable number of studies with different concerns, such as development, market and economy, innovation and knowledge, and ecosystems [5]. These studies employ indicators or index-based models to perform sustainability performance evaluation, and are invaluable sources that shed light on the practicability and theoretical strengths of the SILENT Model.
The data requirements of the SILENT Model highlight the dual relationship between theoretical robustness and data accessibility and quality considerations. While the theories related to the variables of urban sustainability considerations convey a very wide and interrelated picture, finding respective data from available sources is not always an easy task. In some cases, available data may not have the desired scope, or have statistical flaws that may result in biased measuring and forecasting. Additionally, auto-correlation between indicators is another issue that could jeopardise model reliability. In some respect, the selection of data is based partly upon intuition and partly on subjective judgement, a situation not uncommon when building a decision support model [5,32]. A carefully designed indicator selection procedure of the model helps in making the model more concise and cost effective by avoiding unnecessary data collection costs. Data availability effects the selection of suitable indicators. As explained by Hak et al. [30], indicators are merely assessment tools; therefore, the cost of improvements should not limit the capacity to implement policy. This is to say as in the case of the SILENT Model, indicators also need to be selected in a cost-effective way.
Figure 1. Structure of the SILENT Model.
Sustainability 02 00321 g001

3.1. Conceptual Base of the Model

Based on the aforementioned conceptual and technical issues, the review of the literature and the best practice model and cases, the SILENT Model accommodates four key indicator category areas of “demography” “land use and urban form”, “transport” and “environment”, in order to best explain the social, economic and environmental sustainability of an urban locality under investigation (see Figure 1). As the literature indicate, these four broad categories represent all of the major human activity areas that play a critical role in effecting sustainability levels of urban environments [2,15]. These categories are considered as generic global categories so as the indicator sets. In terms of indicators this study purposely selected suitable indicators for the case of Gold Coast City, Australia. However, the methodology presented in this paper could be easily replicated elsewhere as long as indicators are carefully selected to reflect sustainability characteristics of the local context clearly.

3.2. Indicator Base of the Model

In keeping pace with the growing interest in sustainability research, there have been various studies proposing different scope and content for sustainability indicators. Also, depending on the scale of the consideration, it is very common to see local and regional indicators defined separately for sustainability assessment. Putting the spatial scale aside, one of the strengths of the SILENT Model is its indicators being conceptually robust and practically relevant to the urban sustainability context. While conceptually robustness refers to the inclusion of all of the key indicators based on the relevant theoretical grounding, the practical relevancy highlights a selection of suitable indicators by considering data availability, policy guidance, and institutional and public priorities. The main difficulty faced while using indicators is to find a common unit of measurement to compare performance of the setting or policy package. Gasparatos et al. [33] state that there are three widely used sustainability assessment methods: monetary tools; biophysical models; and sustainability indicators and composite indices. As done for cost-benefit analysis of environmental assessment, converting externalities into monetary terms is the most preferred approach, while another popular method is to convert parameters into units of global hectares as required by the carbon footprint concept. Biophysical models refer to entropy and carrying capacity concepts. For example, the global hectares concept posed by the carbon foot-printing method is a biophysical measure which is easily understandable, comparable, and frequently used for policy formulation. However, converting some of the social and environmental qualities such as traffic fatalities, endangered species, protected habitats, and human health into common units might be a challenging task. In the light of the literature findings, the SILENT Model uses ecological foot-printing as a common unit of measurement in its sustainability indicators and composite indices-based assessment methods.
As mentioned previously, the SILENT Model uses an indicator-based assessment system. From a pool of over 600 indicators, gathered from a thorough review of the literature [30,34,35], the most relevant indicators, 30 of them, are selected to form the indicator system. The indicator selection decision is made by a team of dozen experts, five researchers, five practitioners and two local government policy makers, in a collaborative manner through a series of workshops. The most relevant indicators for the study area of the Gold Coast City, Australia are selected by considering the literature (theory), local context and data availability (practicality).
Each indicator is located under a relevant indicator set, and each indicator set is placed under an indicator category based on their theoretical relationship. The SILENT Model uses suitable parameters in the indicator-based measurement process. Assigning parameters to indicators is not always an easy task. In some cases, it is inevitably hard to define parameters, especially for social and value-dependent measures. For these measures in the model, searching for an innovative approach, localising measures via public involvement and reconciliation, or using proxy variables is considered a solution. If parameters can be determined via literature and other sources, they are used. If not, new parameters are established by using Delphi method. For the Delphi method the same aforementioned expert team of a dozen people are contacted through a set of face-to-face meetings for interviews and surveys in order to determine most suitable parameters for each indicator. The indicator category, indicator sets and individual indicators are listed in Table 1 below. Additionally Appendix 1 lists a more detailed version of this table including parameters and sustainability calculation formulas of each indicator.
Table 1. Indicator System of the SILENT Model.
Indicator CategoriesIndicator SetsIndividual Indicators
DemographyResidential characteristicsPopulation density
Labour force participation
Car ownership
Employment characteristicsJobs to housing balance
Employment density
Land Use and Urban FormHousing compactnessMix use ratio
Dwelling density
Single-family parcel size
Single-family dwelling density
Multifamily dwelling density
Local amenitiesRecreation facility supply
Socio-cultural facility supply
TransportTransit orientationTransit adjacency to residents, services
Transit patronage ratio
Non-automobile travel patternTransit adjacency to employment
Transit proximity to employment
Pedestrian network coverage
Bicycle network coverage
Automobile travel patternHome-based vehicle kilometres travelled
Non-home-based vehicle kilometres travelled
Number of home-based vehicle trips
Number of non-home-based vehicle trips
Parking supply in employment centres
EnvironmentResidential resource consumptionWastewater generation
Solid waste generation
Energy use
Residential water consumption
Pollution generated from trafficGreenhouse emissions generated
Stormwater runoff pollution generated
Noise pollution generated

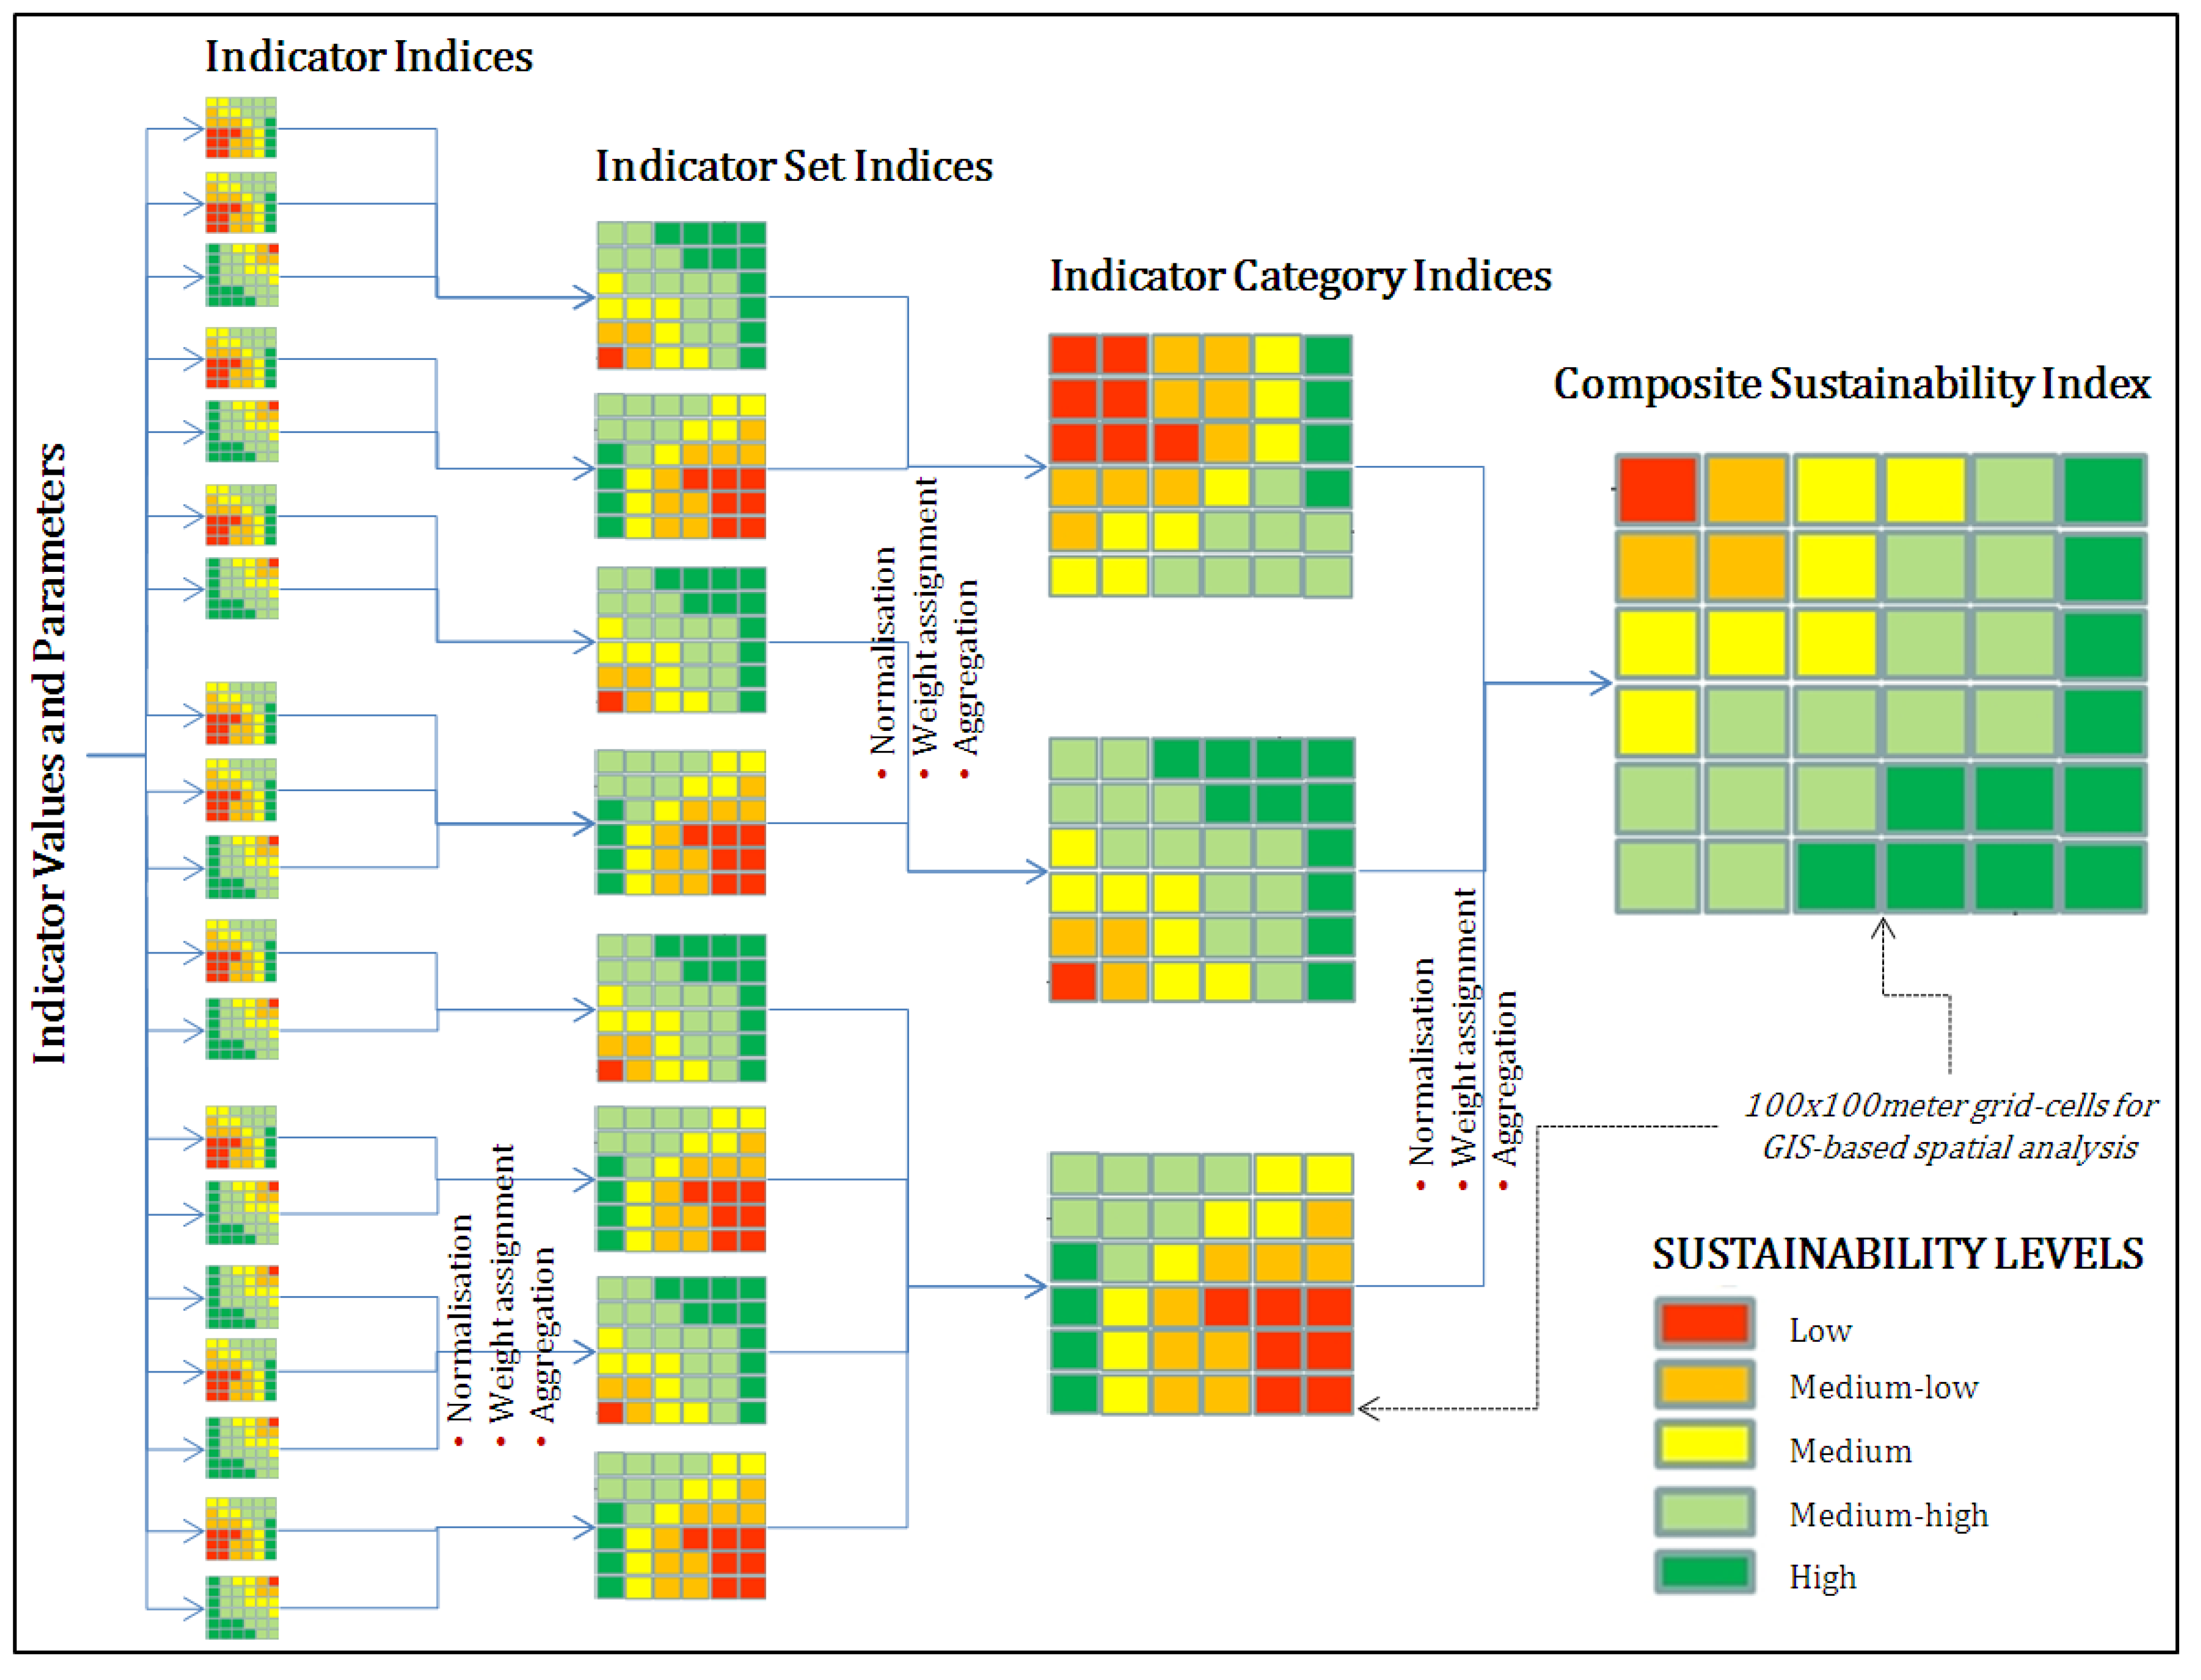
3.3. Indexing Base of the Model

In the literature, the terms “composite indicators” and “indices” are generally considered as synonymous [5,36]. While the final product of some studies is a composite indicator, others produce a series of comparable indices. Particularly in measuring sustainability, these are grouped under the usual environmental, economic and social indices [28]. The main characteristic of the indices is that they do not have a unit, so that they provide comparison opportunity between localities [31]. The procedure followed in generation of the indices also points out the main weakness of the composite indicators. Components are assigned weights with the proportion of variances in the original set of indicators, and can then be aggregated using an additional or a functional nature. Weightings are used to correct the information overlap of correlated indicators, so as to ensure that the results are not biased [32]. The weighting methodology carries a value-dependent bias and, in some cases, weighting with linear aggregation causes substitution among indicators. This gives rise to overly-normalised index values [36]. The SILENT Model determines its indicators’ weightings through a Delphi study. Aforementioned expert team is also consulted to help authors with assigning appropriate weightings to each indicator.
However, aggregation of these indicators as an index can cause, in some cases, critical information losses which make it difficult to identify negative or positive changes in the indicator due to the offsetting effects of the positive indicators on negative ones. A good example is from Oregon, US, where a framework measuring environmental, social and economic sustainability levels showed a rise in social and economic indices and a falling environmental index, but with a rise in the overall sustainability index [37,38]. The inability to identify negative movement of indicators may lead to remedial efforts that are applied too late; this would then render the whole exercise fruitless. Composite indices have also been criticised for their inability to show the negative movements of particular indicators, thus making it difficult to implement strategies that target specific problem areas [39]. Therefore, while working with composite indices, the SILENT Model also uses control indicators in a disaggregated form or, at least, to select critical indicators that can be used for early warnings about critical mistakes.
Besides the earlier mentioned Delphi study the SILENT Model also uses a set of statistical methods in order to make sure the most suitable indicators are selected. The statistical analysis is undertaken to clarify the relationship between indicators and urban sustainability by employing Factor Analysis Technique, one of the widely used multivariate analysis methods. Before determining the factors impacting sustainability levels, a correlation matrix is formed to select indicators to be analysed. After this, factors are designated via checking screeplot of eigenvalues, and then indicators are assigned to the respective factors by using rotated loading matrix technique. This process is useful in providing a lesser number, conceptually sound and relatively independent set of factors, where they form the main drivers of urban sustainability within the framework of the SILENT Model.
The second step of the SILENT Model is to normalise the values of each indicator before weighting and aggregation procedures. There are three widely used methods for normalisations [5]. The first method is to use a standardised distribution, such as normal or t-distribution. Secondly, it is possible to convert all values into standard ordinal scale (e.g., Likert scale). Thirdly, linear arithmetic normalisation procedures could be employed using minimum and maximum values of the indicators. The main differences between these approaches are that they give different weightings to the values according to their difference from the mean value. Or, as in the Likert scale, values are placed into distribution-free scale, thus potentially bringing researchers, practitioners and public perceptions together for the normalisation procedure. This study uses the Likert scale in order to convert all values into standard ordinal scale (i.e., Low, Medium-low, Medium, Medium-high, and High). This normalisation method is proven to be useful and used in similar indexing studies [31].
The third step involves assigning the weighting of each indicator or factor. Various techniques such as multivariate analysis of factor analysis, and public and expert opinion techniques are employed for this procedure [5,30,34]. The main consideration at this stage is to select a robust method that evaluates weightings as to their relative importance in the model or, alternatively, in the decision making procedure. The latter consideration is the main reason for the Delphi method.
The fourth step of the model is aggregation of the respective indicators to produce a set of indices and a composite index. While the literature shows us that simple additive rules are generally employed, it is possible to define a functional form for aggregation. As stated by Singh et al. [5], composite indices should ideally remain relatively simple in terms of their construction and interpretation, and the choice of method employed in weighting and aggregation is ultimately dependent on the nature and scope of the particular case study. In the SILENT Model aggregation and disaggregation method is undertaken in two scales. The first one is the aggregation of normalised data from street and parcel levels into grid cells, and also at the same time disaggregation of Census data from Census Collection Districts (CCDs) into grid cells. The second one is aggregation of grid cell sustainability levels into CCDs, postcode areas and suburbs.
The last step of the SILENT Model is visualisation of the composite index values in a GIS environment. ArcGIS is used as a system for spatial analysis and visualisation. The GIS-based model produces a grid cell system for sustainability analysis. The study area is divided into 100 × 100 meters grid cells and composite sustainability index values of all indicators are transferred into the grid cells. Following the entry of the weighting factors, the GIS system produces a set of indices including composite sustainability index in five comparative sustainability levels: Low, Medium-low, Medium, Medium-high, and High. These five comparative sustainability levels are set by assigning calculated Likert scale values for each indicator between the value of 0 and 5: Low (0.00–1.00), Medium-low (1.01–2.00), Medium (2.01–3.00), Medium-high (3.01–4.00), and High (4.01–5.00).
Figure 2. Composite Sustainability Indexing Structure of the SILENT Model.
Sustainability 02 00321 g002
The GIS system also provides a tabular report for exact unit values of the comparative sustainability level of each grid cell. This report contains a sustainability figure each, between 0 and 5, for 30 indicators, a figure each for nine indicator sets, a figure each for four indicator categories, and a composite index value representing the overall sustainability level of this particular grid cell. These grid cell values via the aggregation method in the GIS environment are converted into other geographical scales of analysis, such as street, neighbourhood, CCD, suburb and city [31]. As well as the composite urban sustainability map, a map each is prepared for all indicators, indicator sets, and indicator categories. Figure 2 above illustrates the basic composite urban sustainability indexing structure of the GIS-based model.

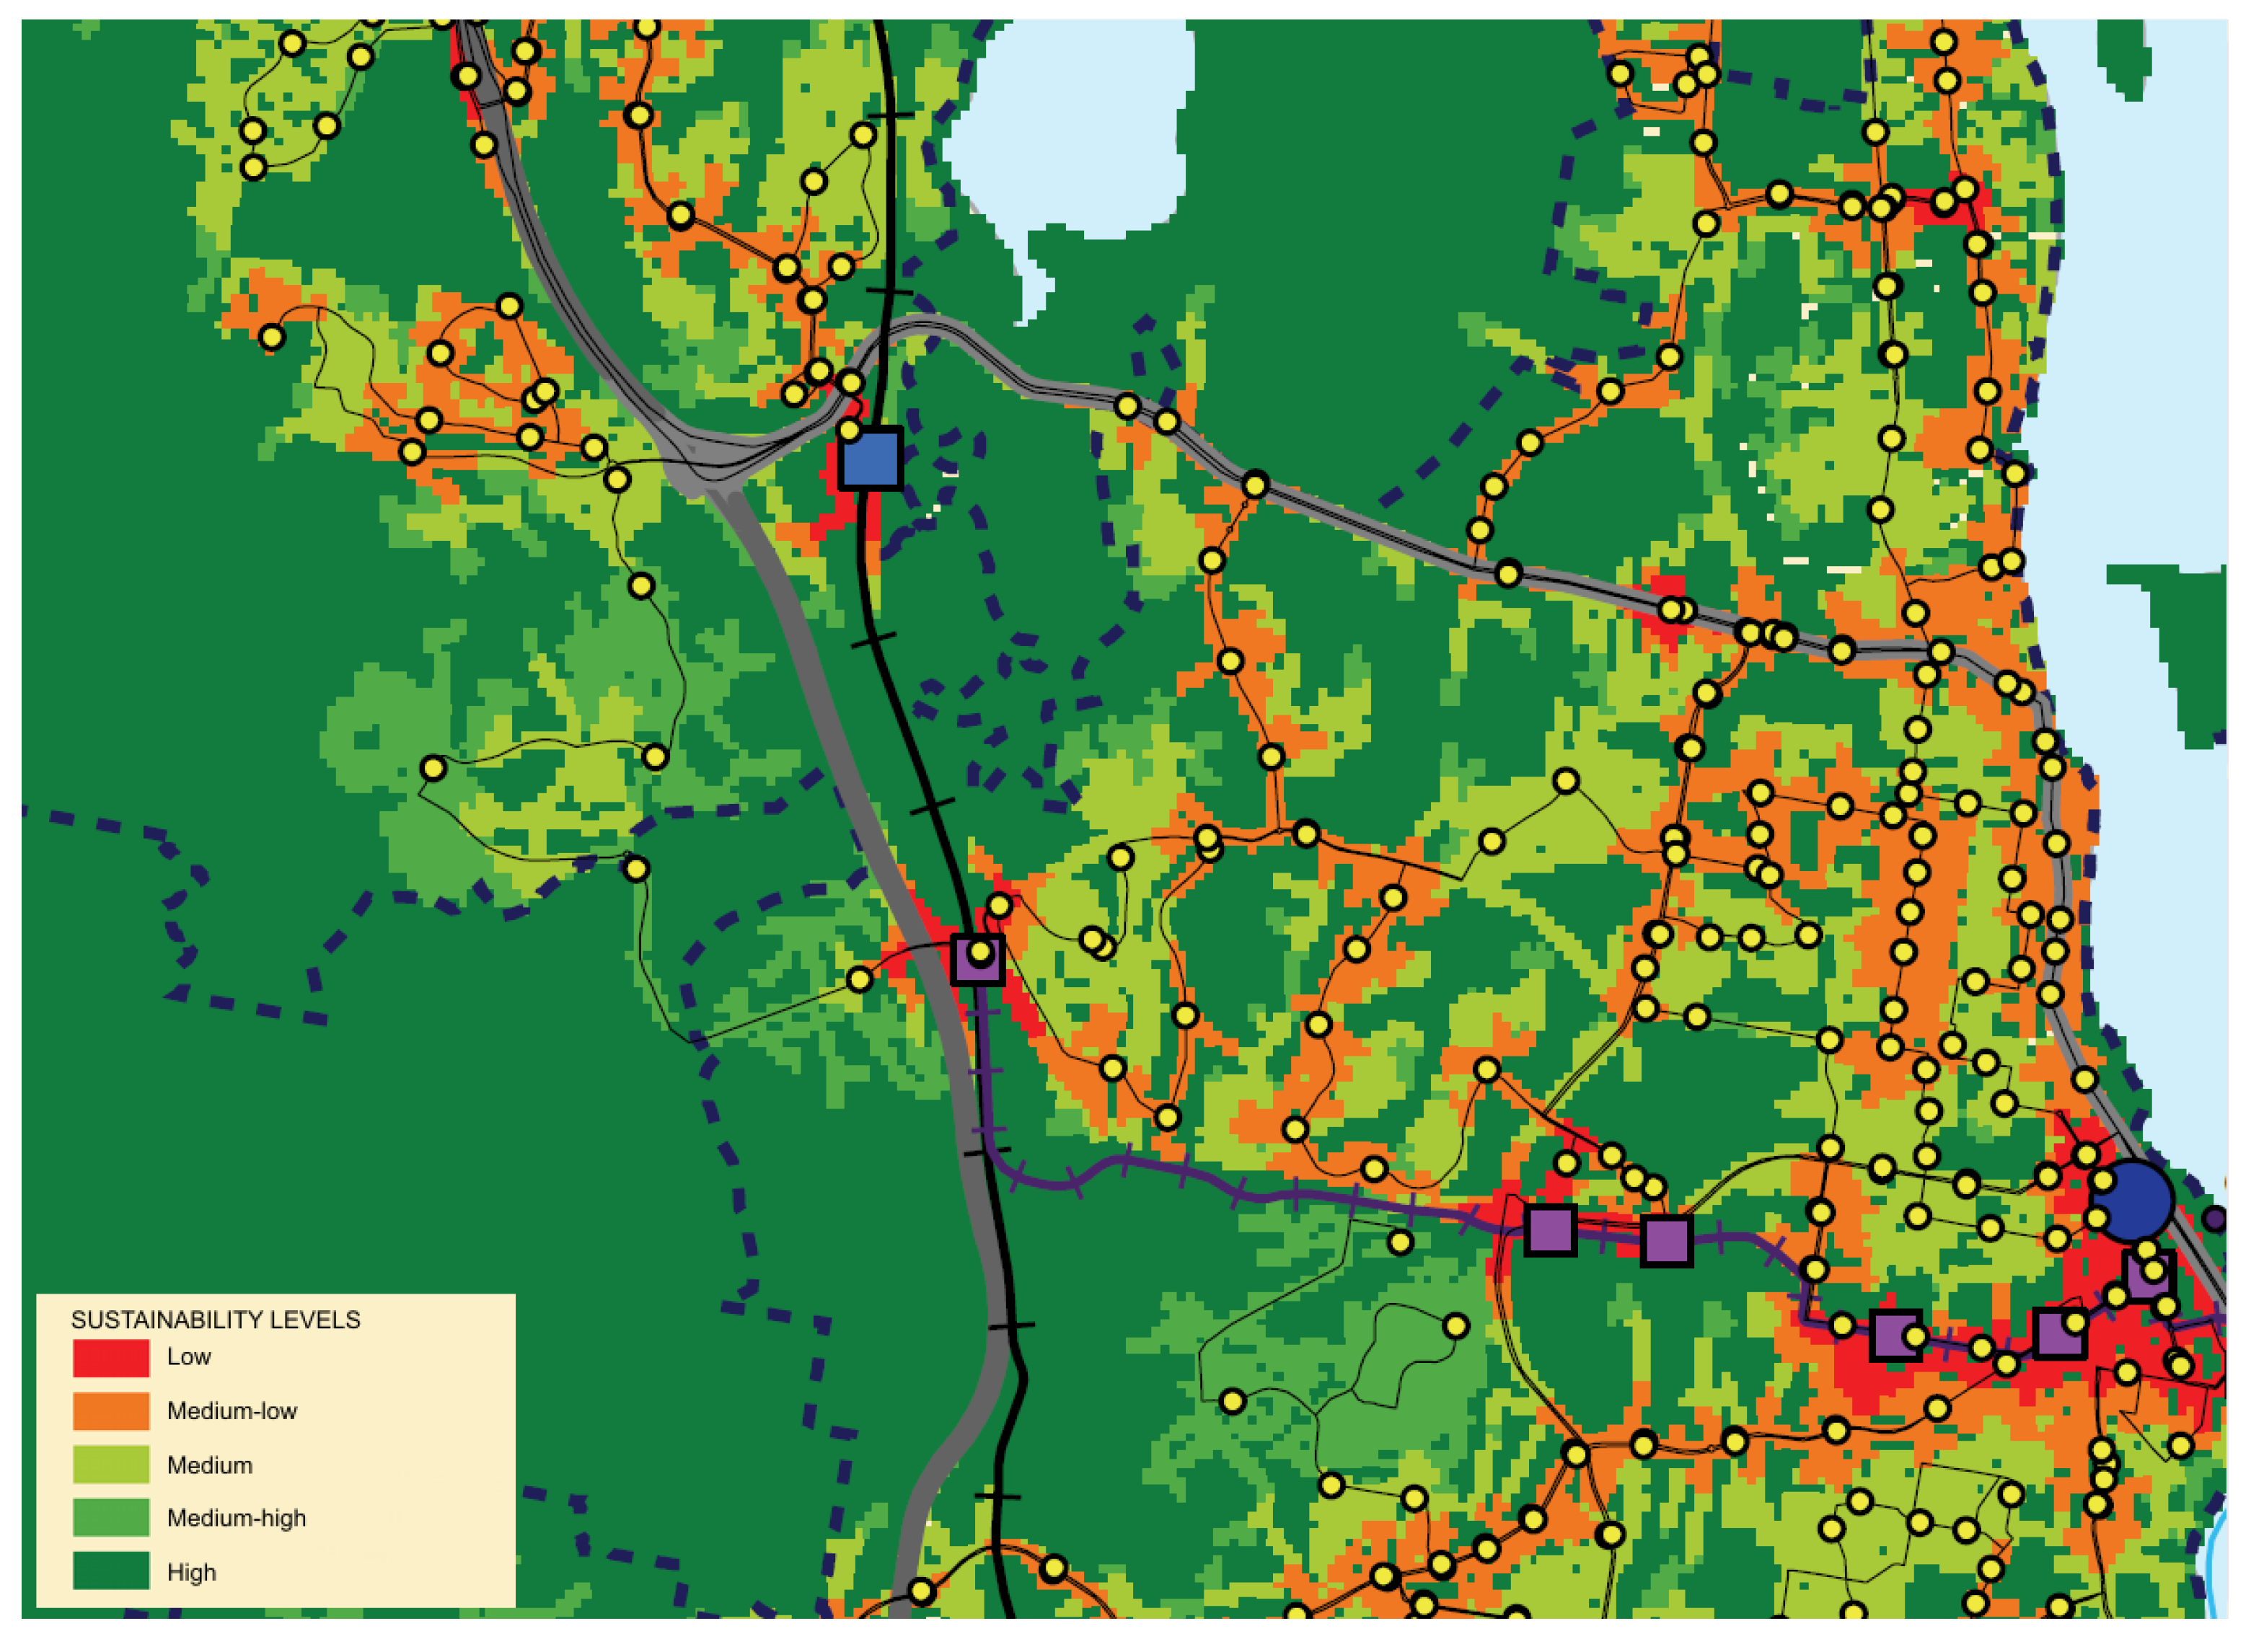
3.4. Policy Support Base of the Model

The SILENT Model develops a set of indices and a composite sustainability index to be used for benchmarking and performance assessment of comparative urban sustainability levels and development of relevant policies and strategies, considering both current and future comparative sustainability levels. This allows for the review of the capacity and comparative sustainability levels of current urban formation, and enables the forecasting of future scenarios, via simulation, which local and state governments, planning institutions and firms and local community organisations could highly benefit from.
This indexing model can be used for informing policy, strategy formation and also as a planning or decision support system. Some of the particular planning policy areas that the SILENT Model is relevant to include: Planning and managing sustainable urban development; Planning the development of sustainable transport infrastructure and services; Planning for and prioritising sustainable urban infrastructure; Assessing the development applications; Designating conservation areas; Safeguarding existing environmental assets and values; Developing policies for sustainability and intervening with unsustainable development; Increasing awareness among the community via participatory planning mechanisms promoting urban sustainability.
The SILENT Model has the communicative advantage of being easy to convey comparative levels of sustainability, making it a relatively simple exercise for both the general public and decision makers to understand. The model can also be used for forecasting, with future infrastructure scenarios to be evaluated using predicted data and development trends.
As the SILENT Model is recently developed, at this early stage of the project it could only be tested with dummy figures in a case study in the Gold Coast, Australia. The main purpose of this dummy pilot study is not to measure accurate sustainability levels, but to see whether the model works properly and provides meaningful findings. Figure 3 below demonstrates an example of the composite index developed for part of the Gold Coast City by using hypothetical data. Unsurprisingly the application of the model in a hypothetical exercise in the Gold Coast showed that areas around major arterial roads and main activity centres generally have low sustainability levels compared to those close to green spaces and natural environment. This experiment has demonstrated that the model in the broad sense working properly and ready for minor adjustments and calibration. Once the model is calibrated based on this pilot testing, it will be run with real data.
Figure 3. Sample Composite Indexing Map of the SILENT Model.
Sustainability 02 00321 g003
Authors of this paper and the rest of the research team are commissioned by the Local Government of Gold Coast City, and the State Transport Authority of Queensland Transport and Main Roads, to undertake a case study for the three selected Gold Coast suburbs—Coomera, Helensvale and Nerang—by using the SILENT Model to provide more accurate assessment of their existing and future sustainability levels. The data collection stage of this case study has already been commenced and it is expected to be completed in early 2010, and then the SILENT Model will be applied to the selected suburbs of the Gold Coast.

4. Conclusions

The research results demonstrate that it is possible to produce a viable local level sustainability assessment model, apply the model to a major urban area (e.g., Gold Coast City), and produce a mappable sustainability index. However, this paper only describes the first iteration of the SILENT Model. In this first run we only looked at the basic four key dimensions of urban sustainability (i.e., urban demography, land use and urban form, transport and the environment). Parallel to the views of Gasparatos et al. [40,41], we also acknowledge that additional aspects are also needed to be considered (e.g., equity, participation, and the precautionary principle). Hence, further research is anticipated which will focus on enhancing the model by testing various indicators in order to best reflect comparative sustainability levels of urban localities. Another area for further development and amendment of the model involves the inclusion of infrastructures other than transport (e.g., water, sewerage, stormwater, power) in to the SILENT Model. Moreover, decreasing the grid cell sizes and developing a parcel-based module of the model are among the improvements to be explored in future refinements. All these improvements will also be tested in several pilot studies, and several sensitivity analyses with different weightings will be conducted before the model is potentially adopted into Gold Coast City Council’s planning mechanism.
While still in its infancy, the SILENT Model has been tested on the Gold Coast case study by using hypothetical data. The sustainability indexing and assessment experience has shown that, when fully operationalised, the model has the potential to help planners and policy makers to pursue an integrated framework for locally adoptable sustainability policies. The model is useful in providing unambiguous representation of relationships in urban form and problem areas of urban settings and, where necessary, policies can be tested and accommodated. The model employs a holistic view of urban dynamics and is not only an invaluable sustainability and environmental impact assessment model, but also a practical planning decision support system. When considered in the context of growing population, urban and environmental problems and climate change, the SILENT Model has an immense potential to aid involved parties in forming sustainable urban and transport development policies and in monitoring their impacts on the environment.

Appendix 1. Indicator System of the SILENT Model.

Indicator CategoriesIndicator SetsIndividual IndicatorsIndicator DescriptionsIndicatorParametersFormulas Used for Assessment
DemographyResidential characteristicsPopulation density Total residents per study area divisionResidents/gross m² (Number of residents living in a Census Collection District (CCD))/(Area of the CCD)
Labour force participationTotal number of employees in the study area divisionEmployees (Number of full-time and part-time employees in a CCD)
Car ownershipPer capita automobiles per gross study area divisionAutomobiles per capita(Number of automobiles in a CCD)/(Number of people in the CCD)
Employment characteristicsJob to housing balance Total number of jobs per dwelling unitsJobs/dwelling unit or jobs/unit area (Number of employees working at the designated CCD)/(Area of the CCD)
Employment density Number of employees per hectare of land designated for employment useEmployees/unit of area(Number of employees working at the employment centre)/(Area in hectare of the employment centre)
Land-Use & Urban FormHousing compactnessMix use ratioProportion of mix or dissimilar developed land uses among a grid of cells of user-defined size (e.g., 100 × 100 m), expressed on a scale of 0 to 1, which includes vertical dissimilarity in mixed-use cellsScale 0 to1 M i = i = 1 n ( D i + a = 1 8 D a ) i = 1 n ( U i + a = 1 8 U a )
U i : Uses at cell i
D i : Uses at cell i dissimilar to another use at cell i (vertical mix)
U a : Uses at adjacent cell a
D a : Uses at cell a dissimilar to another use at cell i (horizontal mix)
M i : Use mix at cell i.
Dwelling density Dwelling units per gross study area divisionDwelling unit /gross m²(Number of dwellings in a residential block)/(Area of the block)
Single-family parcel size Average size of single-family residential parcel in m²Average parcel size in square meters(Total area of single-family residential parcels in a block)/(Total number of single-family residential parcels in the block)
Single-family dwelling density Single-family dwelling units per net hectare of land designated for single-family useDwelling unit /area(Number of single family dwellings in a block × 10,000)/(Area of the block)
Multifamily dwelling density Multi-family dwelling units per net hectare of land designated for multifamily use Dwelling unit /area(Number of multi-family dwellings in a block × 10,000)/(Area of the block)
Local amenitiesRecreation facility supply Area of recreational facilities (separately) per 1,000 residentsm²s/1,000 persons(Area for recreational facilities × 1,000)/(number of residents in CCD)
Socio-cultural facility supplyArea of socio-cultural facilities (separately) per 1,000 residentsm²s/1,000 persons(Area for socio-cultural facilities × 1,000)/(number of residents in CCD)
TransportTransit orientationTransit adjacency to residents and services Percentage of residents within the user-defined linear distance of designated amenities% population w/i user buffer(Number of residents w/i the buffer of walkable distance)/(Total number of residents)
Transit patronage ratioPercentage of residents and employees using public transport (PT)% population (Number of people using PT in a CCD)/(Total number of people in the CCD)
Non-automobile travel patternTransit adjacency to employment Percentage of employees within the user-defined linear distance of designated amenities% employees w/i buffer(Number of employees w/i the buffer of walkable distance)/(Total number of employees)
Transit proximity to employment Average travel distance/time from all workplaces to closest designated amenitiesAverage walk dist/time to closest stop ( P p × E p ) E w
P p : shortest network path travel time by walking in minutes from parcel p to a stop
E w : number of employees w/i walking distance to the stop
Pedestrian network coverage Percentage of total street frontage with improved sidewalks on both sides% of streets w/sidewalks ( C s × L s ) L s
C s : percentage of sidewalk completeness for street segment s in a CCD
L s : length in m of street segment s in the CCD
Bicycle network coverage Percentage of total street centerline distance with designated bike-route% street centreline w/i bike route(Length of bicycle route)/(length of streets)
Automobile travel patternHome-based vehicle kilometres travelled Average daily home-based vehicle kms traveled (VKT) per capitakm/day/capita(Total daily home-based VKT in a CCD)/(Total number of people in the CCD)
Non-home-based vehicle kilometres travelled Average daily non-home-based vehicle kms traveled per capitakm/day/capita(Total daily non-home-based VKT in a CCD)/(Total number of people in the CCD)
Number of home-based vehicle trips Average daily home-based vehicle trips produced per capitatrips/day/capita(Total daily home-based trips in a CCD)/(Total number of people in the CCD)
Number of non-home-based vehicle tripsAverage daily non-home-based vehicle trips produced per capitatrips/day/capita(Total daily non-home-based trips in a CCD)/(Total number of people in the CCD)
Parking supply in employment centresAverage number of parking lots per employeeparking space/employee (Area of parking area in a employment centre)/(Number of employees in the CCD)
EnvironmentResidential resource consumptionWastewater generation Total study area daily wastewater generation in litreslitres/day(Daily wastewater production per household)
Solid waste generationTotal study area daily solid waste generation in kgkg/day(Daily solid waste production per household)
Energy use Total study area annual energy use (non-renewable) in btuMMBtu/yr/capita(Annual energy consumption per household)
Residential water consumption Average daily residential water consumption in litreslitres/day/capita(Daily water used for internal and landscaping uses)/(Number of people)
Pollution generated from trafficGreenhouse emissions generated Average annual CO2 emissions coming from transport activitieskg/capita/yr(Annual total VKT × CO2 emission per km)/(Total number of the people)
Stormwater runoff pollution generatedAverage annual pollution coming from impervious surfaces (particularly roads)kg/yr(Annual total build-up of petroleum hydrocarbons, heavy metals and solids on the road surfaces)
Noise pollution generatedNumber of people exposed to traffic related noiseResidents(Number of people living along the main arterials’ buffer of 55 dB)

Acknowledgements

The paper is a preliminary outcome of an Australian Research Council Linkage Project, ARC-LP0882637: Adaptation of Water Sensitive Urban Design to Climate Change, Changing Transport Patterns and Urban Form. The project is jointly funded by the Commonwealth Government of Australia, Gold Coast City Council, Queensland Transport and Main Roads and Queensland University of Technology. The authors would like to acknowledge abovementioned project partners and the research team’s support and diligent work, and also would like to thank the reviewers for their comments that helped us to improve the manuscript.

References

  1. Yigitcanlar, T.; Fabian, L.; Coiacetto, E. Challenges to urban transport sustainability and smart transport in a tourist city: The Gold Coast, Australia. Open Transport. J. 2008, 1, 19–36. [Google Scholar]
  2. Teriman, S.; Yigitcanlar, T.; Mayere, S. Urban sustainability and growth management in South-East Asian city-regions: The case of Kuala Lumpur and Hong Kong. Plann. Malays. 2009, 7, 47–68. [Google Scholar]
  3. Hemphill, L.; Berry, J.; McGreal, S. An indicator-based approach to measuring sustainable urban regeneration performance. Urban Stud. 2004, 41, 725–755. [Google Scholar] [CrossRef]
  4. Hezri, A.A. Utilisation of sustainability indicators and impact through policy learning in the Malaysian policy process. J. Environ. Assess. Pol. Manag. 2005, 7, 575–595. [Google Scholar] [CrossRef]
  5. Singh, R.K.; Murty, H.R.; Gupta, S.K.; Dikshit, A.K. An overview of sustainability assessment methodologies. Ecol. Indicat. 2009, 9, 189–212. [Google Scholar] [CrossRef]
  6. Brownhill, D.; Rao, S. A Sustainability Checklist for Developments: A Common Framework for Developers and Local Authorities; BRE Press: London, UK, 2002. [Google Scholar]
  7. Europe’s Environment: The Dobris Assessment; Stanners, D.; Bourdeau, P. (Eds.) European Environment Agency: Copenhagen, Denmark, 1995.
  8. Brandon, P. Foreword. In Sustainable Urban Development: The Framework and Protocols for Environmental Assessment; Curwell, S., Deakin, M., Symes, M., Eds.; Routledge: New York, NY, USA, 2002. [Google Scholar]
  9. Indicators of Sustainable Development: Guidelines and Methodologies; United Nations Publications: New York, NY, USA, 2007.
  10. Environmental Indicators; Organisation for Economic Cooperation and Development Press: Paris, France, 1994.
  11. Impact Assessment and Sustainable Development: European Practice and Experience; George, C.; Kirkpatrick, C. (Eds.) Edward Elgar Publishing: London, UK, 2007.
  12. Foley, B.; Daniell, A.; Trevor, M.A. Sustainability tool for intrasectoral and intersectoral water resources decision making. Aust. J. Water Resour. 2004, 8, 11–19. [Google Scholar]
  13. Norman, W.; MacDonald, C. Getting to the bottom of triple bottom line. Bus. Ethics Q. 2004, 14, 243–262. [Google Scholar] [CrossRef]
  14. Karol, P.; Brunner, J. Tools for measuring progress towards sustainable neighborhood environments. Sustainability 2009, 1, 612–627. [Google Scholar] [CrossRef]
  15. Hacking, T.; Guthrie, P. A framework for clarifying the meaning of triple bottom-line: Integrated, and sustainability assessment. Environ. Impact Assess. Rev. 2008, 28, 73–89. [Google Scholar] [CrossRef]
  16. Shepherd, A.; Ortolano, L. Strategic environmental assessment for sustainable urban development. Environ. Impact Assess. Rev. 1996, 16, 321–335. [Google Scholar] [CrossRef]
  17. Dalal-Clayton, B.; Sadler, B. Strategic Environmental Assessment: A Sourcebook and Reference Guide to International Experience; Earthscan: London, UK, 2005. [Google Scholar]
  18. Handbook on Constructing Composite Indicators: Methodology and User Guide; Organisation for Economic Co-operation and Development (OECD): Paris, France, 2008.
  19. Meadows, D. Indicators and Information Systems for Sustainable Development; The Sustainability Institute: Hartland, WI, USA, 1998. [Google Scholar]
  20. Warhurst, A. Sustainability Indicators and Sustainability Performance Management; International Institute for Environment and Development: Warwick, UK, 2003. [Google Scholar]
  21. Wackernagel, M.; Rees, W.E. Our Ecological Footprint: Reducing Human Impact on the Earth; New Society Publishers: Philadelphia, PA, USA, 1996. [Google Scholar]
  22. Wackernagel, M.; Kitzes, J.; Moran, D.; Goldfinger, S.; Thomas, M. The ecological footprint of cities and regions: Comparing resource availability with resource demand. Environ. Urban. 2006, 18, 103–112. [Google Scholar] [CrossRef]
  23. McManus, P.; Halighton, G. Planning with ecological footprints: A sympathetic critique of theory and practice. Environ. Urban. 2006, 18, 113–127. [Google Scholar] [CrossRef]
  24. Atkisson, A. Developing indicators of sustainable community: lessons from sustainable Seattle. Environ. Impact Assess. Rev. 1996, 16, 337–350. [Google Scholar] [CrossRef]
  25. Atkisson, A.; Hatcher, R.L. The compass index of sustainability: Prototype for a comprehensive sustainability information system. J. Environ. Assess. Pol. Manag. 2001, 3, 509–532. [Google Scholar]
  26. Valentin, A.; Spangenberg, J.H. A guide to community sustainability indicators. Environ. Impact Assess. Rev. 2000, 20, 381–392. [Google Scholar] [CrossRef]
  27. Astleithner, F.; Hamedinger, A.; Holman, N.; Rydin, Y. Institutions and indicators: The discourse about indicators in the context of sustainability. J. Hous. Built. Environ. 2004, 19, 7–24. [Google Scholar] [CrossRef]
  28. Lautso, K.; Spiekermann, K.; Wegener, M. Modelling policies for urban sustainability. In Proceedings of the 42nd Congress of the European Regional Science Association, Dortmund, Germany, August 2002.
  29. Maclaren, V.W. Urban sustainability reporting. J. Am. Plann. Assoc. 1996, 62, 184–202. [Google Scholar] [CrossRef]
  30. Hak, T.; Moldan, B.; Dahl, A.L. Sustainability Indicators: A Scientific Assessment; Island Press: Washington, DC, USA, 2007. [Google Scholar]
  31. Yigitcanlar, T.; Sipe, N.; Evans, R.; Pitot, M. A GIS-based land use and public transport accessibility indexing model. Aust. Plan. 2007, 44, 30–37. [Google Scholar] [CrossRef] [Green Version]
  32. Hanafizadeh, M.R.; Saghaei, A.; Hanafizadeh, P. An index for cross-country analysis of ICT infrastructure and access. Telecomm. Pol. 2009, 33, 385–405. [Google Scholar] [CrossRef]
  33. Gasparatos, A.; El-Haram, M.; Horner, M. The argument against a reductionist approach for assessing sustainability. In Proceedings of International Conference on Whole Life Urban Sustainability and Its Assessment, Glasgow, UK, June 2007.
  34. Hass, J.L.; Brunvoll, F.; Hoie, H. Overview of Sustainable Development Indicators Used by National and International Agencies; Organisation for Economic Co-operation and Development (OECD): Paris, France, February 2002. [Google Scholar]
  35. Towards a Local Sustainability Profile: European Common Indicators; Technical Report for European Commission: Brussels, Belgium, 2001.
  36. Munda, G. Multiple criteria decision analysis and sustainable developmen. In Multiple Criteria Decision Analysis: State of the Art Surveys; Figueira, J., Greco, S., Ehrogott, M., Eds.; Springer: New York, NY, USA, 2005; pp. 953–986. [Google Scholar]
  37. Schlossberg, M.; Zimmerman, A. Developing state-wide indices of environmental, economic, and social sustainability: A look at Oregon and the Oregon Benchmarks. Local Environ. 2003, 8, 641–660. [Google Scholar] [CrossRef]
  38. Frame, B.; Vale, R. Increasing uptake of low impact urban design and development: The role of sustainability assessment systems. Local Environ. 2006, 11, 287–306. [Google Scholar] [CrossRef]
  39. Neuman, M. Infiltrating infrastructures: On the nature of networked infrastructure. J. Urban Technol. 2006, 13, 3–31. [Google Scholar] [CrossRef]
  40. Gasparatos, A.; El-Haram, M.; Horner, M. The argument against a reductionist approach for measuring the progress towards sustainability. Account. Forum 2009, 33, 245–256. [Google Scholar] [CrossRef]
  41. Gasparatos, A.; El-Haram, M.; Horner, M. A critical review of reductionist approaches for measuring the progress towards sustainability. Environ. Impact Assess. Rev. 2008, 28, 286–311. [Google Scholar] [CrossRef]

