2. Theoretical and Political Context
The strategy of eco-efficiency originates from a more general idea of how society could be transformed in order to solve environmental problems: the reform-oriented school of ecological modernization which emerged in Europe during the early 1980s [
7]. A basic assumption of ecological modernization is the idea of environmental re-adaptation of economic growth and industrial development, as echoed by the aforementioned notion of producing more with less.
The debate on eco-efficiency and ecological modernization has focused on the marginal environmental efficiency of industrial production; that is, the resource use or emissions and waste per unit of production or per price unit. The final output has been subject to less attention; that is, whether applying a strategy of eco-efficiency has actually reduced the environmental pressure in society as a whole, or just literally moved the pressure to other regions or related economic activities, often referred to as “rebound” or “spill-over” effects [
8]. Another under-explored issue is the environmental effects of the increased mobility levels inherent in the production processes [
9].
The term “ecological footprint” (EF) emerged from a critique of the concepts of eco-efficiency and ecological modernization and the policies developed on the basis of these two concepts. The term was coined by William Rees and Mathis Wackernagel at the University of British Columbia in the early 1990s [
10,
11,
12]. The basic idea behind EF is that Earth’s land area is finite, whereas mankind is increasing in numbers. All human functions—and resource use—require land use, primarily biologically productive land. EF pinpoints the need for a “cradle-to-grave” focus on both production and consumption, and the global consequences of everyday local behavior. Unlike commonly used analytical tools, the footprint also incorporates the concept of global distribution, a long-term perspective, as well as volume. The latter concerns increased attention on consumption and related environmental impacts, adding to the critiques of the goal of economic growth developed during the 1960s and 1970s by high-profiled academics such as Herman Daly [
13] and Edward J. Mishan [
14].
Using EF as a sustainability indicator has been criticized in two opposite ways: for being too limited and for being too broad. EF has been criticized for not including problems related to chemicals, heavy metals and radioactive substances in footprint analyses. This limitation also applies to the quality of the environment and the consumption of water (e.g., [
15]). On the other hand, EF has been criticized for including too many environmental aspects and then reducing them to one single unit: the hectare [
16]. This, in turn, can lead to two problems: First, that such complicated calculations are very vulnerable to the choice of suppositions, thus making it difficult to compare calculations made by different authors. Small differences in a supposition can result in very different figures. The second problem pertains to transparency. The complexity of the EF calculations tends to create a “black box” situation, meaning that politicians, lay men and even researchers outside of the “EF community” may find it difficult to assess how calculations are actually made, thus making it hard to enter into a meaningful discussion about the results from such calculations. A strategy to reduce the problems outlined above is to be cautious of sophisticating the EF methodology even more (e.g., include more resource-use categories in the calculations) and to focus on the relative changes in footprints rather than the absolute figures [
17]. Thus, in the project this article relies on, the latter approach was chosen.
This paper is based on the results from a project commissioned by two Norwegian ministries in 2007: the Ministry of Children and Equality (which handles consumption issues) and the Ministry of the Environment. The project was carried out by Western Norway Research Institute [
2] and was set up to compare the environmental impact of production and consumption in Norway. The background for carrying out such a comparison was a wish among officials in the two ministries to move sustainable consumption issues higher up the agenda of Norwegian politicians. This wish was in turn partly trigged by a Norwegian Official Report presented by the government-appointed Norwegian Commission on Low Emissions, which assessed the possibilities for reducing Norwegian emissions by 60% by the year 2050 compared with 1990 [
18]. In the introduction to this report, an important delimitation was made ([
19], p. 5): “A radical shift in the Norwegian way of life in a more climate-friendly direction could deliver major reductions in future GHG emissions. The Commission on Low Emissions has, nevertheless, chosen not to recommend such a strategy, because, among other things, we believe it would be politically impossible to put into effect”
(authors’ translation). The aforementioned ministries commissioned the report which forms the basis of this paper in order to address the challenging question of how GHG emissions from consumption could still be reduced.
In March 2008, the report was presented at an open seminar organized by the two ministries, with both ministers present. In a press release, the two ministers stated the following (
authors’ translation): “Showing consideration for the environment and climate should also have consequences for consumption. So far, the environmental aspect of consumption has not been subject to debate in Norway, and policy measures have mainly targeted production. It is time to start focusing on consumption” [
19].
During 2008, a discussion took place among a number of ministries as to whether a new commission should be appointed to supplement the work of the Norwegian Commission on Low Emissions. The outcome of these discussions was a decision by the government not to appoint such a commission for political reasons. The ruling parties feared that such a commission could strengthen the chances of the right-wing populist Progress Party to win the upcoming elections for parliament [
20]. The nature of this fear is outlined in a debate book by the social scientist and public debater Ottar Brox [
21], where an alternative to the prevailing climate policy is proposed.
3. Methods Applied
In order to compare the environmental pressure from production with the environmental pressure from consumption, we combined two sets of data: Official environmental indicators which mainly assess production activities, and our own calculation of the ecological footprint (EF) of consumption for the time period in question.
To assess the impact of production, we selected eight indicators commonly used by Norwegian authorities [
22]: (1) global emissions to air (GHG) from production; (2) regional emissions to air that contribute to acidification (SO
2, NO
x, NH
3, Fluor) from production; (3) local emissions to air (SO
2, CO, PM10, NMVOC, NO
x) from production; (4) emission/use of environmentally harmful substances from production; (5) emission of nutrients contributing to over-fertilization from production; (6) energy use in production; (7) waste from production; and (8) land-use management. To single out the production-related emissions, we used data from the National Accounts Matrix including Environmental Accounts (NAMEA). These are integrated environmental accounts developed by Statistics Norway for the purpose of comparing economic and environmental data by means of combining national accounts data and emission statistics at the industry level. NAMEA data apply the same economic definition of “Norway” as the national accounts. Thus, emissions related to private households (part of consumption, not production) are excluded and emissions from shipping and international air transport are included in order to produce a “pure” production related data set. The latter emissions are defined as production, but because they take place outside of Norway, they are usually not a part of the official environmental indicator calculations (like the indicators presented at
www.environment.no, which is hosted by The Ministry of Environment). Emissions from shipping and international air transport are limited to that of resident institutes operating in international transport.
Collecting the data on consumption and processing these data into EF figures was far more complicated, and consisted of six main steps: (1) assessing the amount of consumption in monetary or physical units from national statistics; (2) assessing the direct land use relating to Norwegian consumption; (3) calculating the direct and indirect energy use caused by Norwegian consumption; (4) calculating, by means of emission coefficients, energy-related GHG emissions based on input gathered in step 2; (5) calculating non-energy related emissions caused by Norwegian consumption; and (6) calculating Norway’s ecological footprint on the basis of (2), (3), (4) and (5).
Consumption data (1) were obtained from three main sources: the biannual national survey of consumer expenditure carried out by Statistics Norway, the periodically conducted National Travel Survey carried out by the Institute of Transport Economics, and import and export statistics produced by Norwegian Customs and Statistics Norway.
In assessing the direct land use (2) we have calculated four categories of land use: (a) farmed land and pasture used for food production, (b) sea area used for producing seafood, (c) forestry areas, and (d) built-up areas with physical infrastructure such as buildings and roads.
In assessing energy use (3), we began by estimating energy use by final users (end use) specified for all energy carriers and then estimated the primary consumption of energy sources, using conversion factors obtained from previous studies combined with other statistical sources. Where end use of energy was in the form of electricity, we differentiated between electricity that was consumed directly in Norway and electricity used to produce imports of European or global origin. We assessed eight categories of consumption-related end use of energy: (a) direct use for person transport; (b) indirect use for person transport, including the energy cost of vehicles and infrastructure; (c) direct use in dwellings; (d) direct use for commercial and public services; (e) indirect use for these services (i.e., energy use for production of inputs); (f) energy use for construction and maintenance of buildings in Norway; (g) energy use for food consumed in Norway; and (h) energy use for all other goods (i.e., goods other than food, vehicles and energy).
Once the primary energy use by fuel was calculated, the next step was to calculate energy-related GHG emissions
(4). We did this by using fuel-specific factors for emissions of CO2 equivalents (GWP 100) derived from the Norwegian Climate and Pollution Authority [
23].
We then estimated non-energy-related GHG emissions (5) caused by Norwegian consumption. Six categories of emissions were considered: (a) emissions of GHGs other than CO2 and GHG precursors from aircraft; (b) process emissions of CO2 in production of cement used for construction in Norway; (c) process emissions of methane (CH4) and nitrous oxide (N2O) from agricultural production for Norwegian consumption; (d) emissions of nitrous oxide (N2O) from the production of fertilizers; (e) emissions of methane (CH4) from municipal landfills in Norway; and (f) other process emissions from companies that manufacture products to be consumed in Norway. Agriculture by far constituted the most important source of non-energy emissions, followed by aviation. Process emissions from Norwegian agriculture were taken directly from national statistics; those relating to food imports were estimated via calculations of the amount of land used to produce the imports, and a specific add-on was used for rice imports. In the case of aviation, we used an average figure of our study shows that the additional global warming potential (GWP) per passenger kilometer was taken to be 0.72 times that resulting from CO2 emissions alone in 1987, rising to 0.8 times in 2006 because of a growth in the share of long-haul flights. Norwegian landfill emission figures were also taken directly from published statistics, and process emissions for fertilizer and cement production were based directly on Norwegian emission data (Norway is a net exporter of both products). Process emissions from other manufacturing activities were derived from International Panel of Climate Change (IPCC) estimates of global emissions, using the simplified assumption that Norway’s share in these emissions was equal to the country’s share in global consumption.
The final step was to calculate the ecological footprint of consumption
(6) on the basis of (2), (3), (4), and (5). This was done by applying footprint conversion factors developed by WWF (2001), see
Table 1 below. For additional information regarding the methods applied in our study, please refer to Hille
et al. [
2].
Table 1.
Conversion factors and weighting factors used for calculating ecological footprint. Adapted from [
24].
Table 1.
Conversion factors and weighting factors used for calculating ecological footprint. Adapted from [24].
| Factors | Conversion to square kilometers (km2) | Weighting | Ecological footprint
per unit |
|---|
| GHG emissions, 1,000 t carbon dioxide equivalents (CO2e) | 1.922 | 1 | 1.922 |
| Built-up land, km2 | 1 | 3.165 | 3.165 |
| Farmed land, km2 | 1 | 3.165 | 3.165 |
| Grazed land, km2 | 1 | 0.386 | 0.386 |
| Seafood consumption, t | 0.302 | 0.062 | 0.187 |
| Timber consumption, 1,000 cubic metres (m3) | 385 | 1 | 385 |
4. Results
Our study suggests that there has been a general reduction in the environmental pressure for many of the indicators related to the environmental impact of production in Norway (see
Table 2). Emissions of gases contributing to acidification—sulfur dioxide (SO2), ammonia (NH3), and nitrogen oxide (NOx) have been reduced. Moreover, local pollution (carbon monoxide (CO), particulate matter (PM10), non-methane volatile organic compounds (NMVOC), and nitrogen oxide (NOx) have been substantially reduced. Emissions and the use of environmentally harmful substances (such as PCB, pesticides,
etc.) have been reduced even more. The study also shows a decline in the annual biodiversity loss due to land conversion (commercial development). There are, however, four aspects that nuance the general conclusion that environmental impacts of Norwegian production have declined for the last decade or so.
Firstly, emissions from goods transport are an important element in explaining the increase in GHG emissions from Norwegian production. Since 1987 (to 2006), domestic goods transport by road has increased by about 115 per cent from 7.487 to 16.120 ton-km [
25].
Secondly, the large increase in emissions of nutrients contributing to over-fertilization of oceans mainly bears witness to the birth of a new commercial branch: fish farming. In other words, rising ocean fertilization does not point to a lack of environmental improvements in the various sectors that cause such emissions. If we leave out emissions from fish farming, our calculations show the result for this indicator would be a 23 percent reduction rather than an increase of 179 percent [
2]. A
third factor concerns the structure of Norwegian industry. Resource-intensive industrial sectors have achieved far greater reductions in environmental impact than less resource intensive industrial sectors. At the same time, Norway has a relatively high share of resource-intensive industries compared to other OECD countries where ‘knowledge-intensive’ industry has replaced heavy industry to a greater extent. This accounts for high emissions and high energy use within Norwegian industry. A
fourth factor concerns the increase in commercial waste. Our study shows that this development is mainly caused by an increase in waste from construction and industry (60% of the total increase, with an approximately equal share for the two mentioned categories of waste).
Table 2.
Environmental pressure from Norwegian production 1990–2006.
Table 2.
Environmental pressure from Norwegian production 1990–2006.
| Topics | Indicators | Change 1990–2006 |
|---|
| Air emissions | Annual emissions of GHG from production | +14% |
| Annual emissions of gases contributing to acidification | −22% |
| Annual emissions of gases contributing to local air pollution | −15% |
| Water emissions | Annual emissions of nutrients contributing to over-fertilization of ocean areas | +179% |
| Environmental toxins | Annual emissions/use of environmentally harmful substances | −58% |
| Resource management | Annual energy use | +21% |
| Annual amount of commercial waste (1) | +23% |
| Annual biodiversity loss due to land conversion | −3% |
One way of assessing the intensity of the environmental impact of production is to compare the development in the total environmental impact and the gross domestic product (GDP). In our case, this is possible because we have used the same system boundaries for calculating the environmental impacts of production as that of GDP. In
Table 3, we have created an index of the eight indicators shown in
Table 2 for measuring the environmental impacts of Norwegian production, simply adding up the relative values for each of the seven indicators and dividing by seven, figures from the year 1990 are set to 100. We also indexed the Norwegian GDP, setting the figures for 1990 to 100. Finally, we have created an index for the environmental impact intensity of Norwegian production by dividing the index for total environmental impact by the GDP. As can be seen, the environmental impact intensity of Norwegian production decreased from 1990 to 2006, although the decrease was smaller in the last couple of years. What the data shows, is an indication of increased eco-efficiency in Norwegian production. Examples of such improvements actually taking place from 1990 to 2006 include a 39% reduction in fuel consumption per person-kilometer in air travel abroad; a 20% reduction in energy consumption per square meter of housing area; a 10 to 30% reduction in energy consumption per ton of construction materials produced; a 26% reduction in farmed area per kilogram of cotton; and a 19 % reduction in farmed area per kilogram of wheat (29). Still, as illustrated in
Table 3, these improvements have partly been outweighed by an increase in the total amount of production.
Table 3.
Environmental impact intensity of Norwegian production 1990–2006.
Table 3.
Environmental impact intensity of Norwegian production 1990–2006.
| | 1990 | 1997 | 2006 |
|---|
| Total environmental impact index | 100 | 115 | 117 |
| GDP index | 100 | 133 | 164 |
| Environmental impact intensity index | 100 | 87 | 71 |
| Average annual change in environmental impact intensity index | n.a. | −191 | −174 |
Table 4 shows the development in Norwegians’ consumption for the period of 1987 to 2006 measured in physical units and converted into an ecological footprint. Over these 19 years, Norway’s ecological footprint increased by 12%. The largest increase is seen within the categories GHG emissions (+18%) and seafood consumption (+17%). GHG emissions increased as a result of several developments. First, person transport by Norwegians increased by 60% for all means of transport measured in person-kilometers. Air transport constituted half of this increase. Regular air transport abroad accounted for 38% of the total increase in person transport. Regular air transport abroad by Norwegians has increased by 860% from 1985 to 2005, measured in person-kilometers. A second reason why GHG emissions have grown is that the consumption of commodities other than food has increased. As an example, the amount of money spent on clothing and shoes increased by 147%. The amount of money spent on furniture and household equipment increased by 87% from 1987 to 2005.
The aforementioned increase in seafood consumption was not caused by an increase in fish consumption as such, but the effect of a shift from wild fish to farmed fish. The footprint of fish consumption thus increased as a result of the use of wild fish as fodder in fish farming (which explains 99% of the increase shown in
Table 4).
Table 4.
The total ecological footprint of Norwegian consumption, 1987–2006.
Table 4.
The total ecological footprint of Norwegian consumption, 1987–2006.
| Source | Physical consumption | Ecological footprint, km2 |
|---|
| 1987 | 1997 | 2006 | 1987 | 1997 | 2006 | Change |
|---|
| GHG emissions, 1,000 t CO2e | 68,245 | 75,006 | 80,842 | 131,167 | 144,162 | 155,378 | +18% |
| Built-up land, km2 | 2,390 | 2,532 | 2,622 | 7,564 | 8,014 | 8,299 | +10% |
| Farmed land, km2 | 16,351 | 15,911 | 17,433 | 51,181 | 49,020 | 50,697 | −1% |
| Grazed land, km2 | 45,597 | 48,234 | 49,904 | 17,600 | 18,618 | 19,263 | +9 % |
| Seafood consumption, tons | 170,800 | 187,100 | 205,100 | 3,198 | 3,503 | 3,726 | +17% |
| Timber consumption, 1,000 m3 | 9,782 | 9,516 | 10,601 | 37,661 | 36,637 | 40,814 | +8% |
| Total | n.a. | n.a. | n.a. | 248,371 | 259,954 | 278,177 | +12% |
In
Table 5, we show how the intensity of the environmental impact from Norwegian consumption measured in terms of ecological footprint has changed from 1987 to 2006. The intensity of the environmental impact is presented in two ways: from a national perspective (per capita ecological footprint), and in a global context (per capita ecological footprint related to the global development of per capita available bio-productive land).
Table 5.
Per capita ecological footprint of Norwegian consumption 1987–2006.
Table 5.
Per capita ecological footprint of Norwegian consumption 1987–2006.
| Factors | 1987 | 1997 | 2006 | Change 1987–2006 |
|---|
| Total footprint (km2) | 248,371 | 259,954 | 278,177 | +12% |
| Norwegian population (1,000 s) | 4,187 | 4,405 | 4,659 | +11% |
| Footprint per capita (hectares) | 593 | 590 | 597 | +1% |
| Index for Norwegian per capita footprint | 100 | 99 | 101 | +1% |
| Global mean population (millions) | 5,000 | 5,840 | 6,590 | +32% |
| Index for global land area available per person | 100 | 86 | 76 | −24% |
| Index for Norwegian per capita footprint divided by global land area available | 100 | 116 | 133 | +33% |
The national perspective gives the impression of a positive development, in the sense that the per capita ecological footprint of Norwegian consumption has been rather stable since 1987. This is due to the fact that while the total ecological footprint of Norwegian consumption has increased by 12%, the population has increased just as much over the same period of time. However, when placing Norwegian consumption in a global context, we must take into consideration that the global population has increased even more—by 32%—over the same time period, thus reducing the available global bio-productive land area by 24%. If we relate the development in the per capita ecological footprint of Norwegian consumption to the global reduction in available per capita bio-productive area, the ecological footprint per capita of Norwegian consumption in a global perspective has increased by 33%. In other words; an average Norwegian inhabitant appropriated—by means of consumption—33% more bio-productive land in 2006 than in 1987.
5. Discussion
In the introduction to this article we presented a hypothesis that in high-consuming industrialized countries such as Norway, the overall environmental impact of production has been reduced substantially over the last decade, whereas the overall environmental impact of consumption has increased. Our results support this hypothesis.
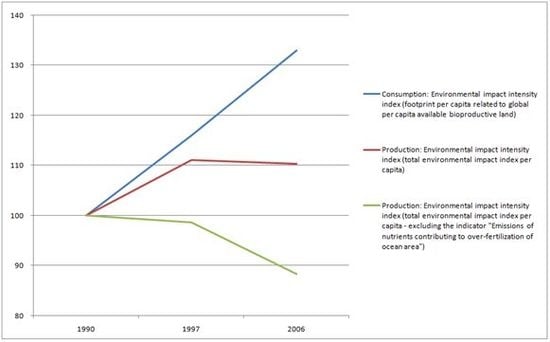
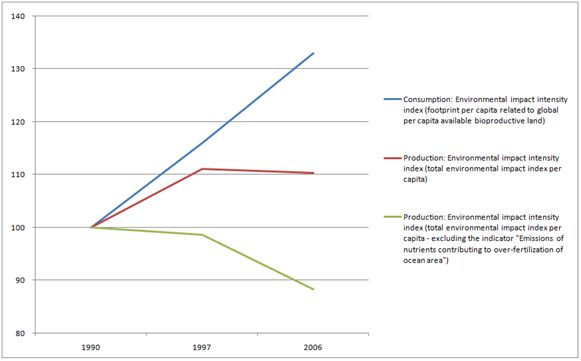
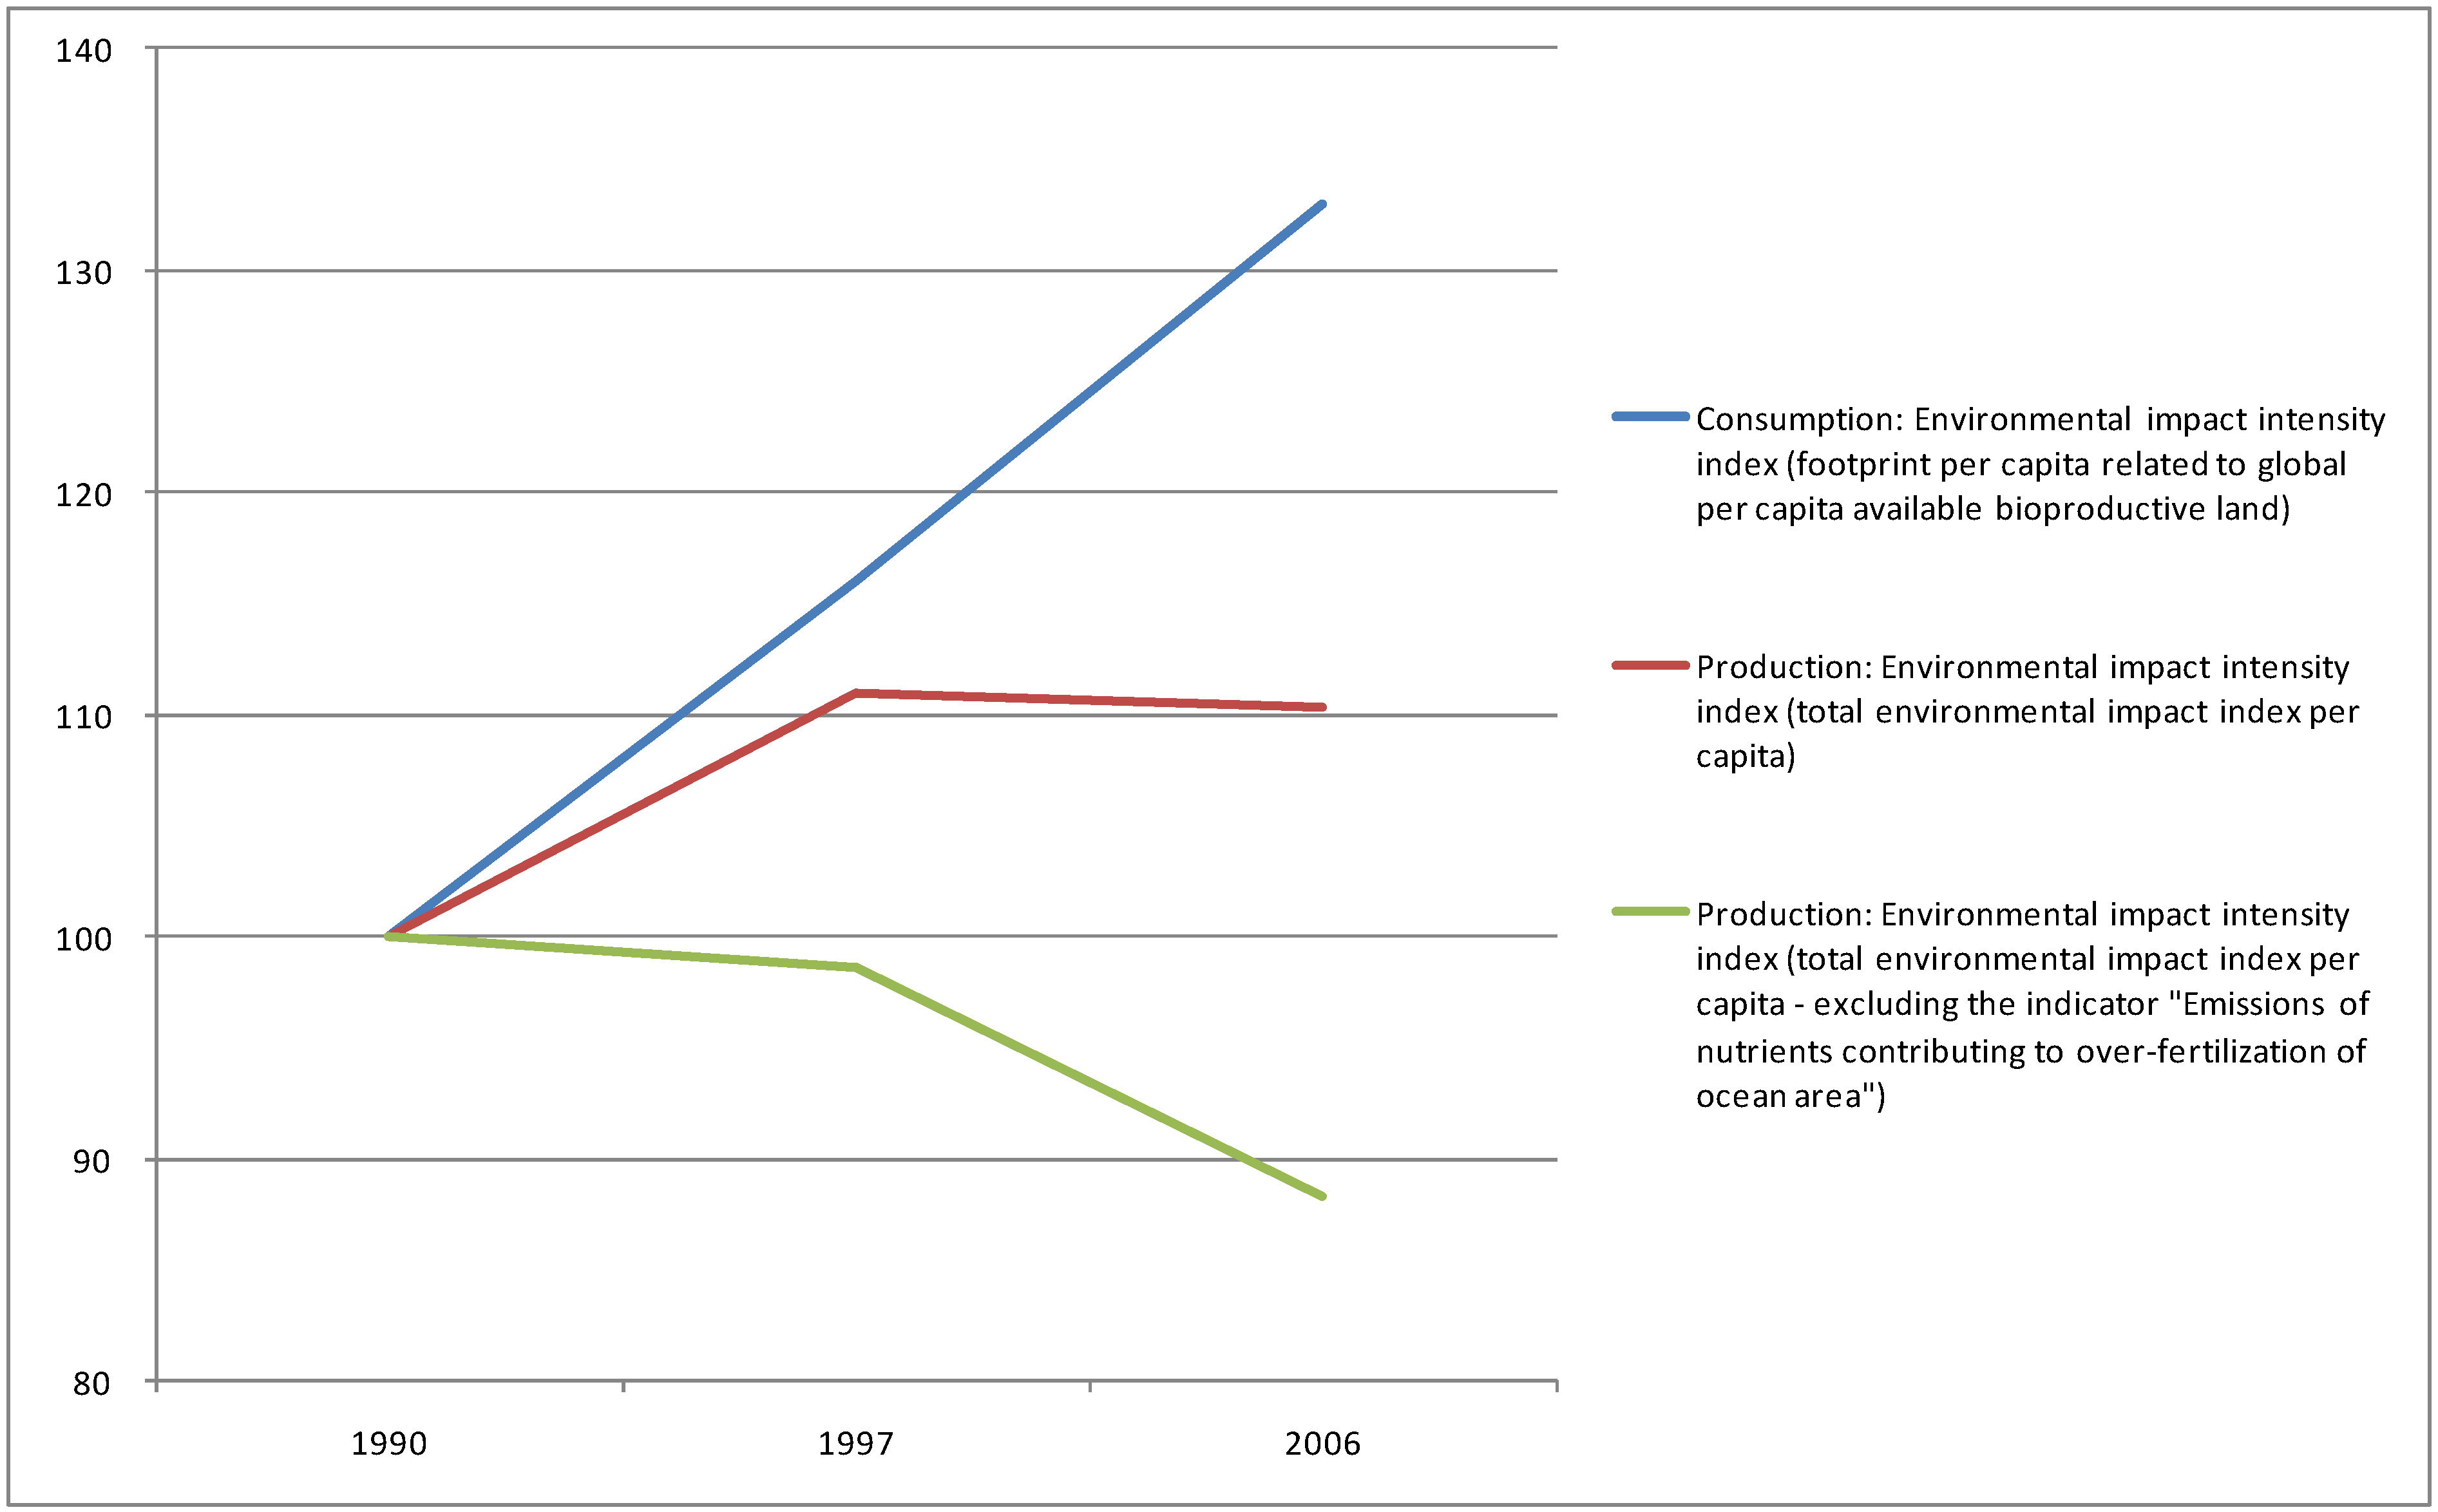
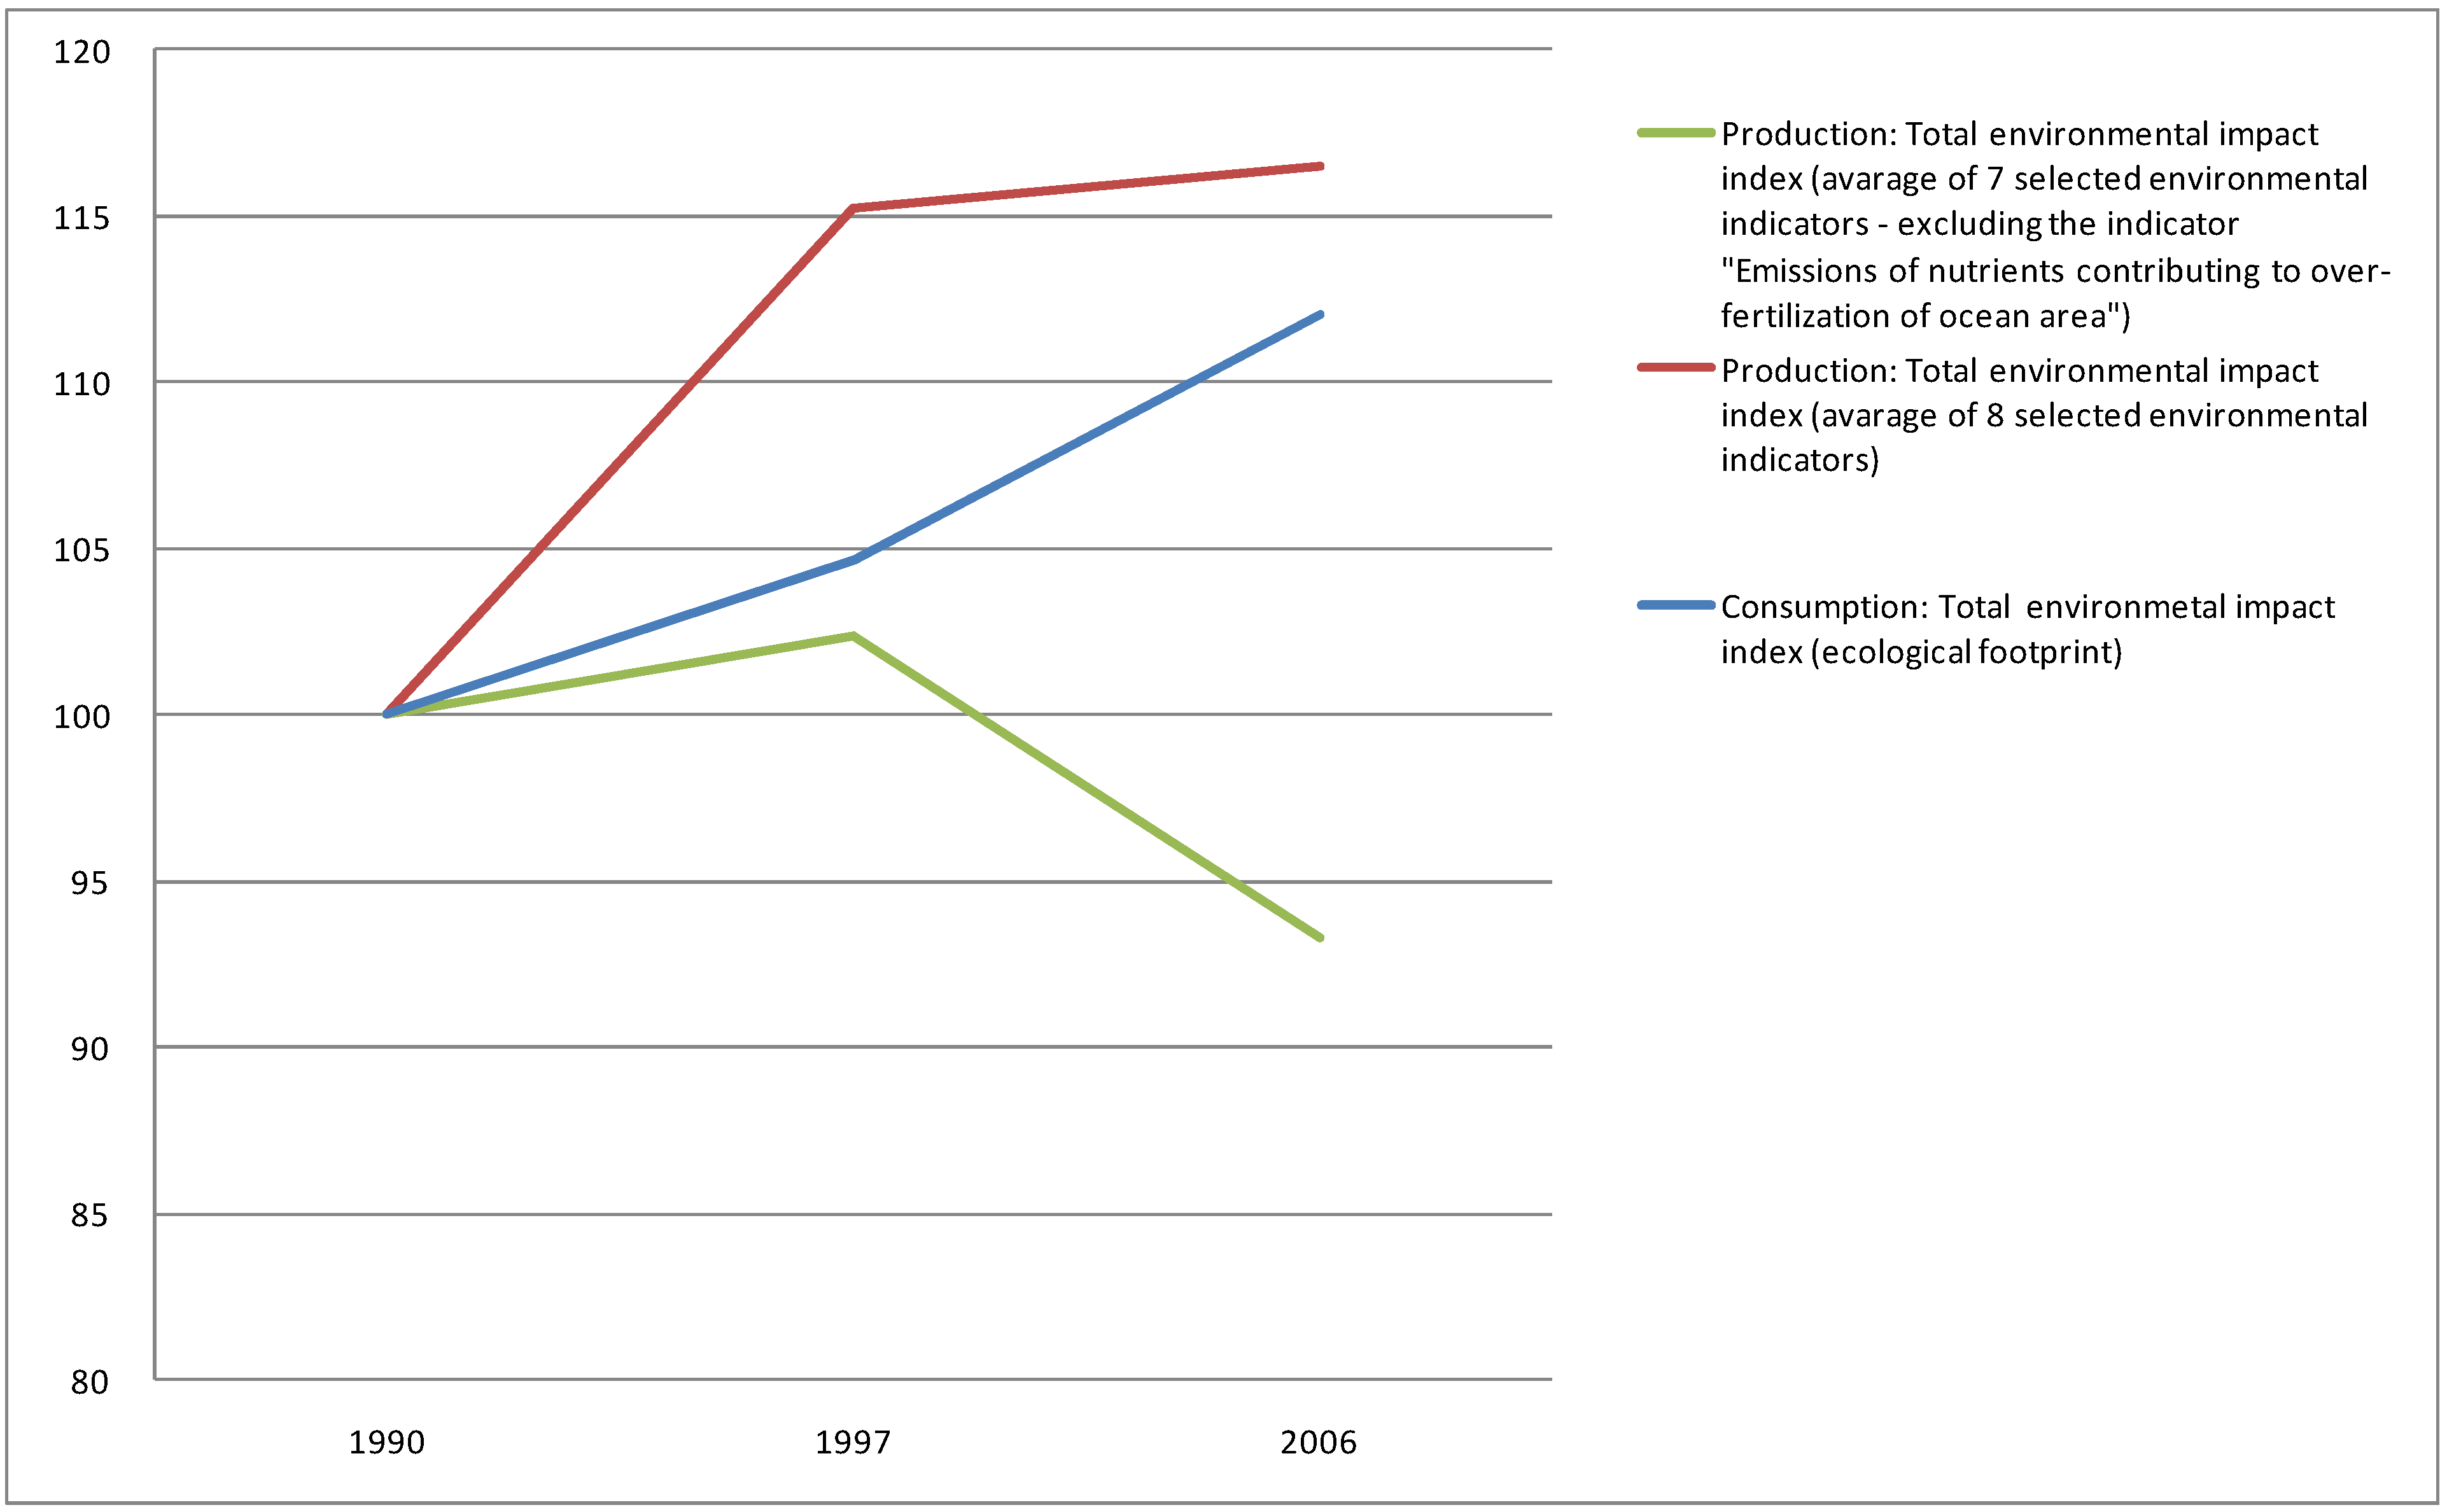
Figure 1 and
Figure 2 present indexes of the environmental impact of Norwegian production and consumption; the former summing up the total impact and the latter showing the impact intensity. In order to simplify the comparison between how environmental impacts from production and consumption have developed over time, we have reduced the environmental indicators for production presented in
Table 2 into one aggregated index (as described in relation to
Table 3). Furthermore, we have chosen not to weight any of the production indicators since it would be very difficult to construct any objective criteria, which state that, for example, GHG emissions are more environmentally important than any of the other indicators in
Table 2, and therefore should be weighted with a specified factor. For the case of production, we have illustrated the impact with and without the indicator for emissions of nutrients contributing to ocean over-fertilization, in order to illustrate the effect on the total environmental impact of Norwegian production due to the emergence of a new industry in Norway (fish farming). Thus the index without the contribution from fish farming will show a more just picture of the effects of eco-efficiency taking place in Norwegian production.
In order to make a more relevant comparison of the environmental intensity between consumption and production, we have related the total environmental impact index of production from
Table 3 to the number of inhabitants in Norway, thus allowing for a “per capita” comparison between the two indexes of consumption (ecological footprint per capita) and production.
The figures illustrate a situation of reduced environmental pressure from production and increased environmental pressure from consumption, especially if we look at the environmental impact intensity. This is a situation typical of countries like Norway, although the difference between the environmental pressure from production and consumption may be even larger in countries that have come further in the process of downscaling traditional industries than Norway [
3,
4,
5,
6]. What could explain the situation illustrated in
Figure 1 and
Figure 2, and what are the drivers behind this development? On the basis of our data, we find reason to highlight two drivers and one possible barrier. These will be elaborated in the following sections.
Figure 1.
Indexes for the total environmental impact of Norwegian production and consumption 1990–2006.
Figure 1.
Indexes for the total environmental impact of Norwegian production and consumption 1990–2006.
Figure 2.
Indexes for the environmental impact intensity of Norwegian production and consumption 1990–2006.
Figure 2.
Indexes for the environmental impact intensity of Norwegian production and consumption 1990–2006.
5.1. Mobility Increase
A dramatic increase in freight transportation has taken place in recent years, and constitutes an important factor in explaining the observed increase in many of the production related environmental indicators (e.g., those on GHG emissions, gases contributing to local air pollution, and energy use) as well as that of the ecological footprint of consumption. Furthermore, for the last decade or so we have seen a rapid increase in person transport. Both the continuous development of transport infrastructure, combined with technological changes that increase the rapidity of means of transport, contribute to the constant increase. When it comes to changing the current development, we distinguish between three generic strategies to reduce the environmental impact from transport [
26]. The first involves increasing energy efficiency in transport, the second involves changing to more environmentally friendly modes of transport, and the third approach is simply to reduce the volume of transport. Our figures lend support to the notion that the first two strategies are insufficient. Much of the increase in environmental pressure from both production and consumption can be explained by a very strong increase in the volume of freight and person transport; an increase that has in many cases outweighed both an increase in energy efficiency in transport and a shift towards more environmental modes of transport [
9,
26,
27]. Aviation provides a striking example. In a study by the Swedish Environmental Protection Agency, Swedish consumption-related emissions were estimated and reduction strategies proposed. As for long-haul flights, the following conclusion was put forward [
28]: “At present, there appears to be no technical solution that can limit the climate impact of aviation enough to allow for extensive flying”. In other words; reducing the very volume of long-haul flights is the only truly sustainable option [
29].
5.2. “Size Matters”
Our figures also support the more general idea that in the case of environmental pressure from consumption and production, “size”—
i.e., the volume of production and consumption—certainly matters. In the case of transport and many other categories of products and services, there is a general tendency that a volume increase outweighs higher eco-efficiency. This point is perhaps most relevant for consumption. There are numerous examples of policy attempts to reduce production volumes to mitigate negative environmental impact. One example includes the whole system of emission permits which in many cases defines a maximum limit for a specific factory. However, in the case of consumption there are very few examples of attempting to reduce volume through applying such policy instruments [
6,
30,
31]. If countries such as Norway really seek to address the environmental impacts of consumption in an effective way, there seems to be no other way than to include policy aimed at reducing some aspects of consumption [
32]. Strategies such as green consumerism and the notion of shifting our consumption to less environmentally harmful products and services, thus appear to be quite naïve.
5.3. Limits to Eco-Efficiency
In 1972, Meadows
et al. published the bestseller “Limits to Growth”. The notion presented was that there are physical limits to economic growth, in the form of limits to the natural resource base for economic production and limits to the natural sinks for emissions from production. That such limits actually exist has been thoroughly documented since the publication of “Limits to Growth”, also by the authors of the 1972 book in 1993 (“Beyond the Limits”) and 2004 (“Limits to Growth: The 30-Year Update”). These studies, like the one on which this article is based, give reason to pose the question of whether there are also limits to eco-efficiency. Furthermore, we should be able to specify what kinds of limits can be identified. There is obviously a much larger theoretical potential for eco-efficiency than what takes place in practice, taking into consideration the many studies elaborating on factor 10 [
33] and even factor 20 improvements [
16]. Hence, many of the limits to eco-efficiency are to be found in real-life implementation of desk-top technological solutions. Therefore, in trying to achieve a higher degree of eco-efficiency in society, more efforts should be put into describing the nature of non-technological barriers and developing policy means to avoid them. Furthermore, so long as eco-efficiency is most frequently being applied to alter production processes, it seems obvious that we either need to also apply eco-efficiency to consumption, or develop strategies for shifting consumption in a more sustainable direction.
6. A Consumption-Oriented Environmental Policy
In the introduction to this article we raised the question on how Norway’s environmental policy could be reshaped in light of the conclusions we draw from our empirical material (see the discussion above). The tables and figures above paint a picture which does not give Norway any reason for self-complacency. The essence of the Brundtland Report of 1987 could be summed up as follows: (1) The ecological footprint (though this term was not employed) was already too large in 1987, both globally and in the rich part of the world. (2) In 1987, there were great opportunities for producing “more out of less”, a challenge described by the term eco-efficiency. (3) Rich countries should, according to the Brundtland Report, aim for an annual growth rate of 3–4 percent in order for poorer countries to achieve improved economic development, rather than continuing to export more to the rich world.
Looking back, one might claim that the first two points have, to some extent, actually been followed up. In the course of the last 20 years, both Norwegian production, and important parts of the production underlying Norwegian consumption, have been made a lot more effective in terms of land use as well as energy use. This period has also seen a steady rise in consumption levels of about 3–4 percent every year measured in monetary units. At the end of the time period in question, some of this increase has also led to a growth in imports from poor countries—at least if we choose to include China. However, failing to see points (2) and (3) in connection with each other, the Brundtland Commission fell victim to the obvious risk of “more out of less” simply turning into “much more out of a little less”. What matters here, is not the moderate increase in the size of the ecological footprint in Norway (and similar countries) over the last 20 years, but rather the fact that the footprint could have become much smaller in these two decades if we had allowed increased production efficiency to benefit the environment. Many “environmentally efficient” products—like the growing number of hybrid cars—are currently being offered, but because of the overall growth in consumption (e.g., increased car mobility), the total environmental impact of consumption is bound to increase. Given that the volume of consumption was kept steady, and that the efficiency bonus was subtracted (in the form of a smaller total environmental impact), the challenge would be to develop a model for global redistribution of purchasing power between poor and rich countries, e.g., through global arrangements for debt cancellation.
Describing a new policy field, such as a consumption-oriented environmental policy, is demanding, and the scope of this paper does not allow for such an exercise. Still, a few key points will be outlined in the following paragraphs. These could serve as a basic framework for a consumption-oriented environmental policy.
First, the environmental impact of consumption, not just production, should be monitored and communicated by the Ministry of Environment or alike into the general environmental policy debate. At present, the main focus is the environmental impact of production. This goes for all levels of government, as illustrated by the choice of indicators used to monitor environmental pressure and systems set up to monitor compliance of environmental treaties. One approach to monitoring the environmental impact of consumption is calculating the ecological footprint. However, a recent Norwegian Official Report suggesting a national system of sustainable development indicators only spares a single paragraph on the ecological footprint, and the indicator system proposed by the report has a strong focus on production impacts [
34]. In a note published by the Ministry of Finance discussing the further development of the national sustainable development indicator set, the following reflection is made on using an ecological footprint approach: “Environmental NGOs have on several occasions suggested to include ecological footprint in the national set of sustainable development indicators. The ecological footprint is well suited as an analytic tool for obvious pedagogical reasons, but has methodological weaknesses, and was for that reason turned down by the government-appointed Commission on a National Sustainable Development Indicator System”. The key issue is to include an assessment of the environmental pressure from consumption in the official evaluation of the effects of Norwegian environmental policy. This
could be done by means of using EF, and a good reason for choosing the EF would be that it is such a strong communication tool [
35]. Moreover, the EF highlights the issue of global distribution and ecological limits to growth [
16]. Still, as noted by Wiedmann and Barrett [
35], EF has its weaknesses when used as a specific tool for administrative steering in following up more general policy signals. Thus, the use of EF might be limited to raise awareness and to put consumption on the environmental policy agenda.
Our second point is that it is not sufficient to monitor environmental impacts of consumption. It is even more urgent to develop a specific consumption focus in environmental policy. What realms of consumption should be the primary targets of such a consumption-oriented environmental policy? This exposition of the environmental impact of Norwegian consumption provides a foundation for distinguishing between two axes: volume and change. It seems natural to prioritize the categories of consumption that boast the largest ecological footprint. Furthermore, it would be wise to prioritize the categories of consumption that have undergone a clear development for the worse. Thus, a consumption focus in environmental policy might consist of the following policy areas: (1) The large and stable categories,
i.e., food and housing; (2) the large and growing categories,
i.e., transport (especially aviation); and (3) the smaller, but rapidly increasing categories,
i.e., imported goods for consumption other than food, housing and transport. In addition to focusing on a number of separate categories of consumption, it may be sensible to focus on the drivers which to a certain extent cut across the aforementioned categories: The massive increase in goods and person transport. The fact that goods are transported more frequently and across longer distances, and that storage is replaced by constant movement through the various points of the value chain, explains a lot of the growing environmental impact from several types of goods [
36]. Furthermore, the rapid increase in private mobility is a problem
per se. The constant development of transport infrastructure, combined with technological changes that increase the rapidity of means of transport, feed into the constant increase. Appropriate policy strategies and measures should be developed to change the current development—a task internationally known as promoting sustainable mobility.
However, current debates in environmental policy—at least in Norway’s case—allows very little room for discussing the problems relating to consumption by Norwegians. During the United Nations Climate Change Conference in Copenhagen in December 2009, the chief Norwegian negotiator Hanne Bjurstrøm was heavily criticized by the environment Non-Governmental Organisations (NGOs) for stating that Norwegian consumption was not up for negotiation. Just after the Copenhagen conference, she was appointed as Minister of Labor, and in May 2010 she elaborated on this point in the following way at a conference held by Bellona, a Norwegian environmental NGO known for its strong engagement in developing and supporting technological solutions to environmental problems (
authors’ translation): “By 2050 we must have reached the goal of zero-emissions—and I believe we must acknowledge that it is foolhardy to expect people to cut off the very limb on which they stand. We cannot convince people to stop consuming” [
37]. This comment was made as part of a talk with the title: ‘The need to create more green jobs’. The speech and statements cited above illustrates the position in the environment policy debate that focus should be on the production side more than the consumption side. Our point is that we need an increased focus on the consumption side, and that using EF is one of many possible positive contributions in doing so.


