Review

Water Footprinting: How to Address Water Use in Life Cycle Assessment?

Department of Environmental Technology, Technische Universität Berlin, Office Z1, Strasse des 17, Juni 135, 10437 Berlin, Germany
*
Author to whom correspondence should be addressed.
Sustainability 2010, 2(4), 919-944; https://doi.org/10.3390/su2040919
Submission received: 21 January 2010 / Revised: 1 March 2010 / Accepted: 17 March 2010 / Published: 5 April 2010
(This article belongs to the Special Issue Resources Management: Life Cycle Assessment)

Abstract

:
As freshwater is a vital yet often scarce resource, the life cycle assessment community has put great efforts in method development to properly address water use. The International Organization for Standardization has recently even launched a project aiming at creating an international standard for ‘water footprinting’. This paper provides an overview of a broad range of methods developed to enable accounting and impact assessment of water use. The critical review revealed that methodological scopes differ regarding types of water use accounted for, inclusion of local water scarcity, as well as differentiation between watercourses and quality aspects. As the application of the most advanced methods requires high resolution inventory data, the trade-off between ‘precision’ and ‘applicability’ needs to be addressed in future studies and in the new international standard.

1. Introduction

1.1. Background

Freshwater is a precious resource on our planet. It is crucial to sustain life and cannot be replaced by any other substance. However, freshwater is scarce in some regions, countries, or even continents, leading to manifold problems. With regard to human health, this can include for instance malnutrition due to lack of agricultural irrigation water. Such problems are relevant for about a third of the world’s population who are threatened by a lack of water to meet daily needs [1]. In terms of ecosystems, water scarcity can affect biodiversity, as sensitive species might not be able to cope with reduced freshwater availability. Hence, freshwater needs to be managed properly in order to achieve the United Nation’s millennium goals regarding human wellbeing and intact ecosystems [2].
Life cycle assessment (LCA) is a widely accepted and applied environmental management tool to measure the various environmental interventions caused by products from cradle to grave [3]. Yet, when assessing the environmental performance of a product by means of LCA, attention is usually drawn on the energy consumed along a product’s lifespan or on the emission of greenhouse gases and toxic substances. In contrast, the use of freshwater throughout a product’s life cycle is often neglected. This can be explained by the history of LCA, which was developed in industrial countries that usually do not suffer from water scarcity. Furthermore, LCA was traditionally used to assess industrial products, which require rather low amounts of water in their production. However, there are also specific methodological challenges that both the inventory and the impact assessment have to face for water use. Difficulties result from the fact that freshwater is not ‘consumed’, but rather circulates in global cycles. Furthermore, freshwater availability varies around the globe, different watercourses fulfill different ecological functions, and different water qualities enable different uses. Yet, when accomplishing LCA studies of agricultural products, biofuels, or renewable raw materials, water consumption can be substantial [4]. Hence, it needs to be considered, as otherwise problem shifting from, for instance, ‘global warming’ to ‘water scarcity’ can occur. Such a severe deficiency is not acceptable for a methodology that has been developed to support sustainable decision making and is even in conflict with the principle of ‘comprehensiveness’ required by International Organization for Standardization (ISO) in the ISO 14040 standard [5].
Even though this challenge has not been tackled for a long time, method development is making considerable progress today. Pushed from initiatives like the World Business Council on Sustainable Development (WBCSD) or the UNEP/SETAC Life Cycle Initiative, comprehensive methods to account for water use on both inventory and impact assessment level have been developed. Furthermore, in addition to the ‘carbon footprint’, which can be regarded as a single-impact LCA only addressing greenhouse gases [6], the ISO has recently started to establish an international standard to assess water use in LCA.
Taking into account the recent efforts in method development, the standardization process and the increased public awareness, it may become true that “water is the new carbon” as claimed by a recent article in the British newspaper ‘The Independent’ [7]. Therefore, this paper aims at reviewing a broad range of scientific methods that have been developed up to now, which account for water use on both inventory and impact assessment levels. After presenting an overview of the methods, the individual advantages and shortcomings of each method are discussed. Based on the identified gaps, research recommendations for method improvement are derived.

1.2. Terminology

The review of research articles dealing with assessment of water use in LCA or case studies revealed a lack of a consistent terminology. In order to provide consistent wording throughout this article, the terminology proposed by the UNEP/SETAC Life Cycle Initiative [8] has been adopted.
In general, the total input of freshwater into a product system is referred to as ‘water use’. As parts of the water input is released from the product system as waste water, the remaining part which has become unavailable due to evaporation or product integration is referred to as ‘water consumption’.
Moreover, the term ‘freshwater use’ is divided into the categories ‘in-stream freshwater use’ and ‘off-stream freshwater use’. While in-stream freshwater use describes an in situ use of freshwater (e.g., for hydroelectric power or ship traffic), off-stream freshwater use comprises any use of freshwater that requires a prior removal of freshwater from the water body. Additionally, freshwater use can be divided into ‘freshwater degradative use’ and ‘freshwater consumptive use’. Freshwater degradative use is characterized by withdrawal and discharge of freshwater into the same watershed after quality alteration. In contrast, freshwater consumptive use occurs when used freshwater is not released into the same watershed from which it was withdrawn due to product integration, evaporation, or discharge into different watersheds. Based on these two sub-divisions, the following four types of freshwater use are divided:
  • In-stream freshwater degradative use, e.g., temperature increase of water retained in dams or reservoirs
  • In-stream freshwater consumptive use, e.g., additional evaporation of water retained in dams or reservoirs
  • Off-stream freshwater degradative use, e.g., increase of biochemical oxygen demand between water catchment and waste water treatment plant effluent
  • Off-stream freshwater consumptive use, e.g., the fraction of irrigation water that is evaporated
It should be noted that this paper focuses on methods accounting for in- and off-stream freshwater consumptive uses, which assess the consequences of water that is ‘lost’ in a particular region. Methods assessing the consequences of degradative uses (freshwater pollution) leading to eutrophication, eco-toxicity, human-toxicity, etc. [9], are not reviewed in this work.
Based on the concept introduced by Allan [10], several authors divide water into three categories: green, blue, and gray water. The green water consumption describes the evapotranspiration of rainwater during plant growth, which is especially relevant for agricultural products. Blue water consumption is the volume of ground and surface water that evaporates during production. Thus, it comprises the amount of water that is not returned into the environmental compartment from which it has been withdrawn initially. As the water that is returned to the environment (e.g., effluent of waste water treatment plants) can be of lower quality, the gray water describes the total amount of water that is polluted by that effluent. Hence, gray water equals the volume of water required to dilute the used water until it reaches commonly agreed quality standards.
Besides the specification of different types of water use, it should be noted that the term ‘water footprint’ has two meanings. On the one hand it refers to the specific method introduced by Hoekstra [11], which is described below. On the other hand, ‘water footprinting’ describes the activities of addressing water use in LCA in general. To avoid confusion the term ‘water footprint according to Hoekstra’ is used when the specific method is referenced.
With regard to impact assessment, lots of methods use the withdrawal-to-availability (WTA) ratio for calculating characterization factors for water use and/or consumption. As shown in Equation 1, WTA is defined as the ratio of total annual freshwater withdrawal for human uses in a specific region (W) to the annually available renewable water supply in that region (A). Hence, WTA serves as an index for local water scarcity.
W T A i = j W i , j A i
As this ratio as well as its components is named differently in different methods we ‘translate’ the method specific names into the terminology introduced here when describing the methods.

2. Methods for Accounting and Assessing Water Use in LCA

The application of the life cycle perspective to product water footprints leads to methods that reveal the entire amount of freshwater required to produce a product. This comprises the water use in the manufacturing process as well as water used in background processes such as the mining of raw materials, the production of materials and semi-finished products, or the generation of electricity. Furthermore, the water used during the product’s use, disposal, or recycling is taken into account. A broad range of currently developed methods assessing water use from a life cycle perspective were identified by literature research in cooperation with the working group on water assessment of the UNEP/SETAC Life Cycle Initiative. With the exception of the methods virtual water [10] and water footprint according to Hoekstra [11], most methods have been developed to support life cycle inventory (LCI) and life cycle impact assessment (LCIA) modeling within LCA. However, similar to carbon footprinting, the methods can also be extracted and used as ‘stand alone’ methods when focusing exclusively on water use. All methods are described in the following section starting from pure water inventories, midpoint- (middle of cause-effect-chain), up to damage oriented endpoint (end of cause-effect-chain) impact assessment schemes. It should be noted that this order does not reflect the scientific value of a method—it is just guiding the reader through the methodological development.

2.1. Water Inventories

The simplest way to determine a water footprint is to use the water inventory of the product or organization under study. By subtracting the waste water effluents from the freshwater inputs the freshwater consumption due to evaporation, product integration, and leakages can be determined. In this way, the water footprints of production steps or organization units can be determined and aggregated to a complete organization or product water footprint. Water inventories can be established by means of LCA databases like ecoinvent [12] and GaBi [13], tools such as the WBCSD Global Water Tool [14], and according to frameworks proposed by e.g., Vince [15] or the UNEP/SETAC Life Cycle Initiative [8]. Depending on the database, tool, or framework the information content of the inventory can differ considerably. LCA databases usually only classify the input and output fluxes according to the watercourses from which the water is withdrawn and to which it is released (ground-, surface-, seawater, etc.). In contrast, the WBCSD Global Water Tool [14] contains further information regarding the location of withdrawal and the respective scarcity in this area. Frameworks established by Vince [15] or the UNEP/SETAC Life Cycle Initiative [8] go further by differentiating the different qualities of water fluxes entering and leaving the product system.

2.2. Virtual Water and Water Footprint According to Hoekstra

The concept of virtual water [10] was the first attempt towards product water footprinting and was developed by Allan in the early 1960s [16]. The method accumulates all quantities of water that have been consumed along the production chain of a product. Hence, it comprises water used in the actual manufacturing processes as well as water used in background processes such as material or energy production. In contrast to the water inventory virtual water is divided into three categories: green, blue, and gray water as described in the section on Terminology.
The water footprint according to Hoekstra [11] was introduced in 2002 and relies on the virtual water concept, but additionally includes spatial and temporal information [16]. Accordingly, the quantitative water footprint of a product is the same value as its virtual water content. Furthermore, water footprints were calculated for individuals, organizations, or nations by multiplying all products and materials consumed with their respective virtual water content and by adding the direct water consumption of the person, organization, or nation [16].

2.3. EDIP Resources

Within the environmental design of industrial products (EDIP) programme [17], a set of impact categories has been established to support LCIA in LCA studies. By means of the impact category EDIP resources the consumption of renewable and non-renewable resources can be assessed.
With regard to water consumption this comprises the following steps. Initially, the volume of freshwater consumed along the product’s life cycle is normalized according to Equation 2:
n o r m a l i z e d w a t e r c o n s u m p t i o n = w a t e r c o n s u m p t i o n a l o n g l i f e s p a n p r o d u c t l i f e s p a n g l o b a l a n u a l p e r c a p i t a w a t e r a v a i l a b i l i t y 1990
As this figure does not contain any information concerning water scarcity, the normalized consumption is divided by the time span in which the resource will still be available. In order to determine the water availability time span, the total regional freshwater supply (renewable and non-renewable) is divided by the difference of annual regional consumption and annual regional regeneration of freshwater. Here it should be noted that the annual regional regeneration of freshwater equals the annually available renewable water supply (A) as defined in Chapter 1.2.
w a t e r a v a i l a b i l i t y t i m e s p a n = t o t a l r e g i o n a l f r e s h w a t e r supply  a n n u a l . r e g i o n a l c o n s u m p t i o n a n n u a l . r e g i o n a l r e g e n e r a t i o n
Hence, water consumption in regions with high water scarcity scores higher than the same water consumption in regions where water is abundant. The result represents the share of the product’s water consumption to the per-capita water availability in the reference year 1990. Finally, the weighted water consumption can be aggregated with other resource consumptions leading to a single indicator, which enables a comprehensive resource consumption assessment.

2.4. LCIA of Water Consumption by Means of Exergy

Exergy can be regarded as the useable fraction of energy, which can be converted into work [18]. The cumulated exergy demand (CExD) [18] or its enhancement, the cumulative exergy extraction from the natural environment (CEENE) [19], were proposed as indicators for resource consumption in LCIA. The basic idea of both concepts is to multiply each resource input into a product system by its respective exergy content. Hence, CExD and CEENE represent the exergy taken from the natural environment by a technical product system or denote the ‘physical chemical price the natural environment pays for the withdrawal toward our industrial society’ [19]. With regard to water use the exergy demand is calculated in two different ways, depending on the type of water use. For in- and off-stream freshwater consumptive uses, the volume of water consumed is multiplied by its chemical exergy content of 50 MJ/m³ [18]. In contrast, the exergy demand of water used in hydroelectric power plants (in-stream degradative water use) is calculated based on the potential energy of the barrage water.
The main advantage is that exergy contents can be determined for all types of resources including minerals, metals, water, biomass, renewable and non-renewable energy carriers, and land use. This overcomes the shortcomings of conventional resource LCIA indicators, which only account for certain resources. For instance, the cumulated energy demand (CED) [20] only covers energy carriers or the abiotic depletion potential [9] accounts exclusively for non-renewable abiotic resources. Consequently, exergy is a more comprehensive indicator accounting for all types of resource use and for the ‘quality’ of the resource consumption in terms of lost exergy. Water consumption can be assessed as a type of resource use and can be aggregated and compared with the consumption of other resources.

2.5. Ecological Scarcity Method

The ecological scarcity method [21] has been developed to support LCIA in LCA. The method provides eco-factors for a range of substances expressing their environmental impact. In LCIA elementary flows compiled in the LCI can simply be multiplied by their corresponding eco-factors. The results, which are expressed in eco-points, can then be aggregated to a single-score indicator expressing the overall environmental impact of the product analyzed. In general the eco-factors are calculated according to the following equation, which contains a characterization, normalization and weighting step:
E c o f a c t o r [ e c o p o int s u n i t ] = K C h a r a c t e r i z a t i o n ( o p t i o n a l ) 1 e c o p o int F n N o r m a l i z a t i o n ( F F c ) 2 W e i g h t i n g c c o n s tan t f a c t o r
The method also provides eco-factors for water use. In contrast to water consumption, which comprises the evaporated fraction only, water use denotes the total input of freshwater into the product system. When calculating eco-factors for water use, no characterization (conversion of LCI flow to the common unit of the impact category [22]) is performed, i.e., water is not characterized according to quality or type of water source. Regarding normalization (impact category result in relation to a reference region [22]), the total annual freshwater withdrawal for human use in a specific region (W as described in Chapter 1.2) is assigned to 1 eco-point. In terms of weighting, the method uses a political distance-to-target weighting procedure in which the ratio of a current (F) to a critical flow (Fc) needs to be determined. In the context of weighting for water use assessment, the method incorporates the political target of preventing water stress. According to the OECD [23] water stress occurs if the water pressure, which equals WTA as described in Chapter 1.2, is larger than 20%. Hence, as long as no more than 20% of the annually available renewable water supply (A as defined in Chapter 1.2) is used by human activities, no harm for ecosystems is expected. Accordingly, the current flow equals the total annual freshwater withdrawal for human uses (W) in the region or country where the water use occurs and the critical flow is set to 20% of the annually available renewable water supply (A) of that region. The square of the weighting factor leads to an above average weighting if the critical flow is significantly exceeded. Thus, as shown in Equation 5 and Table 1, the weighting factor is dependent on the WTA and can range from 0.0625 to 56.3. Multiplying the result by the constant c (1012/a) leads to a more convenient dimension.
W e i g h t i n g = ( current flow critical flow ) 2 = ( total annual freshwater withdrawal for human uses (W)  annually available renewable water supply (A) 20 % ) 2 = ( W T A ) 2 ( 1 20 % ) 2
Table 1. WTA ranges and resulting weighting factor assuming a critical flow of 20% of the renewable water supply [21].
WTAWTA used for calculationWeighting factor
low<0.10.050.0625
moderate0.1–<0.20.150.563
medium0.2–<0.40.32.25
high0.4–<0.60.56.25
very high0.6–<1.00.716.0
extreme>1.01.556.3

2.6. LCIA Method for South Africa

A site specific impact assessment method for South Africa has been introduced by Brent [24], which assesses the use and pollution of water-, air-, land-, and mined abiotic resources. In terms of water, the use of ground and surface water is simply aggregated without characterization in the sub-resource group ‘water quantity’. The pollution of water is denoted in the sub-resource group ‘water quality’ by normalizing the results for the impact categories eutrophication, acidification, human- and eco-toxicity based on ambient environmental quantity and quality objectives. Subsequently, the results of the two sub-resource groups are combined within the main resource group ‘water’ by a distance-to-target weighting in which the two sub-resource groups are multiplied by a factor expressing the ratio of current ambient state to target ambient state. Both normalization and weighting is accomplished site specific for four South African regions to better reflect the site specific effects of water and land use impacts. Finally, the four resource impact indicators (RII) expressing the threats for the main resource groups water, air, land, and mined abiotic resources are combined to a single-score environmental performance resource impact indicator (EPRII). This aggregation is accomplished by means of a ranking procedure and a further weighting step that includes political value choices of the South African government and manufacturing industries.

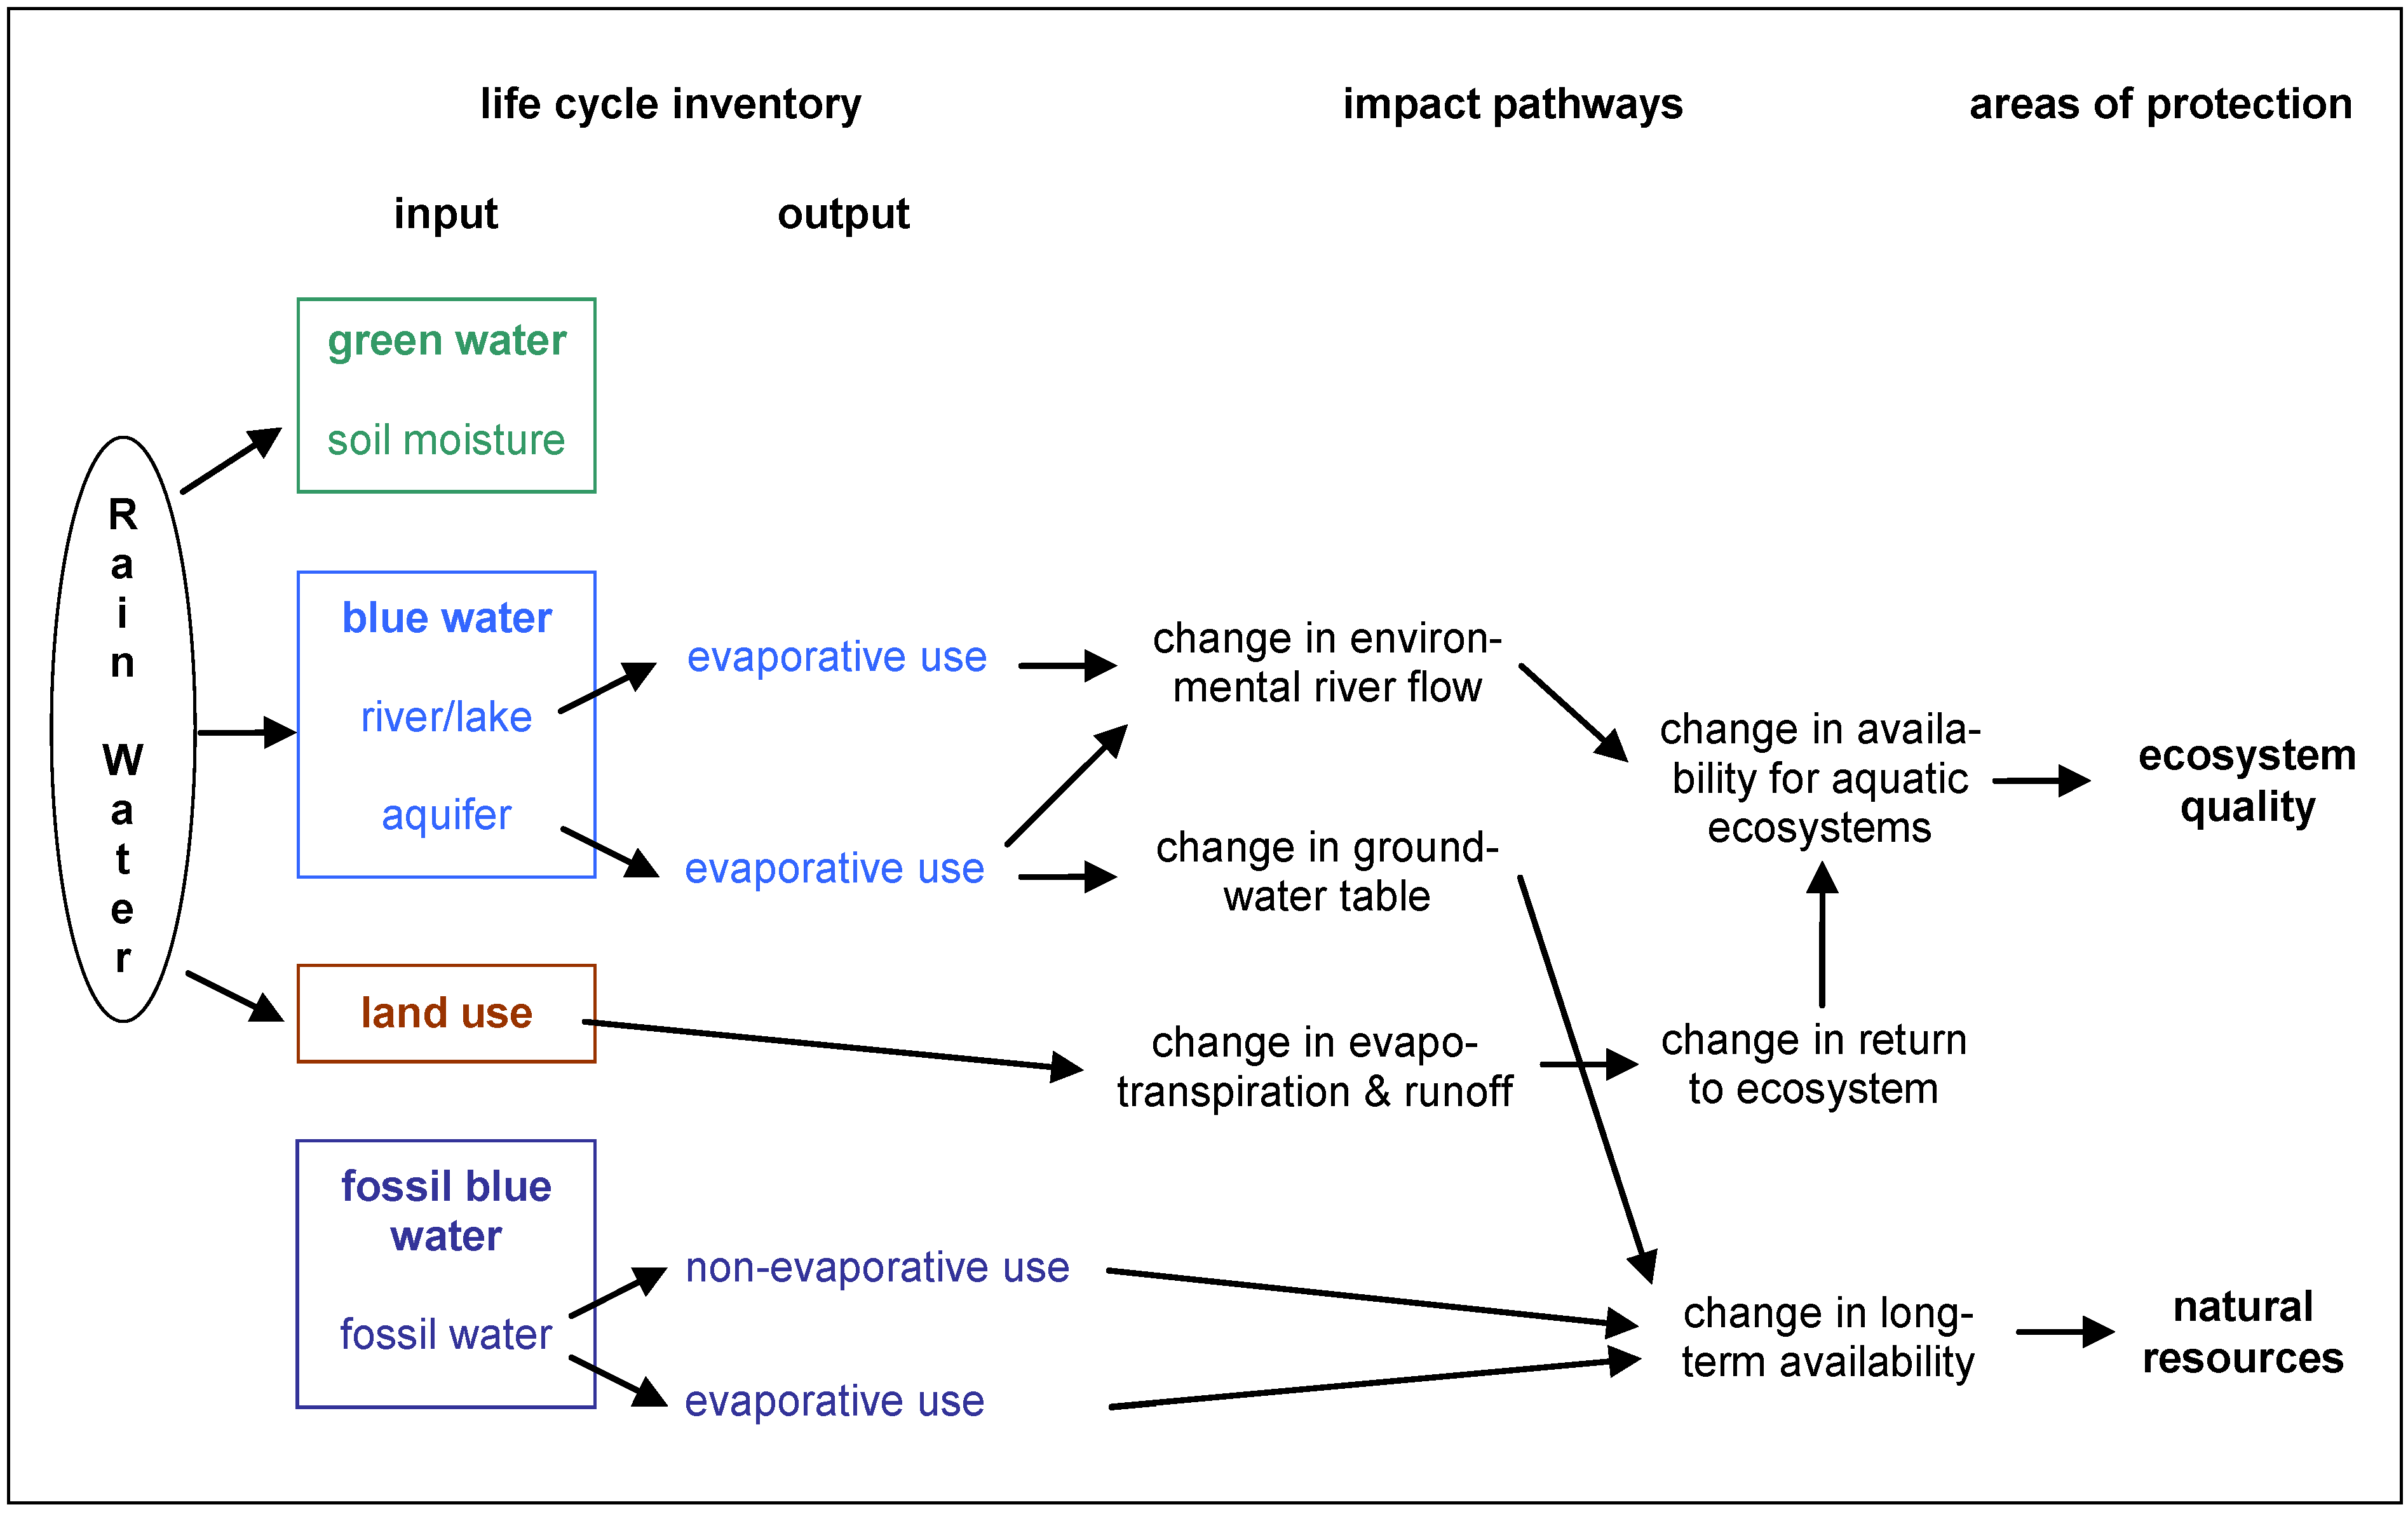
2.7. LCI and LCIA Modeling of Water Use According to Mila i Canals and Colleagues [25]

This method attempts to differentiate between different types of water use in LCI and provides two midpoint impact categories for LCIA.
In terms of LCI modeling, Mila i Canals and colleagues propose differentiating between inputs of green water (soil moisture), blue water (ground and surface water), fossil blue water (non-renewable ground water), and water use due to land use changes. Next to differentiating the input of freshwater into a product system, the use of water should be categorized into evaporative and non-evaporative use. Additionally, procedures for calculating different types of water consumption are provided. Furthermore, the method discusses the following impact pathways resulting from water use:
  • Water use leading to insufficient freshwater availability causing impacts on human health
  • Fossil and aquifer groundwater use above renewability rate leading to reduced availability of freshwater as a resource for future generations—freshwater depletion (FD)
  • Water use leading to insufficient freshwater availability causing effects on ecosystem quality—freshwater ecosystem impacts (FEI)
  • Land use changes leading to changes in freshwater availability causing effects on ecosystem quality—freshwater ecosystem impacts (FEI)
While no method is provided to describe the impacts to human health, Mila i Canals and colleagues propose ways of quantifying the impacts of water use to freshwater depletion (FD) and freshwater ecosystem impacts (FEI) according to the impact pathways shown in Figure 1.
Figure 1. Inventory requirements and impact pathways resulting from different types of water use addressed by Mila i Canals and colleagues, based on [25].
Sustainability 02 00919 g001
The midpoint impact category FD assesses the reduced availability of the resource freshwater for future generations if the water use exceeds the renewability rate of the respective body of water. As surface watercourses such as rivers usually have a high renewability rate, it is assumed that only the consumption of water from aquifers (evaporative use) and fossil water (evaporative and non-evaporative use) can contribute to that impact category. In order to provide characterization factors (factors converting the LCI flow to the common unit of the impact category [22]) the method of Guinee and colleagues to determine the depletion of abiotic resources [9] is adapted to water use as shown in Equation 6:
A D P i = E R i R R i ( R i ) 2 ( R S b ) 2 D R S b
Thus, the abiotic depletion potential (ADP) of a water resource i serves as a characterization factor, which is dependent on the extraction rate of resource i (ER), the regeneration rate of resource i (RR), the ultimate reserve of the resource i (R), the ultimate reserves of the reference resource antimony (RSb), and the deaccumulation rate of antimony (DRSb). As shown in Equation 5, strongly overexploited water resources (ER > RR) will result in higher characterization factors, whereas sustainably used resources (ER = RR) will result in a characterization factor of 0. Yet, underexploited water resources (ER < RR) would result in negative characterization factors. Following Mila i Canals and colleagues, such positive effects are excluded from the calculation as no water depletion occurs.
The second midpoint impact category FEI aims to assess the ecological consequences of water use in a certain region. In contrast to FD, the consumption of fossil blue water is excluded as it fulfils minimal ecological functions. Hence, only the evaporative use of blue water (surface water and aquifers) as well as water use due to land use changes are taken into account. In order to obtain concrete characterization factors the water stress indicator (WSI) developed by Smakhtin and colleagues [26] is suggested.
W S I i = W U i W R i E W R i
As it can be seen from Equation 7, the WSI of region i denotes the ratio of total water use (WU) to the difference between renewable water reserves (WR) and the environmental water requirement (EWR) in that region. The basis for this indicator is the water use per resource indicator (WUPR) [27], which relates the total water use to the renewable water reserves in a region. In order to harmonize terminology, it should be noted that WU equals the total annual freshwater withdrawal for human uses (W), WR equals the annually available renewable water supply (A), and WUPR equals WTA as defined in Chapter 1.2.
W U P R i = W U i W R i
Hence, the WSI enhances the WUPR or WTA indicator by ‘reserving’ a certain amount of freshwater necessary to sustain the ecological functions in a particular region. Depending on the local water scarcity and the respective ecosystem demand, site specific characterization factors are obtained assessing the severity of additional human water use.

2.8. Characterization Method for a New Impact Category ‘Freshwater Deprivation for Human Uses’

Bayart and colleagues [28] introduced a freshwater accounting and impact assessment method that follows the requirements of the framework proposed by the UNEP/SETAC Life Cycle Initiative [8]. Accordingly, freshwater inputs into and outputs from the product system are categorized based on their quality (high/low) and resource type (surface/groundwater), which enables the quantification of losses and gains of different freshwater types on the inventory level. Subsequently, the authors proposed the new midpoint impact category ‘freshwater deprivation for human uses’ to assess the consequences of freshwater consumption regarding contemporary human uses. Depending on the type (i) of freshwater consumed, characterization factors (CF) are calculated according to Equation 9, which express the ‘m³ potable water equivalent unavailable for human uses’ per m³ of water consumed.
C F i = α i U i Q i ( 1 C A )
While the regional freshwater scarcity (α) is calculated by means of WTA, the number of potential uses depending on freshwater type and quality is expressed by means of the functionality factor (U). The quality factor (Q) denotes the quality of the consumed freshwater based on the energy demand required to transform the water quality i into drinking water quality. Furthermore, the compensation ability (CA) to adapt to increased water scarcity based on socio-economic parameters is taken into account. Following this procedure the authors determined a set of characterization factors for different countries and different freshwater types.

2.9. Human Health Damage Assessment of Undernourishment Related to Agricultural Water Scarcity

Motoshita and colleagues [29] modeled the cause-effect-chain of agricultural water scarcity to undernourishment related health damages in two steps. First, the reduced availability of agricultural water, as a potential consequence of water consumption, will diminish agricultural productivity. This relationship is described on country scale in a prediction model which regards crop productivity per unit dietary energy as being proportional to agricultural water use. Subsequently, undernourishment related health damages resulting from decreased agricultural productivity are assessed in a regression model and expressed in units of ‘disability adjusted life years’ (DALY). DALY is the unit of a health indicator developed by the World Health Organization (WHO) that expresses the total amount of lost health due to premature death and disability resulting from illnesses and injuries [30]. Besides linking diminished agricultural productivity to health damages, the regression model analyses the effects of variables like average dietary energy consumption, medical treatment, and health expenditure by means of non-linear and multiple regression analysis. Depending on the local vulnerability, Motoshita and colleagues determined damage factors ranging from 10–9 to 10–7 DALY per m³ of water consumed.

2.10. Human Health Damage Assessment of Infectious Diseases Arising from Domestic Water Consumption

According to the WHO, 10% of the total worldwide diseases result from lacking access to clean drinking water, and lacking water for sanitation and hygiene [31]. For that reason, Motoshita and colleagues [32] analyzed the cause-effect-chain that links water consumption and the occurrence of infectious diseases. According to the authors, the consumption of freshwater in a particular region leads to shortage of safe drinking water, which results in drinking of unsafe water. Subsequently, the ingestion of unsafe drinking water leads to the intake of infectious sources, resulting in health damages caused by infectious diseases. By means of multiple regression analysis the authors modelled this cause-effect-chain taking into account variables such as house connection rate to water supply and sanitation, average dietary consumption, gini coefficient of dietary energy consumption, undernourished population, annual average temperature, and health expenditure per capita. As a result, Motoshita and colleagues determined country specific characterization factors expressing the health damage resulting from the consumption of freshwater. Depending on the local circumstances, the resulting health damage ranges from 6 × 10–13 to 2 × 10⁻⁴ DALY per m³ freshwater consumed.

2.11. Characterization Factors for Assessing the Ecological Damage of Groundwater Extraction

Van Zelm and colleagues [33] are currently developing characterization factors expressing the contribution of groundwater extraction to ecosystem damage in The Netherlands. The characterization factors are calculated by means of a fate and an effect factor.
The fate factor denotes the change in average spring groundwater level (dASG) as a consequence of the change in the extraction rate (dq). Information for determining fate factors is obtained from the National Hydrological Instrument of The Netherland (NHI). NHI describes the Dutch hydrological situation in a 250 × 250 m raster based on the MODFLOW model [34] and enables the calculation of generic as well as soil type specific Dutch fate factors. The effect factor expresses the change in potentially not occurring fraction of species (dPNOF), which results from the change in average spring groundwater level (dASG). The effect factors are determined by means of multiple regression equations expressing the relation of changes in the groundwater level to the potential occurrence of plant species based on information of 690 plant species in the MOVE model [35].
C F = i A i [ d A S G i d q i ] f a t e [ d P N O F d A S G i ] e f f e c t
Finally, as shown in Equation 10, characterization factors (CF) are calculated by multiplying the area of each grid cell (A) by its corresponding fate and effect factors.

2.12. Damage to Aquatic Ecosystems Caused by Water Use from Dams

Hydropower is generally regarded as an environmentally friendly source of electric energy. However, this view typically neglects the effects on ecosystems resulting from the damming of water, which are obviously very site dependent. Therefore, Maendly and Humbert [36] developed specific characterization factors for assessing effects on aquatic biodiversity resulting from this so-called in-stream freshwater use. By relating the fraction of disappeared species (PDF) on the original river surface area flooded in both the up-stream and down-stream zones (A) to the water throughput or electricity generated (Q), the characterization factor (CF) is obtained. Finally, the characterization factors of different sections (CFsection,i) are aggregated to the overall characterization factor (CF), which denoted the environmental damage expressed in the widely applied unit of potentially disappeared fraction (PDF × m² × a) [37] per m³ or kWh.
C F = i C F sec t i o n , i = 1 Q w a t e r o r e l e c t r i c e n e r g y i ( P D F sec t i o n , i A S e c t i o n , i )

2.13. Impact Assessment of Freshwater Consumption According to Pfister and Colleagues [38]

The method developed by Pfister and colleagues enables a comprehensive impact assessment of freshwater consumption on both midpoint and endpoint level. Referring to the virtual water terminology, the method only accounts for blue water consumption, i.e., the consumption of ground and surface water.
On midpoint level, a regional ‘water stress index’ (WSI) is introduced, which serves as a characterization factor for the proposed impact category ‘water deprivation’. It should be noted that the water stress index (WSI) introduced here must not be confused with the water stress indicator [26] (also WSI) that is suggested by Mila i Canals and colleagues [25] as characterization factor for the impact category freshwater ecosystem impacts (FEI). The WSI according to Pfister et al. relies on WTA as defined in Chapter 1.2 and has been calculated for more than 10,000 watersheds by means of the global WaterGAP2 model [39]. However, the regional hydrologic situation might vary throughout the year due to seasonal precipitation differences. This seasonal variation might cause additional water stress if the wet seasons cannot fully compensate for the dry seasons due to lacking storage capacities of the individual water shed or additional evaporation of stored water. By introducing a variation factor (VF) such effects are taken into account and are included in the modified WTA ratio WTA*. In order to achieve continuous characterization factors between 0.01 and 1, the WSI is calculated according to the following logistic function.
W S I = 1 1 + e 6.4 W T A * ( 1 0.01 1 )
All amounts of blue water consumption can then be multiplied by their specific regional WSI to obtain characterized results, which can be aggregated in the midpoint impact category water deprivation. Next to this midpoint indicator, the method also comprises three endpoint impact categories enabling damage assessment according to the eco-indicator 99 framework [37] in the areas of protection human health, ecosystem quality, and resources.
In terms of damage to human health the method refers to the impact pathway of malnutrition due to lack of irrigation water. In order to quantify the damage to human health resulting from malnutrition (ΔHHmalnutr.) as a consequence of water consumption (WUconsumptive) in a particular region, the entire cause-effect-chain is modelled. Starting from the water stress index (WSI) and the percentage of agricultural water use to total water use (WU%agriculture), the water deprivation for agricultural purposes (WDF) is quantified. By means of an effect factor (EF), which incorporates the per-capita water requirement to prevent malnutrition (WRmalnutr.) and the human development factor (HDF), which is calculated based on the human development index, the annual number of malnourished people is calculated. Finally, the overall human health effects resulting from a certain number of malnourished people are quantified by means of a damage factor (DF) in the unit DALY based on statistical health data.
Δ H H malnutr.,i = W S I i W U % a g r i c u l t u r e , i W D F i H D F malnutr.,i W R malnutr.,i 1 E F i D F malnutr.,i C F malnutr.,i W U c o n s u m p t i v e , i
In order to assess damage to ecosystem quality resulting from a certain freshwater consumption, the ecological cause-effect-chain needs to be modelled. It is assumed that withdrawals of blue water reduce the availability of green water, which is crucial for vegetation in many ecosystems.
As proposed in the eco-indicator 99 framework [37], ecosystem damage is measured in potentially disappeared fraction of species (PDF), which are a measure for the vulnerability of vascular plant species biodiversity (VPBD). In order to assess vegetation damage that is related to water shortage, net primary production (NPP) has been chosen as a proxy for two reasons. First, a high correlation between NPP and VPBD has been revealed. Second, there are spatial data globally available assessing constraints to net primary production due to water shortage (NPPwat-lim) by means of indices ranging from 0 to 1 [40]. As shown in Equation 14, the damage to ecosystem quality (ΔEQ) is determined by multiplying NPPwat-lim by the ratio of water consumption (WUconsumptive) to precipitation (P). This ratio indicates the area-time equivalent necessary to recover the consumed (blue) water by annual precipitation.
Δ E Q i = C F E Q , i W U c o n s u m p t i v e , i = N P P w a t lim , i P D F W U cos u m p t i v e , i P i A t
Damage to resources is the third area of protection assessed in the eco-indicator 99 framework [37]. It denotes the depletion of natural resources and is measured in units of surplus energy, which indicates the additional energy required to mine a resource of lower concentration after a resource extraction took place. In this context the concept has been modified and the surplus energy for replacing an amount of depleted freshwater by means of seawater desalination is determined according to the following equation.
Δ R i = E d e s a l i n a t i o n F d e p l e t i o n , i W U c o n s u m p t i v e
The damage to resources (ΔR) resulting from water consumption (WUconsumptive) is calculated by multiplying the energy demand for desalination (Edesalination) by the fraction of water consumption contributing to freshwater depletion (Fdepletion). While Edesalination is fixed to a value of 11 MJ/m³, Fdepletion is dependent on the withdrawal to availability (WTA) ratio.
F d e p l e t i o n , i = { W T A i 1 W T A i f o r W T A i > 1 0      f o r W T A i 1
After determining the damage of freshwater consumption to human health, ecosystem quality, and resources, a normalization and weighting based on weighting factors from the eco-indicator 99 (hierarchist perspective) [37] can be accomplished to obtain a single-score indicator. This indicator denotes the overall damage caused by freshwater consumption and can be aggregated and compared to damage caused by other environmental interventions (e.g., emissions or waste) deriving from the product system under study.

3. Discussion

In the previous section, various methodological approaches for water footprinting have been described, which differ significantly regarding scope, information value, relevance, and data requirements. Starting from pure inventory methods, water footprinting has evolved in terms of differentiation between different types of water, different types of water use, as well as inclusion of quality and spatial information denoting local water scarcity conditions. Moreover, LCIA of freshwater use has been brought forward in terms of modeling effects on resources, ecosystems, and human health on both midpoint and endpoint levels.
The simplest way to account for water use is the water inventory of an organization or product system. Despite the fact that the inventory methods rely on the same principle, i.e., subtracting waste water effluents from freshwater inputs, even these methods differ with regard to differentiation of resource types, inclusion of spatial information, and water quality. The information content of databases like ecoinvent [12] and GaBi [13] is rather limited as neither geographical nor quality-related information are included up to now. Moreover, the correctness of the available data is arguable as it is unclear whether all relevant water flows, especially those from the background system and cooling water run in circulation systems, are included or not. These doubts regarding the correctness of data are increased due to the fact that there are large differences (up to a factor of 10) between the water use and consumption data of materials determined from the two databases. Yet, the absence of better data sources and a commonly agreed impact assessment method make the GaBi [13] and ecoinvent [12] water inventories still the most widely applied method in addressing water use in LCA. Other concepts, such as the frameworks proposed by Vince [15], propose the inclusion of spatial and quality information in order to increase the relevance. These detailed inventories are the basis for impact assessment approaches discussed below.
The virtual water and the water footprint according to Hoekstra [16] can be regarded as advanced water inventories as they take into account green and gray water, while conventional inventories only account for blue water use. Additionally, the water footprint according to Hoekstra [16] contains spatial information where water is withdrawn. Even though this information is not reflected in characterization factors, it enables denoting the fraction of water consumption occurring in water scarce areas. With regard to agricultural products, the consumption of green water, i.e., the evapotranspiration of rain water, is of great importance [16] and, thus, its accounting overcomes a severe shortcoming. Gray water consumption, which denotes the volume of water necessary to dilute waste water until common quality standards are reached, can be regarded as a midpoint impact category for degradative water uses. However, as the method does not clearly define ‘common standards’ for water quality the concept should be regarded as rather vague. Depending on the thresholds for pollutants chosen as ‘common standards’, the amount of gray water will vary substantially. An advantage of the gray water concept is that it enables aggregating freshwater consumptive and degradative uses already on the inventory / midpoint level. However, the pollution of water is often covered by other impact categories such as eutrophication, acidification, eco toxicity, or human toxicity potentials [9]. Hence, one needs to pay attention to avoid double counting as waste water effluents should be regarded as either freshwater pollution or consumption but not as both.
Moreover, pure inventory based water footprints can be meaningless or even misleading with regard to impact assessment, as relatively low water footprints in water scarce areas can be of more environmental relevance than large water footprints in areas where water is abundant. For that reason authors like Ridoutt and Pfister [41] point out the necessity of characterized water footprints. The authors propose a framework that accounts for blue and gray water consumption in the same way as the water footprint according to Hoekstra [16]. In contrast, green water consumption is not calculated as the total evapotranspiration of rain water but as the difference in blue water formation from green water as a consequence of land use change. Subsequently, this volumetric figure is multiplied by the regional water stress index (WSI) developed by Pfister and colleagues [38], which serves as a characterization factor and leads to a characterized water footprint measured in H2O equivalents. The authors argue that this would make water footprinting more consistent with the current practice of carbon footprinting, which also comprises the accounting of greenhouse gas emissions along with a characterization step leading to CO2 equivalents.[6] However, the developers of the water footprint according to Hoekstra [16] argue that changing the water footprints from volumetric measures to characterized indices might weaken its position in water resource management and that an aggregated index is not the intention of the method. The main argument against characterized water footprints is that such footprints can also be misleading as long as the environmental impact routs are not sufficiently reflected in the impact assessment methods [42].
Next to the inventory related methods, there are also methods enabling the impact assessment of water consumption. It should however be noted that most of these methods are relatively new and have been published within the last two years. Thus, hardly any experience gained from their application in case studies is available, which only allows for a discussion on a theoretical level.
The impact categories EDIP resources [17] or CExD [18] and CEENE [19] assess water consumption in the context of conventional resource consumption. The EDIP resources impact category accounts for the local depletion of freshwater and the global depletion of other resources. By enabling an aggregation of the results obtained from water consumption and the consumption of other raw materials the method enables a sound assessment of resource depletion. However, the method only addresses the depletion of resources and does not address any other effects related to water consumption. CExD and CEENE assess each resource input based on its respective exergy content. Even though the exergy concept enables aggregation of any type of resource use, it does not take into account the local scarcity of water as its exergy content is calculated based on its chemical composition or potential energy content. Thus, exergy can neither express the local depletion of water resources in a meaningful way nor account for any other consequences to human health or ecosystems related to water consumption.
The ecological scarcity method [21] provides eco-factors for water use that comprise a normalization and a weighting based on WTA. The method can be adapted from Swiss conditions to the hydrological situation in any other country and, thus, enables a site specific assessment of water consumption as the local scarcity of water will determine the magnitude of the eco-factor. The authors recommend applying the eco-factors for freshwater use instead of consumption arguing that the weighting is based on a use-to-availability ratio (WTA) as well. On the one hand this enables consistency between inventory flows and weighting as both rely on water use. Furthermore, assessing water use instead of water consumption better reflects how water intense a product system really is. For example, a water consumption of 1 m³ can mean that 10 m³ of water are withdrawn and 9 m³ are released as waste water. However, 1 m³ of water consumption can also mean that 1,000 m³ of water are withdrawn and 999 m³ are released as waste water. On the other hand, only the fraction of water use that is consumed leads to water scarcity, as the remaining part is released after quality alteration and is covered by other eco-factors assessing the emission of pollutants. A clear advantage of the method is the fact that the ecological threat of water use can be aggregated and compared with other environmental impacts resulting from raw material extractions or emissions. However, one needs to be aware that the method contains a subjective weighting based on political value choices. Therefore, according to ISO 14044 the method cannot be applied in LCA studies, which are intended to be published and contain comparative assertions [22].
Another distance-to-target method has been developed by Brent [24] to promote site specific impact assessment in four South African regions. Similar to the ecological scarcity method [21] the method accounts for water use rather than consumption and the effects in terms of water can be aggregated and compared to other environmental impacts. Taking into account the subjective weighting based on political value choices and expert judgement, the method is also not applicable in LCA studies that contain comparative assertions disclosed to the public [22]. Even though the method has been developed for South Africa, the procedures could be applied in other regional contexts as well.
Mila i Canals and colleagues [25] developed a method that comprises a detailed accounting scheme for water use on LCI level and two impact categories to assess water use from a resource and ecosystem perspective. With regard to ecosystem impact the method assumes that only evaporative uses of surface and aquifer blue water have an effect on ecosystems. Other authors like Bayart et al. [8] suggest including non-evaporative uses as well, i.e., the discharge of used water into another catchment area than the one where withdrawal occurred. Moreover, the water stress index [26] that is proposed as a characterization factor for freshwater ecosystem impact, is only available for the main river basins, which restricts the global applicability of the method. Additionally, the method is still lacking characterization factors describing the relevant impacts of freshwater deprivation on human health. Moreover, the separate accounting of green water consumption is recommended but no impacts on freshwater resources and ecosystems are considered. A clear advantage is the fact that this method along with the framework proposed by Ridoutt and Pfister [41] are so far the only ones which account for water losses due to changes in evapotranspiration and runoff as a consequence of land use changes. Unfortunately, this also leads to a trade-off between more detailed LCI information enabling sound LCIA and the associated data requirements which can hardly be satisfied, especially with regard to background processes.
A midpoint impact category that assesses the consequences of freshwater consumption on human health, and hence overcomes a research gap of the method of Mila i Canals et al. [25], has been developed by Bayart and colleagues [28]. Both the inventory scheme and the characterization factors, that account for local scarcity, number of potential uses, water quality, and socio-economic adaptability, have been developed in line with the recommendations of the UNEP/SETAC Life Cycle Initiative [8]. However, as high quality water allows for more uses than low quality water, the parameters quality and functionality are interdependent and, thus, there is a danger of double counting.
Next to the inventory and midpoint related methods, several endpoint oriented methods have been developed that enable damage assessment of water use to different areas of protection such as human health, ecosystem quality, and resources.
Two endpoint oriented methods have been developed by Motoshita and colleagues [29,32] that enable the quantification of damages to human health resulting from malnutrition and infectious diseases as a consequence of lacking agricultural and clean drinking water, respectively. However, especially the impact pathway linking water use to infectious diseases is controversial. Even though the method takes into account socio-economic parameters such as house connection rates to water supply and sanitation, infectious diseases are very often a consequence of poverty rather than of physical water scarcity.
Even though they enable practitioners to assess a wide range of water uses, the damage oriented methods described above are still rather specific. They either focus on a particular country, a specific type of water use, a particular type of damage, or a specific impact pathway. Thus, practitioners would have to apply a whole set of methods when accomplishing case studies in which different types of water uses occur. Another problem lies in the fact that results obtained by different methods are often not comparable and are expressed in different units.
A more comprehensive LCIA method that aims at assessing environmental impacts of water consumption on both midpoint and endpoint level has been developed by Pfister and colleagues [38]. Yet, the limitation of only accounting for off-stream blue water consumption limits the applicability especially with regard to agricultural products where green water consumption is significant [16].
First, the midpoint impact category ‘water deprivation’ is introduced with water stress index (WSI), serving as characterization factor based on the withdrawal-to-availability (WTA) ratio. WTA is also used in the weighting of the ecological scarcity method [21], in the water stress indicator of the method of Mila i Canals et al. [25], and in the calculation of characterization factors in the method of Bayart and colleagues [28]. Even though it seems reasonable to develop characterization factors that express the ratio of total water use to renewable water reserves there are some problems connected with these types of indicators. For example a relatively dry country like Greece has a three times lower WTA (10%) than Germany (31%) even though the renewable water supply in Germany is much bigger [21]. This phenomenon can be explained by the higher water use in Germany. However, it illustrates the problem that obviously dry countries can have low characterization factors as long as the water use is low too, which is especially relevant for developing countries. Hence, the WTA indicator does not express the vulnerability of a region to an additional water withdrawal. Moreover, the WTA ratio only relates water use to renewable water reserves and neglects non-renewable water resources. Yet, especially if the water use exceeds the renewable water supply it is of great importance whether substantial fossil water resources are available or not as they can ‘buffer’ temporarily overexploit renewable watercourses.
Besides the midpoint impact category the method introduced by Pfister and colleagues [38] comprises three endpoint impact categories assessing damage to human health, ecosystem quality, and resources in accordance to the eco-indicator 99 framework [37]. With regard to the calculation of damages to human health the authors only consider the impact pathway of malnutrition resulting from a lack of water for irrigation. Health damages that result from pure lack of drinking water are not taken into account as they result from extreme events like droughts or wars, which are not considered in LCA. Furthermore, damages to human health that result from the spread of diseases due to lacking hygiene are also neglected arguing that it is too difficult to assess such effects as they depend on local parameters. Even though this is correct, the same argument is true for health effects resulting from malnutrition. Moreover, Motoshita et al. [32] showed a way of determining damages to human health resulting from lack of hygiene and quantified these damages as even higher than those resulting from malnutrition. In terms of damages to resources Pfister et al. [38] determine the fraction of water consumption that contributes to water depletion. Subsequently, the energy required for producing the same volume from seawater desalination is determined in order to obtain a result in MJ surplus energy. However, surplus energy actually denotes the additional energy required to mine a resource (of lower concentration) after a resource extraction took place [37]. As such an energy demand can hardly be determined for renewable resources like water, the approach of Pfister and colleagues [38] to use the energy required for seawater desalination instead is understandable. However, it is more a ‘trick’ to obtain the unit required in the eco-indicator 99 concept [37] and the result can hardly be compared to or aggregated with other surplus energy demands resulting from the consumption of fossil or mineral resources.
Finally, the method enables aggregation of the three damage categories to one single-score eco-indicator. Similar to the ecological scarcity method [21] the single-score result enables aggregation of and comparison to other damages resulting from raw material consumptions or emissions of the product system under study. However, as the single-score aggregation contains a subjective weighting based on decisions of an expert panel, the aggregated eco-indicator 99 result cannot be applied in LCA studies that are intended to be published and contain comparative assertions [22]. In order to support the application of their method, Pfister and colleagues provide a layer [43] that can be added to the Google Earth software [44]. This tool enables an easy determination of site specific characterization factors for the midpoint and endpoint categories for thousands of water catchment areas around the world.
Even though these recent efforts in terms of damage modeling complete the set of water use assessment methods, endpoint modeling is controversial in LCIA. On the one hand it enables quantifying the damage to areas of protection like human health, ecosystem quality, and resources, which is more meaningful than results of midpoint impact categories. On the other hand uncertainties increase the longer the modelled cause-effect-chain is, making the results less reliable. Yet, another advantage of endpoint modeling is the possibility of aggregating damages that result from water use and other environmental interferences like emissions or resource abstractions. Hence, it is possible to evaluate efforts aiming to save water from a more holistic perspective. In areas of no or little water scarcity it may be possible that measures to save water in industry, e.g., due to reusing and cycling of water, cause a higher environmental damage than the status quo. In such a case the damage resulting from the energy consumption of pumps or from the use of fungicides in cycling systems might be higher than the environmental damage avoided due to the decreased water consumption. In contrast, one and the same action, that is counterproductive in areas of no or little water scarcity, might be beneficial in water scarce areas where the avoided damages of water consumption would be significantly higher.
Table 2 lists the different methods discussed in this paper and shows the different scopes regarding type of water and water use accounted for, as well as inclusion of spatial and quality information. Moreover, the areas of protection addressed by the method in impact assessment and the respective level in the cause-effect-chain are shown along with a statement concerning ISO 14044 [22] compliance in case of application for comparative assertions disclosed to the public.
A further analysis of methods and indicators is currently accomplished by the UNEP/SETAC Life Cycle Initiative. The cooperative work of LCA experts from both academia and industry characterizes water scarcity indicators, water inventory schemes, and impact assessment methods by means of a detailed list of criteria. Next to performing a comprehensive criteria based comparison the working group aims at supporting LCA practitioners in choosing the best suitable method for a particular situation [45].
Table 2. Scope of methods accounting and assessing water use in LCA.
MethodType of water useType of waterSpatial differen-tiationQuality differen-tiationImpact assessmentISO 14044 [22] compliance of comparative assertions disclosed to the public
consumptivedegradativegreenbluegrayArea of protectionLevel in cause-effect-chain
Water inventories [8,12,13,14,15]off-stream [8,12,13,14,15]in-stream [12,13]-x-x [8,14,15]x [8,15]--x
Virtual water [10], water footprint [11]off-stream, in-streamoff-stream (gray water)xxxx [11]-ecosystem (gray water)midpoint (gray water)x
EDIP resources [17]off-stream--x-x-resourcesmidpointx
Exergy [18,19]off-streamin-stream (barrage water)-x---resourcesmidpointx
Ecological scarcity method [21]off-stream--x-x-resourcesmidpoint-
Brent [24]off-streamoff-stream-x-x-ecosystemmidpoint-
Mila i Canals et al. [25]off-stream, in-stream-xx-x-resources & ecosystemmidpointx
Bayart et al. [28]off-stream--x-xxhuman healthmidpointx
Motoshita et al. [29] (malnutrition)off-stream--x-x-human healthendpointx
Motoshita et al. [32] (infectious diseases)off-stream--x-x-human healthendpointx
van Zelm et al. [33]off-stream--x (ground water)-x-ecosystemendpointx
Maendly and Humbert [36]-in-stream (barrage water)-x (barrage water)-x-ecosystemendpointx
Pfister et al. [38]off-stream--x-x-resources, ecosystem, human healthmidpoint, endpointx (only midpoint and non-agregated endpoint results)

4. Recommendations for Improvement and Development

Comprehensive recommendations for the development of methods to account for water use in LCA have been provided by the UNEP/SETAC Life Cycle Initiative. After presenting the key proposals published in the initiative’s framework paper [8], recommendations for improvement and development are given based on the previous discussion.

4.1. Recommendations of the UNEP/SETAC Life Cycle Initiative

The working group of this initiative focuses on off-stream freshwater consumptive use of blue water. Starting on the LCI level the framework suggests the provision of spatial information of water withdrawal and release to account for local scarcity conditions. Moreover, the inventory should distinguish the quality of water input and output fluxes (high or low) as well as the type of watercourse from which water is withdrawn and to which it is released (ground or surface water). With regard to LCIA the authors identified the following three elements of concern connected with water use:
  • Sufficiency of freshwater resource for contemporary human users
  • Sufficiency of freshwater resource for existing ecosystems
  • Sustainable freshwater resource basis for future generations and future uses of current generations
Based on the information compiled in the LCI, the three impact routes linking inventory data to the elements of concern should be modelled along the cause-effect-chain as described below.
Impact pathways linked to insufficiency of freshwater resource for contemporary human users. Here the authors [8] recommend differentiating between a compensation and a deficiency scenario depending on socio-economic parameters. In wealthy countries it is assumed that people do not have to suffer from deficiencies as they are able to compensate for water scarcity by e.g., seawater desalination. The environmental effects of such compensation measures can be assessed by means of conventional impact categories. In contrast, the reduced availability of freshwater in less developed countries forces humans to abstain from uses provided by the water. On the midpoint level the impact category ‘water deprivation for human uses’ expressed in ‘m³ of freshwater equivalent unavailable for humans’ is proposed. Characterization factors should take into account the regional freshwater scarcity, the number of functionalities provided by the freshwater, as well as the water quality. As stated earlier, these recommendations are put into practice in the method developed by Bayart and colleagues [28]. At the end of the cause-effect-chain, the area of protection human life comprising the endpoint categories human health and labour can be affected.
Impact pathways linked to insufficiency of freshwater resource for existing eco-systems. On midpoint level the freshwater scarcity for ecosystems could be described in the category ‘water deprivation in ecosystems’ measured in ‘m³ of freshwater unavailable for ecosystems’. Appropriate characterization factors should account for the regional scarcity in an area as well as for the ecological value of the resource. With regard to the area of protection biotic environment, the endpoint categories ‘biotic productivity’ and ‘biodiversity’ will provide adequate indicators.
Impact pathways linked to non-sustainable resource basis for future generations and future uses. If water extraction exceeds the renewability rate, ‘water depletion’ expressed in ‘m³ of freshwater equivalent depleted’ accounts for the loss of water for future generations on the midpoint level. According to local degree of consumption and individual renewability rates, characterizations factors need to account for regional aspects. Due to high uncertainties in modeling future effects on human life and biotic environment, only the area of protection abiotic environment, comprising the endpoint category ‘abiotic natural resources’, is taken into account so far.

4.2. Methodological Gaps and Research Needs

The comparison of the scopes of the methods shown in Table 2 reveals that most of the methods focus on a specific type of water use, which is off-stream freshwater consumptive use of blue water. Other water uses like in-stream and degradative uses are still underrepresented in the methodological development. Furthermore, the consumption of green water, which is especially relevant in terms of crop cultivation, is only accounted for in the methods virtual water [10], water footprint [11], and Mila i Canals et al. [25]. Yet, none of the three methods provides a characterization model for the assessment of negative effects resulting from this type of water use. However, as the consumption of green water can cause water deprivation for ecosystems and also may reduce the renewability of ground and surface water, this is a severe shortcoming, which should be addressed by future research efforts.
Even though local water scarcity is taken into account by the latest method developments it is a general deficiency that most methods do not account for differences in terms of water quality of input and output fluxes yet. So far, only Bayart and colleagues [28] have accounted for this phenomenon, which is especially relevant when assessing effects of water use on human health. Moreover, most methods do not distinguish between water sources from which water is withdrawn and to which it is released. However, with regard to the areas of protection human health, ecosystem quality, and resources there is a difference whether water is withdrawn from a river, or lake, or aquifer. For example, the withdrawal of water from a fossil aquifer might not cause any effects on ecosystem quality. From an ecosystem perspective it might even be beneficial to withdraw fossil groundwater as it will become available to the ecosystem after its use. On the other hand the withdrawal of water from a lake with a high renewability rate might not cause resource depletion. The only methods accounting for this phenomenon are provided by Mila i Canals et al. [25] and Bayart and colleagues [28] who partly differentiate types of blue water use and their respective impact pathways (see Figure 1).
However, this proposal also denotes the trade-off that all advanced water footprinting methods have to face—increased detail and sophistication of the methods with regard to inventory modeling and impact assessment lead to substantially increasing data requirements. Hence, the efforts to determine water footprints will increase as more and more information regarding type of water use, type of water, water quality and local scarcity are required. Especially when background processes such as the mining of raw materials, the production of semi-finished products, or the generation of electricity are taken into account, such data is costly to collect and currently not sufficiently available in public or commercial databases. As a consequence, method developers must address the trade-off between ‘scientific quality’ and ‘applicability’. From our perspective, there is currently no method or indicator that can be regarded as a broadly accepted standard—like for example the ‘global warming potential’ for climate change. Simple methods like water inventories are fairly well applicable, but obviously lack relevance and information quality. More advanced methods like the impact category ‘freshwater deprivation for human uses’ [28] refer to the current state of knowledge but suffer from prohibitively high data demands.
It will take substantial research efforts to develop a comprehensive and scientifically robust impact assessment method for water use in LCA—despite significant progress in recent years. In the short term, the most urgent task for the scientific community is to develop an intermediate approach between the inadequate inventory methods and the incomplete impact assessment approaches available today. The demand for better informed decision-making support on water use issues is obvious in both private and public organizations. The challenge is to satisfy this demand with a method that paves a consistent way towards tomorrow’s method refinements once the necessary data get available.

5. Conclusions

Freshwater is a vital yet often scarce resource sustaining live on our planet that needs to be managed properly to ensure human health and ecosystem quality. Hence, it is surprising that life cycle assessment—a tool to promote sustainable decision making—accounts for lots of environmental interventions, but so far often neglects water use. Having realized this shortcoming, which is especially relevant concerning agricultural products and biofuels, the life cycle assessment community has put great efforts in method development to properly address water use. On both inventory and impact assessment level, lots of accounting models have been developed. The International Organization for Standardization has recently even launched a project aiming at creating an international standard for water assessment in life cycle assessment. Taking into account the significant progress in method development, an overview of a broad range of methods developed to enable accounting and impact assessment of water use has been provided within this paper. Moreover, the individual methodological advantages as well as shortcomings have been discussed and resulting research gaps have been identified. The analysis revealed that the methodological scopes differ significantly regarding the types of water use accounted for, the inclusion of local water scarcity conditions, as well as the differentiation between watercourses and quality aspects. In conclusion there are promising methodological developments enabling sound accounting and impact assessment of water use in life cycle assessment. However, most methods focus on the assessment of off-stream consumptive use of blue water while other types of water use are underrepresented. Moreover, as different watercourses fulfill different functions, more detailed inventories and impact pathways need to be considered in water use assessment. Yet, the application of the most advanced methods requires high resolution inventory data, which can hardly be satisfied, especially with regard to background processes in the production chain. Hence, the trade-off between ‘precision’ and ‘applicability’ needs to be addressed in future studies and in the new international standard.

Acknowledgements

The authors would like to express sincere thank to Aliston Watson (Ministry of Agriculture and Forestry, New Zealand) and Vanessa Bach (Technische Universität Berlin) for their valuable comments on this paper. Moreover, the feedback of Anna Kounine, Manuele Margni, and Sebastien Humbert, who are coordinating the water assessment working group of the UNEP/SETAC Life Cycle Initiative, was highly appreciated.

References

  1. International Water Management Institute. Water for Food, Water for Life: A Comprehensive Assessment of Water Management in Agriculture; Earthscan: London, UK, 2007. [Google Scholar]
  2. United Nations World Water Assessment Programme. The United Nations World Water Development Report 3—Water in a Changing World; UNESCO: Paris, France, 2009. [Google Scholar]
  3. Schnoor, J.L. LCA and Environmental Intelligence? Environ. Sci. Technol. 2009, 43, 2997. [Google Scholar] [PubMed]
  4. Dominguez-Faus, R.; Powers, S.E.; Burken, J.G.; Alvarez, P.J. The water footprint of biofuels: a drink or drive issue? Environ. Sci. Technol. 2009, 43, 3005–3010. [Google Scholar] [CrossRef] [PubMed]
  5. Environmental Management—Life Cycle Assessment—Principles and Framework (ISO 14040:2006); European Committee for Standardisation: Brussels, Belgium, 2006.
  6. Finkbeiner, M. Carbon footprinting—opportunities and threats. Int. J. LCA 2009, 14, 91–94. [Google Scholar] [CrossRef]
  7. Rajan, A. Forget carbon: you should be checking your water footprint. The Independent, 21 April 2008. [Google Scholar]
  8. Bayart, J.B.; Bulle, C.; Koehler, A.; Margni, M.; Pfister, S.; Vince, F.; Deschenes, L. A framework for assessing off-stream freshwater use in LCA. Int. J. LCA 2009. (submitted). [Google Scholar]
  9. Guinee, J.B.; de Bruijn, H.; van Duin, R.; Gorree, M.; Heijungs, R.; Huijbregts, M.A.J.; Huppes, G.; Kleijn, R.; de Koning, A.; van Oers, L.; Sleeswijk, A.W.; Suh, S.; Udo de Haes, H.A. Life Cycle Assessment—An Operational Guide to the ISO Standards; Centre of Environmental Science, Leiden University (CML): Leiden, The Netherlands, 2001. [Google Scholar]
  10. Allan, J.A. Virtual water: a strategic resource, global solutions to regional deficits. Ground Water 1998, 36, 545–546. [Google Scholar] [CrossRef]
  11. Hoekstra, A.Y.; Hung, P.Q. Virtual Water Trade: A Quantification of Virtual Water Flows between Nations in Relation to International Crop Trade. In Value of Water Research Report Series 11; UNESCO-IHE: Delft, The Netherlands, 2002. [Google Scholar]
  12. ecoinvent Centre Homepage. Available online: http://www.ecoinvent.org/ (accessed on 12 March 2009).
  13. PE International Homepage. Available online: http://www.gabi-software.com (accessed on 8 July 2009).
  14. WBCSD Homepage. Available online: http://www.wbcsd.org/web/watertool.htm (accessed on 30 June 2009).
  15. Vince, F. Proposition for the LCI Framework. 2007; (unpublished). [Google Scholar]
  16. Water Footprint Network Homepage. Available online: http://www.waterfootprint.org (accessed on 23 June 2009).
  17. Hauschild, M.; Wenzel, H. Environmental Assessment of Products; Chapman & Hall, Thomson Science: New York, NY, USA, 1998; Volume 2. [Google Scholar]
  18. Bösch, M.E.; Hellweg, S.; Huijbregts, M.A.J.; Frischknecht, R. Applying Cumulative Exergy Demand (CExD) Indicators to the ecoinvent Database. Int. J. LCA 2007, 12, 181–190. [Google Scholar] [CrossRef]
  19. Dewulf, J.; Bosch, M.E.; De Meester, B.; van der Vorst, G.; van Langenhove, H.; Hellweg, S.; Huijbregts, M.A.J. Cumulative Exergy Extraction from the Natural Environment (CEENE): A Comprehensive Life Cycle Impact Assessment Method for Resource Accounting. Environ. Sci. Technol. 2007, 41, 8477–8483. [Google Scholar] [CrossRef] [PubMed]
  20. Verein Deutscher Ingenieure (VDI). Kumulierter Energieaufwand-Begriffe, Definitionen, Berechnungsmethoden; VDI 4600; Beuth Verlag GmbH: Berlin, Germany, 1997. [Google Scholar]
  21. Frischknecht, R.; Steiner, R.; Jungbluth, N. Ökobilanzen: Methode der ökologischen Knappheit—Ökofaktoren 2006—Methode für die Wirkungsabschätzung in Ökobilanzen; Öbu-Netzwerk für nachhaltiges Wirtschaften: Bern, Swizerland, 2009. [Google Scholar]
  22. ISO. Environmental Management—Life Cycle Assessment—Requirements and Guidelines (ISO 14044:2006); European Commitee for Standardisation: Brussels, Belgium, 2006. [Google Scholar]
  23. OECD Key Environmental Indicators; OECD Environment Directorate: Paris, France, 2004.
  24. Brent, A.C. A life cycle impact assessment procedure with resource groups as area of protection. Int. J. LCA 2004, 9, 172–179. [Google Scholar] [CrossRef]
  25. Mila i Canals, L.; Chenoweth, J.; Chapagain, A.; Orr, S.; Anton, A.; Clift, R. Assessing freshwater use in LCA: Part I—inventory modelling and characterisation factors for the main impact pathways. Int. J. LCA 2008, 14, 28–42. [Google Scholar]
  26. Smakhtin, V.; Revenga, C.; Döll, P. A pilot global assessment of environmental water requirements and scarcity. Water Int. 2004, 29, 307–317. [Google Scholar] [CrossRef]
  27. Raskin, P.; Gliek, P.; Kirshen, P.; Pontius, G.; Strzepek, K. Water Futures: Assessment of Long-Range Patterns and Problems; Swedish Environment Institute/United Nations: Stockholm, Sweden, 1997. [Google Scholar]
  28. Bayart, J.B.; Bulle, C.; Margni, M.; Vince, F.; Deschenes, L.; Aoustin, E. Operational characterisation method and factors for a new midpoint impact category: freshwater deprivation for human uses. In Proceedings of the SETAC Europe: 19th Annual Meeting, Gothenborg, Sweden, 31 May–4 June 2009.
  29. Motoshita, M.; Itsubo, N.; Inaba, A. Development of impact assessment method on health damages of undernourishment related to agricultural water scarcity. In Proceedings of the Eighth International Conference on EcoBalance, Tokyo, Japan, 10–12 December 2008.
  30. Murray, C.; Lopez, A. The Global Burden of Disease; Harvard School of Public Health (on behalf of the World Health Organization, World Bank): Boston, MA, USA, 1996. [Google Scholar]
  31. Prüss-Üstün, A.; Bos, R.; Gore, F.; Bartram, J. Safe Water, Better Health; World Health Organization: Geneva, Swizerland, 2008. [Google Scholar]
  32. Motoshita, M.; Itsubo, N.; Inaba, A.; Aoustin, E. Development of damage assessment model for infectious diseases arising from domestic water consumption. In Proceedings of the SETAC Europe: 19th Annual Meeting, Gothenburgborg, Sweden, 31 May–4 June 2009.
  33. Van Zelm, R.; Rombouts, M.; Snepvangers, J.; Huijbregts, M.A.J.; Aoustin, E. Characterization factors for groundwater extraction based on plant species occurence in The Netherlands. In Proceedings of the SETAC Europe: 19th Annual Meeting, Gothenborg, Sweden, 31 May–4 June 2009.
  34. McDonald, M.G.; Harbaugh, A.W. A modular three-dimensionalfinite-difference groundwater flow model. In Techniques of Water-Resource Investigation; United States Geological Survey: Denver, CO, USA, 1988. [Google Scholar]
  35. Bakkenes, M.; De Zwart, D.; Alkemade, J.R.M. MOVE nationaal Model voor de Vegetatie versie 3.2 Achtergronden en analyse van modelvarianten; National Institute of Public Health and the Environment: Bilthoven, The Netherlands, 2002. [Google Scholar]
  36. Maendly, R.; Humbert, S. Empirical characterization model and factors assessing aquatic biodiversity damages of hydropower water use. Int. J. LCA 2009. (submitted). [Google Scholar]
  37. Goedkoop, M.; Spriensma, R. The Eco-indicator 99—A Damage Oriented Method for Life Cycle Impact Assessment, Methodology Report; Product Ecology Consultants (PRe): Amersfoort, The Netherlands, 2001. [Google Scholar]
  38. Pfister, S.; Koehler, A.; Hellweg, S. Assessing the environmental impacts of freshwater consumption in LCA. Environ. Sci. Technol. 2009, 43, 4098–4104. [Google Scholar] [CrossRef] [PubMed]
  39. Alcamo, J.; Doll, P.; Heinrichs, T.; Kaspar, F.; Lehner, B.; Rosch, T.; Siebert, S. Development and testing of the WaterGAP 2 global model of water use and availability. Hydrolog. Sci. J. 2003, 48, 317–337. [Google Scholar]
  40. Nemani, R.R.; Keeling, C.D.; Hashimoto, H.; Jolly, W.M.; Piper, S.C.; Tucker, C.J.; Myneni, R.B.; Running, S.W. Climate-driven increases in global terrestrial net primary production from 1982 to 1999. Science 2003, 300, 1560–1563. [Google Scholar] [CrossRef]
  41. Ridoutt, B.G.; Pfister, S. A revised approach to water footprinting to make transparent the impacts of consumption and production on global freshwater scarcity. Glob. Environ. Change 2010, 1, 113–120. [Google Scholar]
  42. Hoekstra, A.Y.; Gerbens-Leenes, W.; van der Meer, T.H. Reply to Pfister and Hellweg: Water footprint accounting, impact assessment, and life-cycle assessment. PNAS 2009, 106, 114. [Google Scholar] [PubMed]
  43. Pfister, S. Homepage. Available online: http://www.ifu.ethz.ch/staff/stpfiste (accessed on 7 January 2010).
  44. Google Inc. Homepage. Available online: http://earth.google.com/ (accessed on 7 January 2010).
  45. Kounina, A. Review of methods addressing water in life cycle assessment. In Proceedings of the Life Cycle Assessment IX, Boston, MA, USA, 29 September–2 October 2009; pp. 108–109.

