Impact of the Introduction of Biofuel in the Transportation Sector in Indonesia

Department of Management Science and Technology, Graduate School of Engineering, Tohoku University, Aoba yama 6-6-11-808, Sendai, 980-8579, Japan
Sustainability 2010, 2(6), 1831-1848; https://doi.org/10.3390/su2061831
Submission received: 27 May 2010
/
Revised: 17 June 2010
/
Accepted: 17 June 2010
/
Published: 23 June 2010
Abstract
:Indonesia faces serious energy problems; its status as an oil exporter has changed to that of a net oil importer. Additionally, a highly subsidized price of fossil fuels, combined with a high dependency on oil, burden Indonesia’s national budget. In 2006, the government enacted a Mix Energy Policy, which strives for a mixture of energy sources by introducing renewable energy into the existing energy systems. Among the several alternative renewable energy options, biofuel is perceived as having the most potential in Indonesia, due to favorable climate and the availability of land and technology. This paper assesses the impact of the introduction of biofuel in the transportation sector of Indonesia in terms of energy, economics and the environment. A linear programming model was built to simulate the impact of the introduction of biofuel. The author concludes that the introduction of biofuel may have a positive impact by partially replacing the oil used for domestic transportation, generating income due to export of excess production, creating jobs in several sectors, and reducing carbon emissions in a sustainable way. In the model, four scenarios are tested: under the scenario ‘land and technology’, with proper land allocation and technology development, biofuel production can reach 2,810 PJ/annum and reduce greenhouse gas emissions by 168 million tons/annum CO2-equivalent. Furthermore, a profit of 49 billion USD can be generated in 2025 (all maximum values).
1. Introduction
With a population of 237 million (2007), Indonesia is the fourth most populous country in the world. This country faces serious energy problems, with a changed status from that of a net oil exporter to a net importer in 2007. Additionally, the country has a highly subsidized price of fossil fuels, depleted oil resources, and a strong dependency on oil for its Gross Domestic Product (GDP). The subsidy on fuel in Indonesia uses a significant part of the country’s budget. Action is necessary to tackle these matters. To reduce oil dependency, the government has enacted the so-called Mix Energy Policy in 2006, which urges the use of a mixture of energy sources utilizing local resources, i.e., renewable energy sources beside fossil fuels.
Among several alternative energy options, the first generation technology for biofuels (fermentation and esterification) has the biggest potential as an alternative fuel source in Indonesia, due to the favorable climate and the availability of land and technology. In addition, biofuels can mitigate climate change, as they are considered carbon neutral, generate income by export of this commodity, and create jobs in agriculture and industry [1]. Due to the market potential of biofuel products to substitute oil use in the transportation sector and for export, there are several domestic and foreign investments in the biofuel industry. Starting with 1.2 billion USD invested by the government, private plans to invest around 2 billion USD started from 2007, and are expected to grow rapidly [2].
The challenge of doing business in the field of biofuel production in developing countries is that the market suffers from a lack of information, infrastructure, and institutions [3]. With inadequate information and a poorly equipped infrastructure (in terms of policy, the market, science and technology, and public acceptance), any initiative for a large scale introduction of biofuels will be premature. Therefore, modeling the introduction of biofuel production may help to reduce risks.
This study analyzes the impact of the introduction of biofuel in the transportation sector of Indonesia under four scenarios. Since biofuel is relatively new to Indonesia, the impact of its introduction is modeled in a multifaceted approach from the perspectives of energy, economy, the environment and socioeconomics (in terms of job creation in industry and agriculture). The impacts are assessed by comparing optimization scenarios with a base scenario (a ‘do nothing’ scenario), and with scenarios based on land allocation, technology development, and a mixture of both.
The outcome of this study can be used by several stakeholders: academics for research, businesses for investment, and the government for policy making. This paper aims to provide the stakeholders with answers to the following questions:
- What is the potential in volume of biofuel production in Indonesia and under which conditions?
- What is the impact of the introduction of biofuel on the energy balance in Indonesia? What is its economic value and labor requirement?
- By how much can emission of greenhouse gases be reduced? What is the technology to assess biofuel development in Indonesia?
The objective of this study is to maximize the energy output from energy crops in Indonesia under a restricted growth of available land and under technological constraints. In the following sections, the model and data used in the analysis are described, the results are presented and analyzed from several points of view, and conclusions are drawn.
2. Energy Policies in Indonesia
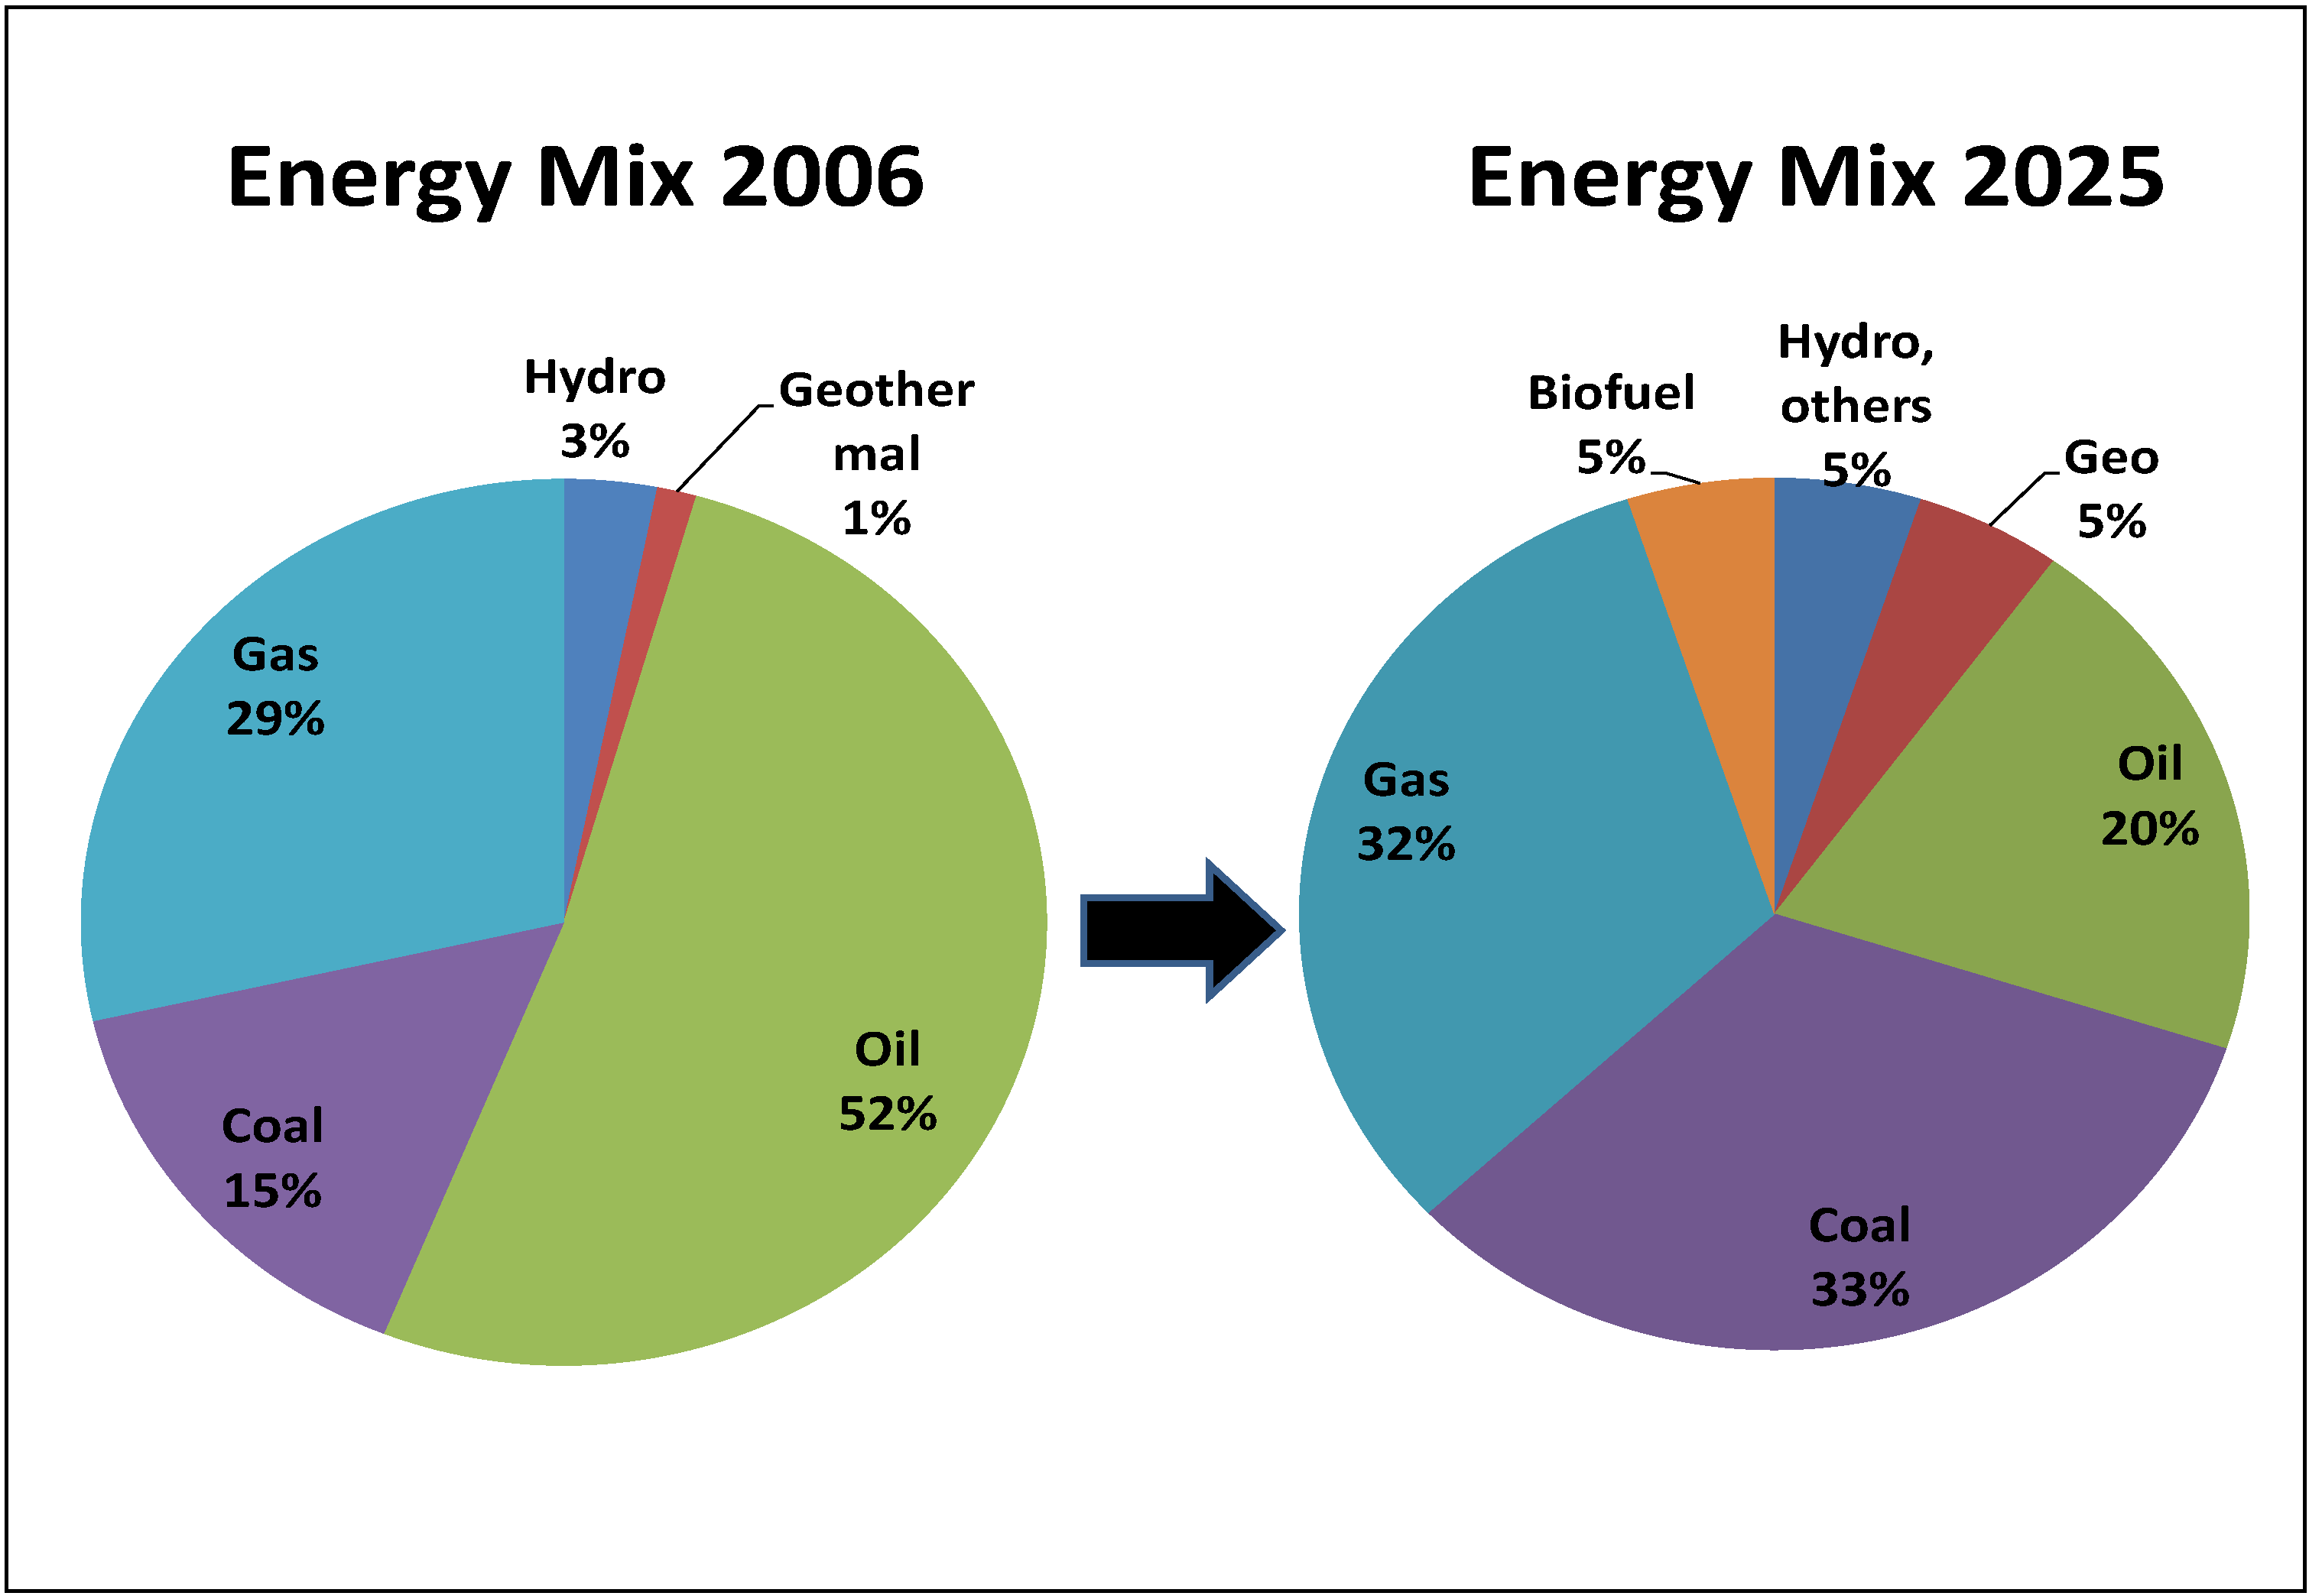
In 2008, the fuel and electricity subsidies amounted to 14 and 6 billion USD, respectively, equaling the total central governmental capital and social spending. Oil and gas contributed to 31.5% of government revenues in 2006, but decreased to 20.4% in 2008, in accordance with depleting oil resources and an oil production decrease from 9 × 10⁹ barrels in 1987 to half of that in 2007 [4]. For these reasons, the government enacted the so-called Mix Energy Policy (in 2006), to reduce dependency on oil by the use of a mixture of energy sources. They hoped to utilize local resources to make renewable energy (e.g., biofuel). The target was to reduce the share of fossil oil in providing energy from 52% of total energy consumption (as in 2006) to 20% by 2025. By that year, the remaining energy should come from coal (35%) and gas (30%), whilst renewable energy sources are hoped to provide 15% of total energy consumption.
Figure 1 shows the Mix Energy Policy based on the Presidential Decree No. 5 (2006), which states that the share of renewable (geothermal and hydropower) will increase from 4% to 15% within 20 years [2]. Biofuel was introduced with the objective of fulfilling 5% of the total energy consumption by 2025. It was expected that biofuel development could create at least 4 and 7 million jobs by 2010 and 2025, respectively. In 2008, the transportation sector consumed 26 million ton oil equivalent (Mtoe), as depicted in Table 1 The replacement of 5–20% of this oil by biofuel will reduce 1.5–6 × 10⁹ liters of fossil oil consumption per annum.
Figure 1.
Indonesia’s Mix Energy Policy.
Because the transportation sector used 30% of the total energy consumed in 2008 (in this calculation, biomass derived energy for cooking in rural areas is excluded), a mixture of biofuel with gasoline and diesel fuel can significantly diminish oil consumption on a national scale [5].

Table 1.
Fuel consumption in the transportation sector in Indonesia (in million ton oil equivalent; Mtoe).
| 2000 | 2002 | 2004 | 2006 | 2008 | Growth (%) | |
|---|---|---|---|---|---|---|
| Gasoline | 10.6 | 11.9 | 14.6 | 14.6 | 17.2 | 7.43 |
| Diesel fuel | 8.4 | 8.8 | 9.7 | 7.9 | 7.9 | –0.74 |
| Others (biofuel) | n/a | n/a | n/a | 0.2 | 0.9 | 116.67 |
| Total Transportation | 19.0 | 20.7 | 24.3 | 23.2 | 26.1 | 4.68 |
| Final Energy Consumption | 63.9 | 65.6 | 73.0 | 72.0 | 87.8 | 4.68 |
3. Tools and Methods
3.1. Model Description
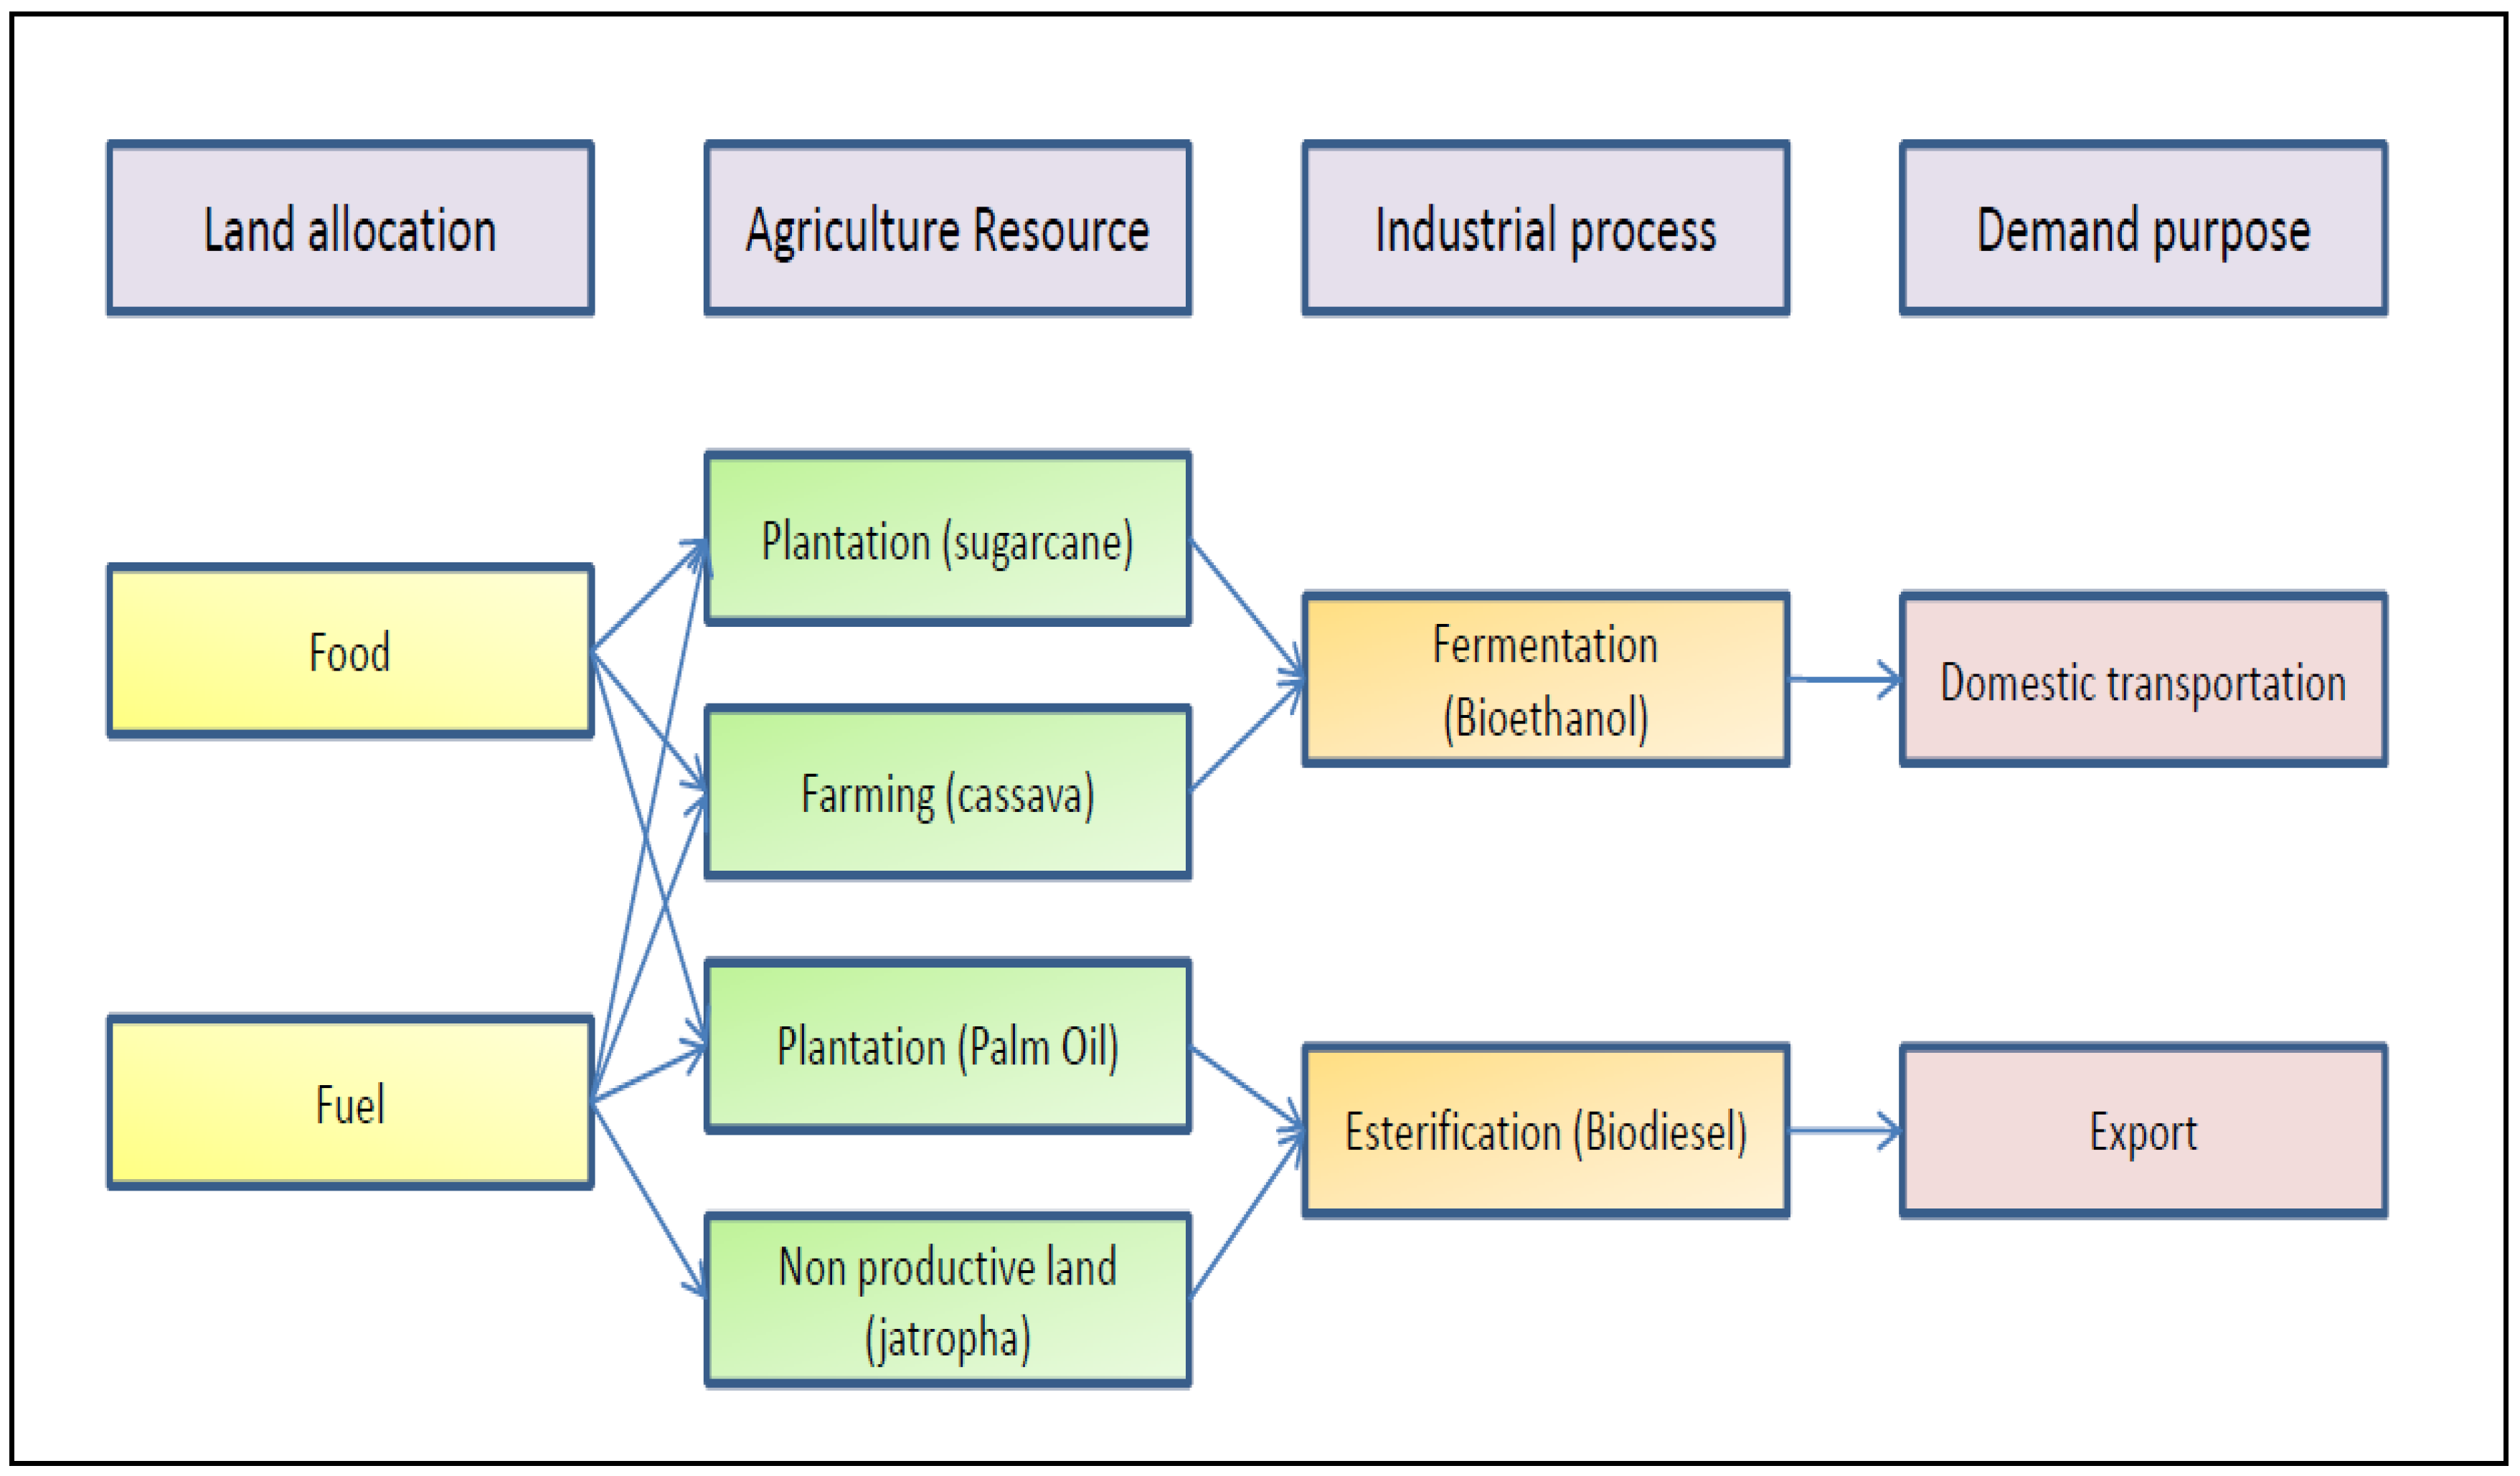
The most relevant tools for energy planning are models which mathematically represent a simplification of reality [6]. The tool for this study is the BIOFUEL model as shown in Figure 2. This model is based on the supply side, aiming to identify a proper fuel and technology mix. This methodology uses optimization and simulation, and uses linear programming written in GAMS (General Algebraic Modeling System) as the modeling language, with CONOPT as the solver [7].
Figure 2.
Structure of the BIOFUEL model.

The structure of the model is designed so that it can use multiple supply chain crops: sugarcane and cassava to produce bioethanol, palm oil and Jatropha to produce biodiesel. To avoid a conflict between allocation of land for the production of food or fuel, land allocation for food is secured and the remaining land can be used for biofuel production. The first generation technologies for biofuels are fermentation to produce bioethanol, and esterification to produce biodiesel. Bioethanol can be used to substitute gasoline, while biodiesel can be used to substitute diesel fuel. The purposes of this model are to describe the optimal conditions in which to satisfy the demand for oil for domestic transportation and to seek export possibility for the excess production.
3.2. Basic Equations of the BIOFUEL Model
Land balance:
![Sustainability 02 01831 i001]()
![Sustainability 02 01831 i002]()
![Sustainability 02 01831 i003]()
![Sustainability 02 01831 i004]()


Biofuel supply balance:
![Sustainability 02 01831 i005]()
![Sustainability 02 01831 i006]()


Biofuel cost balance:
![Sustainability 02 01831 i007]()
![Sustainability 02 01831 i008]()
![Sustainability 02 01831 i009]()


Biofuel emission balance:
![Sustainability 02 01831 i010]()

Biofuel demand balance:
![Sustainability 02 01831 i011]()
![Sustainability 02 01831 i012]()
![Sustainability 02 01831 i013]()


Objective function to maximize biofuel energy balance:
![Sustainability 02 01831 i014]()

3.3. Input Parameters
The model uses comprehensive data based on Indonesia’s governmental policy and previous research work (references at the bottom of Table 2). Table 2 presents the data on the energy, cost, emissions, and yield of biofuel production in 2007. Table 3 presents the parameters used in this study, which are based on data from 2007. The demand for transportation fuel is quantified based on historical data from 1990 to 2007. This model is a simplification in at least five respects: (i) the growth in allocation of land for food and biofuel for all scenarios, (ii) the general assumption for biofuel production that the agricultural and industrial processes have a single output regardless of different locations and plant capacity, (iii) ‘perfect foresight’, with no uncertainty about the fluctuating costs of production, the impact of climate change on agricultural production, and fluctuations in the energy demand, (iv) all projections for monetary values are based on 2007 USD, (v) the demand for oil in domestic transportation is based on a policy that respectively requires 15% and 20% replacement of gasoline and diesel fuel in 2025. The excess production goes to export. Technology development is considered as technology learning, and is indicated by the increasing yield in agricultural and industrial production [14]. The growth rate of yield for biodiesel crops is set at 1.2 times that of bioethanol crops.
| Sugarcane | Cassava | Palm oil | Jathropha | |
|---|---|---|---|---|
| Energy (MJ/L) a | ||||
| agriculture | 3 | 3.91 | 6.56 | 13.23 |
| industrial | 3.34 | 8.15 | 7.3 | 26.46 |
| output | 31.22 | 34.4 | 49.54 | 60.85 |
| Cost (USD/L) b | ||||
| agriculture | 0.324 | 0.276 | 0.328 | 0.384 |
| industrial | 0.216 | 0.184 | 0.082 | 0.096 |
| Emission (kgCO2eq/L) c | ||||
| agriculture | 0.21 | 0.253 | 0.748 | 0.635 |
| industrial | 0.226 | 0.711 | 0.15 | 2.54 |
| avoid | 2.323 | 2.597 | 2.8 | 3.613 |
| Yield d | ||||
| agriculture (ton/ha) | 70 | 40 | 18 | 2 |
| industrial (L/ton) | 70 | 150 | 230 | 189 |
| Land a | Sugarcane | Cassava | Palm oil | Jatropha |
|---|---|---|---|---|
| size (106 ha) | 0.35 | 1.1 | 5.5 | 0.06 |
| fuel part (%) | 8.57 | 8.33 | 5.45 | 100 |
| fuel growth/year (%) | 27.02 | 17.27 | 16.46 | 25.88 |
| Constraints | Gasoline | Diesel | Bioethanol | Biodiesel |
| Energy content (MJ/L) d | 32 | 36.4 | 21.1 | 34.5 |
| Yield growth rate/annum (%)b | ||||
| agriculture | 1.9721 | 2.36652 | ||
| industrial | 1.9887 | 2.3864 | ||
| Demand c | ||||
| domestic (103 l) | 82,500 | 590,000 | ||
| growth/annum (%) | 33.795 | 10.4 | ||
| Employees e | ||||
| agriculture (person/ha) | 0.64 | 0.64 | ||
| industrial (person/106 l) | 1.04 | 6.08 |
3.4. Scenario Setting
The following scenarios were analyzed:
A. Base scenario.
The base scenario reflects a development based on the current energy situation and energy policy in 2006, i.e., a ‘no change policy’. In this scenario, the growth in land allocation is set to expand up to 1.75, 1.5, 4, and 3 × 10⁶ hectares for sugarcane, cassava, palm oil, and Jatropha, respectively.
B. Land scenario.
The ‘land’ scenario is based on a dynamic growth of land allocation for biofuel crops to 10.25 × 10⁶ hectares in total in 2025.
C. Technology scenario
The ‘technology’ scenario relies on a dynamic growth of yield by incorporating new technologies to increase the yield of agricultural and industrial production. In this scenario, there is no land expansion.
D. Mix scenario
The ‘mix’ scenario combines the means analyzed in the ‘land’ and ‘technology’ scenarios. Thus, land expansion refers to the ‘land’ scenario, and growth of yield refers to the ‘technology’ scenario.
4. Results and Analysis
4.1. Resource Production Potential
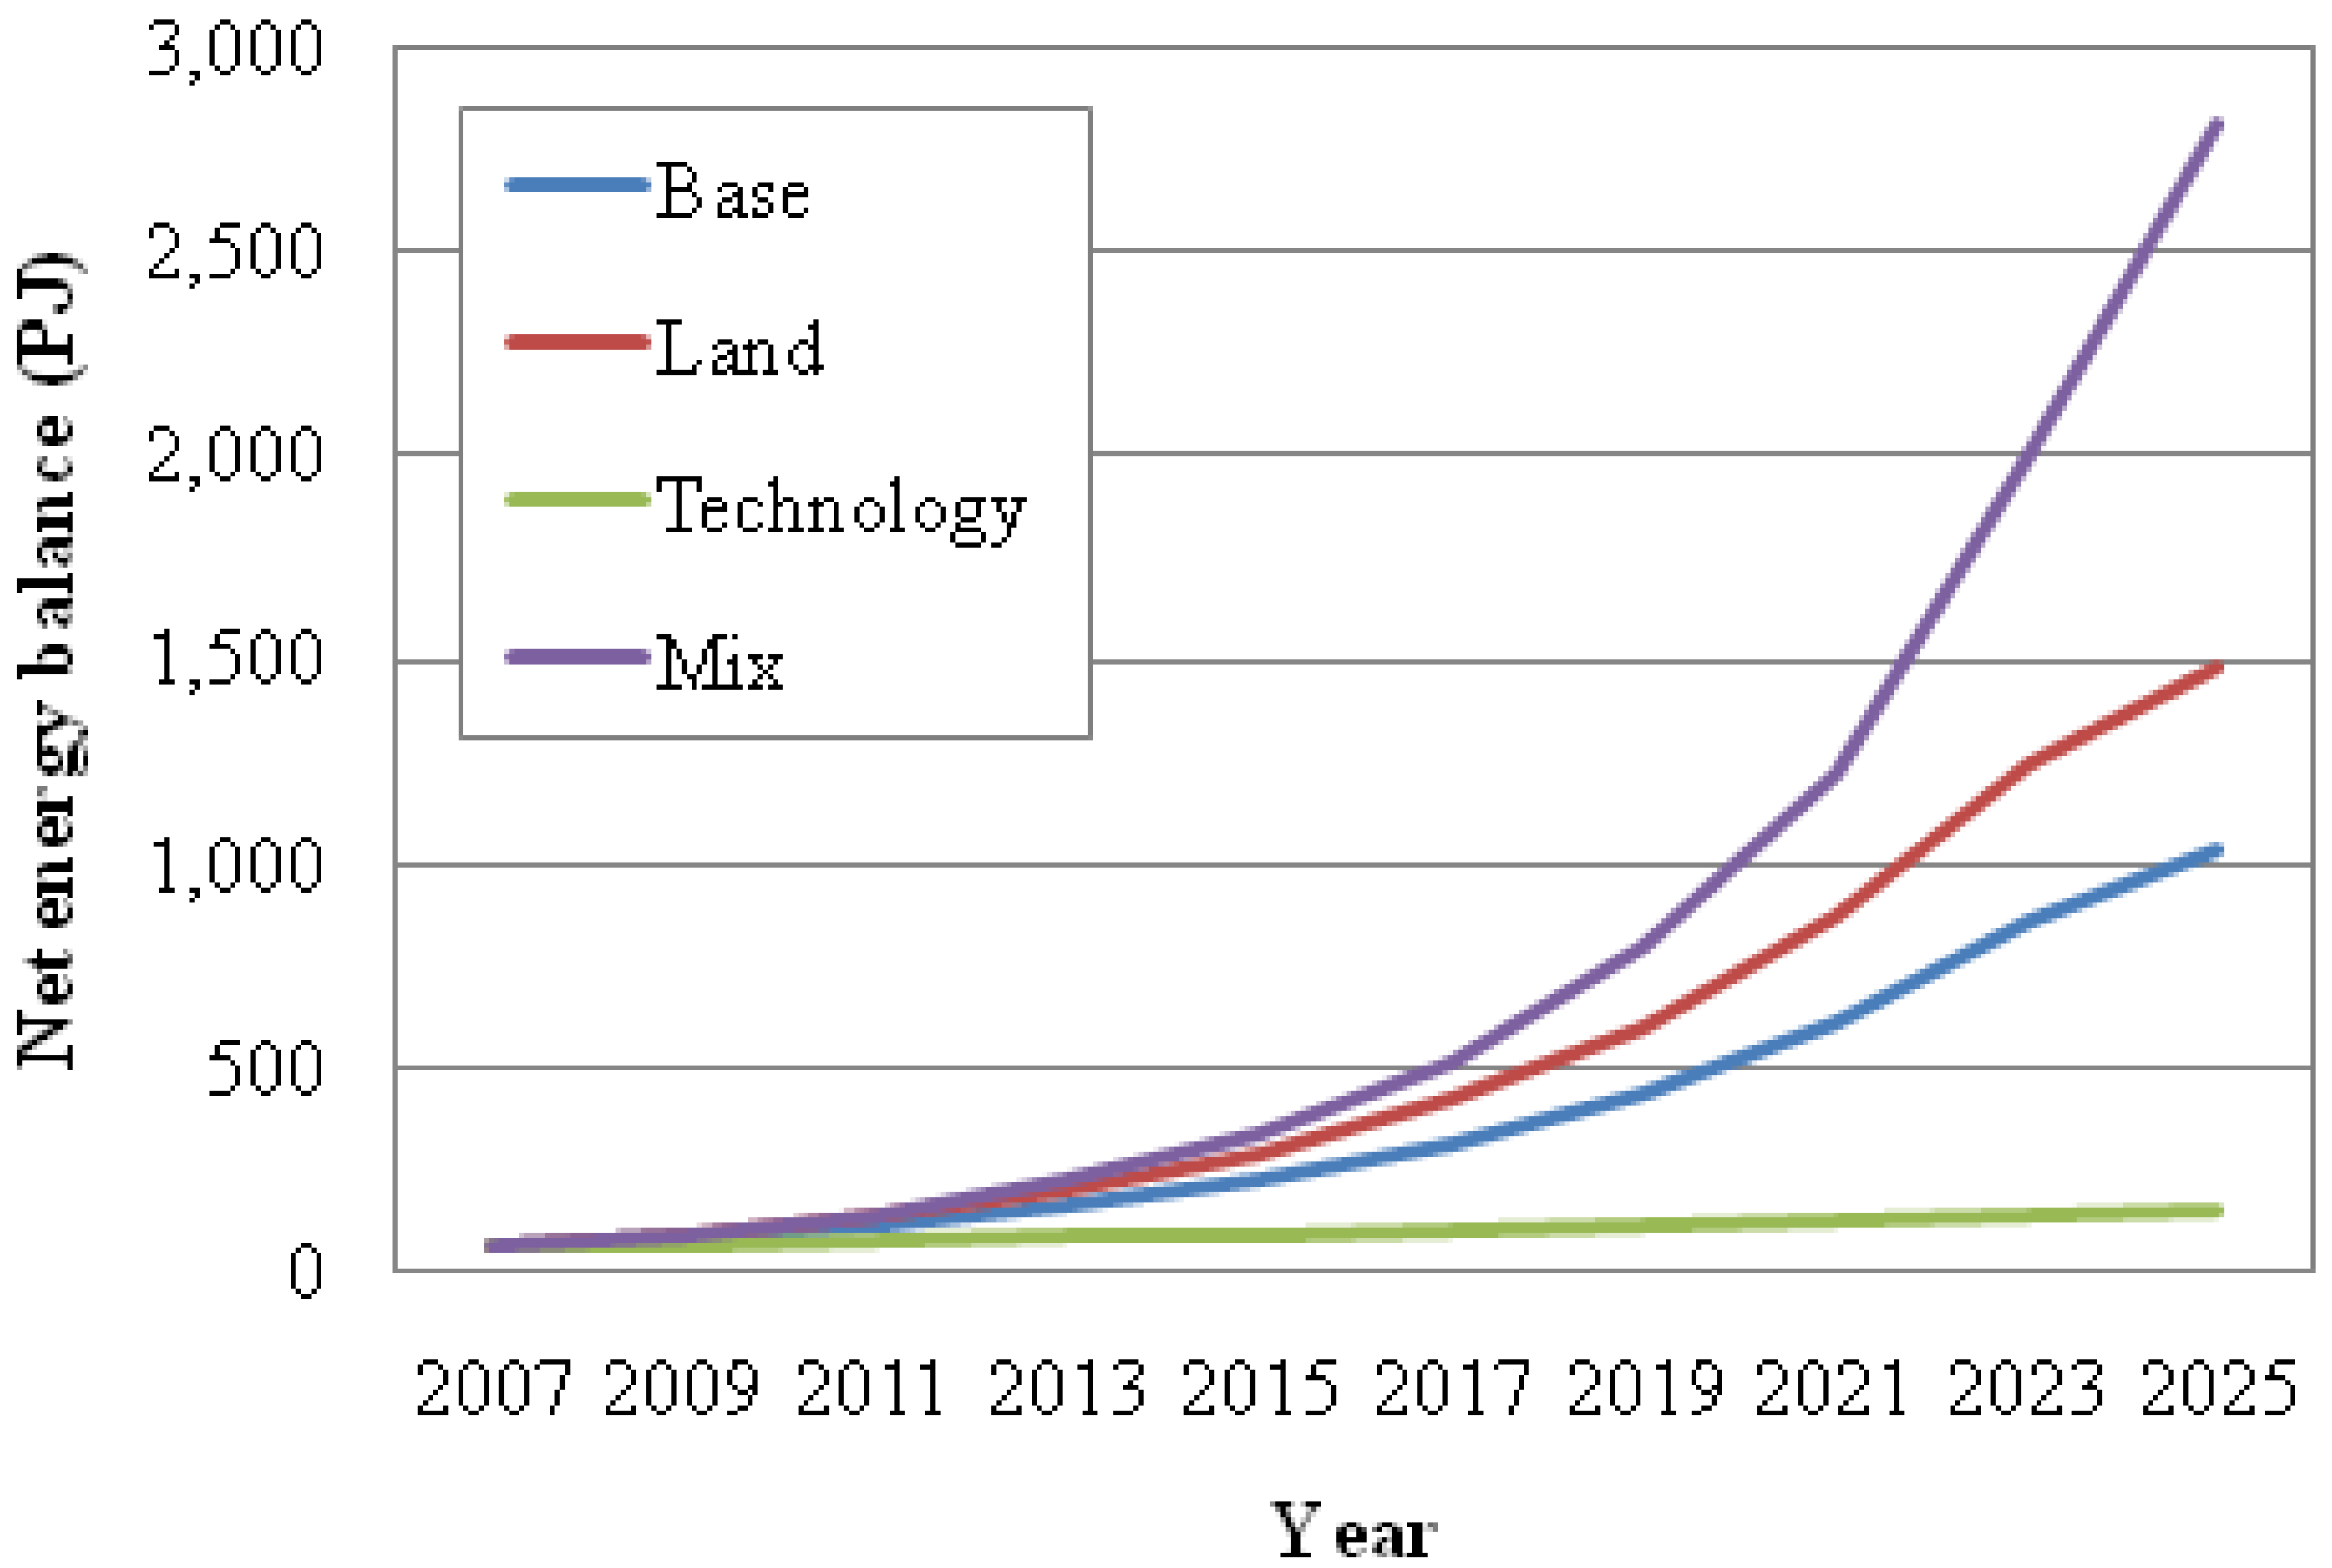
The net biofuel energy balance for all four scenarios is depicted in Figure 3. It can be seen that the best energy balance is achieved in the ‘mix’ scenario; the combined expansion of allocated land and technology development boosts output. In the ‘base’ scenario, the net biofuel energy balance increases to 1,029 PJ in 2025. In the ‘land’ scenario, with the same growth in the allocation of land, the net biofuel energy balance can achieve 1,479 PJ in 2025; in this scenario, the growth of the allocation of land is devoted to the highest energy output crops and does not follow the governmental policy setup.
The ‘technology’ scenario shows the lowest output, as the growth rate of technology showed a relatively low increase of the net biofuel energy balance, compared to that of the other scenarios. In the ‘technology’ scenario, the net biofuel energy balance increases from 62 PJ in 2007 to 155 PJ in 2025. This increment is solely based on advancement in technology, leading to an increased yield of biofuel products, in both agricultural and industrial processes, while expansion of land for biofuel production is not allowed in this scenario. By combining land expansion and technology development, the net biofuel energy balance increases from 62 PJ in 2007 to 2,810 PJ in 2025, as shown in the ‘mix’ scenario. Overall, the ‘mix’ scenario shows a higher value for net energy balance than the summation of the ‘land’ and ‘technology’ scenario, due to the exponential growth of allocated land and yield in agricultural and industrial processes.
Figure 3.
Biofuel net energy balance from 2007–2025.

Figure 4 shows the net energy balance for all scenarios in 2025 in more detail. Among all of the energy crops, palm oil gives the highest contribution in all scenarios. The percentage values of palm oil in the total biofuel net energy balances are: 58, 82, 77, and 66% for the ‘base’, ‘land’, ‘technology’, and ‘mix’ scenarios, respectively. Cassava gives the second highest contribution, with percentage values of: 10, 17, 18, and 17% for the ‘base’, ‘land’, ‘technology’, and ‘mix’ scenarios, respectively. The other crops, sugarcane and Jatropha, contribute the remaining fraction of the net biofuel energy balance.
Figure 4.
Biofuel net energy balance in 2025.
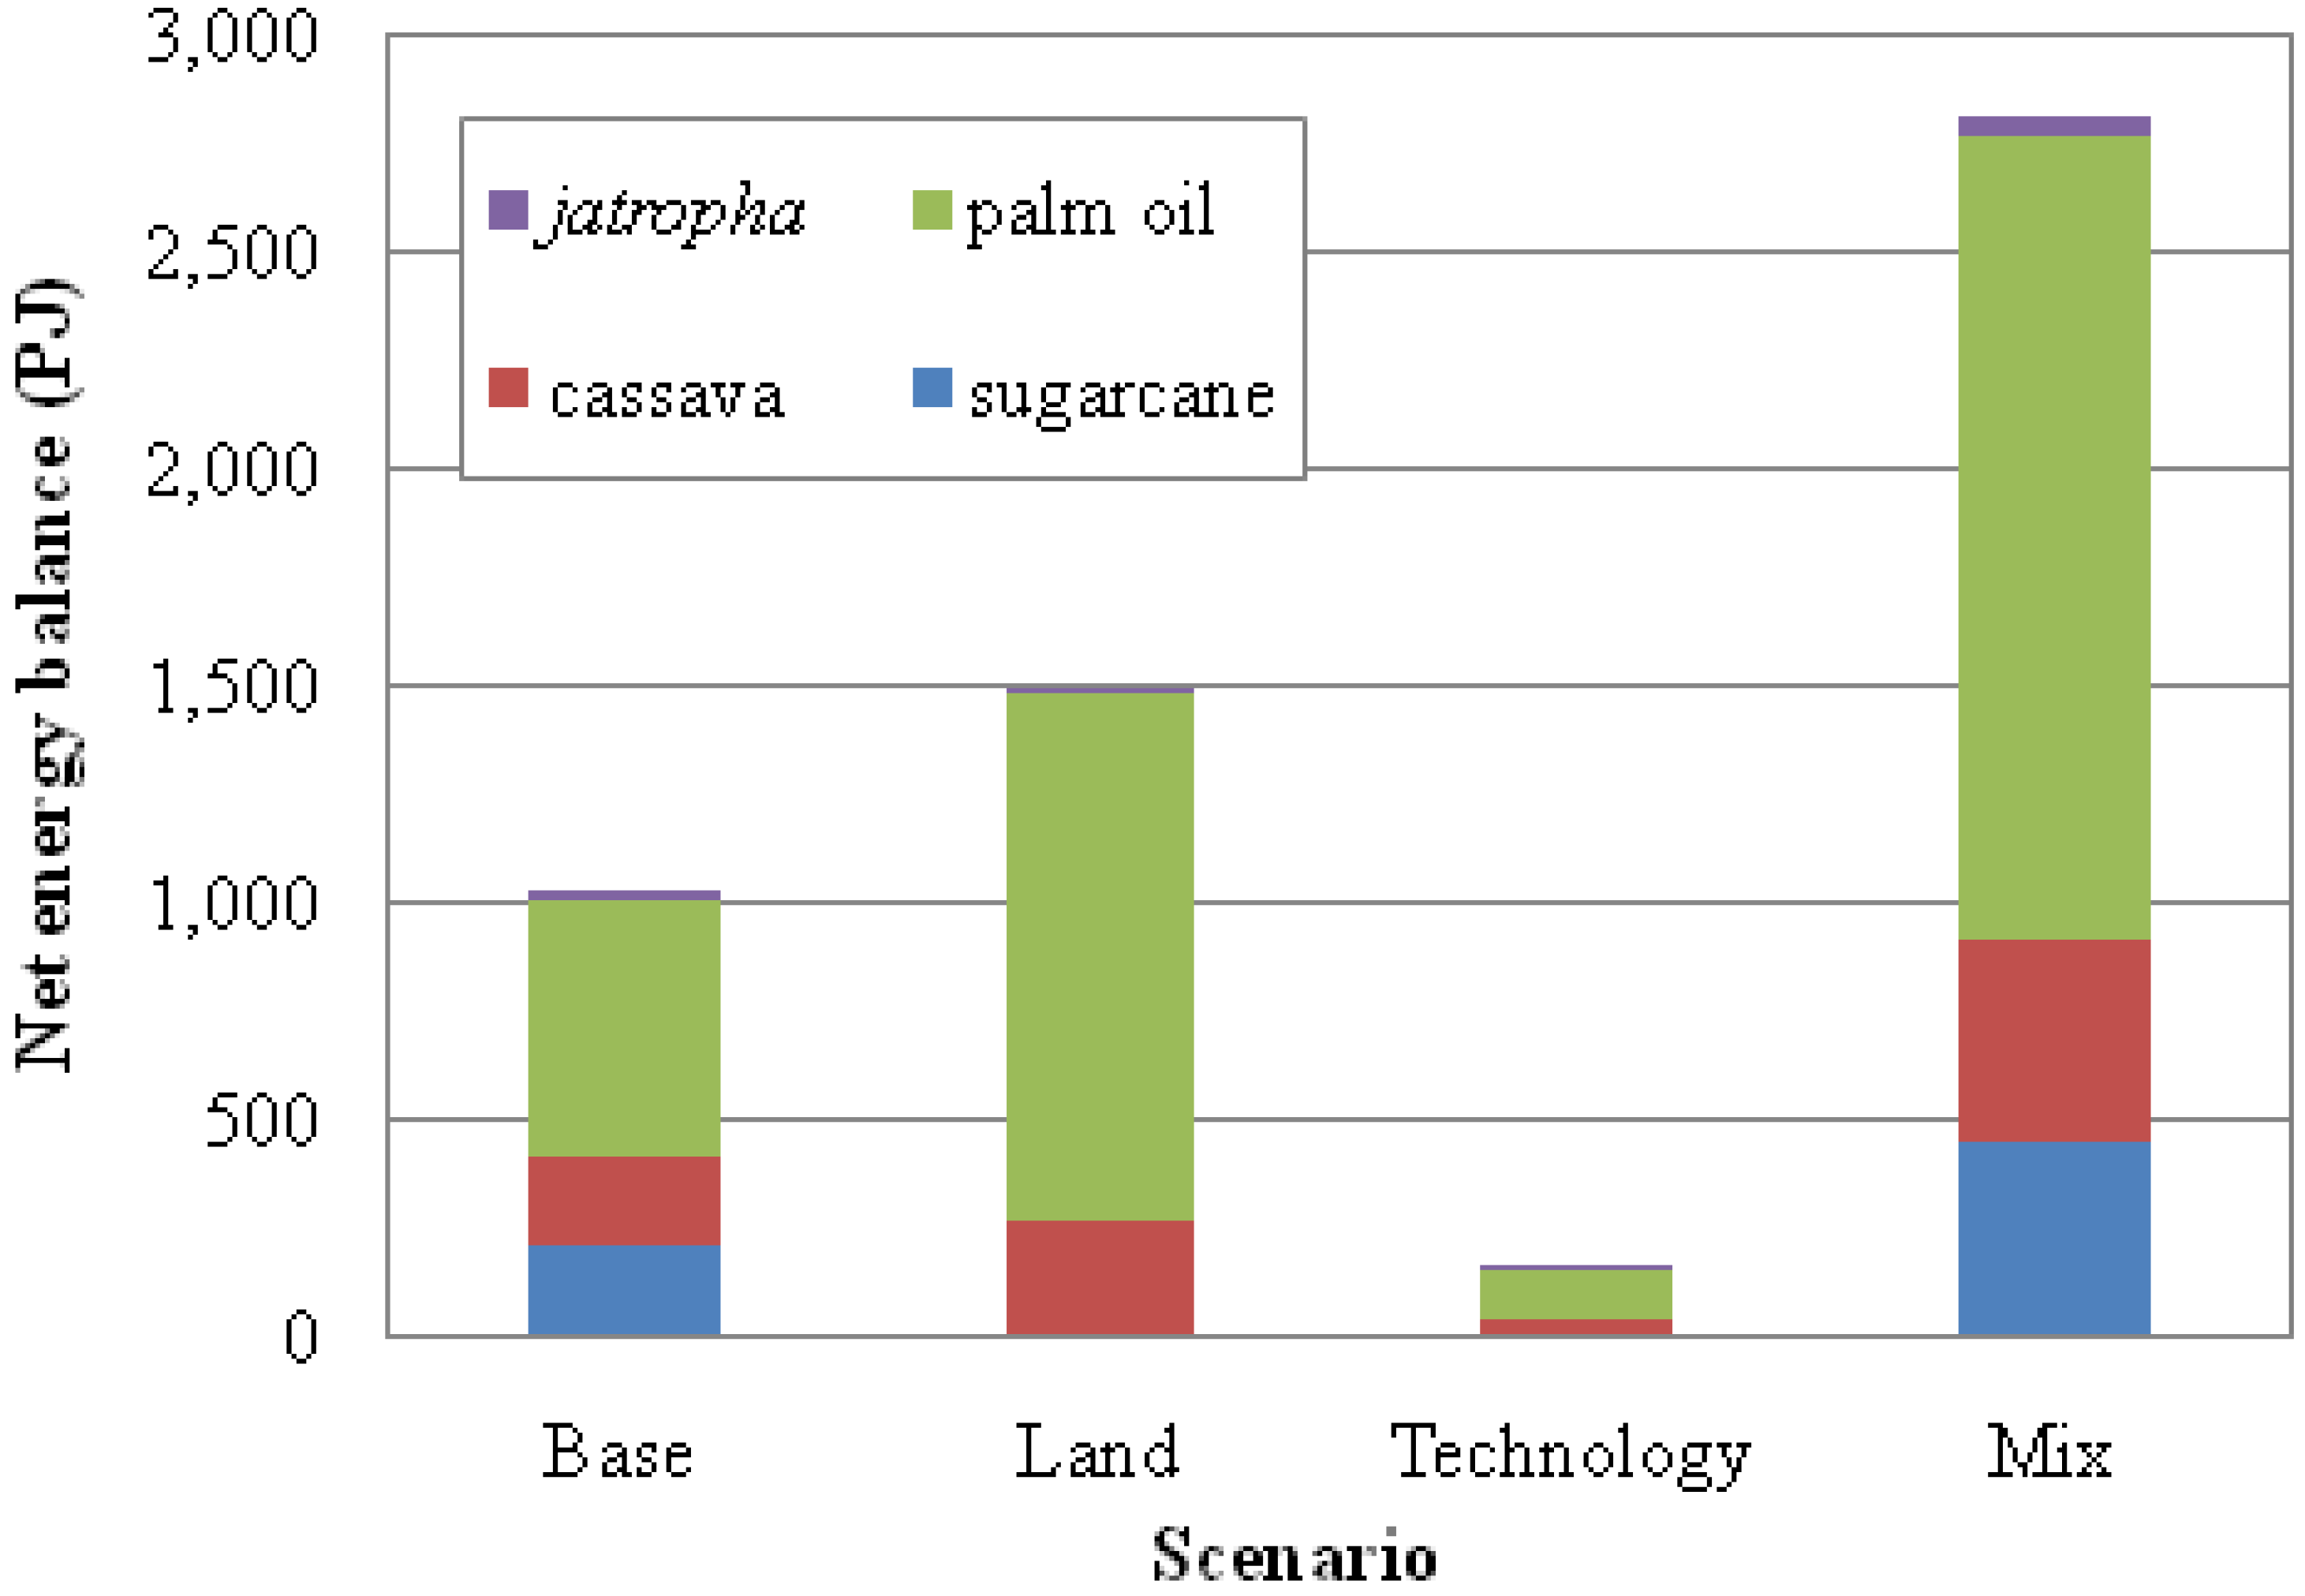
Sugarcane contributes significantly to the net energy balance in the ‘base’ and ‘mix’ scenarios, while a relatively small amount is added in the ‘land’ and ‘technology’ scenarios. Sugarcane presents a net energy balance value of 213, 4, 7 and 447 PJ in the ‘base’, ‘land’, ‘technology’ and ‘mix’, scenarios, respectively.
Jatropha has a relatively low energy balance and is only suitable for biofuel production if cultivated in low rainfall areas, such as the Sumbawa and Lombok islands. The land in those areas is not suitable for agricultural crops and is not yet utilized for any other commercial purposes. Jatropha is not present in the ‘land’ scenario and has a net energy balance value of 24, 1, and 43 PJ in the ‘base’, ‘technology’, and ‘mix’ scenarios, respectively. Because palm oil is the major energy source, biodiesel turns out to have a higher demand for production than bioethanol. This is in line with its higher energy balance.
The volume of bioethanol and biodiesel production in all scenarios, and the domestic demand in the period 2007–2025, are shown in Figure 5 and Figure 6 respectively. Biofuel products are divided into two types: bioethanol and biodiesel; biogas is not considered in this study. Bioethanol production, as depicted in Figure 5, can fulfill domestic demand in all scenarios, except for in the ‘technology’ scenario. In this latter scenario, bioethanol production will only be sufficient until 2015; starting from 2017, bioethanol production can no longer fulfill domestic demand. This figure thus shows that technology learning by itself is able to fulfill the growth in domestic demand for bioethanol in Indonesia only until 2015.
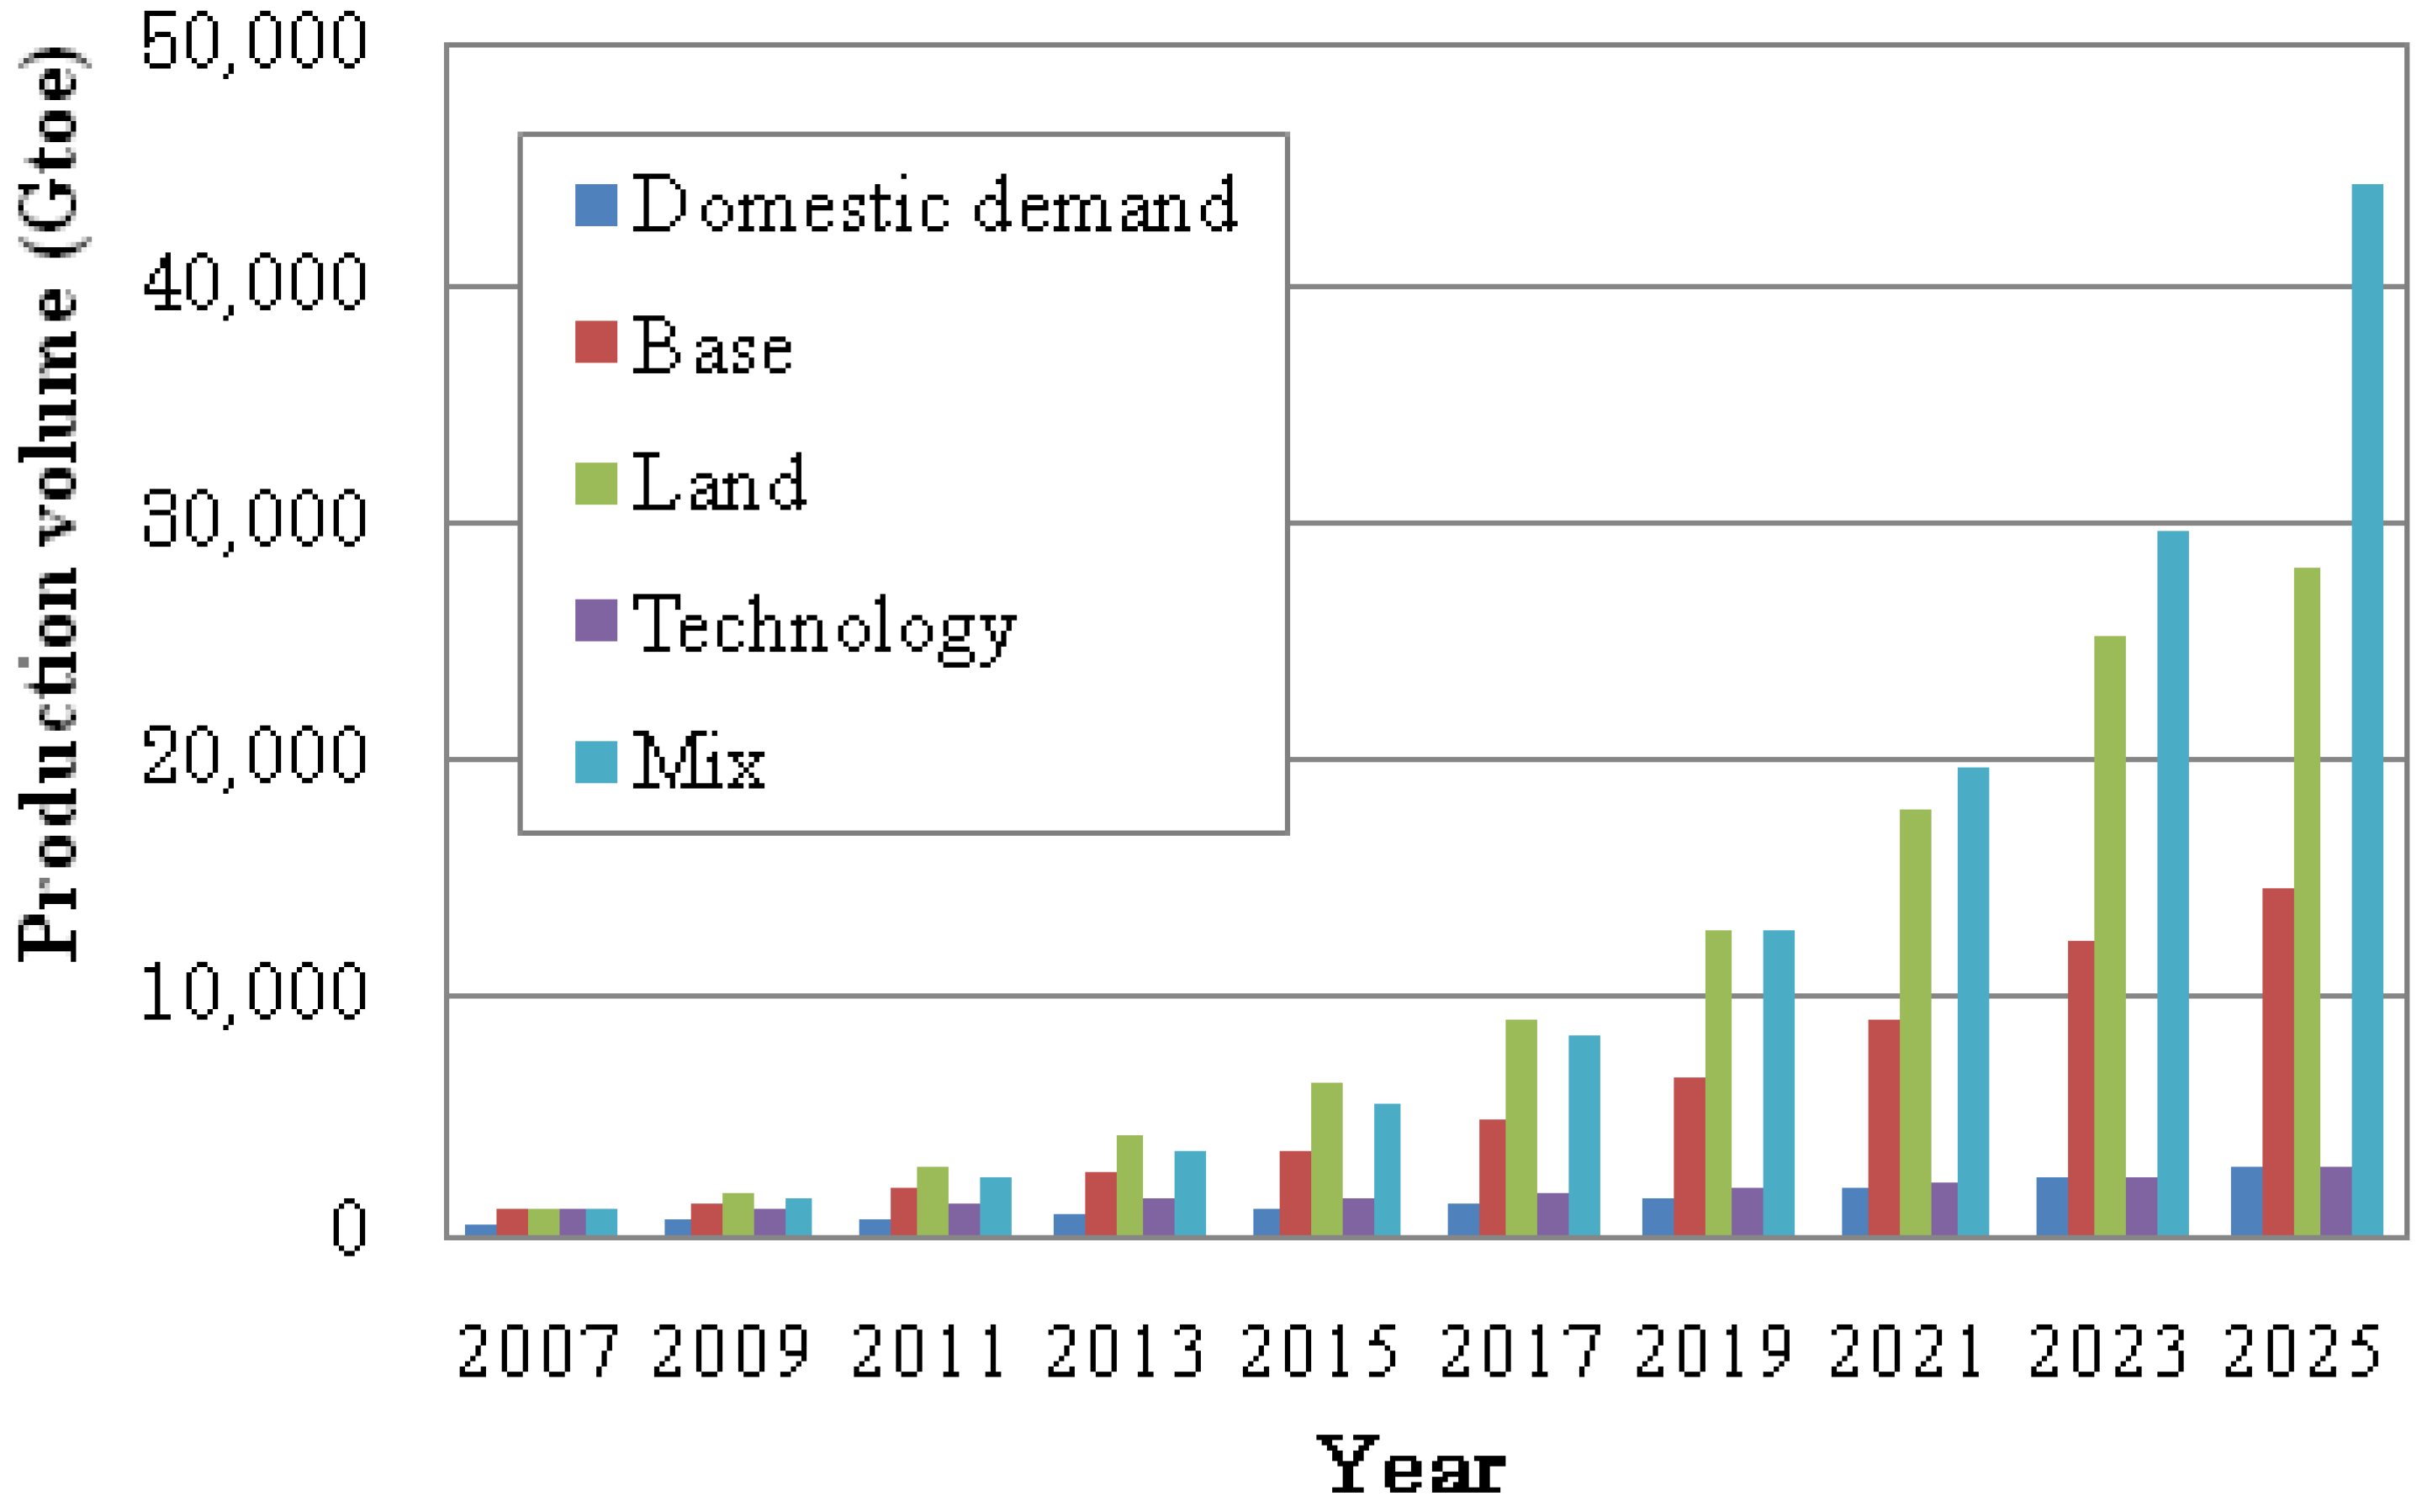
The volume of biodiesel production, as depicted in Figure 6, can exceed domestic demand in all but the ‘technology’ scenario. In this ‘technology’ scenario, the volume of biodiesel production exceeds domestic demand until 2023. In 2025, biodiesel production is predicted as 2,705 Gtoe, while domestic demand is 2,877 Gtoe. This figure shows that technology learning by itself is only able to fulfill the growth in domestic demand for biodiesel production in Indonesia until 2023.
Figure 5.
Volume of bioethanol production.
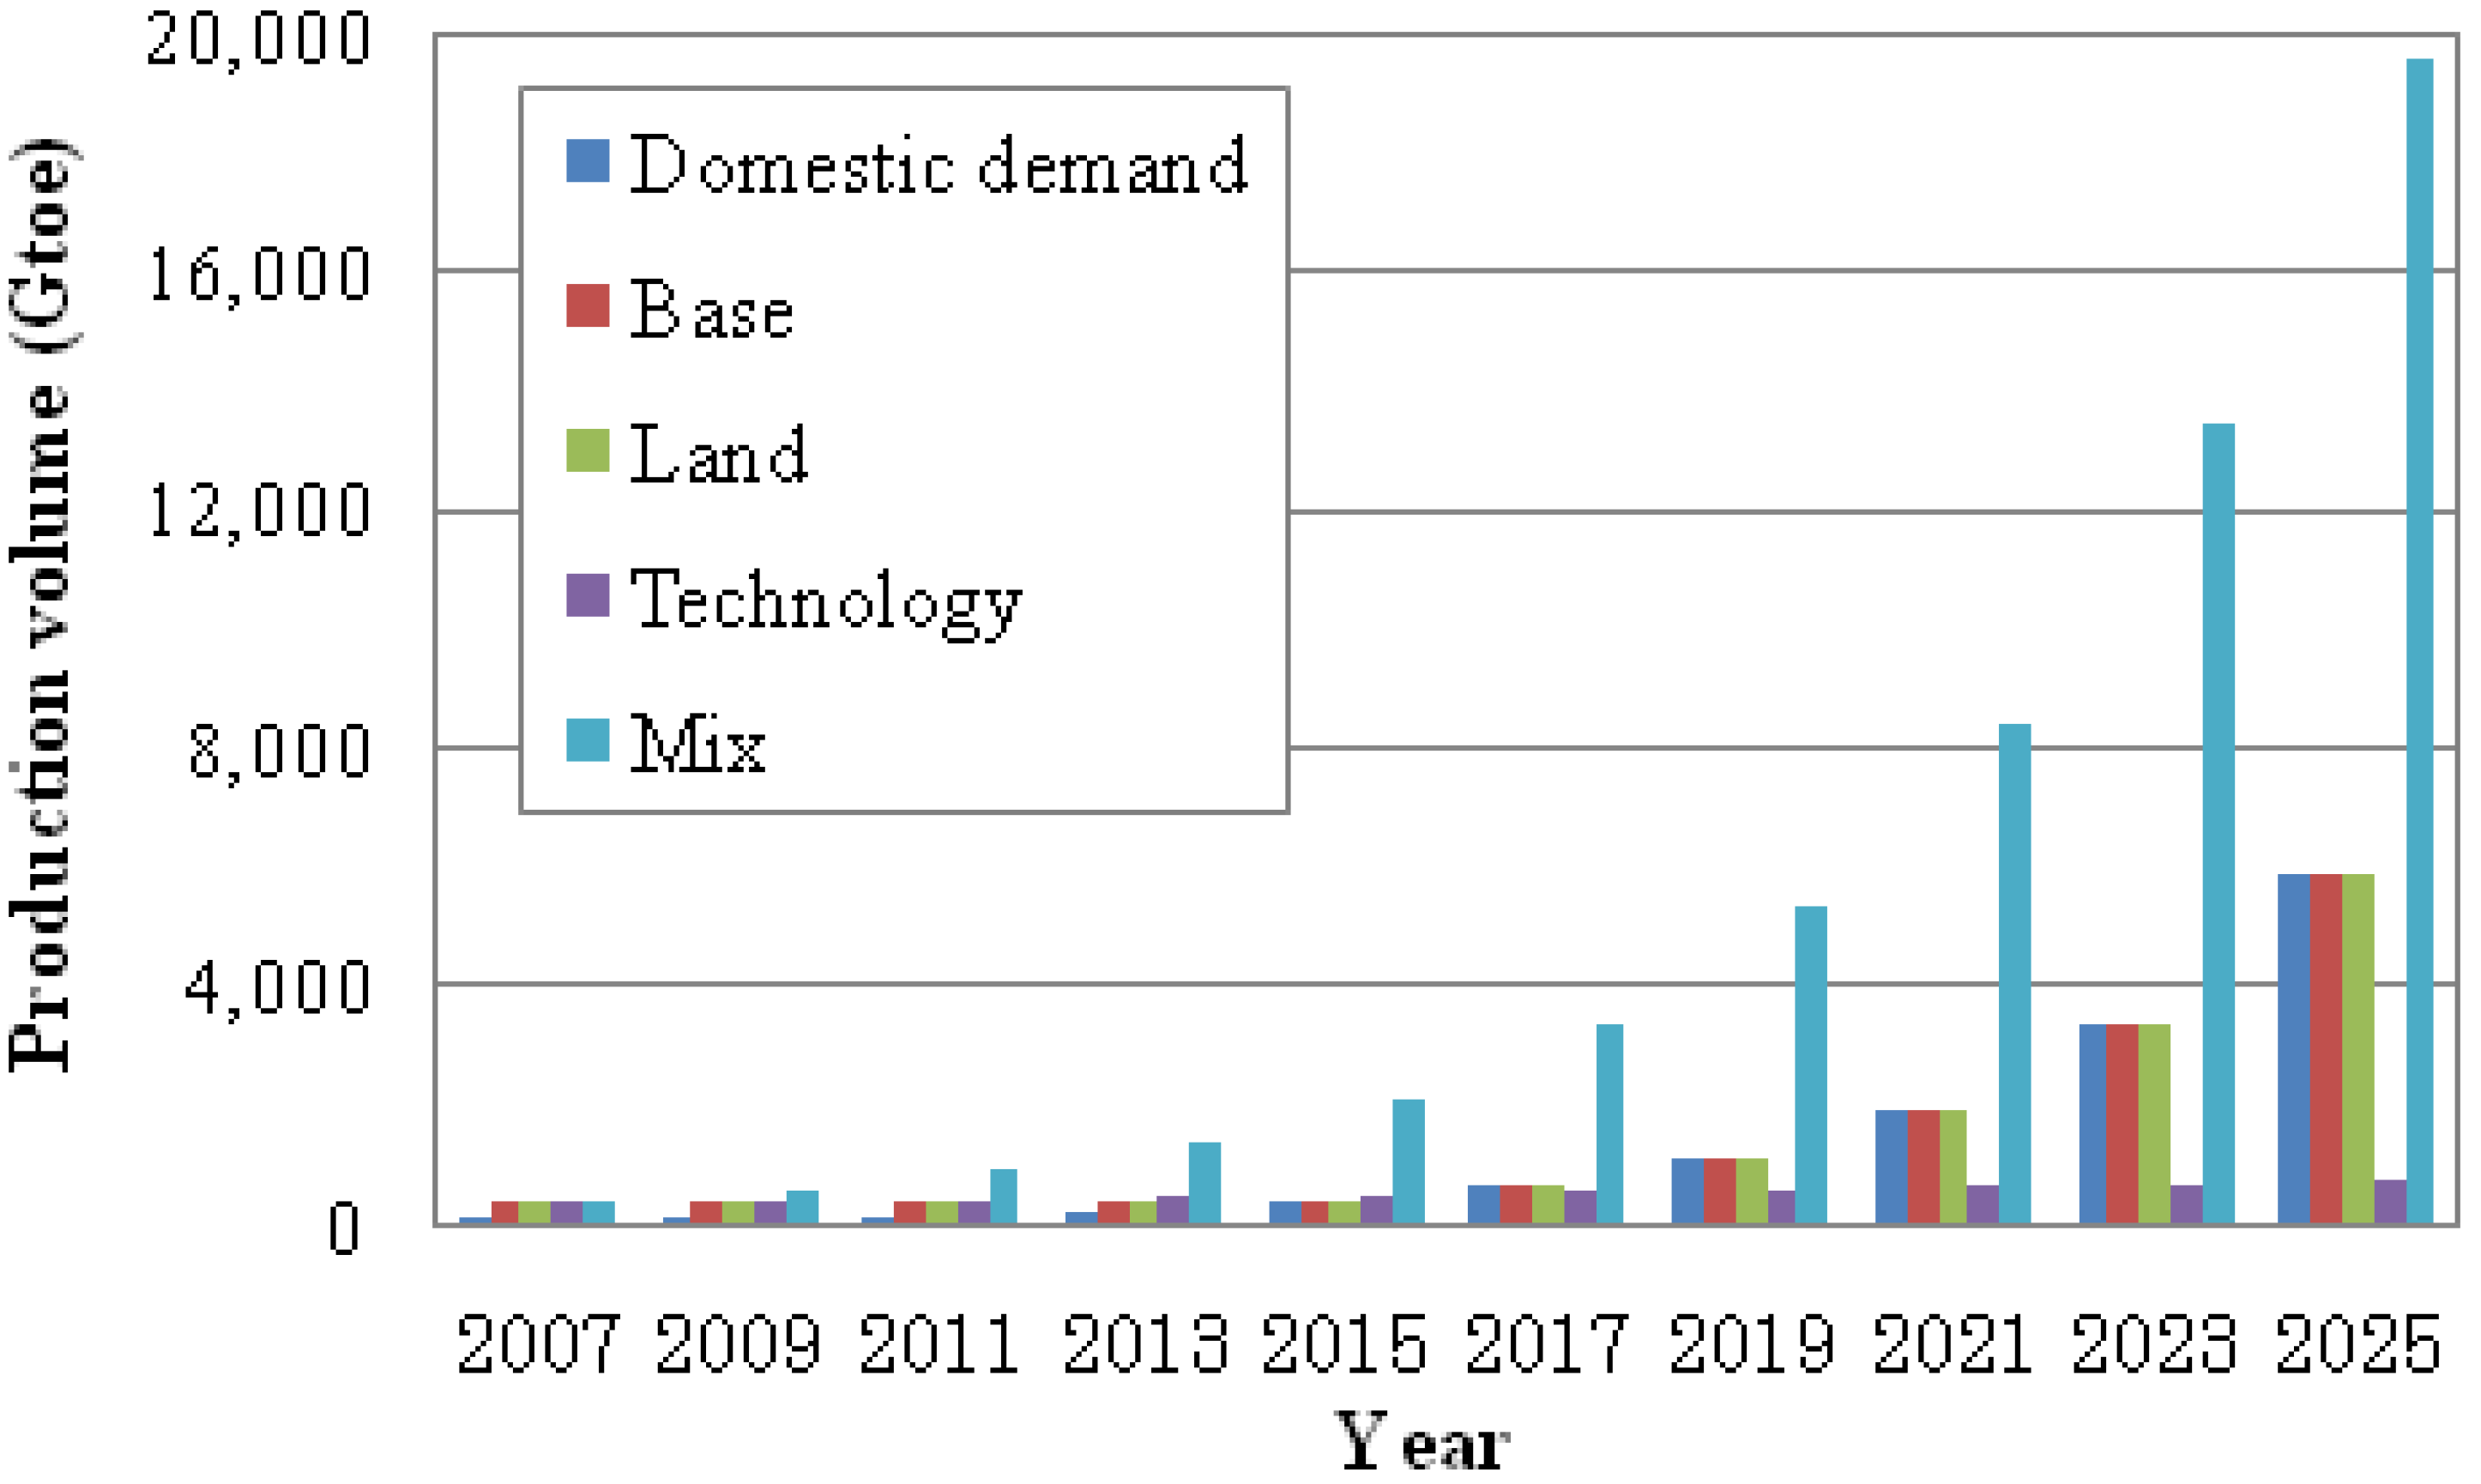
Figure 6.
Volume of biodiesel production.
4.2. Economic Impact Assessment
The main driving forces for the development of biofuel in Indonesia are imperatives toward: poverty alleviation by creating added value from existing local resources, empowerment of local communities by creating jobs, the saving of foreign reserves by the replacement of oil with biofuel, and income generation by the export of biofuel products. Based on the data used in Figure 5/Figure 6 and Table 2, at a range of oil prices of 60–90 USD/barrel, the replacement of oil with biofuel in the domestic transportation sector could save anywhere from 4.14 billion to 6.21 billion USD in 2025. Biofuel production can save up to 29 billion USD in oil consumption in 2025 if one combines both domestic and export/foreign demand. This equals 6.7% of the 2007 Indonesian GDP [4].
Figure 7 illustrates the total cost of biofuel production in all scenarios. Since profit is set here as a static function based on Equation 4, profit is calculated based on total production cost. The highest profit can be achieved in the ‘mix’ scenario, at 3.8 billion USD, and the lowest profit is gained in the ‘technology’ scenario at 190 million USD. The ratios of profit and the net energy balance in the ‘mix’ scenario over the ‘technology’ scenario are 20 and 18, respectively. The difference observed between these two scenarios is due to differences in the resources of crops for biofuel production. The profit from the ‘base’ and ‘land’ scenarios are 1.5 and 1.7 billion USD, respectively. However, in reality, the total production costs depend on the gricultural output and market conditions. While agricultural output depends on climate and season, the agricultural market depends on the global demand for products.
Figure 7.
Total production cost of biofuel.
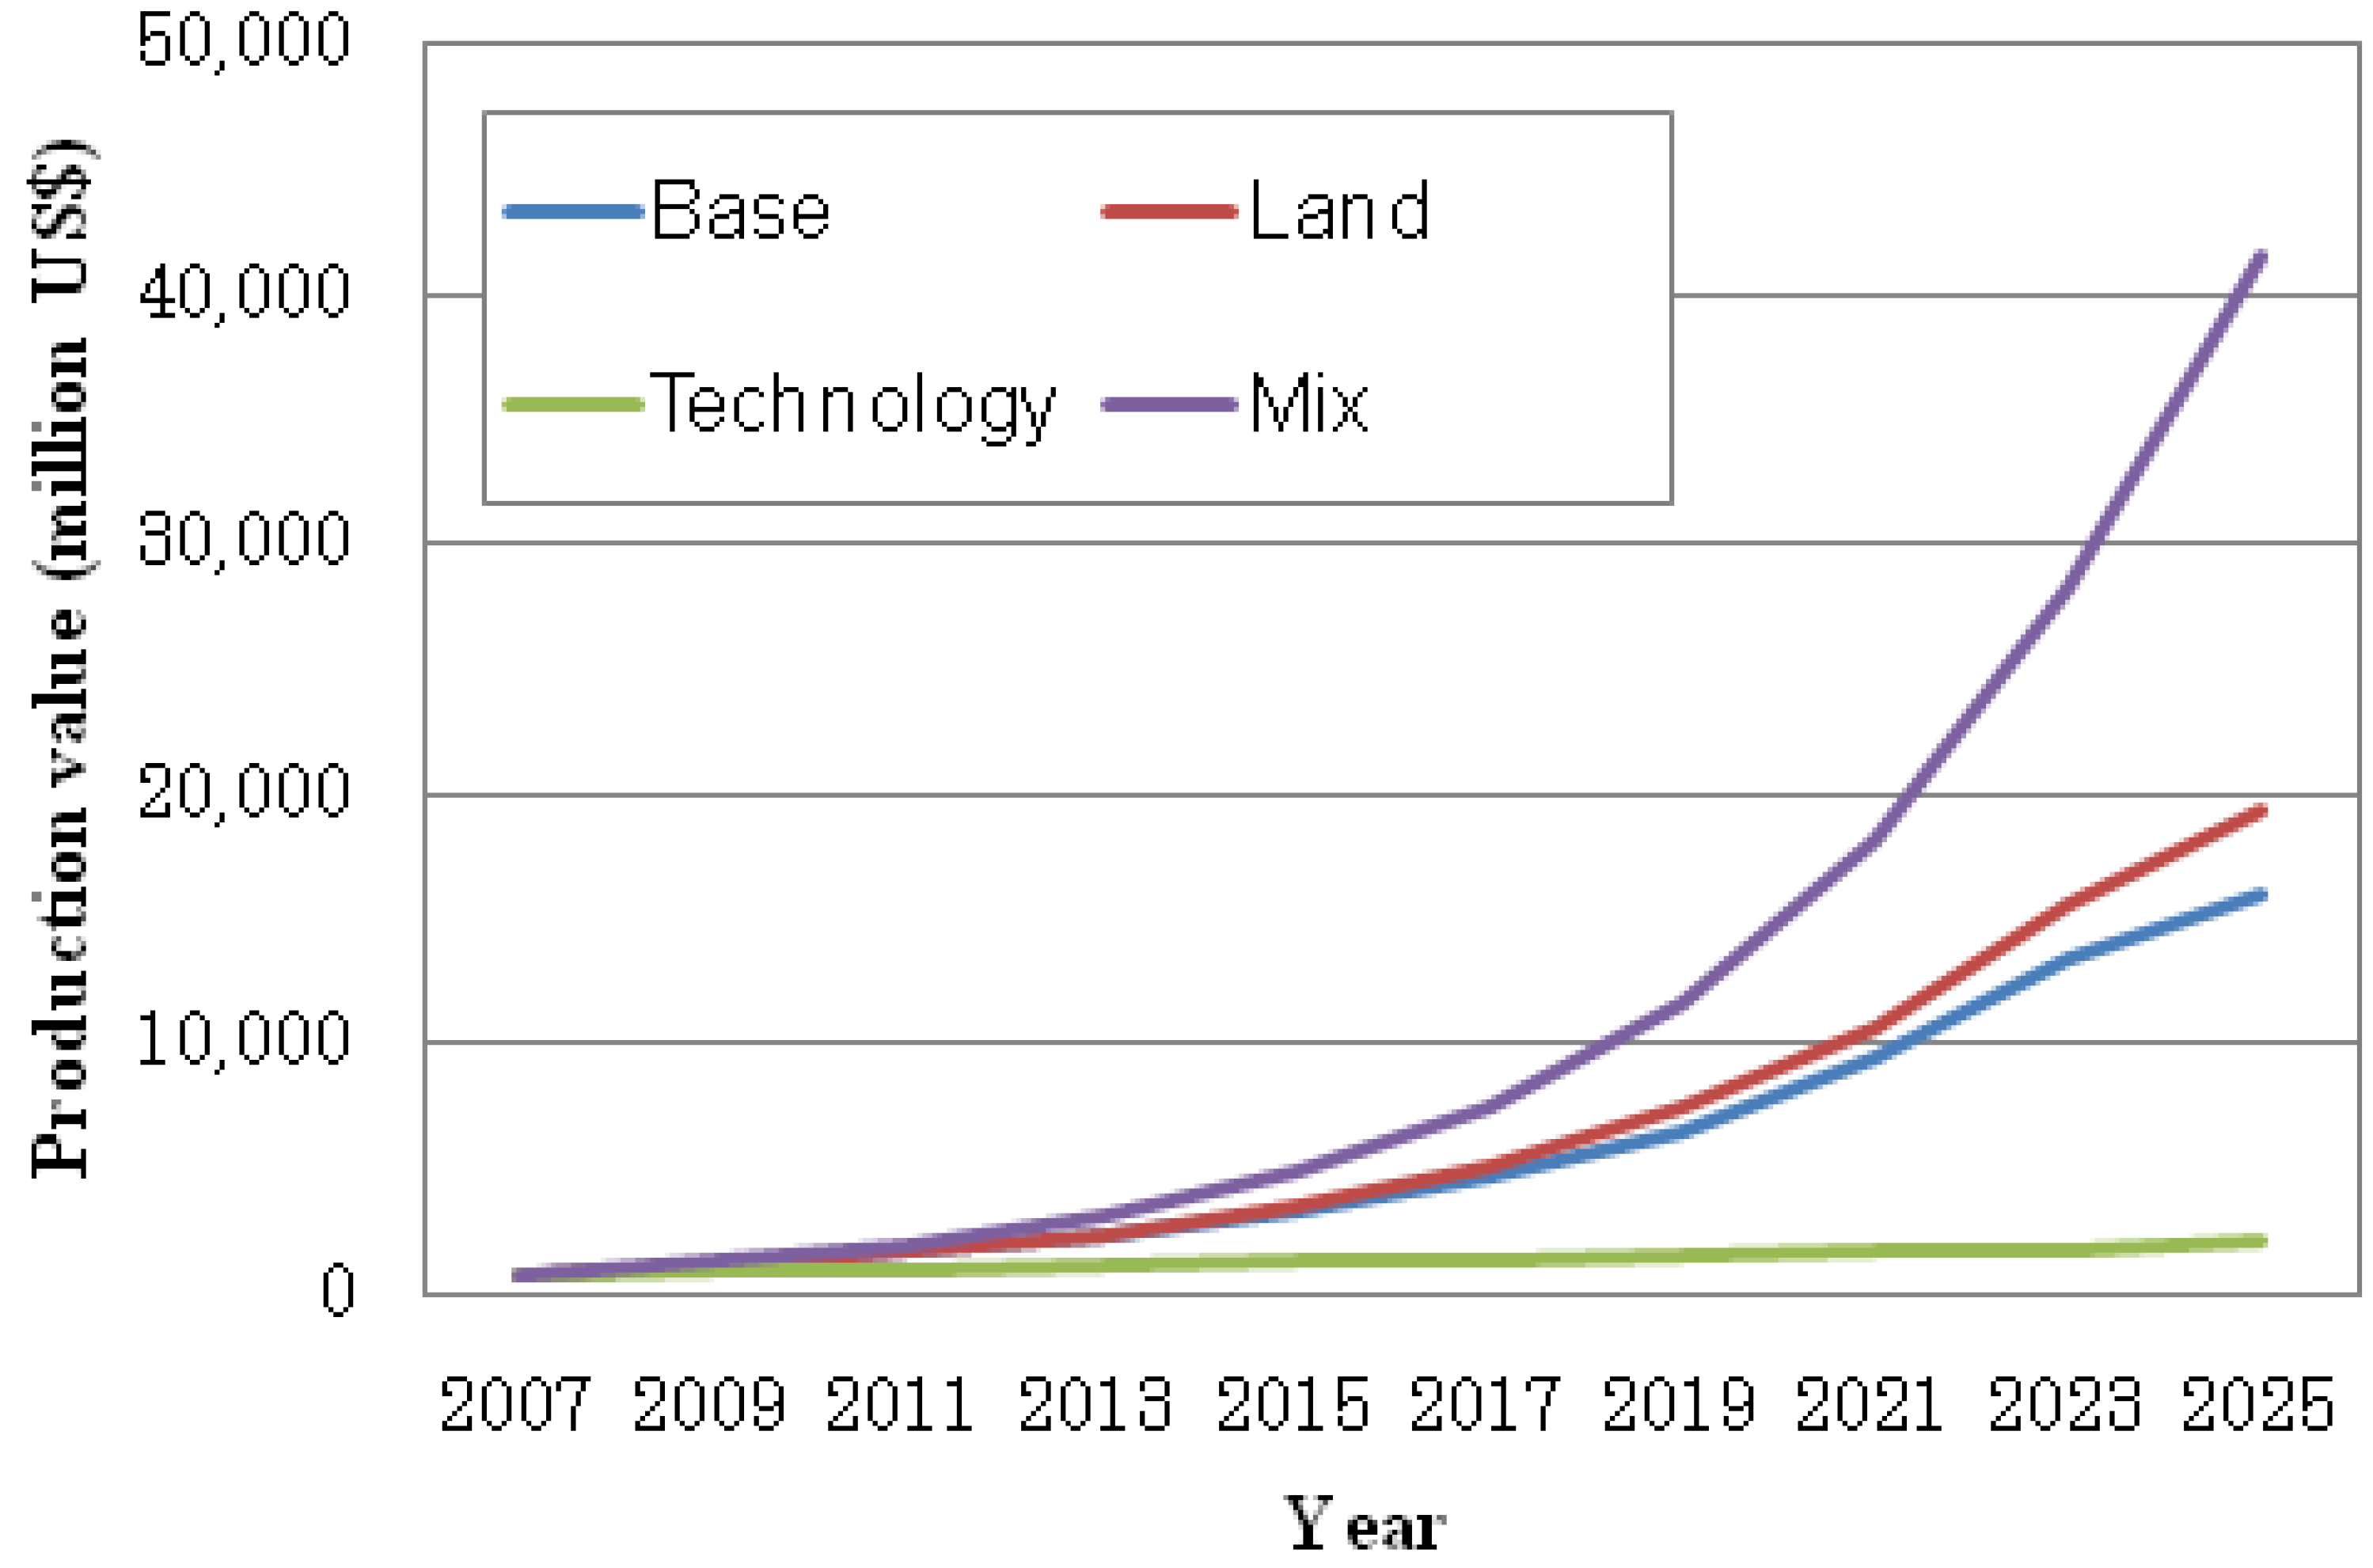
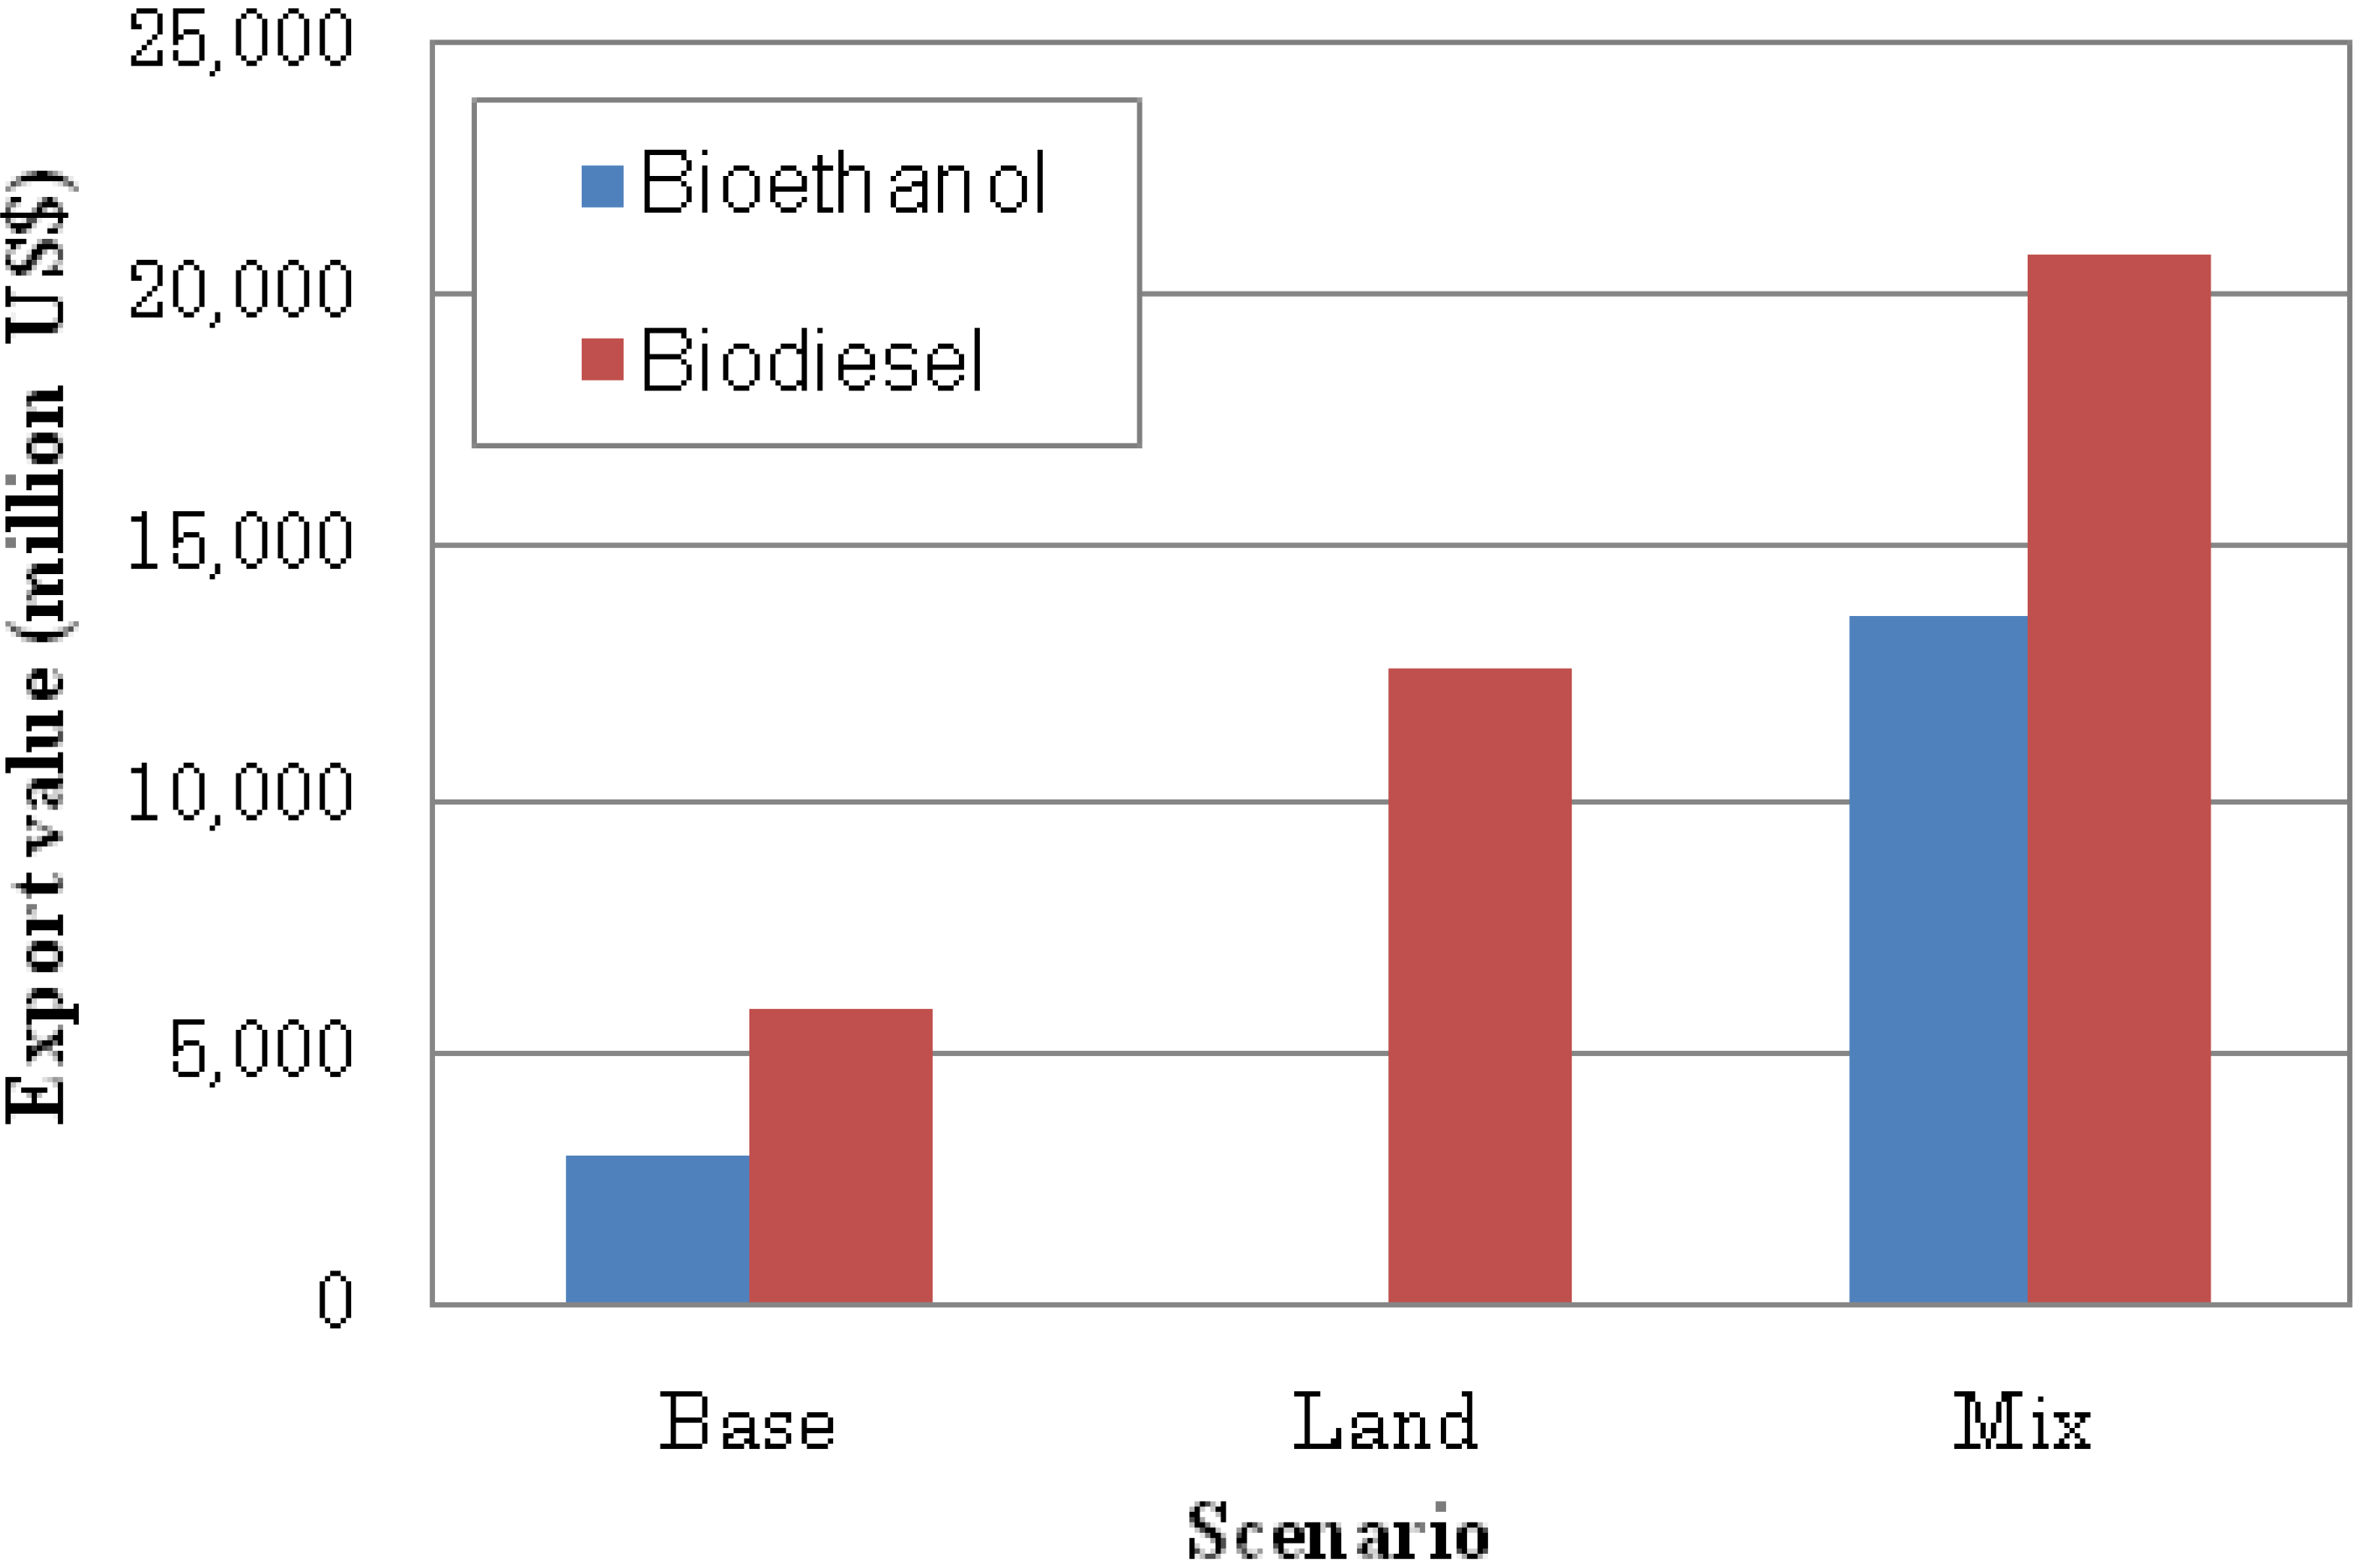
By export (2025), biofuel production could generate an income of up to 48 billion USD, depending on the scenario. Figure 8 presents the export value of biofuel products predicted in 2025 for three of the scenarios. As the ‘technology’ scenario cannot fulfill domestic demand, it also fails to create export value. The highest export values are achieved in the ‘mix’ scenario, at 14 and 21 billion USD for bioethanol and biodiesel, respectively. In the ‘land’ scenario, an export value of 13 billion USD is achieved by biodiesel alone, because bioethanol production is only sufficient to fulfill domestic demand and cannot contribute to export value. In the ‘base’ scenario, the values for the export of bioethanol and biodiesel are 3 and 6 billion USD, respectively.
Figure 8.
Biofuel export value in 2025.

Table 4 shows the labor requirement in all scenarios, in 2025. The highest labor requirement is in the ‘mix’ scenario, due to the expansion of production land and the growth in yield. In contrast, the ‘technology’ scenario shows the lowest labor requirement, because there is no land expansion, as this scenario only relies on the growth of yield in agricultural and industrial processes. The main contributor for the increment of labor requirement in the other scenarios is the expansion of allocated land, instead of the growth in yield.
| Scenario | Labor (people) |
|---|---|
| Base | 6,897,755 |
| Land | 6,941,960 |
| Technology | 343,205 |
| Mix | 7,140,516 |
4.3. Environment Impact Assessment
Beside the conflict of ‘land for food or fuel’, sustainability of biofuel production is also of concern in this study. This study looks at biofuel production while considering conservation and protection of natural resources. The extension of 0.5 to 10 ×106 hectares, between 2007 and 2025, in the ‘base’, ‘land’ and ‘mix’ scenarios, can be achieved mainly by allocating unutilized land, such as some parts of the Sumatera, Kalimantan, Sulawesi, and Papua islands, and from non-productive land, such as that of the Sumbawa and Lombok islands [2]. As a result, biofuel production could have a positive effect on the greenhouse gas emission balance, where the emission during biofuel production is less than the emission created by oil replaced by biofuel.
Nevertheless, the huge growth in demand for biofuel for the transportation sector may bring along negative consequences. The expansion of plantations for fuel crops has promoted land clearing by deforestation. The clearing of rainforest for oil palm plantations has been identified as the largest source of CO2 emission in Indonesia, according to Wetlands International [19]. Converting lowland tropical rainforest in Indonesia and Malaysia to palm plantations for biodiesel would result in a biofuel carbon debt of ~610 ton CO2/ha that could take ~86 years to repay [13]. Loss of biodiversity may also arise due to deforestation. The net emission balance from biofuel production could be drastically changed if the carbon debt due to deforestation is put into account. The other negative effects of biofuel production may be scarcity of water, nutrient run off due to monoculture, and haze from the forest fires [20]. Therefore, the development of biofuel production must account for concerns of sustainability.
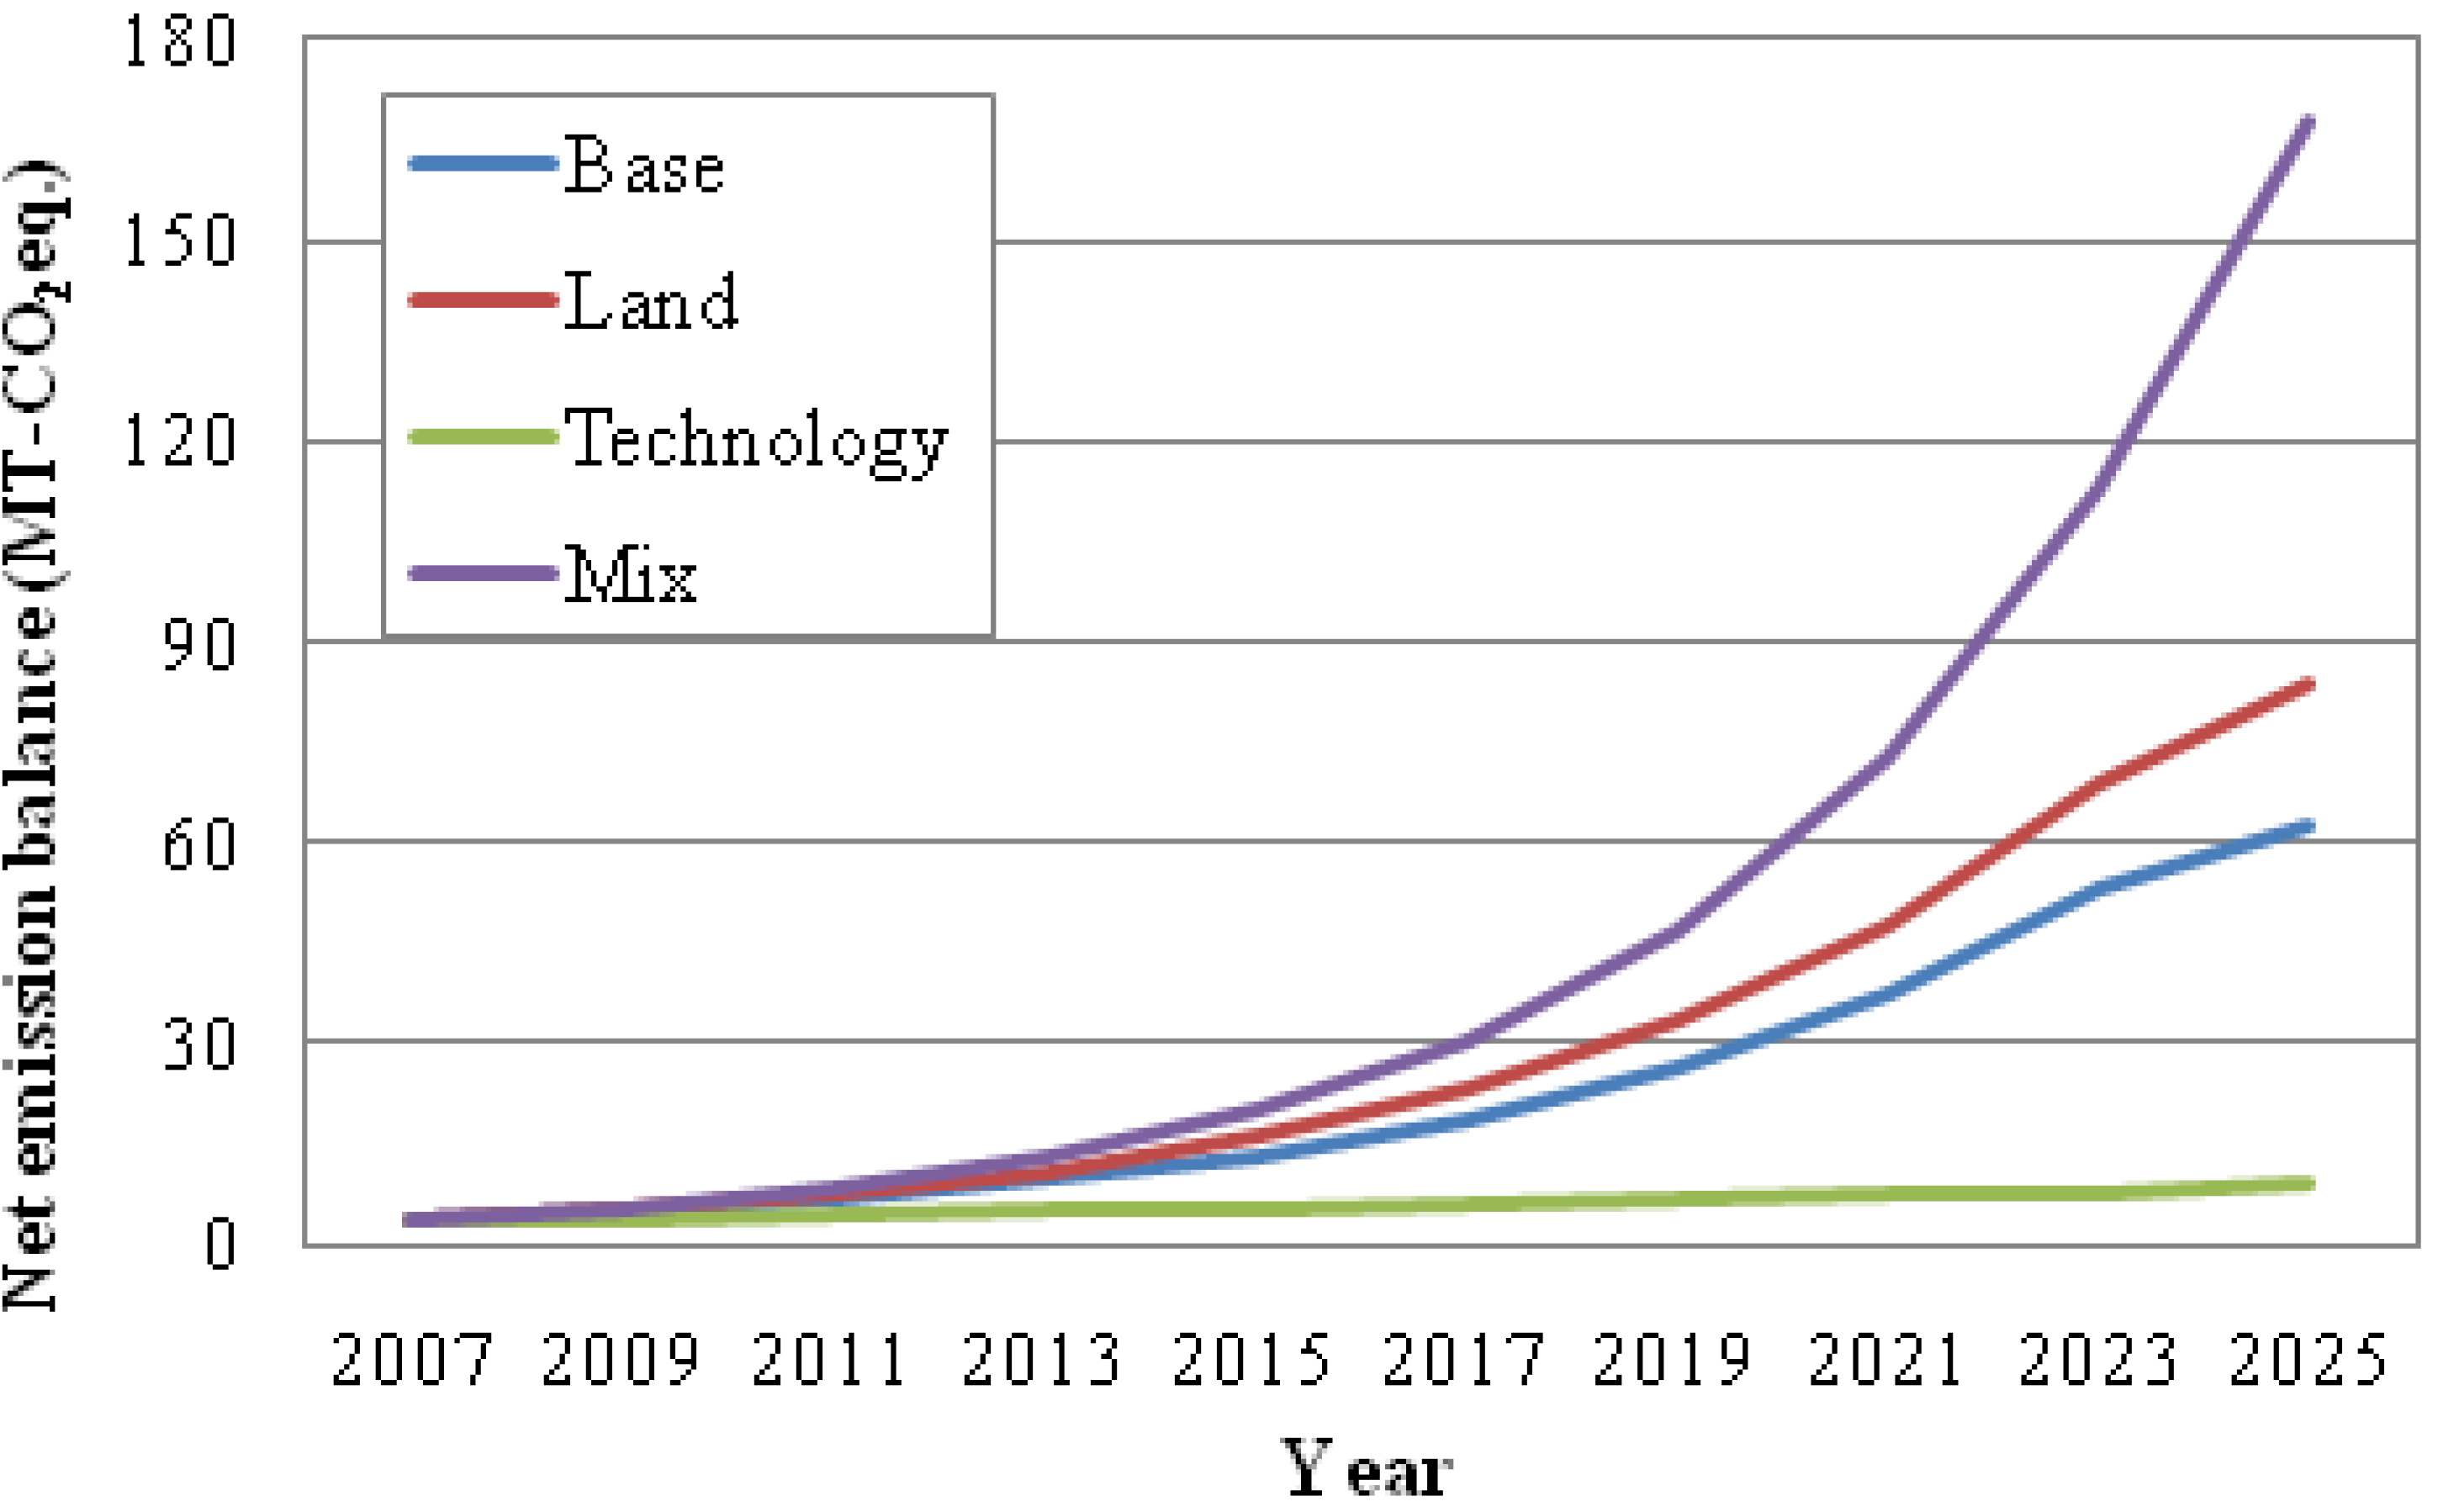
Figure 9 shows the net reductions in greenhouse gas emissions for all scenarios. Due to the higher output, the highest carbon savings are achieved in the ‘mix’ scenario, and amount to 4 × 10⁶ to 168 × 106 ton CO2 equivalents in 2007 and 2025, respectively. The other scenarios have much lower carbon savings effects, at percentages of (the ‘mix’ scenario equals 100%) 5, 28 and 50%, in the ‘technology’, ‘base’, and ‘land’ scenarios, respectively. The net emission balance in this study was measured based on the life cycle assessment (LCA) data from Table 2. Considering the different sources for the input data, the parameters that can be considered in this data also differ, as depicted in Table 5. Parameters, such as land use change (direct and indirect), N2O emission as a greenhouse gas, and the benefit gained from byproducts will influence the overall life cycle assessment.
Figure 9.
Net reductions in greenhouse gas emissions for the four scenarios.
4.4. Technology Assessment
The use of biofuels as transportation fuel has reasserted the links between energy and agricultural output markets. Biofuels have multiple benefits related to energy security and socioeconomic and climate protection. Biofuel, which is at present mainly used as an energy source for transportation, can improve the energy autonomy of an economy by reducing the dependency on oil and gas. The use of biofuel shows a fast growth, because it can curb greenhouse gas emissions by the substitution of fossil fuels. However, most of the crops used for biofuel production are originally grown for food consumption. Competition between crops for energy and food has resulted in increasing food prices. This situation is often referred to as the ‘food versus fuel’ dilemma [21]. To avoid this, there is intense pressure to strive for higher yields and minimize fossil fuel consumption during production through technology improvements.
One of the parameters used to measure how effective biofuel is in replacing fossil fuel, is the energy ratio, i.e., the ratio of energy contained in a biofuel, relative to the fossil fuel energy used for its production. The energy ratio for sugarcane ethanol is set at 4.9 in this study, while palm oil biodiesel has been set at a value of 3.6, for all scenarios. The value of the energy ratio varies from two to nine, depending on the biofuel crops analyzed [1]. Biofuel produced applying advanced technologies can provide a higher energy balance. Sugarcane processing technology has already been fully developed compared to palm oil processing for biofuel production. However, the net energy balance, which is the difference between energy output and energy input during production, has the highest value for palm oil compared to all other biofuel crops. Another problem that needs solving is balancing the supply and demand of crops for food and fuel purposes. This can be achieved by directing the excess supply for food into fuels, and vice versa.
Biofuel, at present, is produced in large quantities in other regions, such as the US, Brazil, and Western Europe. In the future, the restriction in the allocation of land and higher feedstock cost in these regions will shift the production of biofuel to other regions that have more land available and have lower feedstock cost, such as Indonesia, Malaysia, Thailand, etc. First generation biofuels have already reached a competitive price in some regions, due to economies of scale and technology learning, as in Brazil, where the price of bioethanol is 0.23 USD/L at an oil price 0.25 USD/L [14]. Second generation biofuels are produced from non-food materials, such as cellulosic biomass, wood, rice straw, and grass. Another non-food (third generation) biofuel source will be biofuel produced from algae. This type of biofuel will have even more advantages, as the yield of product is higher than that from first and second-generation technologies. Plant oils, such as palm oil and oil from Jatropha, can also be seen as alternative feed stocks for petroleum refineries to produce renewable diesel.
In addition, biofuel must compete with other energy resources and low carbon technologies, such as solar energy, wind and tidal power, newer atomic energies, hydrogen fuel cells, and hybrid engines. Later, second and third generation biofuel may be available on a large scale, offering much better perspectives and competitive fuel prices in the long term, between 2020 and 2030. It must be noted that in other countries, the introduction of biofuels in the transportation sector is done predominantly by means of subsidies and incentive policies.
In Indonesia, almost 98% of the energy used for the transportation sector is comprised of oil fuels. Thus, the use of biofuel would be preferred over that of fossil fuel. While gasoline consumption is higher than that of diesel fuel, it seems that the bioethanol will be produced only for domestic purposes, while biodiesel, besides fulfilling domestic demand, could have potential as an export commodity. Since biodiesel production requires crops for oil and alcohol, the demand for alcohol will increase as well. This should be considered in the development of biofuel in Indonesia.
In Indonesia, the government facilitates the development by assigning a million hectares land for plantations and by opening the sector for private and foreign investment. The opening of a plantation could provoke conflict between the plantation companies and the workers and local communities. The conflict with workers will be on labor rights, in particular, on wages and working conditions. Plantation development is likely to lead to changes in the ecosystem, which affect the communities over available water sources and biodiversity.
4.5. Limit of the Model
The complexity of bioenergy model building is undeniable. The uncertain cost of feedstock crops, the different yields due to land, water, and climate conditions, and the methodology of data collection are several aspects that influence the reliability of the outcome of models. A conflict between a model and reality is to be expected. In Indonesia, biofuel was first produced in 2006 and so far, there is no existing scientific data regarding biofuel life cycle assessment.
This model used different sources, which had used different methods, to collect input data. The energy input data are derived from different countries: Brazil for sugarcane, India for Jatropha, and Thailand for cassava and palm oil. The cost data are obtained from Thailand for sugarcane and cassava and Indonesia for palm oil and Jatropha. The emission data were obtained from Brazil, Thailand, Indonesia, and India for sugarcane, cassava, palm oil, and Jatropha, respectively.
The yield of the biofuel crops in these regions could be different from Indonesia’s biofuel crops, considering the different cultivation methods, land output, harvesting methods, production processes, plant capacities, and distribution channels. This model could yield more reliable results by using life cycle assessment from Indonesian crops and considering several other aspects: the ‘food and fuel conflict’, benefits gained from byproducts, land use change (direct and indirect), and deforestation and ecosystem change (due to biofuel development). The utilization of co-products as energy carriers, for example, will give greater savings of energy and greenhouse gas emissions. Nonetheless, this outcome of the model provides a direction regarding the optimum value for biofuel production, which is useful for the stakeholders to achieve the optimum results under land and technology constraints.
5. Conclusions
Based on the modeling results in this study, several conclusions can be drawn. In Indonesia, biofuels can:
- -
- reduce the dependency on oil by partially replacing the fuel demand for domestic transportation;
- -
- empower local communities by creating jobs in agriculture and the industrial sector;
- -
- generate income by exporting excess production;
- -
- and lead to positive carbon saving emissions.
For sustainability reasons, land allocation for biofuel must not lead to deforestation. This study is based on an increase in the growth of land allocated to biofuel production and technology development (yield growth) as dynamic functions to increase production. The outcome of the model is as follows:
- The maximum net energy balance is achieved in the ‘mix’ scenario, at 2.8 × 10³ PJ, and the minimum net energy balance is achieved in the ‘technology’ scenario at 155 PJ.
- The energy output in the ‘technology’ scenario, which relies on technology improvement without land expansion, can only fulfill domestic demand for bioethanol and biodiesel up to 2015 and 2023, respectively.
- The economic perspectives, at an oil price of 60 USD/barrel, are that replacement of oil by biofuel in domestic transportation could save 4.14 billion USD in 2025. In the combined export and domestic usage, biofuel could save up to 29 billion USD by 2025.
- In all scenarios, the highest export value of 34 billion USD in 2025 is achieved in the ‘mix’ scenario. The ‘technology’ scenario does not create export value in 2025, as it cannot even fulfill domestic demand. This indicates that technological development alone is able to fulfill the domestic demand up to 2023, and later on, will not able to generate income from export, starting from 2025.
- The introduction of biofuel in Indonesia could create around 7 × 10⁶ jobs in 2025, in all but the ‘technology’ scenario. The ‘technology’ scenario does not show a high increment in job creation as the creation in this scenario only relies on the yield of products and not on the labor created by increased allocation of land.
- Under sustainable production, a carbon saving could be achieved of up to 168 × 106 ton CO2 equivalent in 2025 in the ‘mix’ scenario. In the other scenarios, only 6%, 28%, and 50% of this value will be achieved in the ‘technology’, ‘base’, and ‘land’ scenarios, respectively.
- The production costs may decrease, due to economies of scale; the production output could increase due to technological development, leading to an increasing yield of products in agricultural and industrial processes.
- The development of biofuel production in Indonesia is still in its infancy. The potential of its development must be carefully assessed by considering all related parties: the biofuel industries, the workers, local communities, and government as policy makers. Involving the local communities by hiring and training local people to plant biofuel crops in as sustainable way and buying the crops from local farmers could be an option for the biofuel industry.
Nomenclature
| Sets | |
| i | Crops (1 = sugarcane, 2 = cassava, 3 = palm oil, 4 = Jatropha) |
| j | Supply (1 = food, 2 = fuel) |
| k | Fuels (1 = ethanol, 2 = biodiesel) |
| t | Period (0 = 2007,1 = 2009,…,9 = 2025) |
| Parameters | |
| C i Agr | Cost in agriculture sector of i crops (US$/L) |
| C i Ind | Cost in industry sector of i crops (US$/L) |
| D k, o Dom | Biofuel domestic demand of k fuel at 2007 (liters) |
| Em i Agr | Emission in agriculture sector of i crops (kgCO2eq/L) |
| Em i Ind | Emission in industrial sector of i crops (kgCO2eq/L) |
| Em i Avoid | Emission avoided of i crops (kgCO2eq/L) |
| En i Agr | Energy input agriculture of i crops (MJ/L) |
| En i Ind | Energy input industry of i crops (MJ/L) |
| En i Out | Energy output of i crops (MJ/L) |
| Eq k | Volume equivalent of k fuel with oil (toe/103L biofuel) |
| L i, o | Land allocation of i crops at 2007 (ha) |
| O i | Oil equivalent of i crops (toe) |
| Pi Agr | Labor in agriculture sector of i crops (person/ha) |
| Pi Ind | Labor in industrial sector of i crops (person/L) |
| Si,0 Food | Land share for food of i crops at 2007 |
| Si,0 Fuel | Land share for fuel of i crops at 2007 |
| Yi ,0 Agr | Yield of agriculture product of i crops at 2007 (t/ha) |
| Yi, 0, Ind | Yield of industrial product of i crops at 2007 (L/t) |
| dk Dom | Growth rate of domestic biofuel demand of k fuels (%) |
| ji Agr | Job in agriculture sector (person/ha) |
| jk Ind | Job in industrial sector (person/L) |
| li Food | Land allocation growth rate for food of i crops (%) |
| li Fuel | Land allocation growth rate for fuel of i crops (%) |
| ri Agr | Growth rate of agriculture product of i crops (%) |
| rk Ind | Growth rate of industrial product of k fuels (%) |
| Variables | |
| CB t | Total production cost at time t (US$) |
| D i,t Food | Food demand of i crops at time t (ton) |
| D k,t Dom | Fuel domestic demand of k fuel at time t (L) |
| D k,t Exp | Fuel export demand of k fuel at time t (L) |
| EB t | Total energy balance at time t (MJ) |
| EmB t | Total emission balance at time t (kg CO2Equation) |
| F i,t, | Fuel output of i crops at time t (L) |
| Ji,t | Total job created of i crops at time t (person) |
| L i,t Food | Land allocation for food of i crops at time t (ha) |
| L i,t Fuel | Land allocation for fuel of i crops at time t (ha) |
| Pt | Total profit at time t (US$) |
Acknowledgements
This paper has been presented with a grant by EPFL Lausanne, Switzerland at the EPFL-UNESCO International Scientific Conference on Technologies for Development in February 2010 at EPFL Lausanne, Switzerland. The author expresses his thanks to the valuable discussions with Prof. Hisa Morisugi and Prof. Yoshihito Shigeno. This study was done at the Department of Management Science and Technology, Tohoku University-Japan, with financial support from the Japan Government.
References
- The State of Food and Agriculture, Biofuels: Prospects, Risks and Opportunities; FAO: Rome, Italy, 2008.
- National Team for Biofuel Development. Blueprint Biofuel Development for Poverty Alleviation and Job Creation; Indonesia Ministry of Energy and Mineral Resources: Jakarta, Indonesia, 2006. [Google Scholar]
- Creating Value for All: Strategies for Doing Business with the Poor; United Nations: New York, NY, USA, 2008.
- Indonesia: Economic and Social update April 2008; The World Bank: Washington, DC, USA, 2008.
- Handbook of Energy and Economic Statistic of Indonesia 2009; Indonesia Ministry of Energy and Mineral Resources: Jakarta, Indonesia, 2009.
- Reuter, A.; Voss, A. Tools for energy planning in developing countries. Energy 1990, 15, 705–714. [Google Scholar] [CrossRef]
- Brooke, A.; Kendrick, D.; Meeraus, A.; Raman, R. GAMS Release 23.1. A User’s Guide; GAMS Development Corp.: Washington, DC, USA, 2008. [Google Scholar]
- Macedo, I.C.; Seabra, J.E.A.; Silva, J.E.A.R. Greenhouse gases emissions in the production and use of ethanol from sugarcane in Brazil: The 2005/2006 averages and a prediction for 2020. Biomass Bioenerg. 2008, 32, 582–595. [Google Scholar] [CrossRef]
- Nguyen, T.L.T.; Gheewala, S.H.; Garivait, S. Energy balance and GHG-abatement cost of cassava utilization for fuel ethanol in Thailand. Energ. Policy 2007, 35, 4585–4596. [Google Scholar]
- Pleanjai, S.; Gheewala, S.H. Full chain energy analysis of biodiesel production from palm oil in Thailand. Appl. Energ. 2009, 86, S209–S214. [Google Scholar]
- Reindhardt, G.; Gaertner, S.; Rettenmaier, N.; Muench, J.; von Falkenstein, E. Screening Life Cycle Assessmnet of Jathropha Biodiesel; Institute for Energy and Environmental Research (IFEU): Heidelberg, Germany, 2007. [Google Scholar]
- The Future of Liquid Biofuels for APEC Economies; APEC: Singapore, 2008.
- Fargione, J.; Hill, J.; Tilman, D.; Polasky, S.; Hawthorne, P. Land clearing and the biofuel carbon debt. Science 2008, 319, 1235–1238. [Google Scholar] [CrossRef]
- Coelho, S.T.; Goldemberg, J.; Lucon, O.; Guardabassi, P. Brazilian sugarcane ethanol: Lessons learned. Energy Sustain. Dev. 2006, 10, 26–39. [Google Scholar] [CrossRef]
- Moreira, J.R.; Goldemberg, J. The alcohol program. Energ. Policy 1999, 27, 229–245. [Google Scholar] [CrossRef]
- Handbook of Energy and Economic Statistic of Indonesia 2008; Indonesia Ministry of Energy and Mineral Resources: Jakarta, Indonesia, 2008.
- ORNL Bioenergy Conversion. Available online: http://bioenergy.ornl.gov/papers/misc/energy_conv.html (accessed on 12 November 2009).
- Junginger, M.; de Visser, E.; Hjort-Gregersen, K.; Koornneef, J.; Raven, R.; Faaij, A.; Turkenburg, W. Technological learning in bioenergy systems. Energ. Policy 2006, 34, 4024–4041. [Google Scholar] [CrossRef]
- Wetland International Central Kalimantan Peatland Project. Available online: http://www.wetlands.org/ (accessed on 14 November 2009).
- Zhou, A.; Thomson, E. The development of biofuels in Asia. Appl. Energ. 2009, 86, S11–S20. [Google Scholar] [CrossRef]
- OECD-FAO. Agricultural Outlook 2008–2017; OECD, FAO: Paris, France; Rome, Italy, 2008. [Google Scholar]
© 2010 by the authors; licensee MDPI, Basel, Switzerland. This article is an Open Access article distributed under the terms and conditions of the Creative Commons Attribution license (http://creativecommons.org/licenses/by/3.0/).
Share and Cite
MDPI and ACS Style
Jupesta, J. Impact of the Introduction of Biofuel in the Transportation Sector in Indonesia. Sustainability 2010, 2, 1831-1848. https://doi.org/10.3390/su2061831
AMA Style
Jupesta J. Impact of the Introduction of Biofuel in the Transportation Sector in Indonesia. Sustainability. 2010; 2(6):1831-1848. https://doi.org/10.3390/su2061831
Chicago/Turabian StyleJupesta, Joni. 2010. "Impact of the Introduction of Biofuel in the Transportation Sector in Indonesia" Sustainability 2, no. 6: 1831-1848. https://doi.org/10.3390/su2061831