Delineation of Suitable Cropland Areas Using a GIS Based Multi-Criteria Evaluation Approach in the Tam Dao National Park Region, Vietnam

Abstract
:1. Introduction
2. Methods
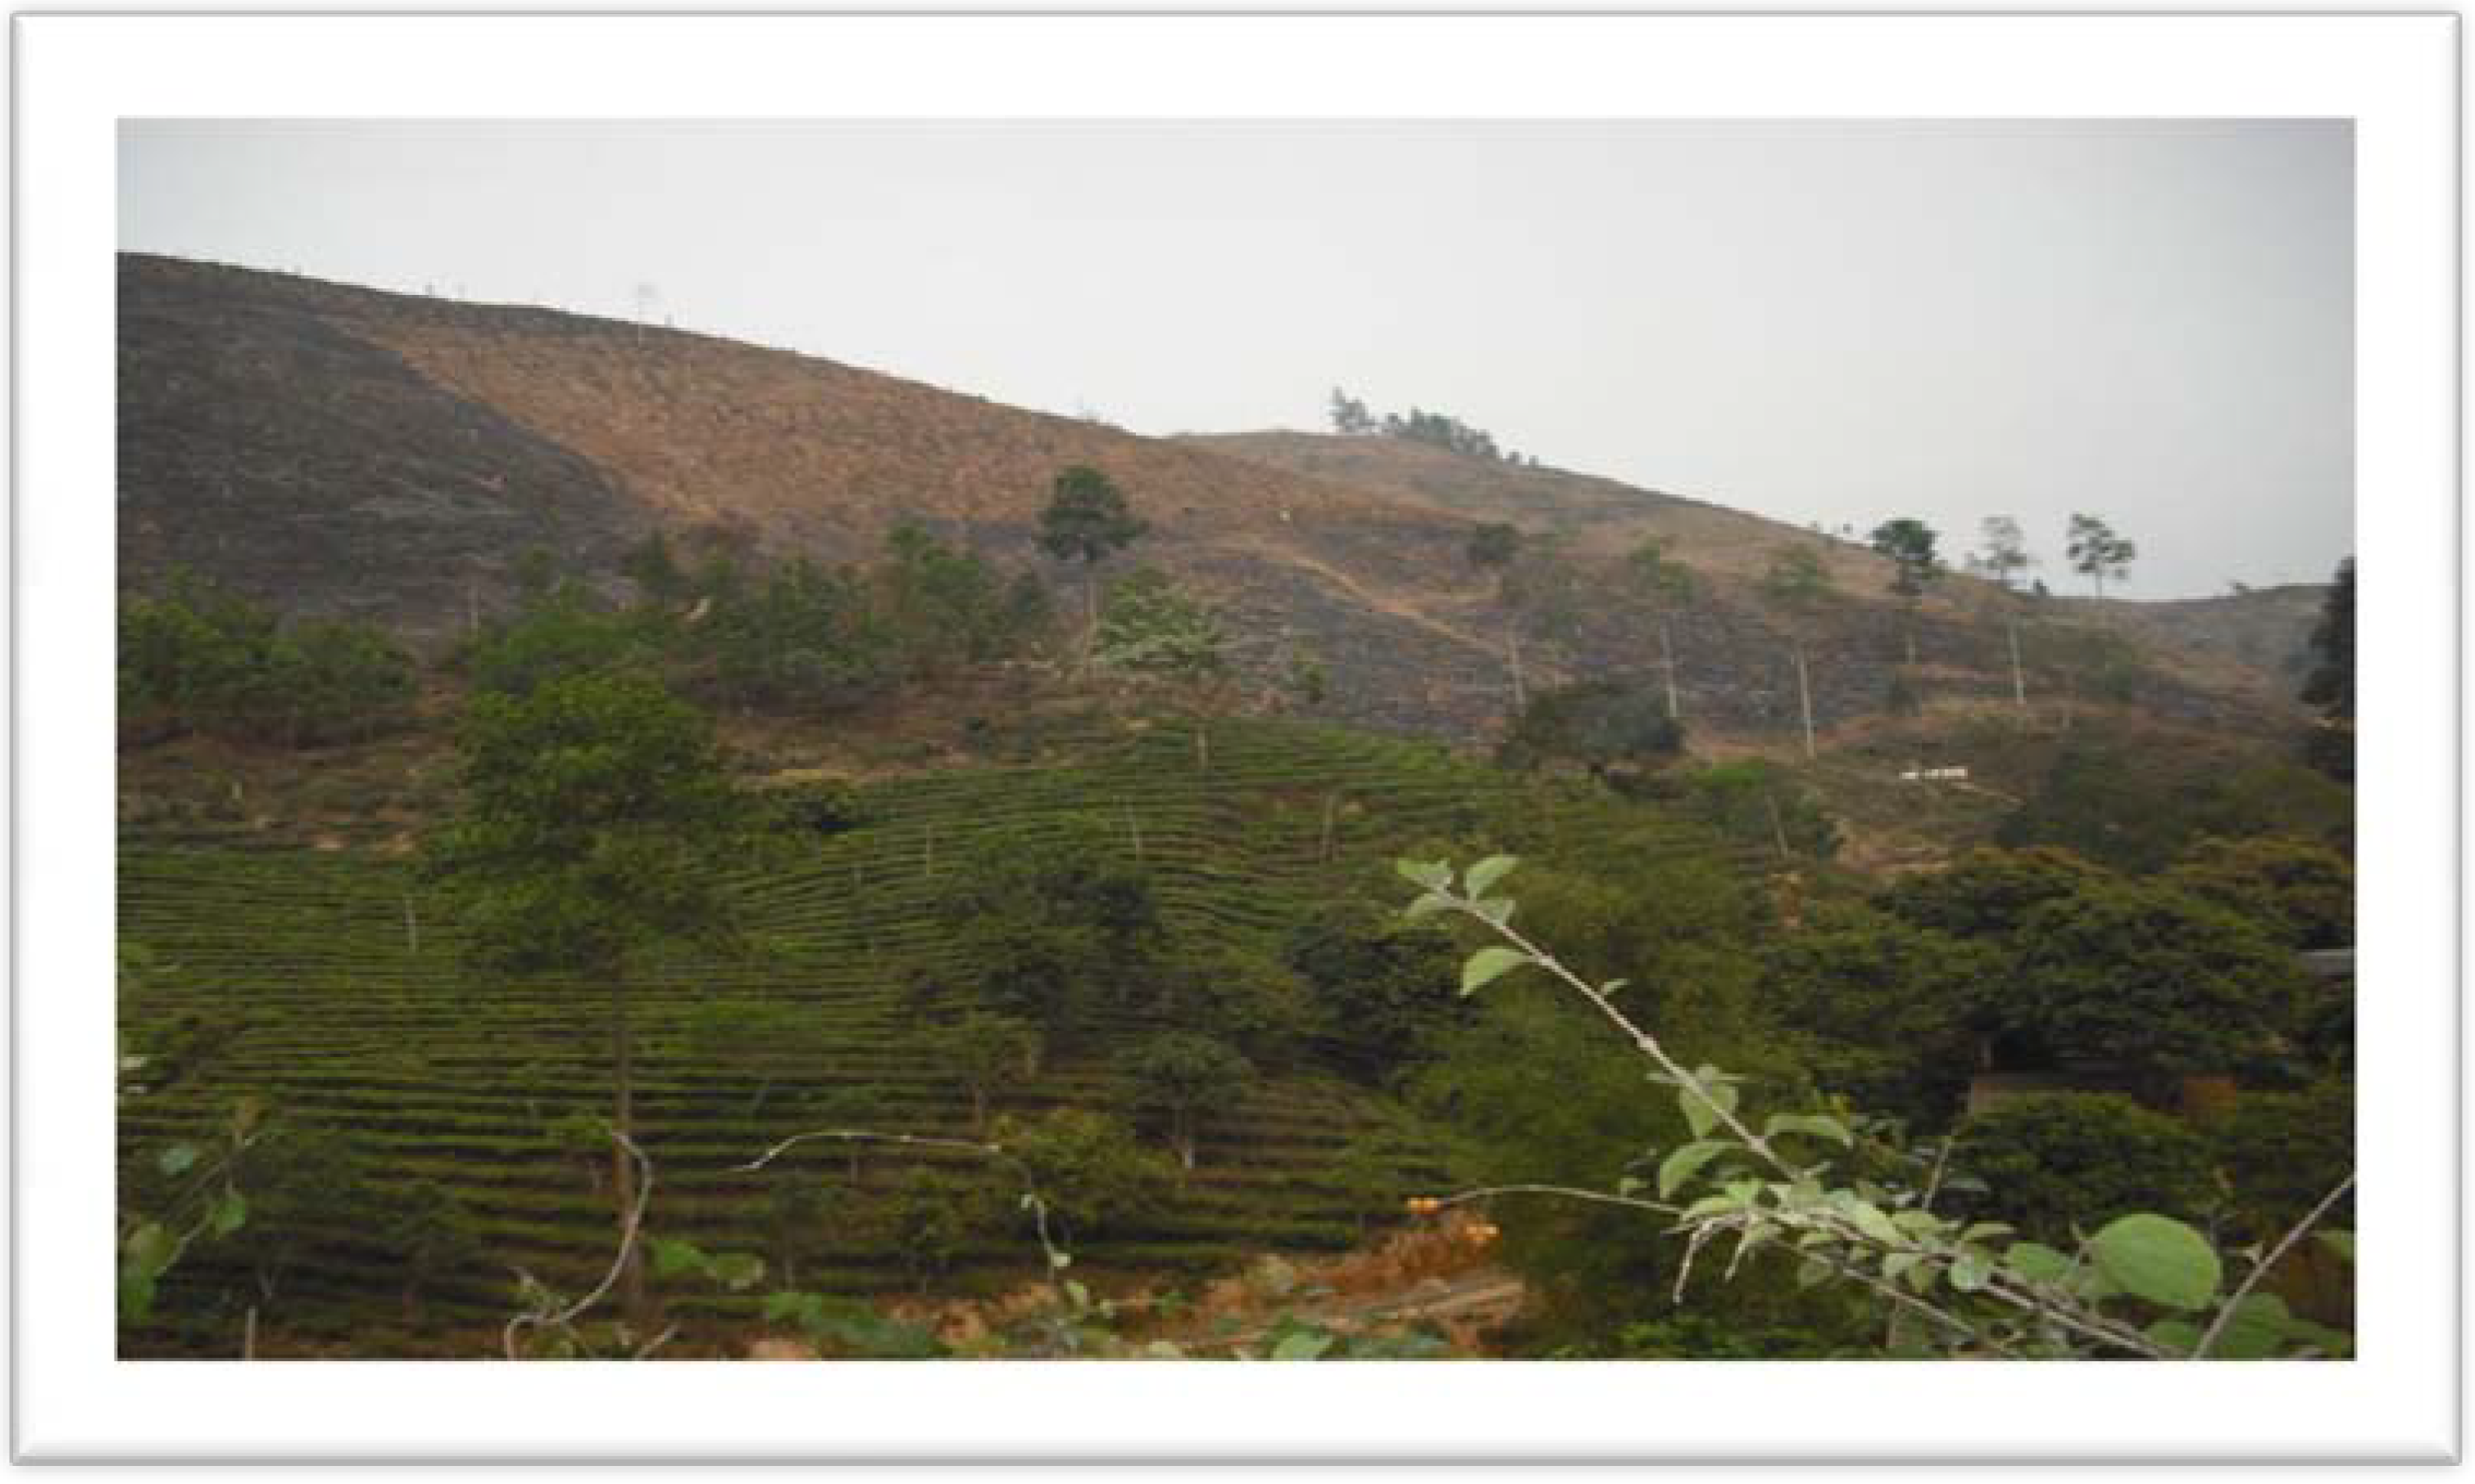
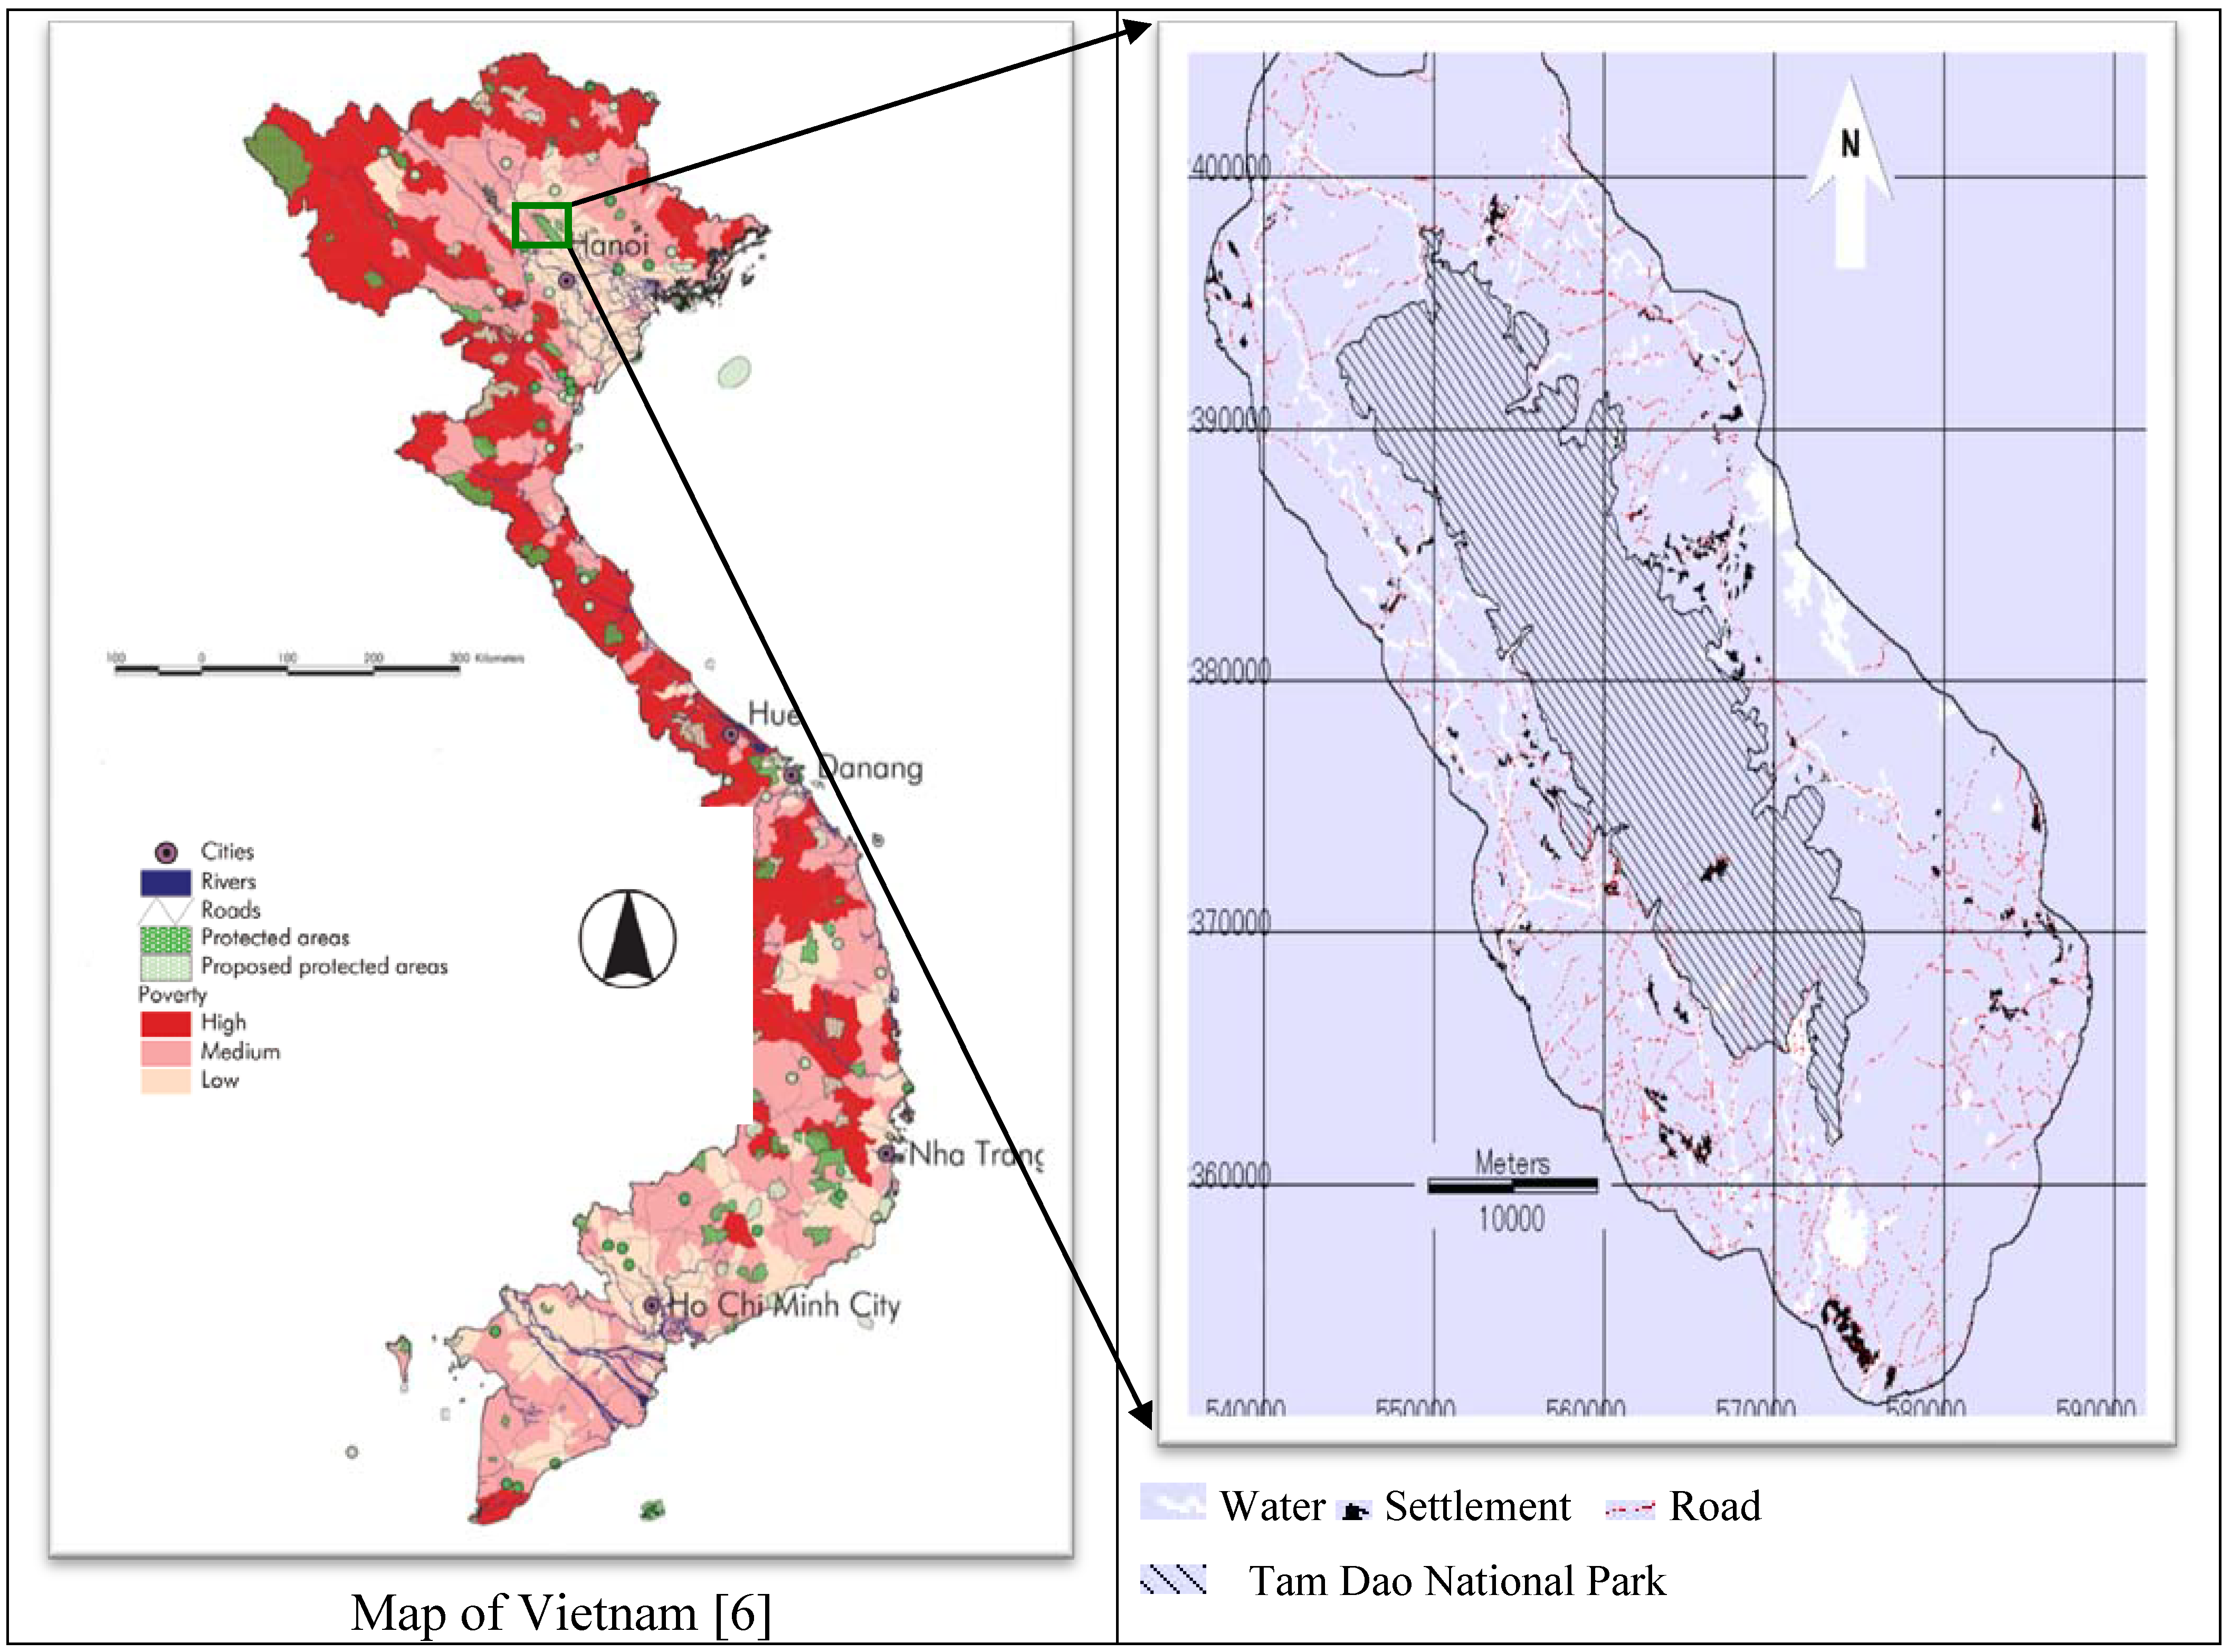
2.1. Study Area

2.2. Input Data and Landsat Image Processing

| Data types | Year | Scale/resolution | Sources |
|---|---|---|---|
| Topographical map | 1972 | 1:50,000 | TDNP Management Office |
| Soil map | 2005 | 1:100,000 | National Institute for Agricultural Planning, Ministry of Agriculture and Rural Development and TDNP Management Office |
| Road network | 2007 | - | TDNP Management Office |
| Water bodies | 2007 | - | TDNP Management Office |
| Park boundary | 2007 | - | TDNP Management Office |
| Landsat images | 2007 | 28.5 meters | University of Maryland |
| Field survey | 2009.3 | - | TDNP region |
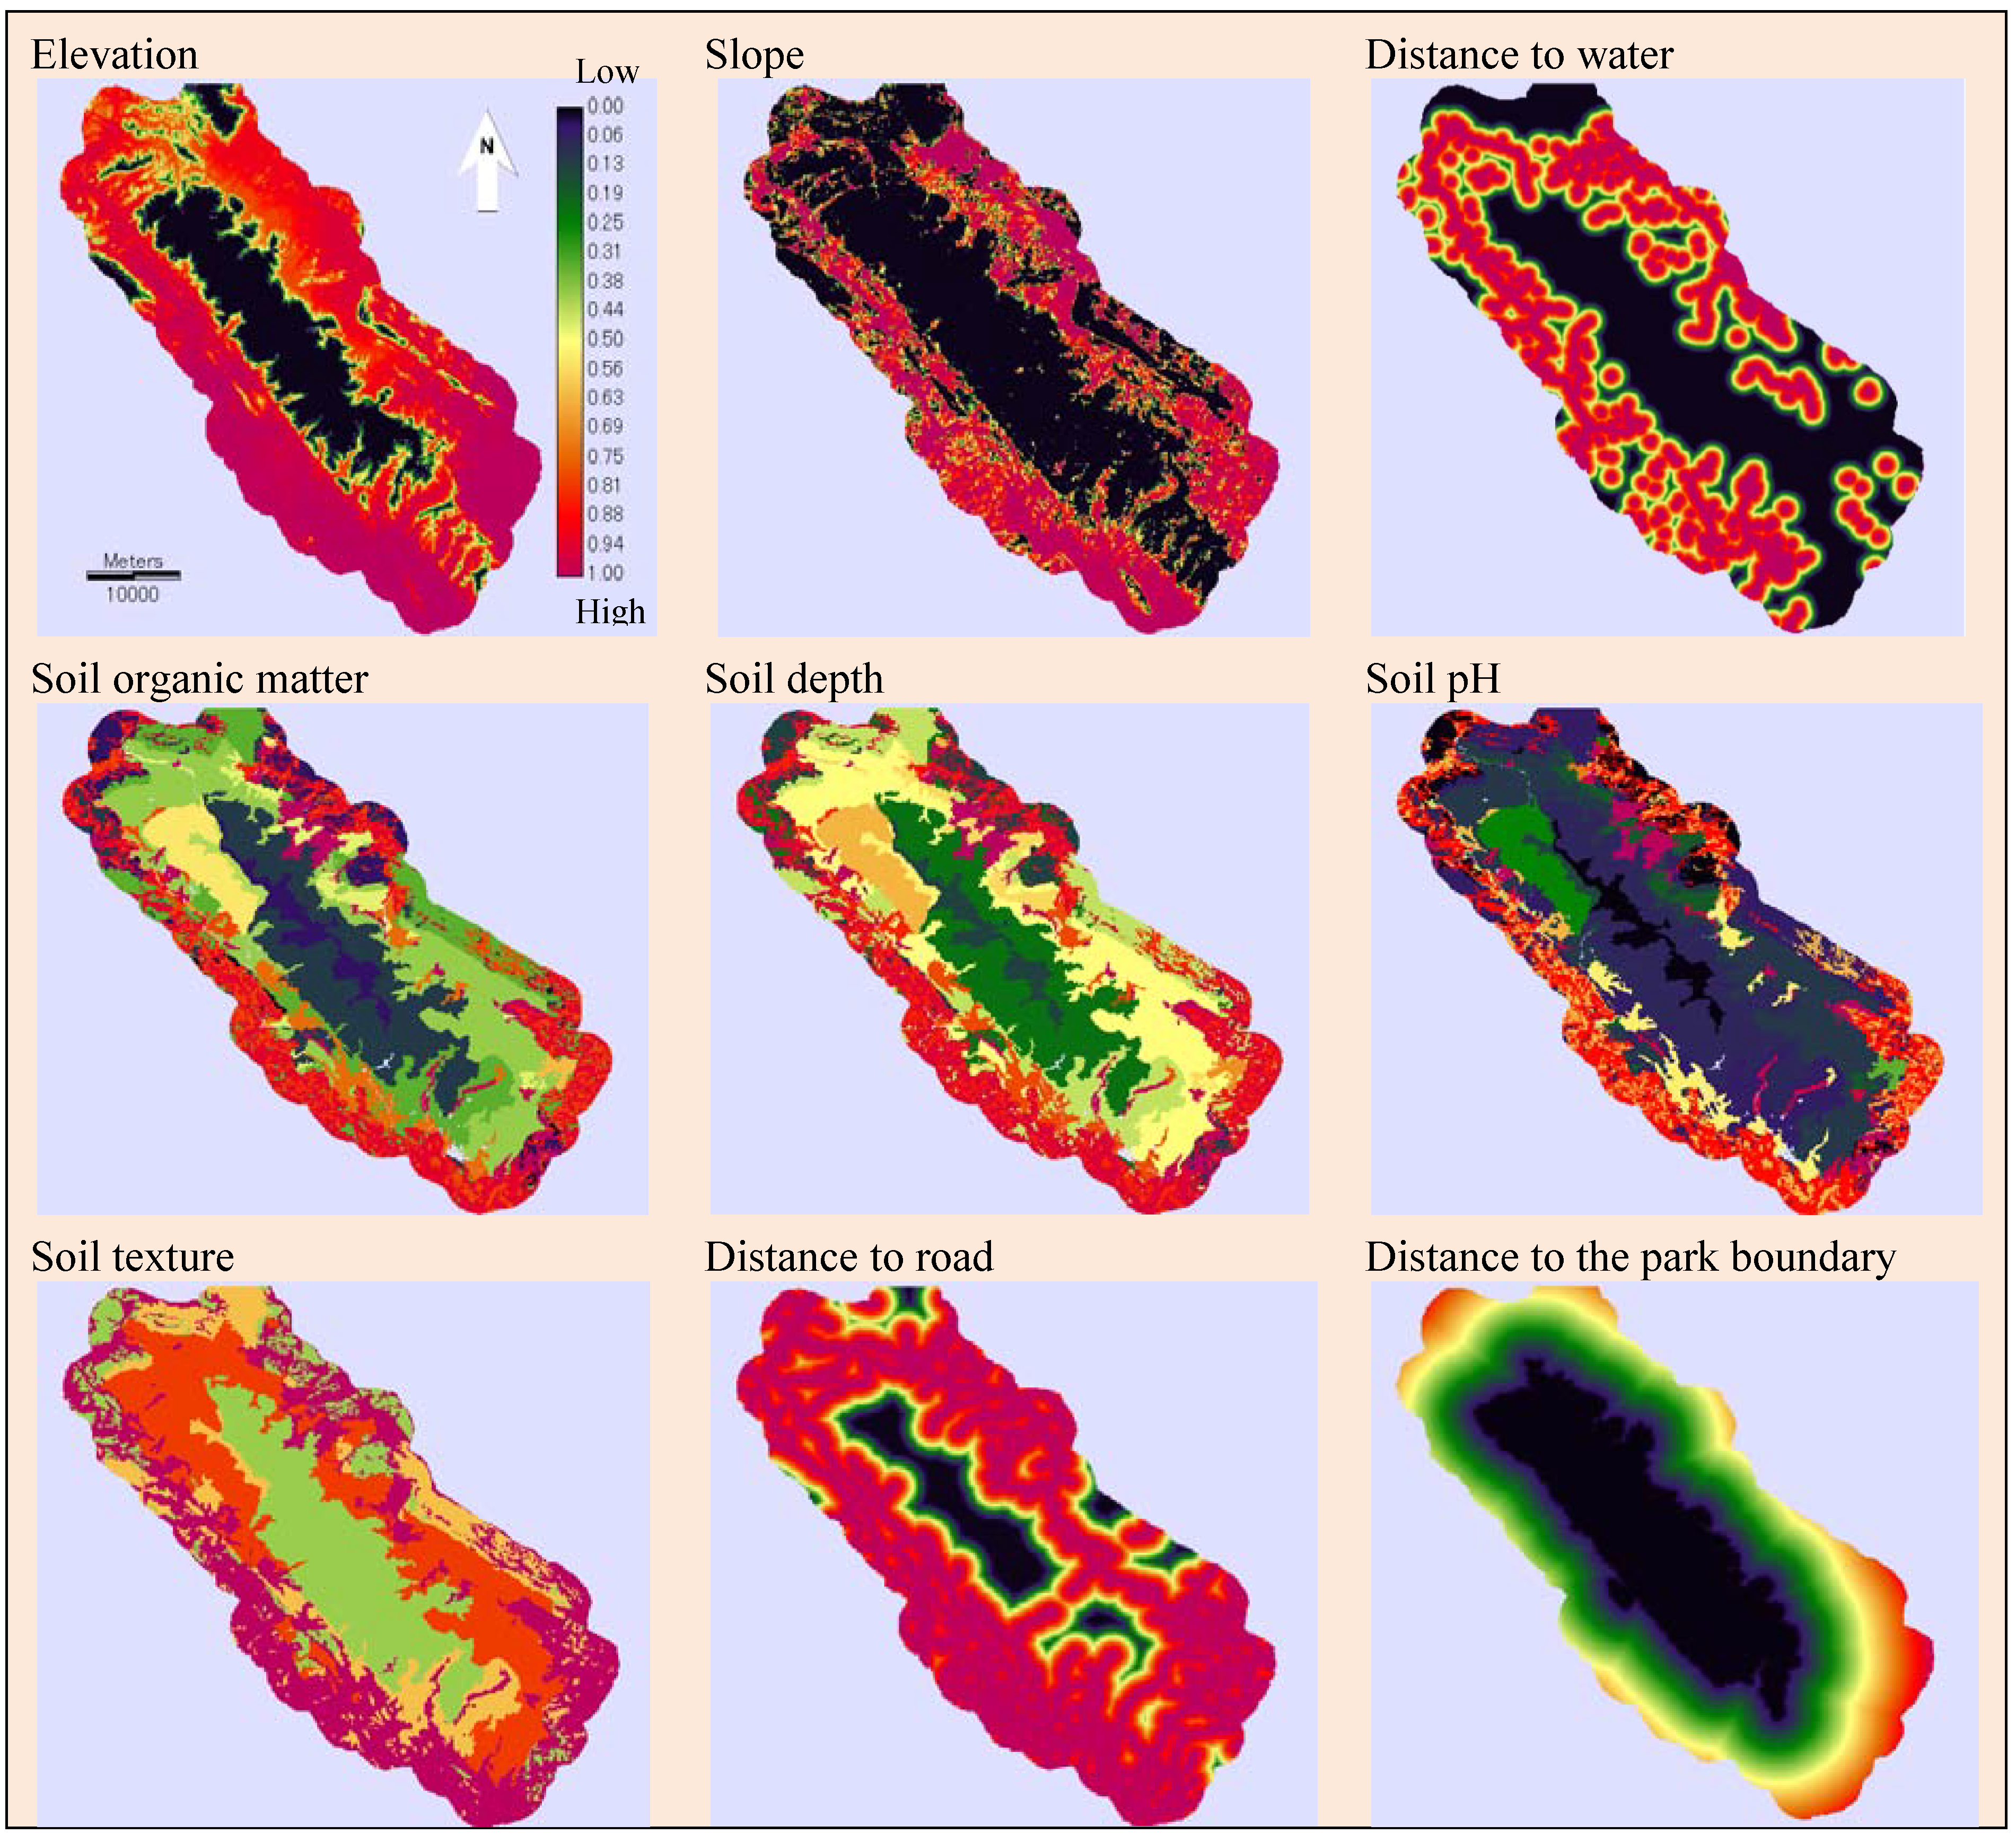
2.3. Multi-Criteria Evaluation
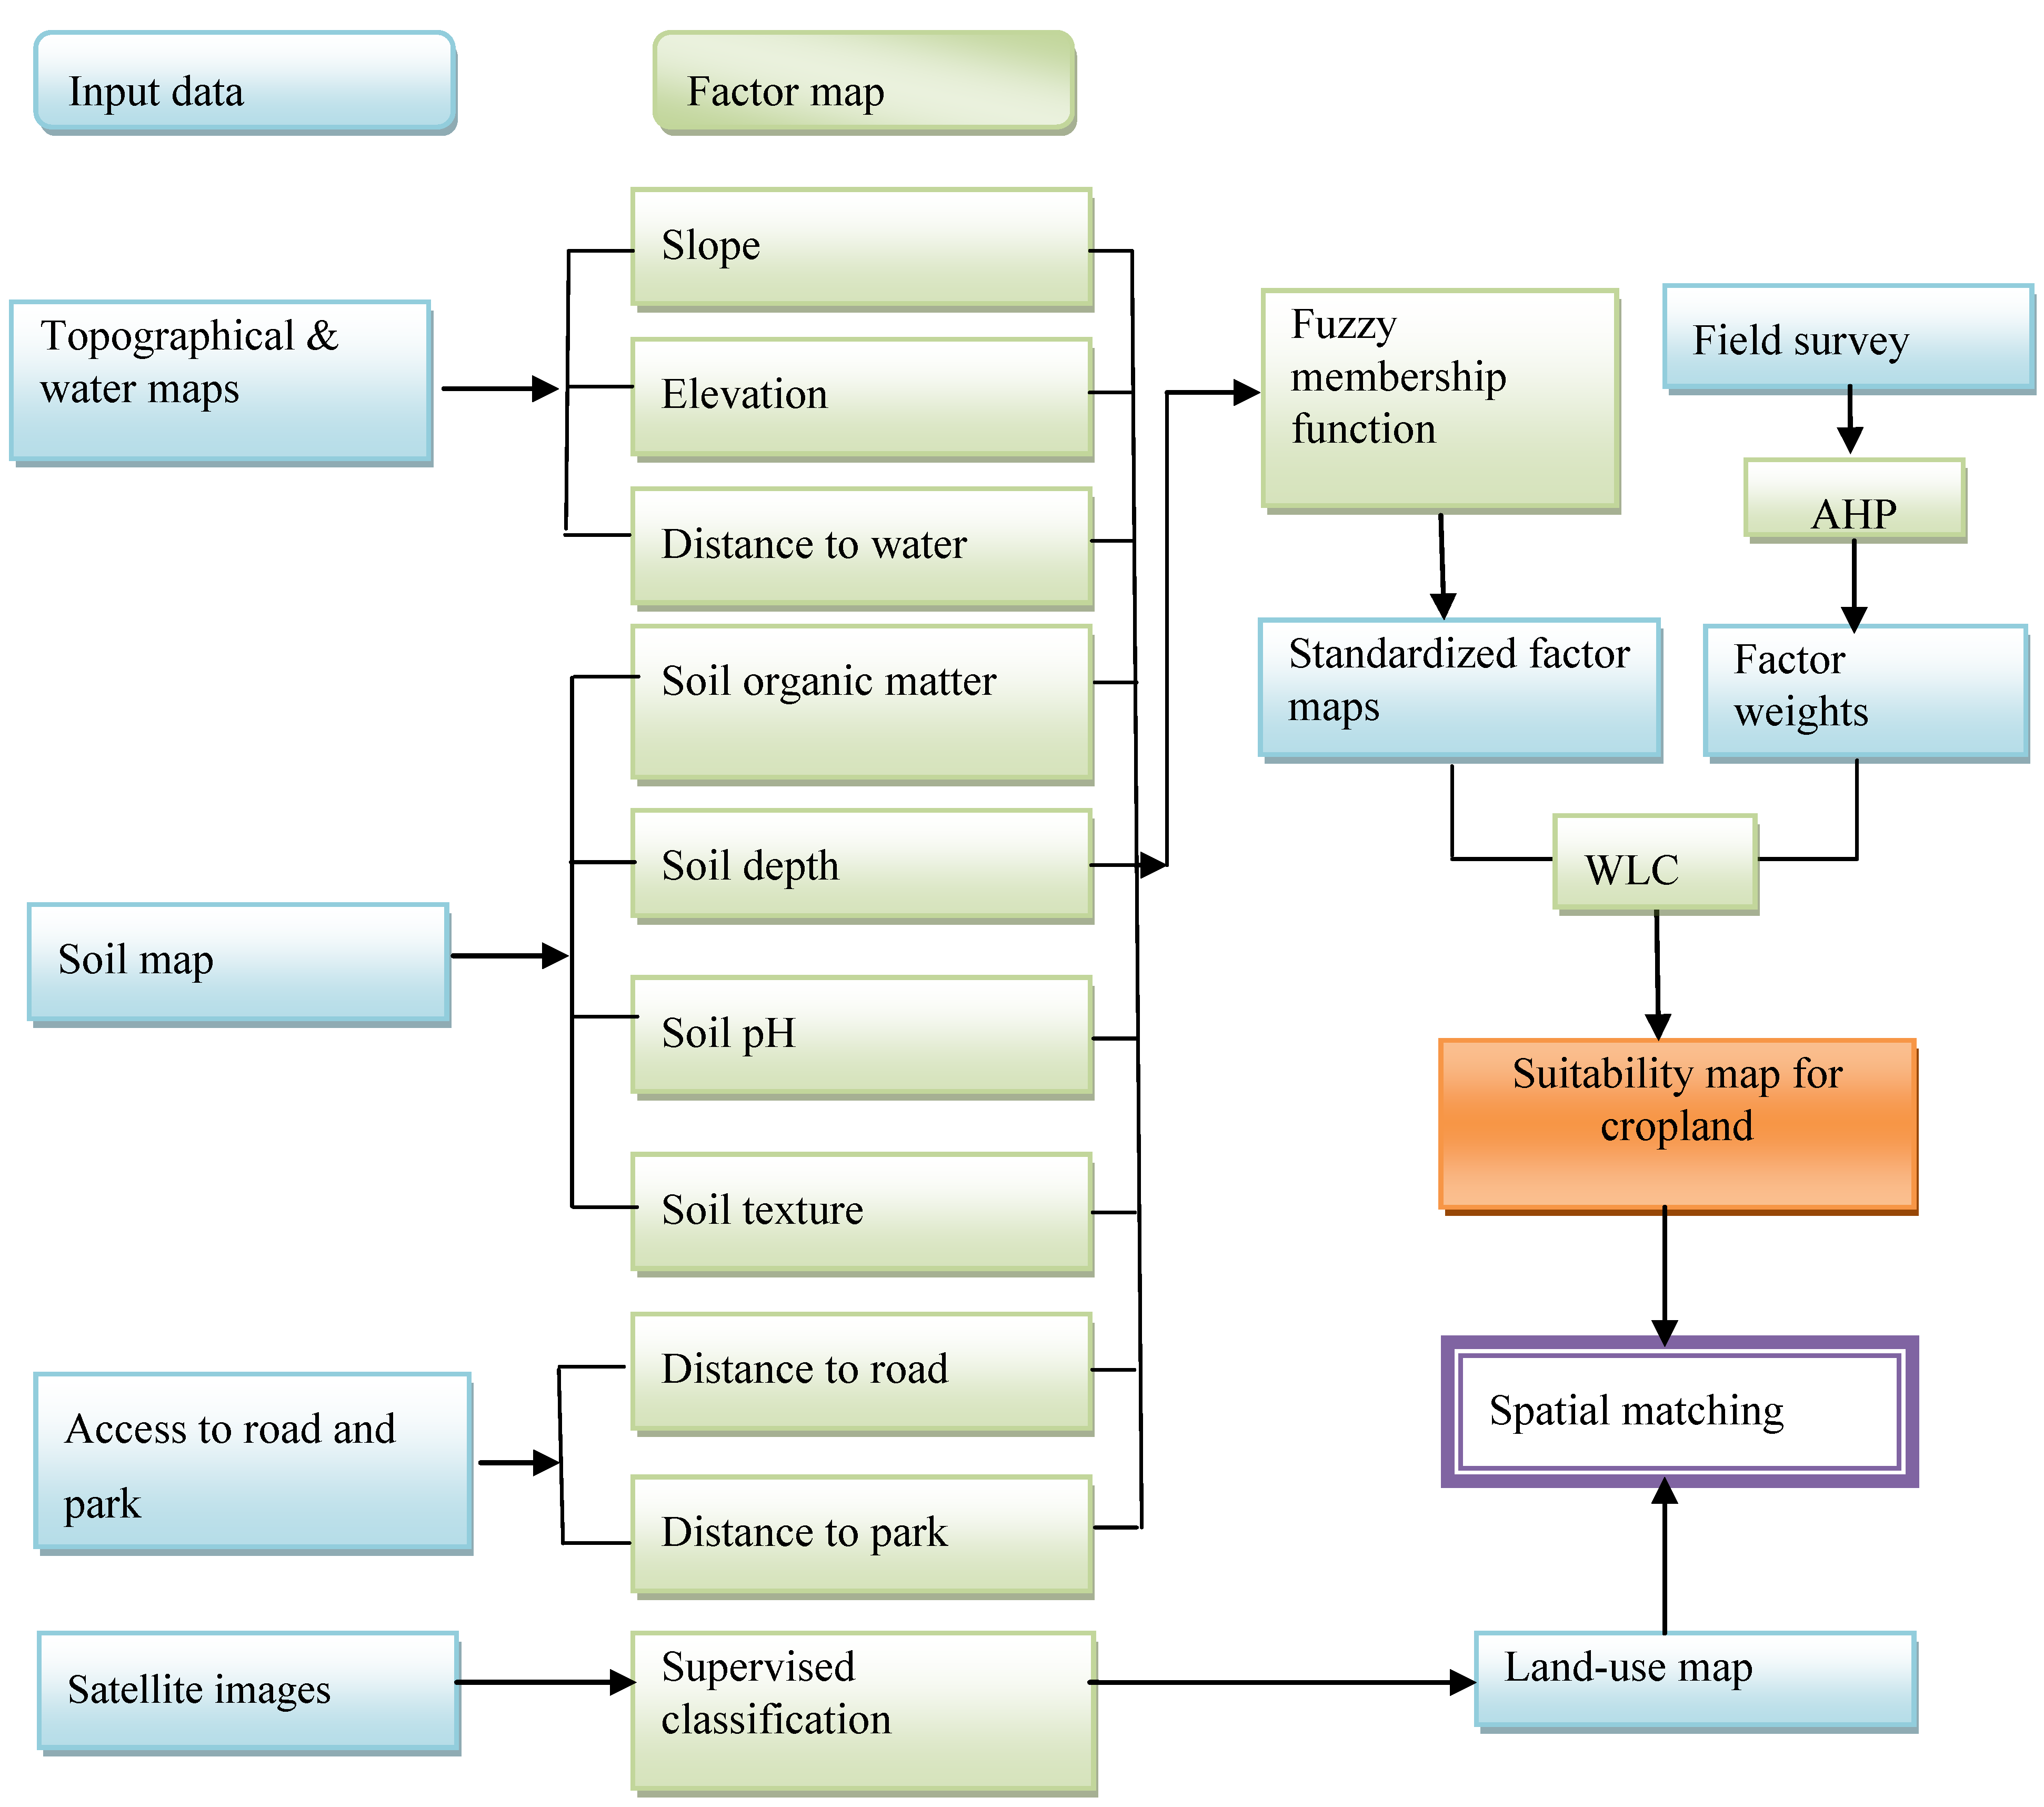
| Factor | Non-membership (unsuitable) | Membership grade (suitable range) | References |
|---|---|---|---|
| Slope (degree) | >15 | 1–15 | TDNP agronomy experts Slope from 1° to 25° [21], 1o to 15o [22,23] |
| Elevation (m) | >400 | 1–400 | TDNP agronomy experts Elevation from 1 to 500 m [22] |
| Distance to water (m) | >2,000 | 100–2,000 | TDNP agronomy experts |
| Soil organic matter (%) | <0.5 | 0.5–2.3 | TDNP agronomy experts Less than 1% to 3% [22] |
| Soil depth (cm) | <20 | 20–150 | TDNP agronomy experts Soil depth range from 10 cm to 60 cm [22], 15 cm to more than 30 cm [23] |
| Soil pH | 7.5 | 4.5–6.9 | TDNP agronomy experts pH range from 5 to 8 [22] |
| Soil texture (class) | - | Sandy clay loam, sandy loam, silt loam, loam | TDNP agronomy experts Medium loam is most suitable, light and heavy loam is moderately suitable, sandy loam and medium clay is marginally suitable [22,23] |
| Distance to roads (m) | >4,000 | 100–4,000 | TDNP agronomy experts |
| Distance to the park boundary (m) | <500 | 500–11,277 | TDNP agronomy experts |
| Slope | Elevation | Distance to water | Weight | |||||||||
|---|---|---|---|---|---|---|---|---|---|---|---|---|
| Terrain and water | ||||||||||||
| Slope | 1 | 1 | 2/3 | 0.2856 | ||||||||
| Elevation | 1 | 1 | 2/3 | 0.2856 | ||||||||
| Distance to water | 3/2 | 3/2 | 1 | 0.4288 | ||||||||
| Consistency ratio (CR) = 0.000 | ||||||||||||
| Soil organic matter | Soil depth | Soil pH | Soil texture | Weight | ||||||||
| Soil quality | ||||||||||||
| Soil organic matter | 1 | 3 | 2 | 3/2 | 0.4073 | |||||||
| Soil depth | 1/3 | 1 | 3/2 | 2 | 0.2384 | |||||||
| Soil pH | 1/2 | 2/3 | 1 | 1/2 | 0.1444 | |||||||
| Soil texture | 2/3 | 1/2 | 2 | 1 | 0.2099 | |||||||
| CR = 0.087 | ||||||||||||
| Distance to road | Distance to the park | Weight | ||||||||||
| Access to roads and the park | ||||||||||||
| Distance to roads | 1 | 3/2 | 0.6000 | |||||||||
| Distance to the park | 2/3 | 1 | 0.4000 | |||||||||
| CR = 0.000 | ||||||||||||
| Terrain and water | Soil quality | Access to roads and the park | Weight | |||||||||
| Land use requirement for the assessment of site suitability for cropland | ||||||||||||
| Terrain and water | 1 | 1/2 | 3 | 0.3338 | ||||||||
| Soil quality | 2 | 1 | 3 | 0.5247 | ||||||||
| Access to roads and the park | 1/3 | 1/3 | 1 | 0.1415 | ||||||||
| CR = 0.046 | ||||||||||||
| Values | Decimal | Normalization | Weight | λ | CI | RI | CR | |||||||
|---|---|---|---|---|---|---|---|---|---|---|---|---|---|---|
| TW | SQ | RP | TW | SQ | RP | TW | SQ | RP | ||||||
| TW | 1 | 1/2 | 3 | 1.00 | 0.50 | 3.00 | 0.30 | 0.27 | 0.43 | 0.3338 | ||||
| SQ | 2 | 1 | 3 | 2.00 | 1.00 | 3.00 | 0.60 | 0.55 | 0.43 | 0.5247 | 3.0538 | 0.0269 | 0.58 | 0.0464 |
| RP | 1/3 | 1/3 | 1 | 0.33 | 0.33 | 1.00 | 0.10 | 0.18 | 0.14 | 0.1415 | ||||
| Sum | 3.33 | 1.83 | 7.00 | 1.0000 | ||||||||||
- (a)
- Sum the numbers in each column of the values matrix; divide each number in the decimal matrix by the column sum; the resulting matrix is the normalization matrix.
- (b)
- Average the numbers in each row of the normalization matrix; the average value is the weight.
- (c)
- Compute lambda (λ) by the following steps [14]: (1) determine the weighted sum vector by multiplying the weight of the TW, the weight of the SQ, and the weight of the WP times the first column, the second column, and the third column of the values matrix, respectively, and finally, sum these values over the rows; (2) determine the consistency vector by dividing the weighted sum vector by the factor weights as per the following.
| Step 1 | Step 2 |
| (1) (0.3338) + (0.5) (0.5247) +(3) (0.1415) = 1.0208 | 1.0208/0.3338 = 3.05837 |
| (2) (0.3338) + (1) ( 0.5247) + (3) (0.1415) = 1.6169 | 1.6169/0.5247 = 3.08168 |
| (0.3333) ( 0.3338) + (0.3333) ( 0.5247) + (1) (0.1415) = 0.4277 | 0.4277/0.1416 = 3.02140 |
- (d)
- The Consistency Index (CI) is (λ − n)/(n − 1), ( 3.0538 − 3)/2 = 0.0269
- (e)
- The Consistency Ratio (CR) is CI/RI, where RI is the Random Consistency Index. For n = 3, RI = 0.58 [24]. CR = 0.0269/0.58 = 0.0464.
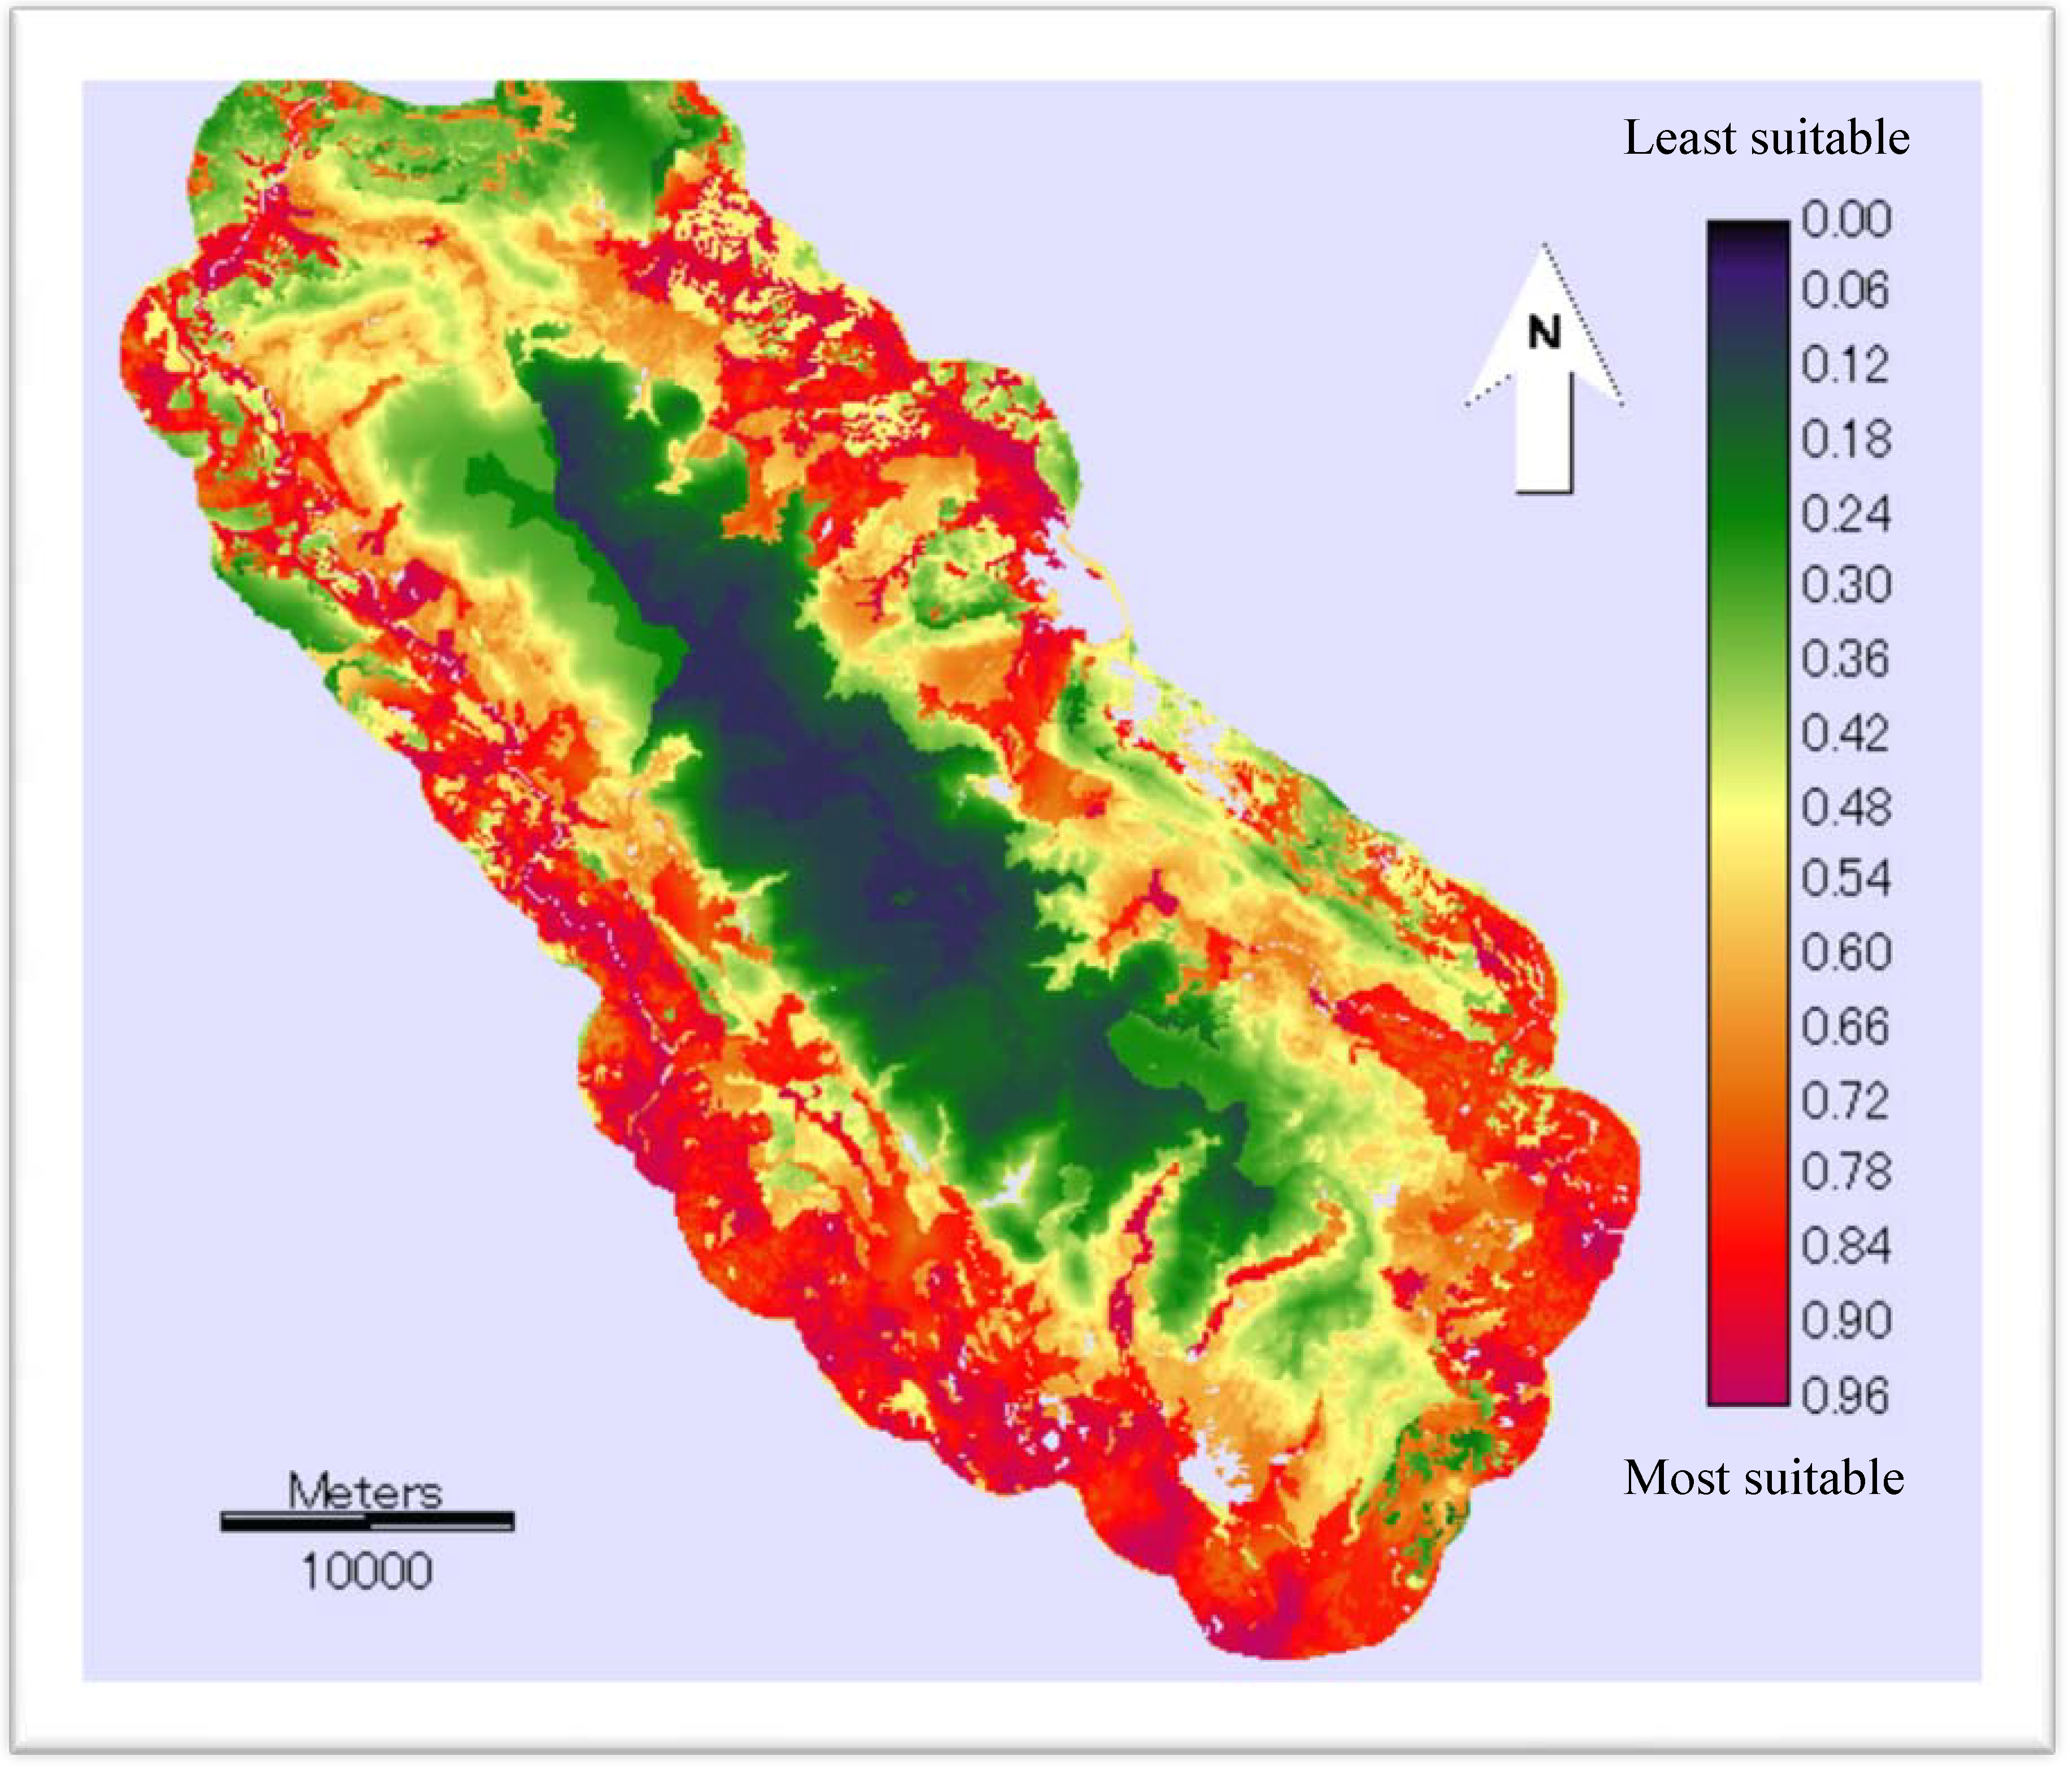
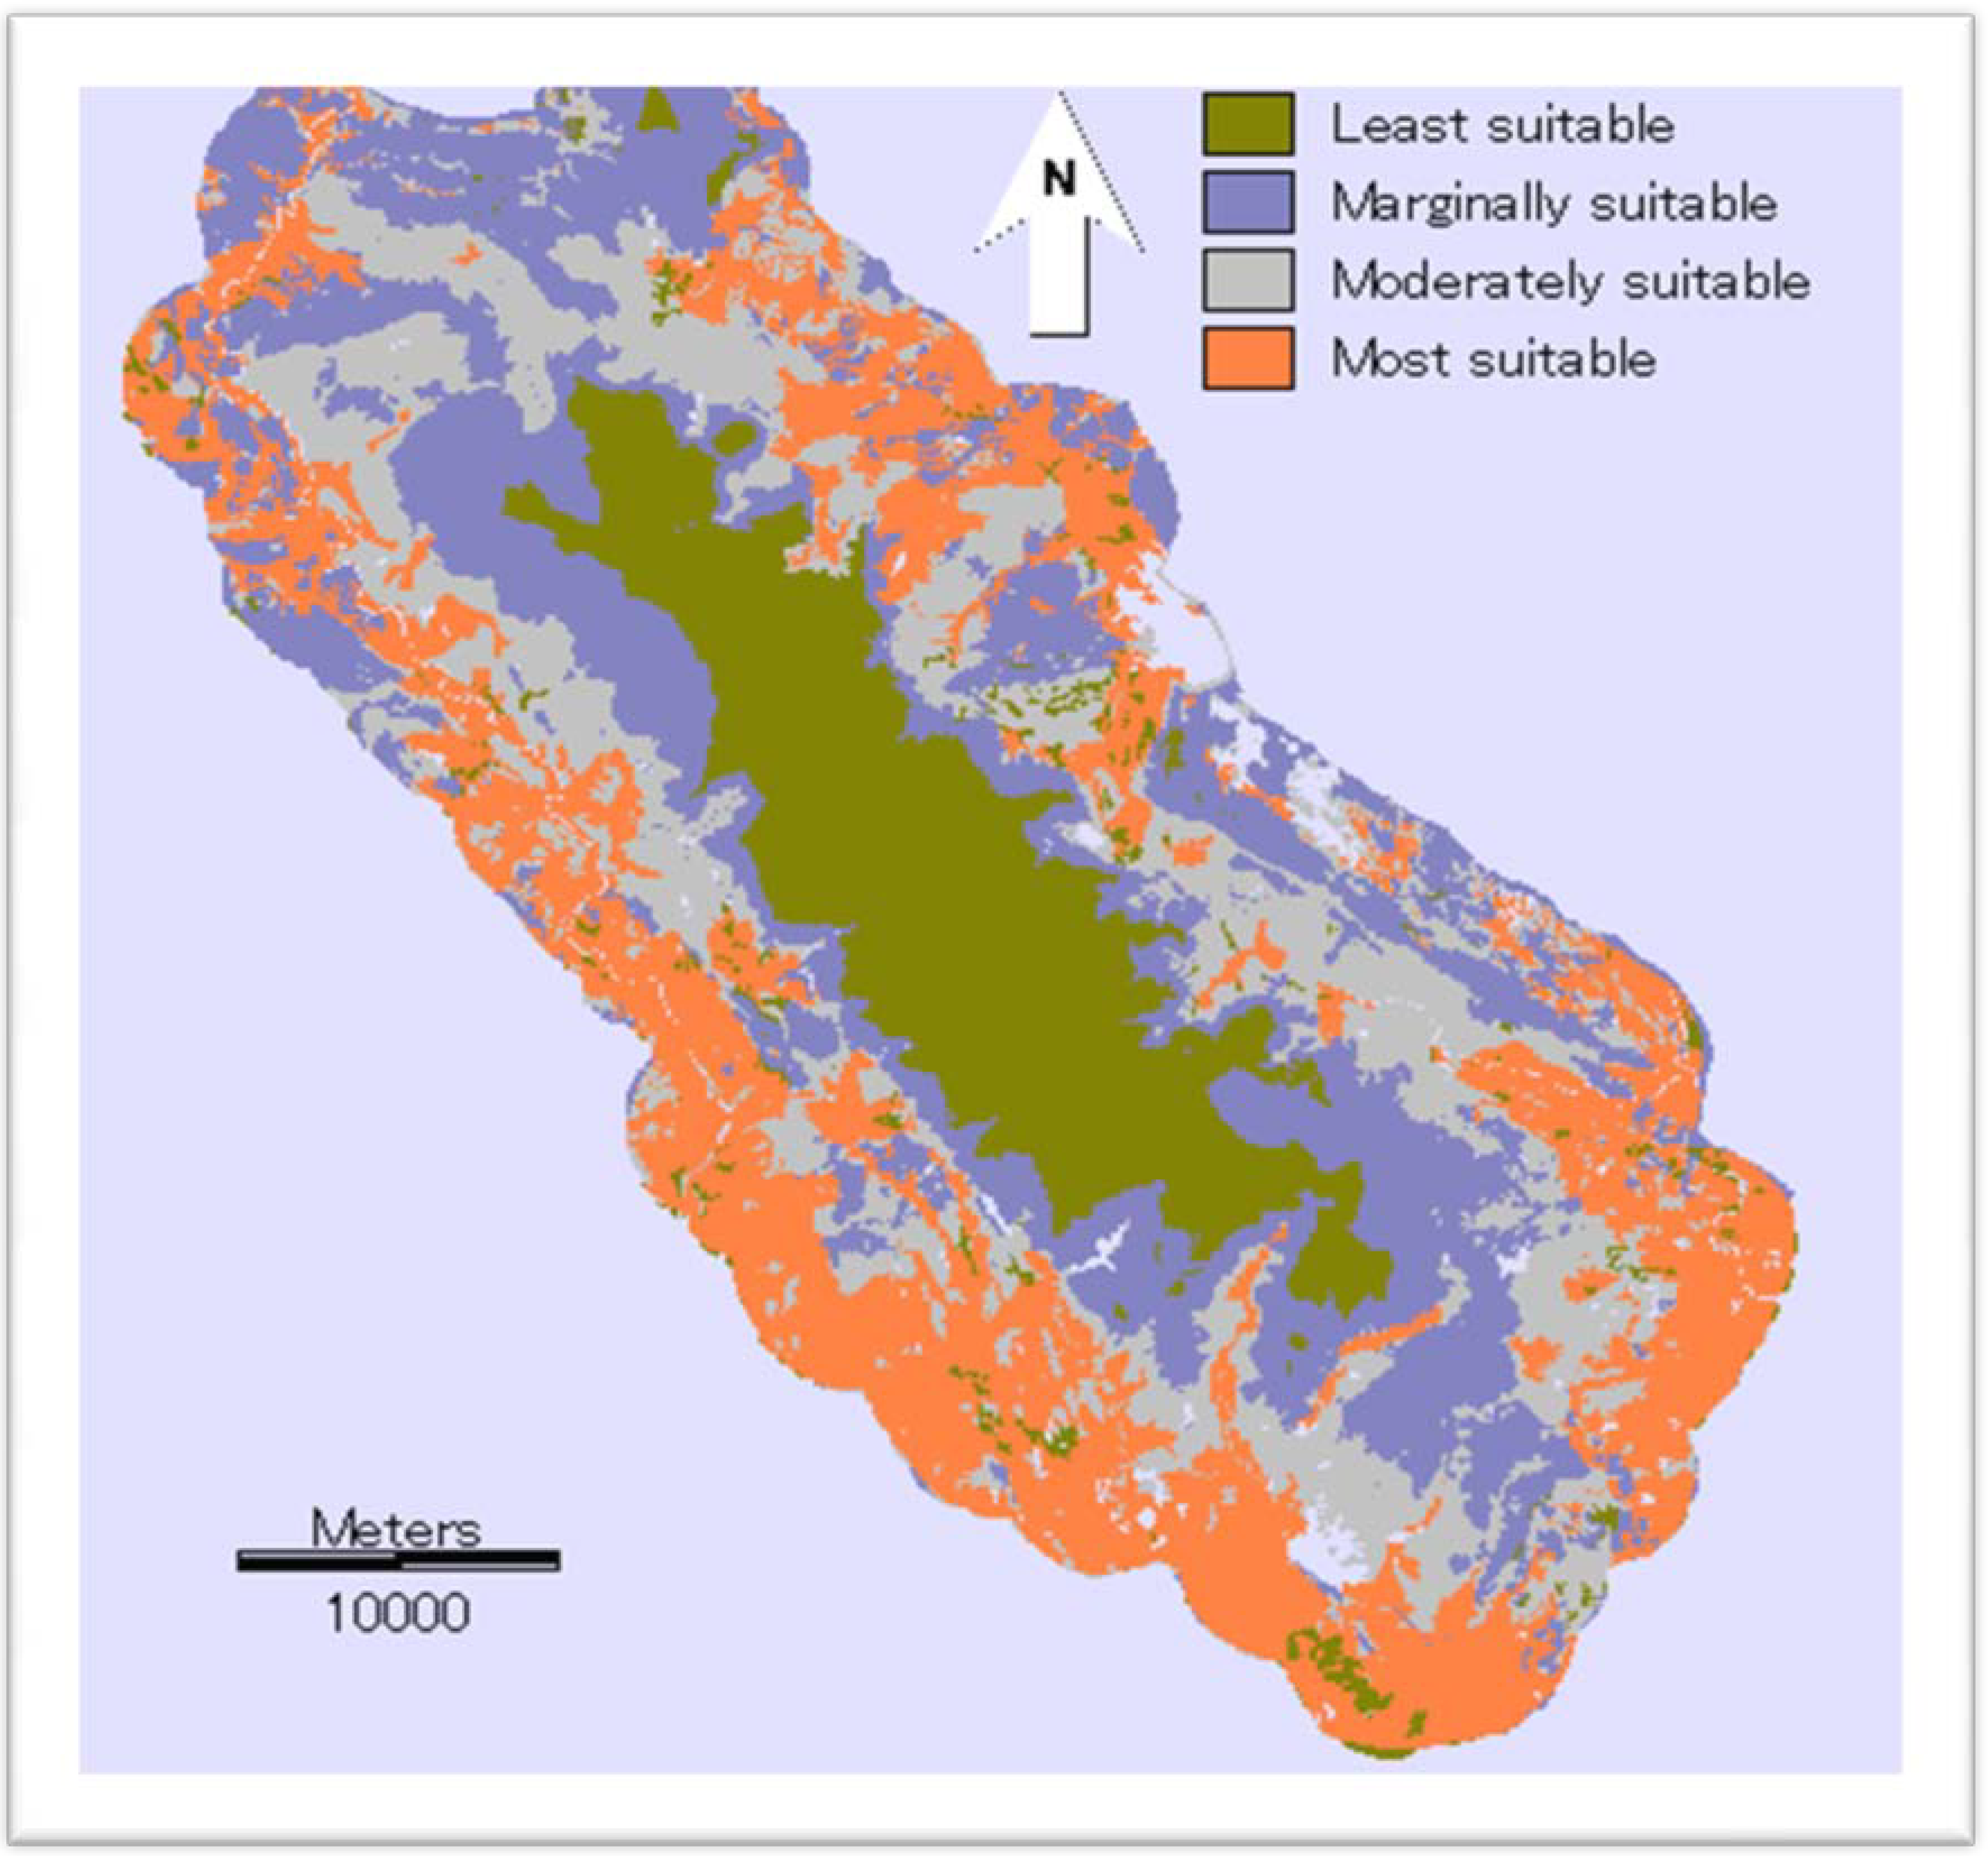
3. Results
| Suitability class | Area (ha) | Proportion (%) |
|---|---|---|
| Least suitable | 27,069 | 19.17 |
| Marginally suitable | 40,639 | 28.77 |
| Moderately suitable | 33,846 | 23.96 |
| Most suitable | 39,683 | 28.10 |

| Land-use type | Level of suitability | ||||||||
|---|---|---|---|---|---|---|---|---|---|
| Most suitable | Moderately suitable | Marginally suitable | Least suitable | Total land-use | |||||
| ha | % | ha | % | ha | % | ha | % | ha | |
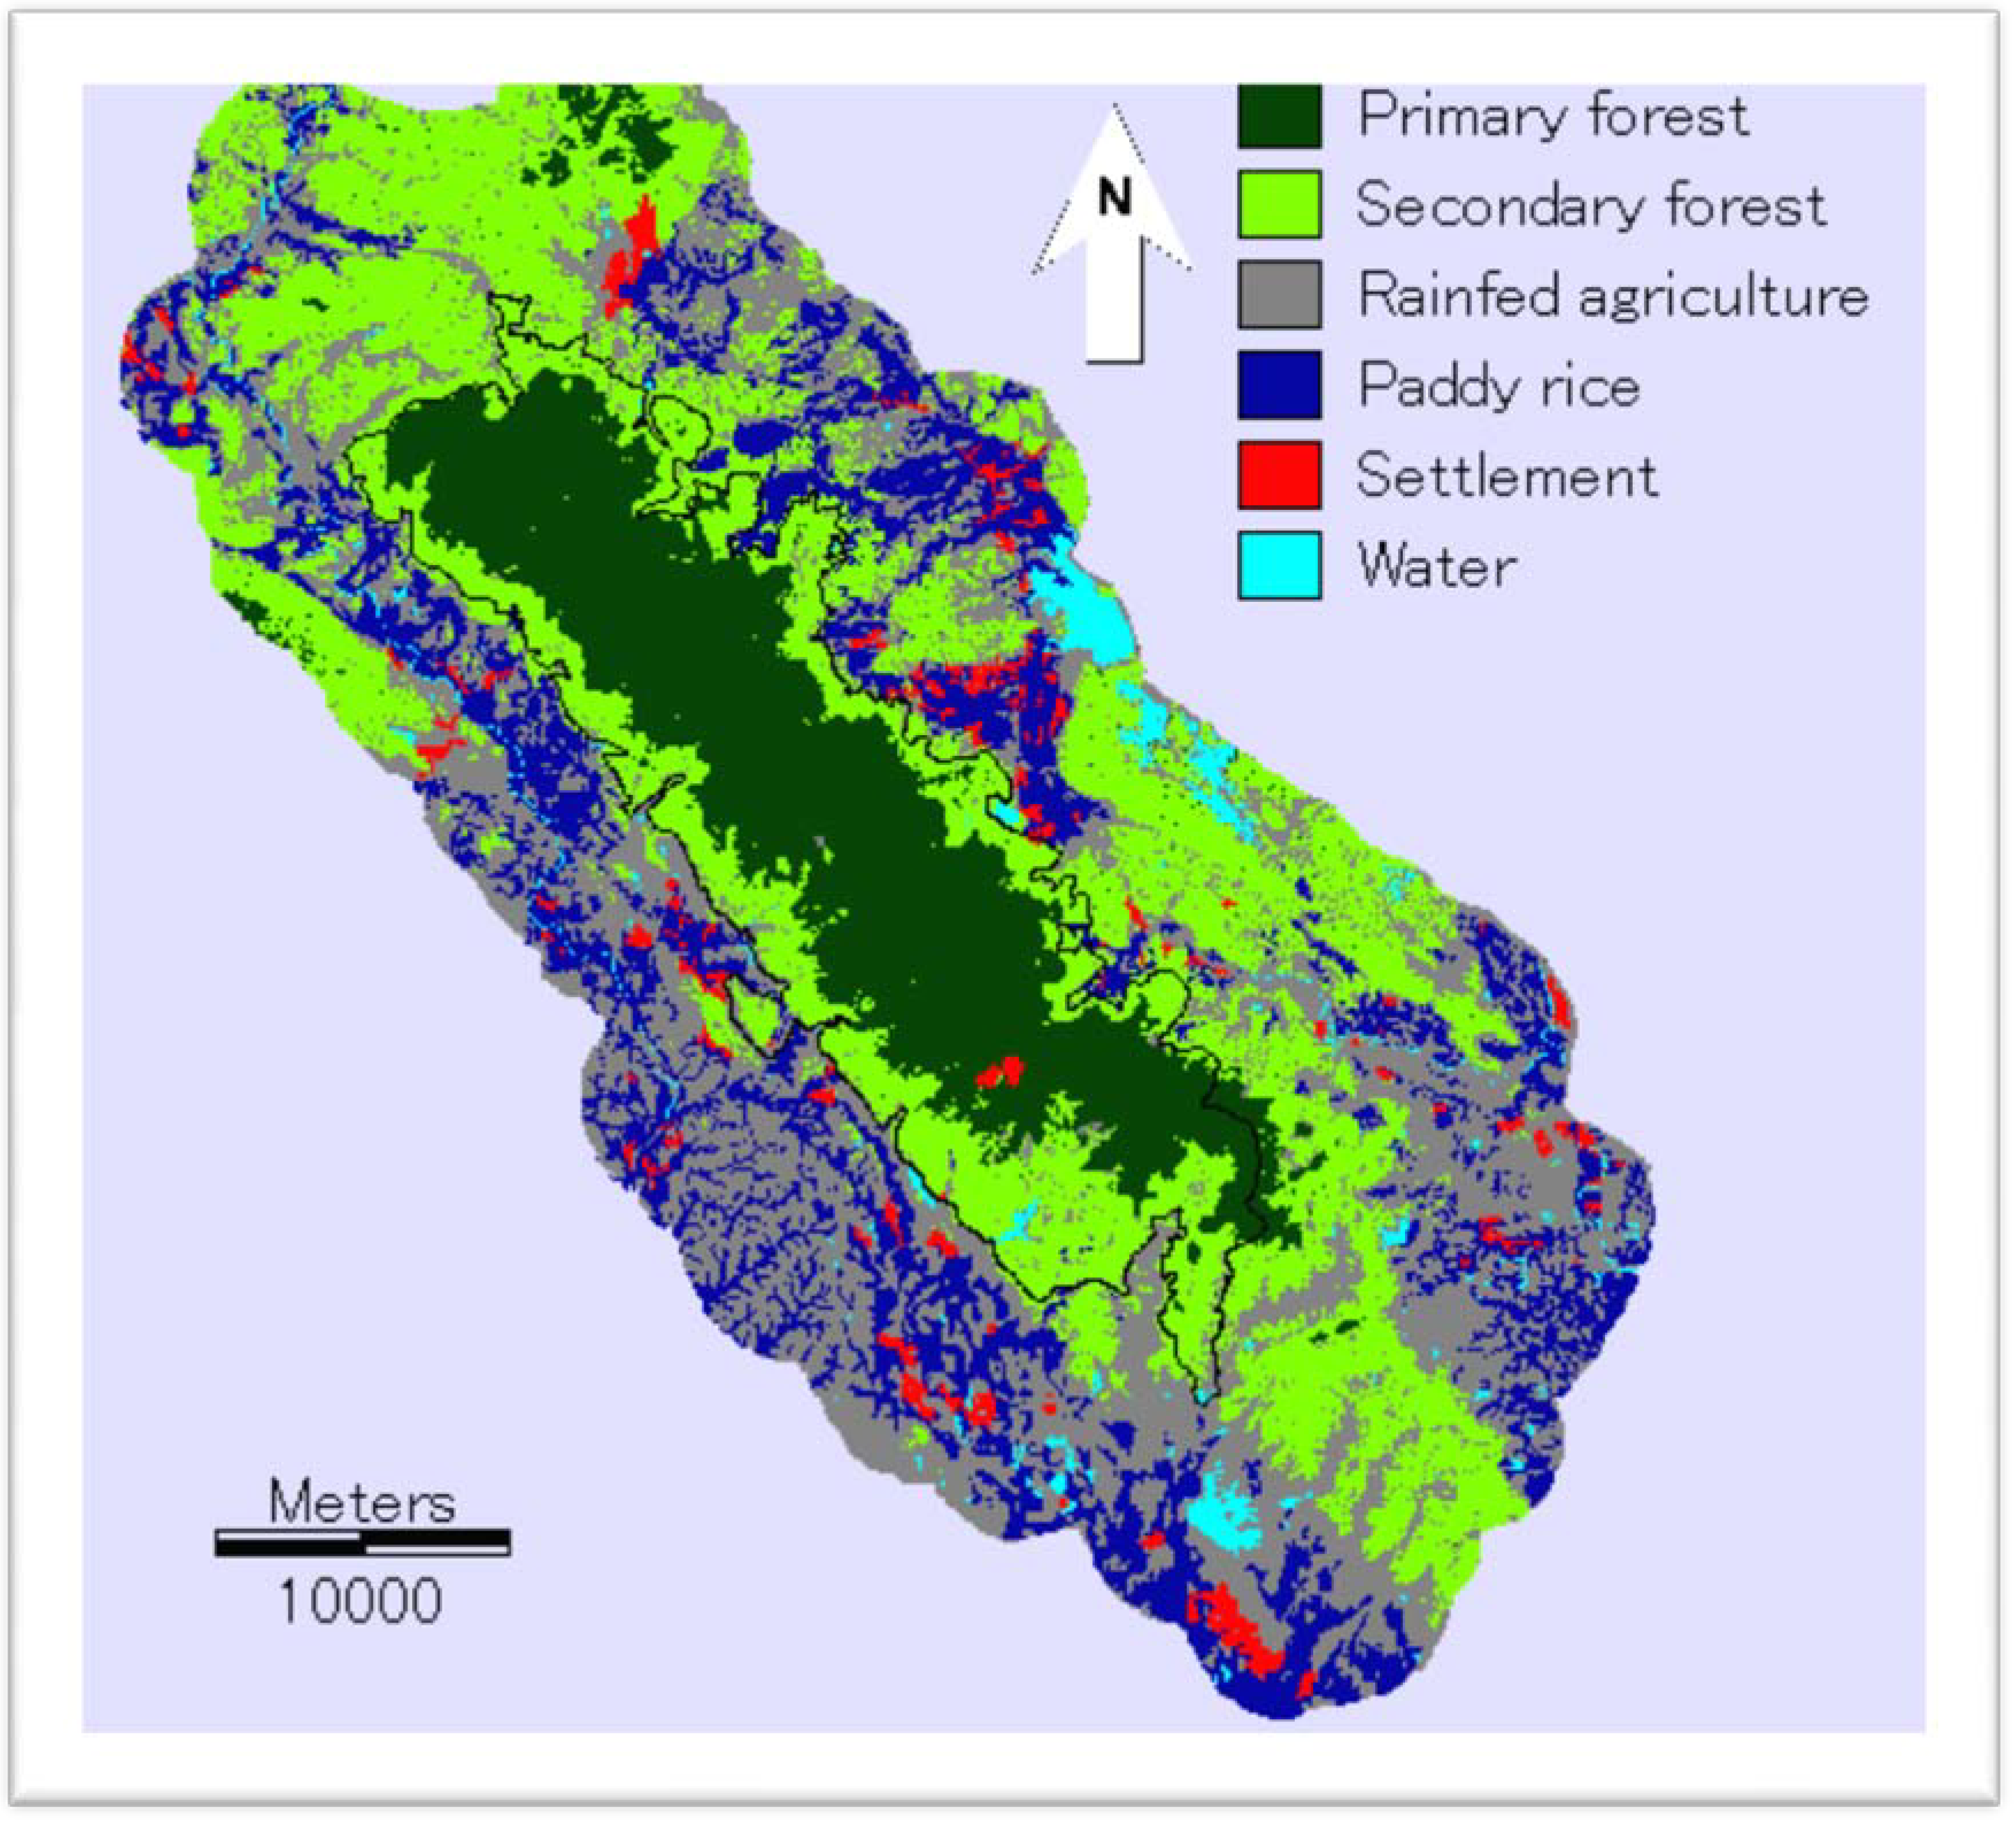
| Primary forest | 8 | 0.02 | 42 | 0.12 | 6,072 | 14.94 | 19,337 | 71.44 | 25,459 |
| Secondary forest | 1,339 | 3.37 | 11,359 | 33.56 | 29,006 | 71.37 | 2,314 | 8.55 | 44,018 |
| Rain-fed agriculture | 19,039 | 47.98 | 16,738 | 49.45 | 5,099 | 12.55 | 241 | 0.89 | 41,117 |
| Paddy rice | 18,748 | 47.24 | 5,394 | 15.94 | 251 | 0.62 | 174 | 0.64 | 24,567 |
| Settlement | 549 | 1.38 | 313 | 0.92 | 212 | 0.52 | 2,056 | 7.60 | 3,130 |
| Water | - | - | - | - | - | - | 2,947 | 10.89 | 2,947 |
| Total suitable class | 39,683 | 100.00 | 33,846 | 100.00 | 40,640 | 100.00 | 27,069 | 100.00 | 141,238 |

4. Discussion
Acknowledgements
References and Notes
- Global Forest Resources Assessment: Progress toward Sustainable Forest Management; FAO: Rome, Italy, 2005. Available online: http://www.fao.org/DOCREP/008/a0400e/a0400e00.htm (accessed on 25 September 2008).
- Guidelines for Protected Area Management Categories; International Union for the Conservation of Nature (IUCN): Gland, Switzerland, 1994.
- McNeely, J.A. Parks for Life: Report of the IVth World Congress on National Parks and Protected Areas; IUCN: Gland, Switzerland, 1993. [Google Scholar]
- Overview-What is a Protected Area? WCPA (World Commission on Protected Areas): Townsville, QLD, Australia, 2010. Available online: http://www.iucn.org/about/union/commissions/wcpa/wcpa overview/ (accessed on 3 April 2010).
- Phuong, N.N.; Dembner, S.A. Improving the Lifestyles of People in Protected Areas of Vietnam; FAO: Rome, Italy, 1994. Available online: http://www.fao.org/docrep/v2900e/v2900e00.htm#Contents (accessed on 2 April 2010).
- Vietnam National Report on Protected Areas and Development; International Centre for Environmental Management (ICEM): Indooroopilly, QLD, Australia, 2003; pp. 19–47.
- van Ranst, E.; Tang, H.; Groenemans, R.; Sinthurahat, S. Application of fuzzy logic to land suitability for rubber production in peninsular Thailand. Geoderma 1996, 70, 1–19. [Google Scholar]
- Collins, M.G.; Steiner, F.R.; Rushman, M.J. Land-use suitability analysis in the United States: Historical development and promising technological achievements. Environ. Manage. 2001, 28, 611–621. [Google Scholar] [CrossRef] [PubMed]
- Stainer, F. Landscape planning: A method applied to a growth management example. Environ. Manage. 1991, 15, 519–529. [Google Scholar] [CrossRef]
- Sui, D.Z. Integrating neural networks with GIS for spatial decision making. Oper. Geogr. 1993, 11, 13–20. [Google Scholar]
- Pereira, J.M.C.; Duckstein, L. A. multiple criteria decision-making approach to GIS-based land suitability evaluation. Int. J. Geog. Inf. Syst. 1993, 7, 407–424. [Google Scholar] [CrossRef]
- Malcewski, J. GIS-based multicriteria decision analysis: A survey of the literature. Int. J. Geog. Inf. Syst. 2006, 20, 703–726. [Google Scholar] [CrossRef]
- Cover, S.J. Integrating multi-criteria evaluation with geographical information systems. Int. J. Geog. Inf. Syst. 1991, 5, 321–339. [Google Scholar] [CrossRef]
- Malcewski, J. Spatial multicriteria decision analysis. In Spatial Multicriteria Decision Making and Analysis: A Geographical Information Sciences Approach; Ashgate Publishing: Aldershot, UK, 1999; pp. 101–269. [Google Scholar]
- Khang, N.D.; Hoe, H.; Duc, H.D.; Thin, N.N.; Tien, D.D.; Lanh, V.L.; Huyen, T.H. Tam Dao National Park; Agricultural Publishing House: Hanoi, Vietnam, 2007; pp. 9–56. (in Vietnamese) [Google Scholar]
- Ghazoul, J. Frontier Vietnam Environmental Research Report 1-Tam Dao Nature Reserve: Results of a Biological Survey; Ministry of Agriculture and Rural Development: Hanoi, Vietnam, 1994.
- Tam Dao National Park and Buffer Zone Management Project (TDMP). Rural Household Economics Baseline Survey 2005; Centre of Services, Eco-tourism & Environmental Education: Tam Dao, Vienam, 2005. Available online: http://tamdaonp.com.vn/ (accessed on 2 March 2010).
- Eastman, J.R. IDRISI Taiga, Guide to GIS and Remote Processing; Clark University: Worcester, MA, USA, 2009; pp. 234–256. [Google Scholar]
- McBratney, A.B.; Odeh, I.O.A. Application of fuzzy sets in soil science: Fuzzy logic, fuzzy measurements and fuzzy decisions. Geoderma 1997, 77, 85–113. [Google Scholar] [CrossRef]
- Ahamed, T.R.N.; Rao, K.G.; Murthy, J.S.A. GIS-based fuzzy membership model for cropland suitability analysis. Agr. Syst. 2000, 63, 75–95. [Google Scholar] [CrossRef]
- Liu, Y.S.; Wang, J.Y.; Guo, L.Y. GIS-based assessment of land suitability for optimal allocation in the Qinling Mountains, China. Pedosphere 2006, 16, 579–586. [Google Scholar] [CrossRef]
- Quan, B.; Zhu, H.J.; Chen, S.L.; Romkens, M.J.M.; Li, B.C. Land suitability assessment and land use change in Fujian province, China. Pedosphere 2007, 17, 493–504. [Google Scholar] [CrossRef]
- Wang, X.; Lu, C.; Fang, J.; Shen, Y. Implications for development of grain-for-green policy based on cropland suitability evaluation in desertification-affected north China. Land Use Policy 2007, 24, 417–424. [Google Scholar] [CrossRef]
- Saaty, T.L. The Analytic Hierarchy Process; McGraw-Hill: New York, NY, USA, 1980. [Google Scholar]
- Saaty, T.L. The Analytic Hierarchy Process: Planning, Priority Setting, Resource Allocation; RWS publications: Pittsburgh, PA, USA, 1990. [Google Scholar]
- Eastman, J.R.; Jin, W.; Kyem, P.A.K.; Toledano, J. Raster procedures for multi criteria/multi objective decision. Photogramm. Eng. Remote Sensing 1995, 61, 539–547. [Google Scholar]
- A Framework for Land Evaluation; soils bulletin No. 32; Food and Agriculture Organization of the United Nations (FAO): Rome, Italy, 1976.
- Colchester, M. Salvaging nature: Indigenous peoples and protected areas. In Social Change and Conservation: Environmental Politics and Impacts of National Parks and Protected Areas; Ghimire, K.B., Pimbert, M.P., Eds.; Earthscan: London, UK, 1997; pp. 97–130. [Google Scholar]
- Pimbert, M.P.; Pretty, J.N. Parks, peoples and professionals: Putting participation into protected area management. In Social Change and Conservation: Environmental Politics and Impacts of National Parks and Protected Areas; Ghimire, K.B., Pimbert, M.P., Eds.; Earthscan: London, UK, 1997; pp. 297–330. [Google Scholar]
- Bridle, J.R.; Pedro, P.M.; Butlin, R.K. Habitat fragmentation and biodiversity: Testing for the evolutionary effects of refugia. Evolution 2004, 58, 1394–1396. [Google Scholar] [CrossRef] [PubMed]
- Meyfroidt, P.; Lambin, F.E. The causes of the reforestation in Vietnam. Land Use Policy 2008, 25, 182–197. [Google Scholar] [CrossRef]
- Jianbo, L. Energy balance and economic benefits of two agroforestry systems in northern and southern China. Agri. Ecosyst. Environ. 2006, 116, 255–262. [Google Scholar] [CrossRef]
- Palma, J.H.N.; Graves, A.R.; Burgess, P.J.; Keesman, K.J.; van Keulen, H.; Mayus, M.; Reisner, Y.; Herzog, F. Methodological approach for the assessment of environmental effects of agroforestry at the landscape scale. Ecol. Eng. 2007, 29, 450–462. [Google Scholar] [CrossRef] [Green Version]
- Groenemans, R.; Ranst, E.V.; Kerre, E. Fuzzy relational calculus in land evaluation. Geoderma 1997, 77, 283–298. [Google Scholar] [CrossRef]
- Eastman, J.R.; Jin, W.; Kyem, P.A.K.; Toledano, F. Participatory procedures for multi-criteria evaluation in GIS. In Proceedings of Chinese Professionals in GIS 92; NCGIA: Buffalo, NY, USA, 1992; pp. 281–288. [Google Scholar]
© 2010 by the authors; licensee MDPI, Basel, Switzerland. This article is an Open Access article distributed under the terms and conditions of the Creative Commons Attribution license (http://creativecommons.org/licenses/by/3.0/).
Share and Cite
Khoi, D.D.; Murayama, Y. Delineation of Suitable Cropland Areas Using a GIS Based Multi-Criteria Evaluation Approach in the Tam Dao National Park Region, Vietnam. Sustainability 2010, 2, 2024-2043. https://doi.org/10.3390/su2072024
Khoi DD, Murayama Y. Delineation of Suitable Cropland Areas Using a GIS Based Multi-Criteria Evaluation Approach in the Tam Dao National Park Region, Vietnam. Sustainability. 2010; 2(7):2024-2043. https://doi.org/10.3390/su2072024
Chicago/Turabian StyleKhoi, Duong Dang, and Yuji Murayama. 2010. "Delineation of Suitable Cropland Areas Using a GIS Based Multi-Criteria Evaluation Approach in the Tam Dao National Park Region, Vietnam" Sustainability 2, no. 7: 2024-2043. https://doi.org/10.3390/su2072024