1. Introduction
Resource consumption and sustainability are growing concerns for public higher education institutions and society [
1,
2]. Climate change and increasing energy scarcity also pose threats to modern society [
3]. In order to deal with these concerns, an increasing number of higher education institutions have begun to inventory energy consumption and greenhouse gas (GHG) emissions [
4]. These inventories can play an important role in defining institutional energy requirements, highlighting options for energy conservation, and in assessing the environmental costs of resource consumption.
Anthropogenic fossil fuel consumption has lead to an increase in greenhouse gases (GHG) in the atmosphere [
5]. The concentration of GHGs such as carbon dioxide, methane, nitrous oxide, and chlorofluorocarbons have increased dramatically since the industrial era began in the early 19th century [
5]. Prior to the industrial revolution atmospheric CO
2 concentrations were about 280 ppm. Currently, CO
2 concentrations in the atmosphere are about 390 ppm and rising [
6]. Greenhouse gas production and sea level rise are tracking the higher IPCC scenarios [
7].
Increased levels of GHGs in the atmosphere have led to an increase in the thermal equilibrium of the planet as a result of the increased amount of infrared radiation absorbed by these gases in the atmosphere [
5]. Effects of increased greenhouse gas concentrations in the atmosphere include increases in global average surface air temperature, global average sea level, and a decrease in snow cover in the Northern Hemisphere [
8,
9,
10]. Climate is a dominant physical factor affecting global ecosystems [
11]. The effects of climate change are highly diverse and wide ranging in biological ecosystems [
12]. A basic assumption of this paper is that anthropogenically induced climate change is real.
Total greenhouse gas emissions in the United States in 2008 were estimated to be 7,053 million Metric Tons (MT) carbon dioxide equivalents (CO
2e) [
13]. The U.S. produces between 22% and 25% of total GHG emissions globally. Average annual per capita emissions for the years 2001–2005 were approximately 20 tons CO
2 per U.S. citizen while global average annual per capita emissions ranged from 3.9 to 5.8 tons CO
2 per year [
14]. While most countries have lower average per capita emissions than the U.S., a few, such as Qatar and other Middle Eastern countries, have higher per capita emissions.
The state of Louisiana was the eighth largest producer of total GHG emissions in the U.S. in 2005 with a total of 191.56 million MT CO
2 [
15]. The majority of these emissions come from private sector industrial activities within the state. In 2005, Louisiana was the second largest producer of industrial GHG emissions in the U.S. with a total of 93.3 million MT CO
2e [
15]. Total per capita emissions in Louisiana in 2002 were 13.76 MT CO
2 [
16]. East Baton Rouge Parish, where LSU is located, produced the highest total amount of greenhouse gas emissions (approximately 27 million MT CO
2e) of all parishes within the state in 2002, mainly because of heavy industry [
16]. The majority of emissions in East Baton Rouge Parish are the result of industrial activities such as petrochemical refineries and chemical manufacturing plants. However, Louisiana forests and coastal wetlands provide carbon storage that has the potential to offset some of the state’s emissions [
17,
18].
As a coastal state with about 30,000 km
2 of coastal area including approximately 30% of the total coastal marsh area in the lower 48 states [
19,
20], Louisiana is presently, and will continue to experience the effects of climate change into the future [
21,
22]. Local effects include increasing salinization of surface waters [
23], water constraints on thermal power plants used for electricity production [
24], large-scale infrastructure damage (namely the energy and transport sectors) and state revenue losses due to extreme weather events (
i.e., hurricanes) [
25], relative sea level rise between one and two meters by 2100 leading to 10,000–13,500 km
2 of coastal land loss by 2100 [
22,
26], a significant increase in days with peak temperatures over 90 °F and fewer freezing days [
27], and increased incidents of large scale population mortality (more than 1,800 individuals died as a result of Hurricanes Katrina and Rita in 2005 [
28].
Fossil fuels are the main energy source in the US [
13]. Reducing dependence on fossil energy is one way to reduce GHG emissions. This reduction can either be a planned transition as a result of informed decision-making or a result of unintended market failure due to growing energy scarcity. The impact of peak oil on higher education and society is likely to cause a dramatic rise in the cost of maintaining infrastructure built in an age of cheap surplus energy [
3]. Increasing energy demand from developing countries such as India and China will further strain available fossil energy supplies and lead to increasing costs [
29]. Policy decisions have the ability to influence which energy supplies and emissions scenarios are favored [
30].
1.1. LSU and Greenhouse Gas Emissions
Louisiana State University Agricultural and Mechanical College (LSU A&M) is a public land grant university located in Baton Rouge, Louisiana, USA. LSU is “committed to being a responsible institution dedicated to the pursuit of truth and the advancement of learning while upholding the highest standards of performance in an academic and social environment” [
31]. LSU decided to address its contribution to atmospheric greenhouse gas pollution by commissioning an inventory of greenhouse gas emissions on the main campus during the 2008–2009 school year. This is recognized as a required initial step in understanding and reducing the annual GHG emissions of the University. Many have used the term “carbon footprint” for this type of analysis for universities [
4]. However, this is less accurate than “carbon weight” [
32]. Reduction of GHG emissions is a way of reducing the rate and magnitude of change resulting from global climate change [
5]. The GHG inventory provides a baseline estimate of emissions resulting from activity on the main campus. The University’s decision to inventory and assume responsibility for GHG emissions and their effects on climate are in line with both international (Kyoto Protocol) and domestic policy [
33] concerning global climate change.
This paper is a summary of GHG emissions resulting primarily from direct energy usage for the LSU A&M main campus for fiscal year (FY) 2007–2008. The purpose of this report is to provide the campus community and the public with an accurate estimate of campus GHG emissions, the sources of those emissions, and potential measures that may be implemented to reduce emissions in the future. Further, it is hoped that this effort will serve as an example for other universities as they move towards lowering their GHG emissions.
GHG Protocol Calculators are “the most widely-used international accounting tool for government and business leaders to quantify and manage greenhouse gas emissions” [
34]. The GHG Protocol Calculators are a series of tools that measure individual elements of emission sources. The Clean Air Cool Planet (CACP) campus carbon calculator utilizes the GHG accounting standards set forth by the World Business Council for Sustainable Development and the World Resources Institute [
35] in the GHG Protocol Initiative. The CACP calculator is backed by the American Colleges and Universities President’s Climate Commitment (ACUPCC) and is the most widely utilized campus emissions calculator in US higher education.
The calculator, however, does not include the energy cost accounting and resulting emissions of materials produced elsewhere and consumed on campus. Materials consumption on campus such as paper, food, and bookstore merchandise are not included in this study. Materials consumption accounting would undoubtedly increase overall campus GHG emissions. Paper products may have a smaller impact on emissions than computers since the majority of paper used on the LSU campus is produced at a nearby Georgia-Pacific papermill that predominantly mills Louisiana harvested timber. Campus computers and the associated emissions from mining and production of their components would likely increase emissions significantly. Food consumed on campus would likely have a considerable emissions price tag since food services are outsourced to a national food service provider. Also campus bookstore apparel and the associated manufacturing emissions would increase emissions.
We recognize that the CACP accounts for direct greenhouse gas emissions and some indirect emissions but does not include all the energy requirements to sustain the students, faculty, and staff on and off campus. However, the results of the emissions inventory provide a baseline for the implementation of informed emissions reduction strategies. The use of the CACP calculator also allows a comparison with other universities based on common boundaries and a common protocol tool. Comparisons with higher educational institutions in other countries are not included in this paper due to a shortage of data and the lack of an internationally recognized assessment tool.
1.2. Objectives
The overall objective was to create an accurate inventory of direct and specific indirect annual GHG emissions on the LSU-Baton Rouge main campus for FY 2007–2008. Specific objectives included:
Define Organizational, Operational, and Temporal boundaries of the study.
Collect campus energy consumption data from campus personnel.
Enter data into the carbon calculator.
Analyze the data and summarize results to determine the major contributors to campus GHG emissions.
Conduct a comparative analysis of data from similar-sized higher-education institutions to compare differences and similarities between institutions.
Develop alternative scenarios and management implications to decrease campus emissions.
2. Methods
The CACP calculator is a Microsoft excel based spreadsheet tool that provides procedural protocols and a framework for investigation of campus GHG emissions. The calculator is based on IPCC workbooks for national inventories and the methodologies and calculators of the GHG Protocol Initiative. It has been adapted for higher education institutional use [
4] and inventories produced by the calculator are compatible with current standards used to craft the proposed national cap and trade policy [
33,
35]. The CACP campus carbon calculator allows for accurate accounting of customized fuel mix information used for campus electricity generation. This is an important aspect of the calculator since campus electricity generation often accounts for greater than 50% of total campus emissions and is highly variable based on region and production source. The CACP campus carbon calculator allows for the accounting of all six-greenhouse gases specified by the Kyoto Protocol. The standards identify organizational (spatial), temporal, and operational boundaries along with the scope of emissions to prevent ‘double counting’ [
35].
CACP versions 5 and 6 were used in this study. The study was initially begun in August of 2008 using the CACP version 5 calculator. By January 2009, version 6.1 of the calculator was released and version 6.1 was used for the remainder of the study. All calculations were performed using version 6.1 of the calculator.
The organizational boundary of the study includes the LSU Agricultural and Mechanical college main campus in Baton Rouge (approx. 1000 acres). The vast majority of campus buildings rely on the campus powerhouse and co-generation facility for electricity, natural gas, and heating ventilation and air-conditioning (HVAC) services. All campus athletic fields, stadiums, and campus dining facilities are accounted for in this study.
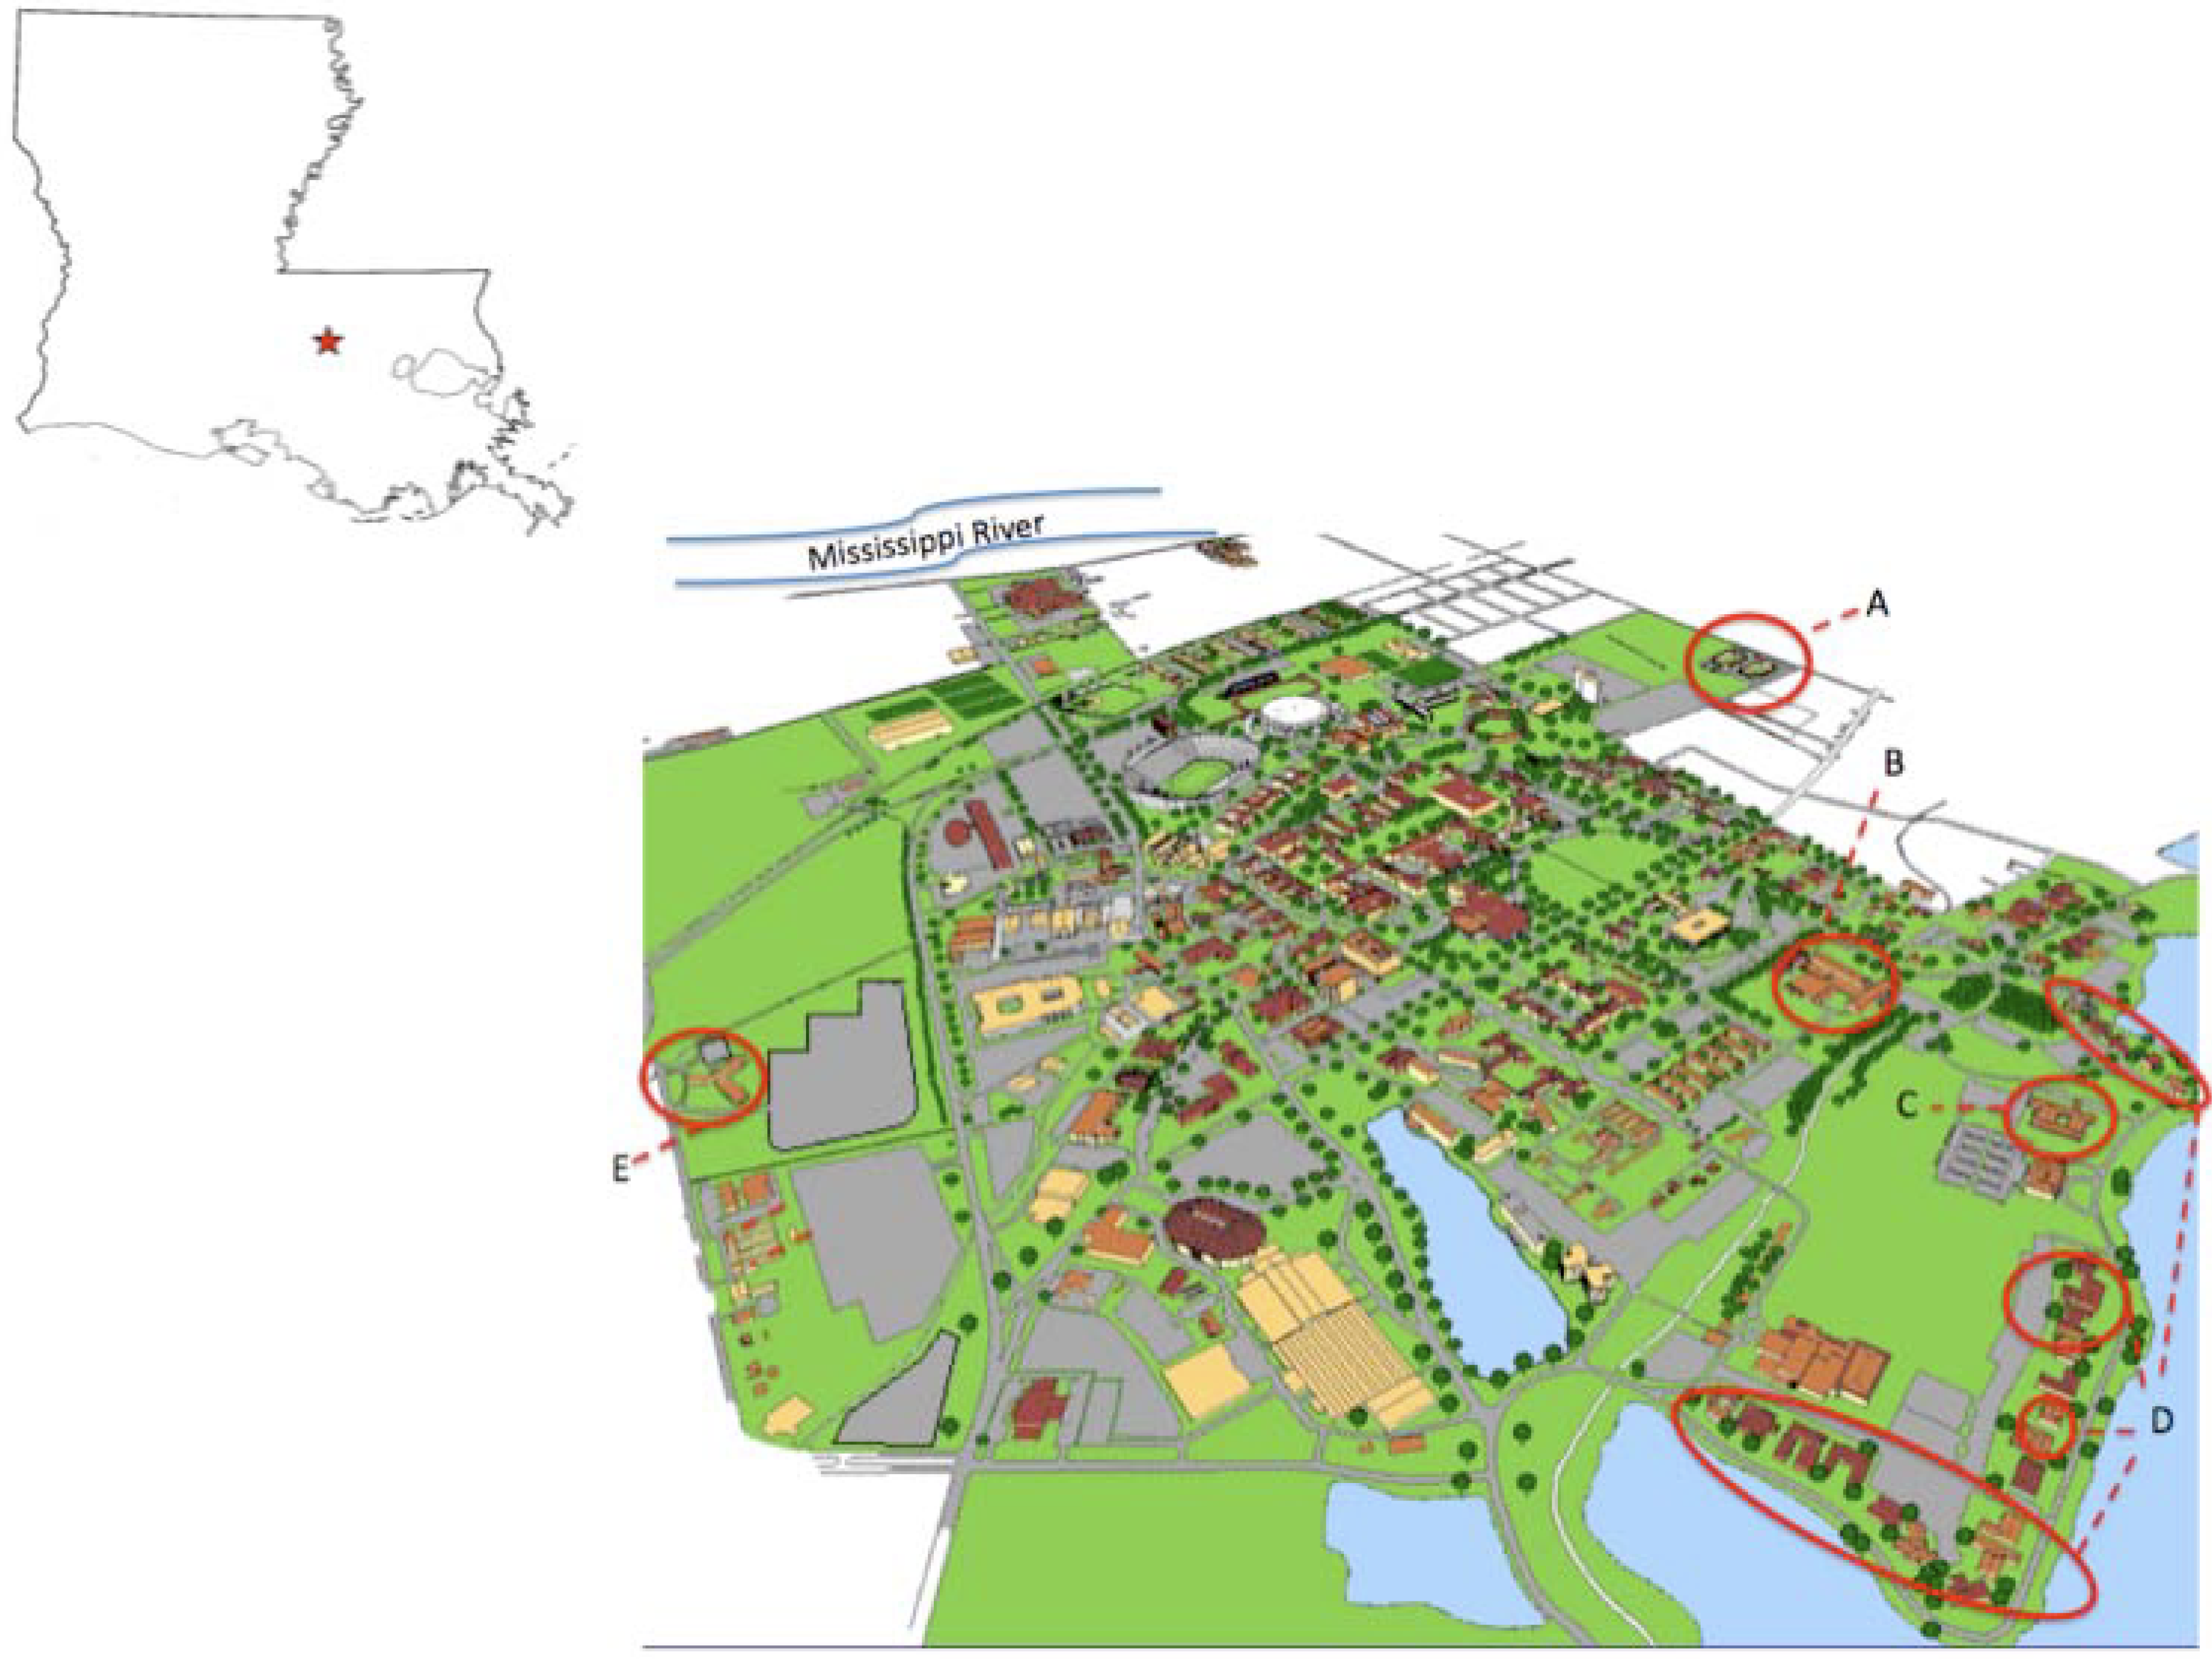
Figure 1.
Map of the LSU A&M main campus included in this study. The map in the upper left is the state of Louisiana with a red star denoting Baton Rouge. Red circles connected to a letter denote facilities that receive partial or no services accounted for in this GHG inventory. Details described in text. (A) Edward Gay apartments; (B) University High School; (C) LSU Systems office; (D) Fraternity and Sorority houses; (E) Child Care Center.
Several campus buildings rely only partially on on-campus provided utilities. Some buildings on the main campus are only partially accounted for in this study. These buildings (and the extent that they are included in the study are University High School (electricity usage included), LSU Systems office (natural gas usage included), fraternity and sorority houses (33% of natural gas usage included), and the campus child care center (electricity usage included). GHG emissions resulting from utility consumption in these buildings is only accounted for the services supplied to them via the campus powerhouse and co-generation facility (
Figure 1). Emissions resulting from energy use at the Edward Gay apartment complex are not included in this study. Emissions from electricity, heating, and cooling of the apartments likely contribute a small amount to total overall campus emissions. The LSU AgCenter, which is a separate organizational unit from LSU A&M, makes use of a considerable amount of building space on the LSU A&M main campus in Baton Rouge. For the sake of convenience, energy use and resulting emissions attributed to AgCenter operations on the main campus are considered a part of the overall LSU-Baton Rouge main campus GHG inventory.
The LSU GHG inventory operational boundary includes Scope 1, 2, and 3 GHG emissions as described by the World Business Council for Sustainable Development (WBCSD) and the World Resources Institute (WRI) guidelines in the GHG Protocol. Scopes are an accounting concept developed to define levels of responsibility for emissions. This approach assumes that the University’s responsibility for emissions is directly related to its control over, or ownership of, the sources of those emissions [
35]. Scope 1 emissions consist of all direct emissions from sources that are owned and/or controlled by the University on the LSU-A&M main campus. Scope 1 emissions include the production of electricity and steam from the campus co-generation power plant, university vehicle fleet fuel consumption, and fugitive emissions which include intentional and unintentional emissions released from equipment leaks including refrigerants. Agricultural emissions in the form of methane (CH
4) produced by campus livestock and nitrous oxide (N
2O) emissions resulting from fertilizer application on campus grounds are also considered Scope 1 emissions.
Scope 2 emissions are from sources that are neither owned nor operated by the University but whose products are directly linked to on-campus energy consumption. Indirect emissions sources that occur from the use of purchased electricity, heat, or steam are considered Scope 2 emissions. Scope 2 emissions are the result of imported/purchased electricity from the local utility provider and occurred where the energy was generated and not at the user site.
Scope 3 emissions include indirect emissions that occur as the result of outsourced activities. Scope 3 emissions are considered “optional” by corporate inventories because they originate from sources that are neither owned nor operated by the University but are either directly financed or otherwise linked to the campus via influence or encouragement. Scope 3 emissions included in this study are the result of solid waste disposal; directly financed air travel; faculty, staff, and student commuting; transportation and distribution losses from purchased electricity; and emissions resulting from campus wastewater treatment.
Scope 3 emissions resulting from outsourced activities on the LSU campus include total air travel miles accumulated by students, faculty, and staff as the result of official University business. The commuting activities of students, faculty, and staff, to and from campus as well as on-campus solid waste production and emissions associated with campus wastewater are included as Scope 3 emissions. Additional Scope 3 factors added to version 6.1, not reported in this study, were the amount and type of paper product consumption and fuels associated with student study abroad travel. We believe that the inclusion of these factors would have made little difference in total emissions.
Scope 3 boundaries recognized by the ACUPCC and the CACP calculator were used in this study. The study is neither an attempt at a life cycle assessment nor an embodied energy analysis of LSU [
36,
37]. Such studies would broaden the boundaries of the present study to include emissions produced from existing infrastructure construction, materials consumption, and include the emissions associated with the environmental impacts of these activities. Off campus energy consumption by campus community members was outside of the scope of this study. Emissions that occur during the production of materials consumed on campus (
i.e., production and transport costs of food and materials sold on campus) were also outside of the scope of this study. Others have recognized the importance of carefully specifying boundaries in studies of this type. For example, Murphy and Hall [
38] concluded the largest problem in performing energy return on investment analyses was boundary definition.
The temporal boundary of the study was Fiscal Year (FY) 2007–2008. Emissions produced were calculated based on the most up to date datasets available. Data collection was carried out from August 2008 through May 2009. The majority of the data was collected directly from campus personnel. Documentation of energy purchases made by campus personnel was the main source of data for the study. Information not obtained through campus personnel was gleaned from previous studies concerning campus consumption patterns and behavior. Several studies were consulted in order to estimate past and present campus energy consumption patterns. These studies included the Walker Parking Master Plan [
39] and the Solstice Consulting Report [
40] to the Easy Streets II working group. Specifically, these two reports included detailed analysis of past and present campus commuter habits including average distance of commute, numbers of commuters using the various modes of transportation, and overall demand for transportation alternatives to the personal automobile. Campus personnel and outside agencies provided the data on energy consumption used as inputs in the emissions calculator.
Upon completion of data collection and entry into the calculator, the emissions factor module automatically converted energy consumption source units to common units using prescribed emissions based on previous studies. An emissions factor is a unique value for scaling emissions to activity data in terms of a standard rate of emissions per unit of activity [
35]. For example, the combustion of one gallon of gasoline in an industry standard automobile as part of the University fleet in 2008 produced 8.7 kg CO
2, 0.002 kg CH
4, and 0.0006 kg N
2O. Emissions factors in the calculator are based on previous government studies of national GHG emissions conducted by the US Environmental Protection Agency (EPA), US Dept. of Transportation Statistics, and other US government documents. Since the emissions factors are already written into the calculator worksheet, adding data in common units (
i.e., MMBTU of natural gas, gallons of gasoline, pounds of nitrogen fertilizer,
etc.) is an important step necessary for accurate results. Unit conversion analysis was performed where necessary for raw data provided by campus personnel and in previously published reports. No emission factors were altered or “customized” in the calculator for this study. However, custom fuel mix data was entered into the Scope 2 data input module so as to accurately represent the emissions resulting from purchased electricity.
Emissions are reported in terms of metric tons CO
2 equivalents (MT CO
2e). MT CO
2e units allow for the comparison of emissions of various greenhouse gases based on their global warming potential (GWP). The CO
2 equivalent of a non-CO
2 gas is calculated by multiplying the mass of the emissions of the non-CO
2 gas by its GWP. Further conversion to carbon equivalents (CE) is achieved by multiplying CO
2e by 0.27, the ratio of the mass of carbon to the mass of CO
2. Global warming potentials and the estimated atmospheric lifetime for greenhouse gases included in this report are based on the 100-year time horizon established by the IPCC Second Assessment Report (SAR) [
15,
41].
3. Results
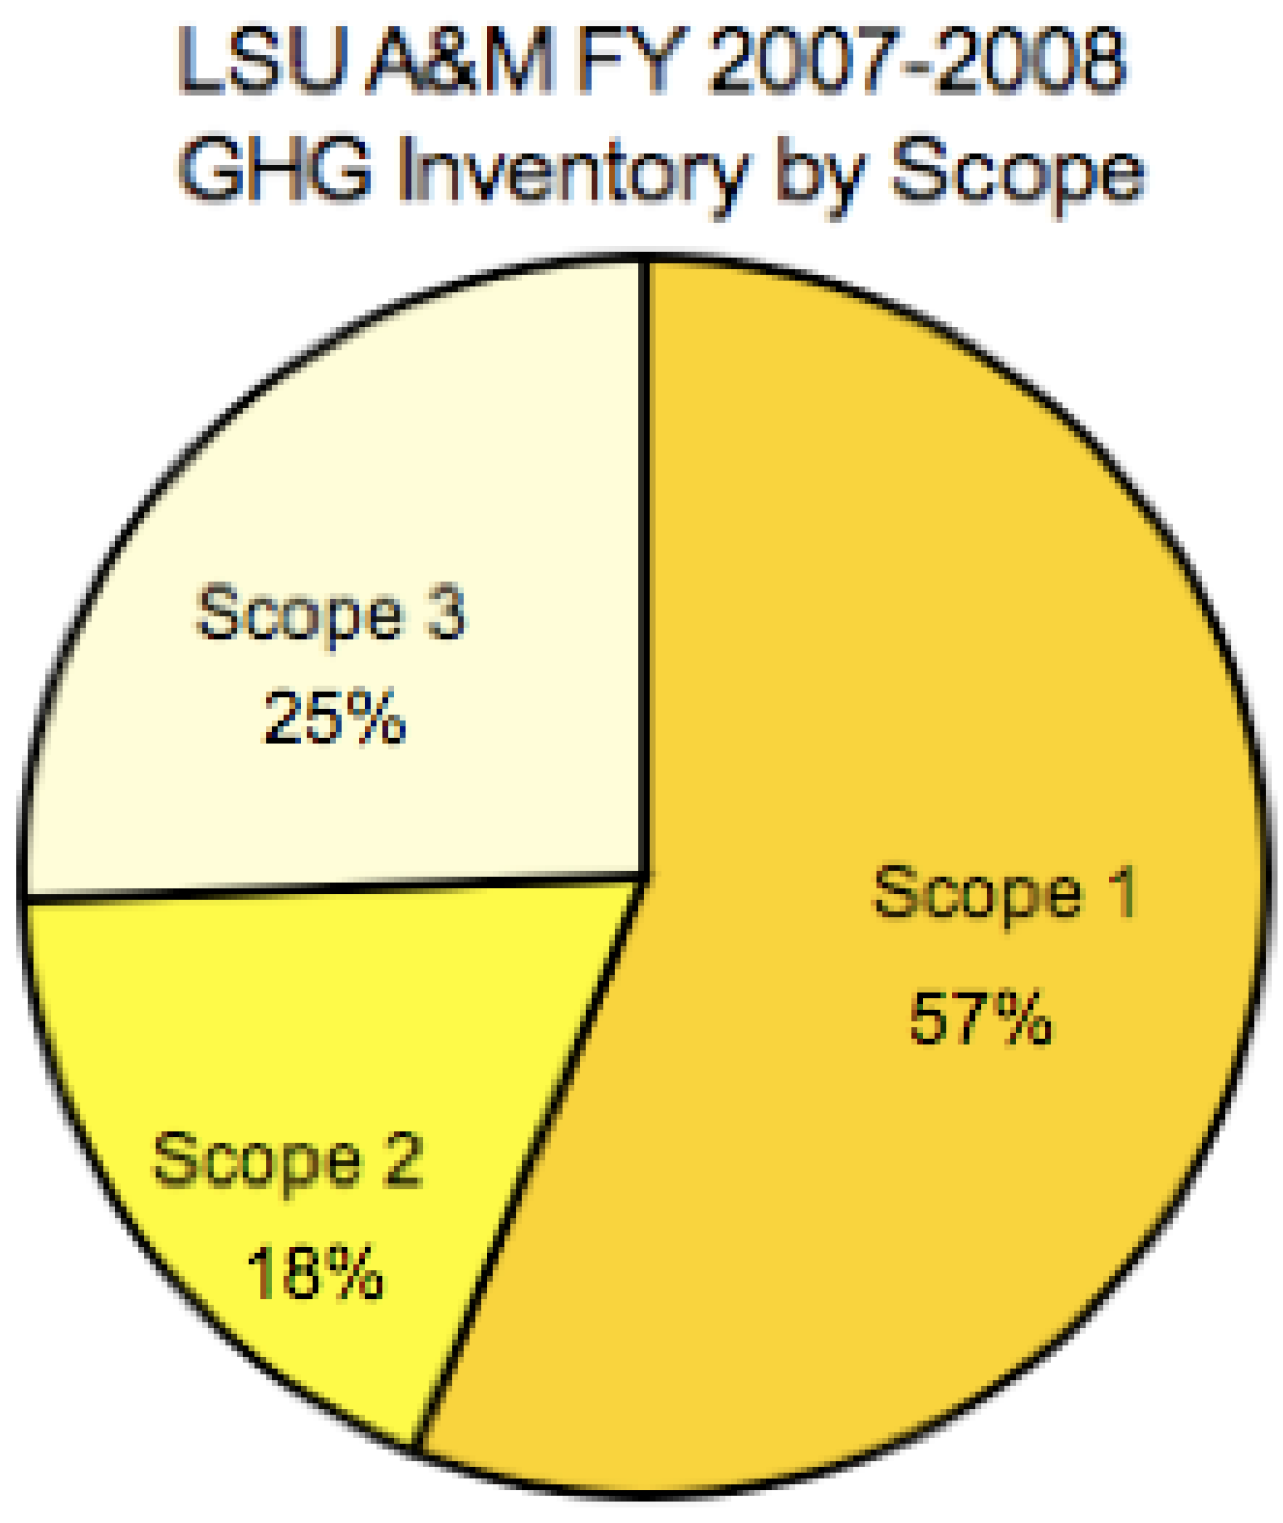
Total campus GHG emissions in FY 2007 were 162,742 MT CO
2e. The majority of emissions (57%) were the result of On-Campus Stationary source (Scope 1) electricity generation at the University Co-generation facility (
Figure 2). Purchased electricity (Scope 2) emissions accounted for 18% of the total and Scope 3 emissions accounted for the remaining 25%. Carbon dioxide was the most common greenhouse gas emitted followed by methane and nitrous oxide. Campus emissions are directly related to fuel source and overall energy usage on campus.
The co-gen plant generated 138,979,388 kWh of electricity in FY 2007 while the total purchased electricity from Entergy Gulf States was 65,406,232 kWh. The difference between generating that electricity with natural gas on campus versus purchasing it from Entergy and its variable source generation was a net emissions savings of approximately 13,897 MT eCO2.
Figure 2.
GHG emissions by scope for the LSU-Baton Rouge main campus FY 2007–2008. Scope 1 emissions are owned and/or controlled by the University on the LSU-A&M main campus. Scope 2 emissions are from sources that are neither owned nor operated by the University but whose products are directly linked to on-campus energy consumption. Scope 3 emissions include all other indirect emissions that occur as the result of outsourced activities.
3.1. Scope 1 Emissions—Direct Emissions
According to the LSU Office of Budget and Planning, the total university operating budget was $436.6 million in FY 2007. The research budget was $56.9 million of the total budget. The total campus community population of faculty, staff, and students was 33,235. The study does not account for members of the community employed by auxiliary services, such as contract laborers. Total building space on campus was 11.2 million square feet (ft2). Net research building space was 531,811 ft2.
The majority of Scope 1 and overall campus emissions result from basic infrastructure energy requirements in the form of lighting, heating, and cooling buildings. Maintaining campus-building infrastructure is largely dependent on the campus co-generation plant and Scope 1 emissions.
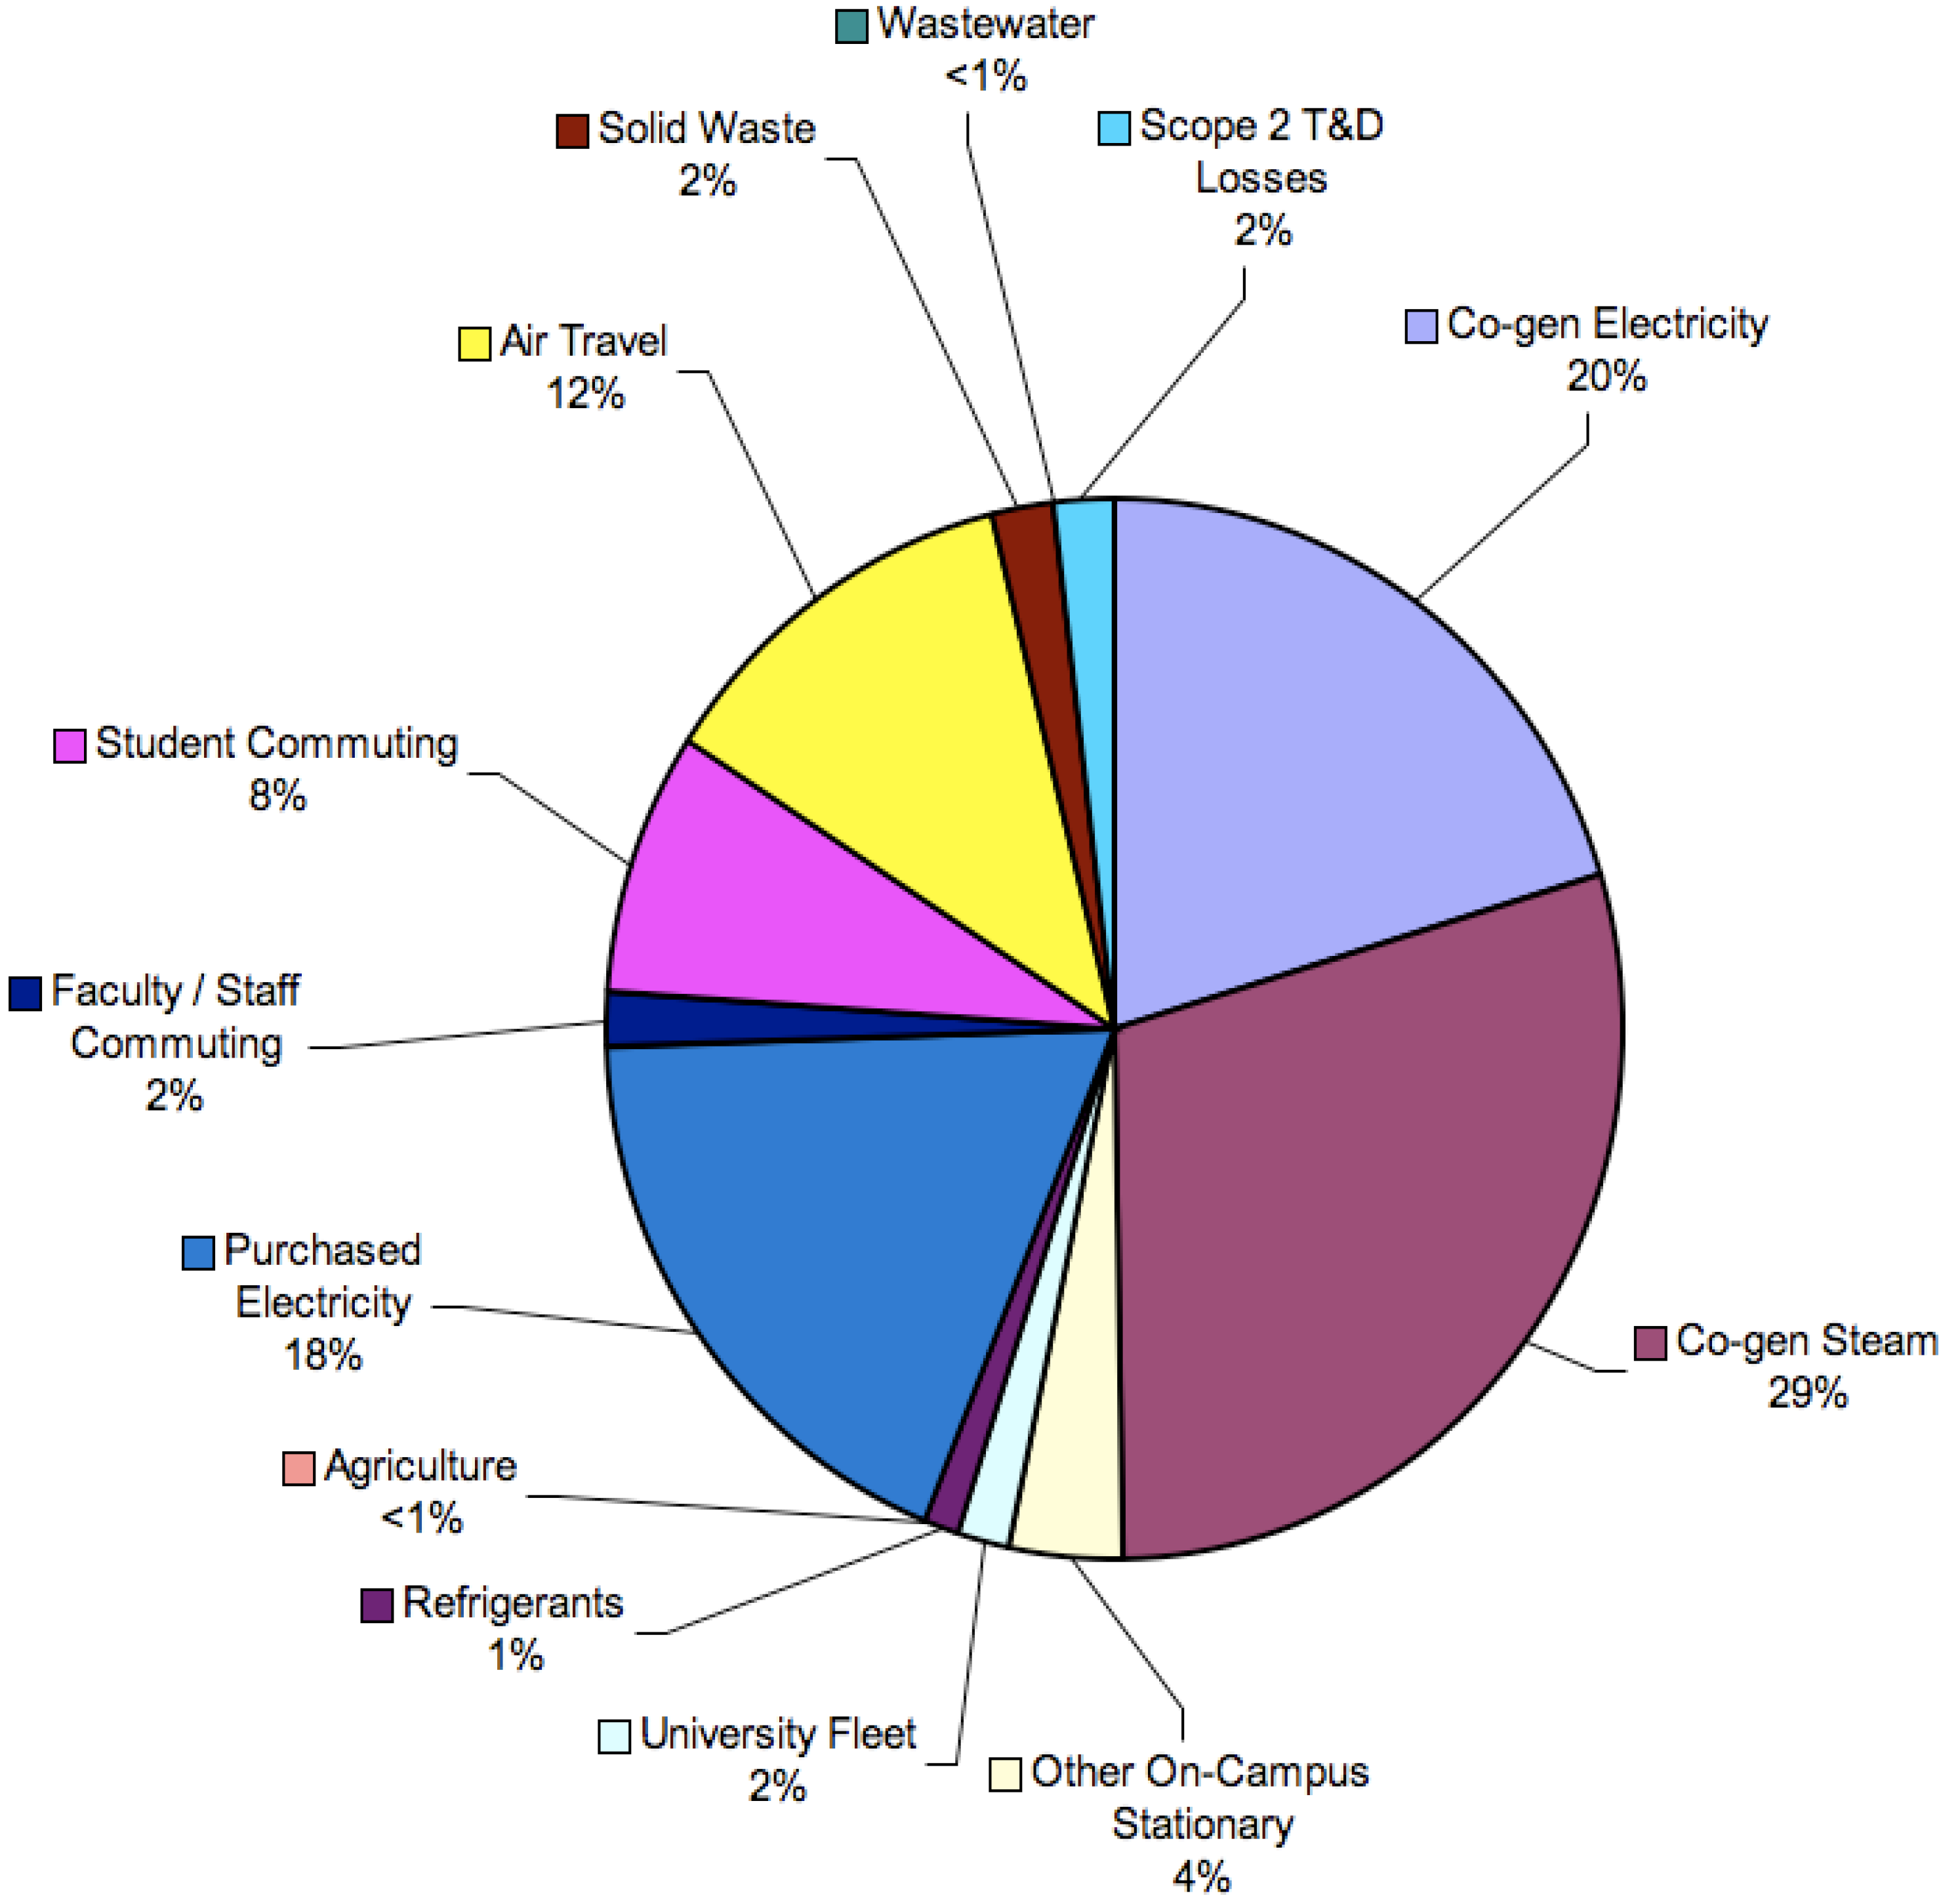
Co-gen steam production resulted in 47,811 MT CO
2e or 29% of total emissions. Steam produced at the co-gen facility is used to maintain appropriate building temperatures throughout campus 24-hours per day 365 days per year. Electricity production at the campus co-gen facility was the next largest contributor to Scope 1 campus GHG emissions and the 138,979,388 kWh generated accounted for 32,959 MTeCO
2 (20% of total emissions) in FY 2007 (
Figure 3).
Figure 3.
Percentage breakdown of LSU A&M GHG emissions by sector for FY 2007–2008.
Figure 3.
Percentage breakdown of LSU A&M GHG emissions by sector for FY 2007–2008.
The University fleet consumed more than 284,463 gallons of fuel during FY 2007. Estimated University fleet fuel consumption is based on purchased fuel from Fuelman, Inc. pumps located at University Stores on Skip Bertman Dr. and the 2008 LSU Vehicle Utilization and Maintenance Report. Since the University bus transportation service was outsourced to the Capitol Area Transit System (CATS), bus commuter fuel statistics are counted as part of Scope 3 emissions and not included as part of the University fleet.
Another aspect of the University fleet is the amount of diesel consumed for landscape services (mowers and tractors). Diesel purchases for this sector of campus services are estimated at 400 gallons per week during peak season (March–September) and 200 gallons per week during off-peak months (October–February). It is estimated that landscape services uses 15,200 gallons of diesel fuel annually. The 284,463 gallons of gasoline and the 22,338 gallons of diesel consumed by the University fleet, resulted in 2,764 MT CO2e or 1.6% of total emissions for FY ‘07–08’.
Fertilizers and livestock are the two sources of agricultural GHG emissions on campus. Personnel from several departments including University Recreation (UREC), Athletics, Landscape Services, and the campus golf course carry out fertilizer application across the approximately 1,000 acre main campus. It is estimated that approximately 20 tons of synthetic fertilizer (33% N) is applied to campus grounds annually. A percentage of this fertilizer is released into the atmosphere as the greenhouse gas, nitrous oxide (N2O), after application.
Campus GHG emissions resulting from livestock contained on the premises of the LSU Veterinary School are another agricultural source of emissions included as part of Scope 1 emissions. Many ruminant animals release CH4 due to the presence of microbes in their guts. Methane is also released during the decomposition of manure. Livestock are present in variable quantities throughout the year but were estimated to include 122 horses, 24 goats, and 15 dairy cows, based on personal communication with Veterinary School personnel. The combined total of GHG emissions resulting from campus agricultural sources is 186 MTeCO2.
The relative contribution of refrigerants to total campus greenhouse gas emissions is minor. R11 and R22 are the two main refrigerants used for cooling purposes on campus. R11 (which has a comparable GWP as HFC-143a) is a harmful greenhouse gas that has gradually been phased out of production since the enactment of the Montreal protocol but is still used in older campus co-gen chillers. R22 (HCFC-22) is another refrigerant used at the campus co-gen plant that is escapes into the atmosphere due to equipment leaks. Though campus co-gen administrators and maintenance personnel routinely check equipment to maintain optimal performance, leaks occur. In FY 2007, 2,300 pounds of R22 was released. This leak resulted in 1,774 MT CO2e being released into the atmosphere.
3.2. Scope 2 Emissions—Off Campus Stationary Source Emissions
Purchased electricity was the only Scope 2 emission factor accounted for in this study. The University purchases electricity from Entergy Gulf States Louisiana LLC. Purchased electricity is produced using a variety of methods (coal, natural gas, nuclear, distillate oil, etc.) in varying proportions from year to year. In FY 2007, the University purchased 65,406,232 kWh of electricity. 62.28% of this electricity was purchased by Entergy through a third party, 19.42% was generated via natural gas, 10.74% was generated via coal fired power plants, 7.52% was generated via nuclear energy, and 0.04% was generated via distillate oil. The emissions that resulted from the production of this electricity was 30,002 MT CO2e or 18% of the annual total.
3.3. Scope 3 Emissions—Indirect Emissions
Emissions resulting from air travel by faculty, staff, and students on official University business were based on information obtained from Carson Wagonlit Travel, the state travel agency. The information provided includes departmental air travel miles from December 2007 through November 2008 for LSU (20,659,291), LSU Athletics (4,204,646), and the LSU Law Center (118,937). Air travel by campus personnel resulted in 19,395 MTeCO2 emissions in FY 2007.
Private automobiles are the primary mode of transportation on the LSU campus. Emissions resulting from commuter travel to and from the University are based on several previous studies conducted by private contractors and University personnel. The 2005 transportation and parking study estimated commuter students as the difference between the total number of enrolled students and resident students [
40]. The study estimated the student commuter population at 24,718 students in FY 2005–2006. A survey of students, faculty, and staff concerning campus transportation was conducted with a total of 8,738 respondents. 72% of the campus community responded that they commute alone via private automobile. 12.1% responded that they carpool with one or more people and 0.8% said they commute on a motorcycle. 7.1% ride the bus, 5.9% of respondents were pedestrian commuters, and 2.1% commuted on a bicycle. Approximately 80% of the University community lives within 4 miles of campus.
Annual GHG emission estimates for commuters are based on national statistics for average vehicle fuel mileage and percent total cars and light trucks (pickups, vans, and SUVs) in the fleet. Average commuting distance for students, faculty, and staff is estimated to be 4 miles [
39]. The majority of campus commuters make one round trip to and from campus each day for a total of 8 miles per trip.
It is estimated that student commuters drove or rode in private automobiles for a combined total of 30,671,424 miles and consumed 1,387,847 gallons of gasoline based on the industry standard average automobile fleet fuel efficiency of 22.4 miles per gallon. Student bus commuters rode approximately 2,385,555 miles consuming approximately 60,134 gallons of diesel. The operating expense for campus buses was $1.29 per passenger trip for 2005–2006 [
42]. During that same year, average fuel prices at the pump in Louisiana were $2.07 per gallon for gasoline and $2.15 for diesel. Assuming commuters were traveling a distance of four miles each way, they consumed a gallon of gas every 5.6 trips in a private automobile. Student commuters accounted for 12,991 MT CO
2e while faculty/staff commuters accounted for 2,582 MT CO
2e in FY 2007. The CACP calculator does not readily allow for the specification of commuter students
versus resident students who presumably do not drive to and from campus daily. Therefore, an overestimation in commuter emissions may be assumed to be inherent in the reported results.
In FY 2007, LSU produced 11,432 tons of solid waste. Campus waste is transported and deposited in a landfill in Walker, LA. The landfill flares the methane produced during waste decomposition. Solid waste disposal emissions were 2,934 MT CO2e. The University produced approximately 612,000,000 gallons of wastewater in FY 2007. Campus wastewater is pumped to the East Baton Rouge Parish central wastewater treatment facility that uses aerobic methods for treatment. Wastewater treatment during FY 2007 resulted in approximately 295 MT CO2e in emissions.
4. Discussion
Previous research has shown purchased electricity and co-gen production facilities are the major emission sources from University campuses [
42]. A large percentage (57%) of LSU A&M campus emissions are directly controlled by the University as Scope 1 emissions. The University may influence the future of campus emissions through policy measures that reduce campus energy consumption. Efforts towards reducing energy consumption often require increased management aided by technology. One such effort is the Metasys and Building Automation System that currently aid energy conservation efforts on campus. This computer-based system allows for personnel to alter heating, air conditioning, and lighting in buildings campus-wide with the touch of a button from any computer equipped with the proper system software. The system is enhanced further when campus personnel are aware of present outside temperature conditions and future forecasts. Being prepared (
i.e., switching on/off HVAC units) before forecasted drops or rises in outside temperatures is an energy conservation measure currently being utilized by campus personnel. Public education through dorm energy competitions like the one carried out in the spring of 2009 raise the level of awareness on campus regarding the increased need for energy conservation.
One major factor of interest is how campus emissions are affected as a result of campus co-gen produced electricity. Electricity produced with natural gas at the cogeneration facility results in less GHG emissions than electricity purchased from the local utility with variable source production including natural gas, coal, nuclear, and distillate oil.
Since natural gas is a cleaner source fuel when it comes to GHG emissions, the University has effectively reduced emissions by shifting away from “dirtier” source fuels such as coal and distillate oil. Entergy Gulf States Louisiana decreased the percentage of natural gas used as a source fuel to produce electricity between 2001 (45.4%) and 2007 (19.4%). The 25% decrease in natural gas usage has probably come due to a rise in the wellhead price of natural gas during this same time period. There have been periods in which the campus co-gen facility was shut down and electricity was purchased directly from Entergy Gulf States due to the prohibitively expensive price of natural gas (July 12, 2008–August 26, 2008). However, recent additional natural gas discoveries [
43] may lead to cheaper gas prices, at least in the short run.
Utilities are the single largest contributor to the GHG emissions of the university, as is the case for most universities [
4,
42]. The costs of utilities are important since energy costs are directly related to the institution’s most basic operating costs. These operating costs are the required energy and financial costs of keeping the lights on and buildings heated and cooled. It is assumed that the most effective lowest cost fuel is the preferred source fuel. Recent price volatility in energy markets and policies that impose carbon taxes on fossil fuels may increase the attractiveness of alternative energy sources. Many of the externalities associated with fossil fuels may be internalized in the cost of future fossil fuel production. Also, a single energy source fuel makes the institution more vulnerable to an individual fuel price increase as opposed to an institution that has a diverse energy portfolio. As the cost of fossil fuel energy increases, these costs will be born by the consumer, University students in this case. Education will become more expensive. In the long run, the costs of converting to renewable energy sources are likely to become more attractive as fossil fuel prices rise due to scarcity and the environmental costs associated with their production and consumption. Increases in the price of fossil fuels may also lead to increased energy conservation efforts.
Presumably, some institutions have no choice but to rely on the cheapest most convenient energy source available due to budgetary constraints. Institutions that rely heavily on fossil fuels and “dirty” energy sources may willingly accept a change to cleaner source fuels if subsidies are taken away from fossil fuels and directed towards renewable energy. Wealthy, pro-active institutions will likely lead the way in this transition. Increasing fossil energy scarcity is likely to lead to higher costs and greater interest in alternatives. Increased diversity of the campus energy portfolio will likely become a more sustainable way to decrease emissions.
The next largest contributor to campus emissions is often student, faculty, and staff commuter populations. LSU benefits from a commuter population that lives closer to campus (average of approximately 4 miles) than many similar sized universities like the University of Maryland where commuters travel an average of 16 miles each way to campus [
42]. However, parking permits on the LSU campus are extremely cheap when compared to other universities. The lowest annual parking permit price at LSU was $61 in 2007 [
41]. This falls short as a revenue stream when compared to the $384 charged at the University of Minnesota or the $170 charged at North Carolina State University during the same year [
41]. Revenues gained from parking and transportation are an obvious tool that can be used to influence commuter behavior and raise revenues in the form of green fees to help facilitate campus sustainability projects. Commuter options should be expanded and planned with this in mind. Developing safe, accessible bicycle transportation corridors and more convenient public transportation would help relieve campus traffic congestion while also decreasing commuter emissions.
Recent national policy discussions regarding increasing fuel efficiency standards for automobiles may also decrease commuter emissions. Hypothetically, if all private automobile commuters drove the 2009 Toyota Prius the resulting emissions would be 9,781 MTCO2e. If all students who drove personal automobiles instead rode the bus, student commuter emissions would decline to 8,703 MTCO2e. On the other end of the fuel efficiency spectrum, if these commuters had been driving the 2009 Hummer H3, the result would be 27,877 MTCO2e in total emissions.
Air travel miles are another large contributor to campus emissions and may be the leading contributor of GHG emissions on many campuses after purchased electricity and co-generated power [
39]. Decreasing air travel can be accomplished by increasing the use of conference calls and telecommunications technology such as video-conferencing.
The potential for renewable energy production on LSU’s main campus is large and the payback period may be made shorter as a result of scale and recent legislation offering tax breaks to investors in the technology. In particular, solar is a viable way to generate renewable energy on campus [
44]. The potential for wind energy to provide electricity in Louisiana is only feasible offshore [
44,
45] but an interconnected grid may make this a viable alternative. Electricity generated from solar panels would be required to produce upwards of 15,000,000 kWh per month or 500,000 kWh per day at current peak consumption levels. On average, the system should provide 5,450,519 kW/month or 181,684 kW/day. Purchasing renewable energy from Entergy via their Geaux Green program is also an option although often times the money contributed to such a fund does little in the way of spurring renewable energy production [
46].
A photovoltaic array suitable to generate average campus electricity consumption of 5,450,519 per month would require a 36,336 kW solar electric array. The cost of such a massive electricity production plant at $12,000 per kW would be $436,032,000, which is slightly less than the entire FY 2007 University operating budget. Clearly, this price should be seen as an overestimate since an economy of scale suggests a considerable decrease in price per kW when purchasing large amounts of solar photovoltaic panels. However, based on the 20,000,000 kWh energy budget of FY 2007–2008, the payback period at the $12,000/kW price range would be 22 years. A solar option is to install a smaller system designed to meet peak needs reducing the capacity necessary from the University co-gen facility.
Another alternative to decrease campus energy consumption and emissions is to transition from a five day to a four-day workweek. Daily campus energy consumption for the year 2008 suggests that electricity consumption decreases by about 63,000 kWh per day on weekends as compared to weekdays. This sums to a 52-day annual electricity savings of 3,276,000 kWh. Associated emissions reductions from co-gen electrical production would be 455 MT CO2e or 1503 MT CO2e for purchased electricity. This savings does not include indirect emissions that would also be avoided by the campus commuter population.
A comparative analysis between LSU and several other universities was conducted in order to gauge emissions as they relate to other institutions. The analysis used published accounts of institutional data obtained from the ACUPCC website [
4]. It is important to keep in mind that no one standard method for reporting GHG emissions has been set forth [
47]. Institutions are of variable size, use different sources for energy production, are in different climates, and contain different operational boundaries. However, all institutions cited below have posted GHG inventory reports containing Scope 1, 2, and 3 emissions.
Table 1.
Comparison of select higher education institutions and their GHG emissions as reported for FY 2007−2008 unless other year specified [
4].
Table 1.
Comparison of select higher education institutions and their GHG emissions as reported for FY 2007−2008 unless other year specified [4].
| University | Total Student Enrollment | Gross Emissions
(MT CO2e) | Emissions per 1000 ft2
(MT CO2e) | Emissions per Student
(MT CO2e) |
|---|
U. Illinois
Urbana-Champaign | 42,102 | 522,757 | 26 | 12.4 |
| U. North Carolina | 25,895 | 518,469 | 29.6 | 20 |
| U. Florida | 47,178 | 432,136 | 24.8 | 9.2 |
| U. Maryland-College Park (FY2006–2007) | 32,467 | 351,144 | 27.7 | 10.8 |
| U. Tennessee | 26,803 | 268,449 | 20 | 10 |
U. Arizona
(FY2008–2009) | 38,057 | 226,839 | 21.1 | 6 |
| U. Colorado-Boulder | 29,988 | 170,240 | 17.6 | 5.7 |
| Louisiana State U. | 28,019 | 162,742 | 14.5 | 6.1 |
| U. Arkansas | 14,939 | 158,468 | 29.8 | 10.6 |
| Clemson U. | 17,585 | 139,080 | 20.8 | 7.9 |
| U. Vermont | 11,497 | 67,705 | 13.7 | 5.9 |
Results show that LSU is on the lower end of the emissions spectrum when compared to similar sized regional universities. The relatively low GHG emissions of the University are due in part to the mild climate of southern Louisiana. The University experiences a low number of Heating Degree Days (HDD) when compared to institutions in more northern latitudes. The energy required to heat a building is generally more than that required to cool a building due to the larger differentiation in degrees from the 68 degree mean used to determine HDD and cooling degree days. Also, Universities including LSU experience a decrease in building occupancy during the summer months and are able to save on energy expenditures compared to buildings occupied during the traditional academic year (Fall and Spring semesters). Strategic planning can replace capital-intensive projects as a means to cut down campus emissions. Consolidating classes and offices to increase building occupancy in the more modern energy efficient buildings on campus is one way to avoid excess energy costs especially during summer semesters. Shutting down the campus on Fridays and moving to a four day workweek would also significantly decrease energy demand.
Greenhouse gas reductions on campus may be strategically planned or be required as a result of budget shortfalls. The cost of sustaining and maintaining present infrastructure is likely to rise in the future. LSU currently has over $235 million in deferred maintenance costs with an additional $20 million added to this total annually [
48]. Campus planning and management for sustainability may only be as good as our understanding of energy requirements and energy affordability in the future.
The comprehensive GHG inventory of the University, including all indirect emissions, is greater than the emissions presented in this study. Emissions resulting from campus land use change and emissions incurred by third party contractors hired by the University to carry out projects are not included. The materials demand generated by the University is also largely unaccounted for in this study. A life-cycle assessment and/or embodied energy analysis would allow for a greater understanding of more of the indirect emissions not accounted for in Scope 3 of this emissions inventory. A life cycle assessment would also expand our understanding of the environmental impacts associated with energy and materials consumption. The GHG protocol is currently developing a standard, similar to a life cycle assessment, in order to more clearly define Scope 3 emissions. Meanwhile, direct campus energy usage and emissions will need to be curtailed on the path towards sustainability.


