Energy Return on Investment for Norwegian Oil and Gas from 1991 to 2008

Abstract
: Norwegian oil and gas fields are relatively new and of high quality, which has led, during recent decades, to very high profitability both financially and in terms of energy production. One useful measure for profitability is Energy Return on Investment, EROI. Our analysis shows that EROI for Norwegian petroleum production ranged from 44:1 in the early 1990s to a maximum of 59:1 in 1996, to about 40:1 in the latter half of the last decade. To compare globally, only very few, if any, resources show such favorable EROI values as those found in the Norwegian oil and gas sector. However, the declining trend in recent years is most likely due to ageing of the fields whereas varying drilling intensity might have a smaller impact on the net energy gain of the fields. We expect the EROI of Norwegian oil and gas production to deteriorate further as the fields become older. More energy-intensive production techniques will gain in importance.1. Introduction
Oil and gas are the lifeblood of contemporary industrial states, and their economies, and our global population has grown more or less in parallel with increases in the use of oil and gas. New concerns about “peak oil” raise serious questions about the future viability of oil and gas and of the economies based upon them [1-3]. Perhaps of equal concern is the increasing difficulty in obtaining oil and gas, both in terms of monetary costs and, of particular interest here, energy extraction costs. We need a consistent way of thinking about the meaning of the impacts of these factors on the magnitude of the future availability of various fuels. A critical issue missing from this debate is not how much oil is in the ground, or how much we might be able to extract, but rather how much we can extract with a significant energy surplus. In other words, what we need to know is the net, not gross, energy availability from oil. A second, related issue is the role of technology, which some argue can offset the depletion of easily accessible oil and gas reserves (generally with high EROI and therefore high net energy flows) by advances that allow the exploitation of more technically-challenging resources. But how energy intensive is advanced technology, especially when applied to challenging environments, and how does it affect net energy gain? Can the net energy gain from unconventional fields ever realistically offset the losses caused by depletion in conventional production?
The increasing energy cost of getting energy is perhaps best expressed as EROI (energy return on (energy) invested). EROI analysis offers a useful approach for looking at the advantages and disadvantages of a given fuel, its changes over time, and offers the possibility of looking into the future in a way that markets seem unable to do. Its advocates also believe that, in time, market prices must approximately reflect comprehensive EROIs, if appropriate corrections for quality are made and subsidies removed. Nevertheless we hasten to add that we do not believe that EROI by itself is necessarily a sufficient criterion by which judgments might be made, although it is the one we favor the most, especially when it indicates that one fuel has a much higher or lower EROI than others. In addition it is important to consider the present and future magnitude of the fuel, and how EROI might change if the use of a fuel is expanded. These concerns are developed in various ways in a series of older and recent papers that we and others have produced and that are reflected in this study [4-9].
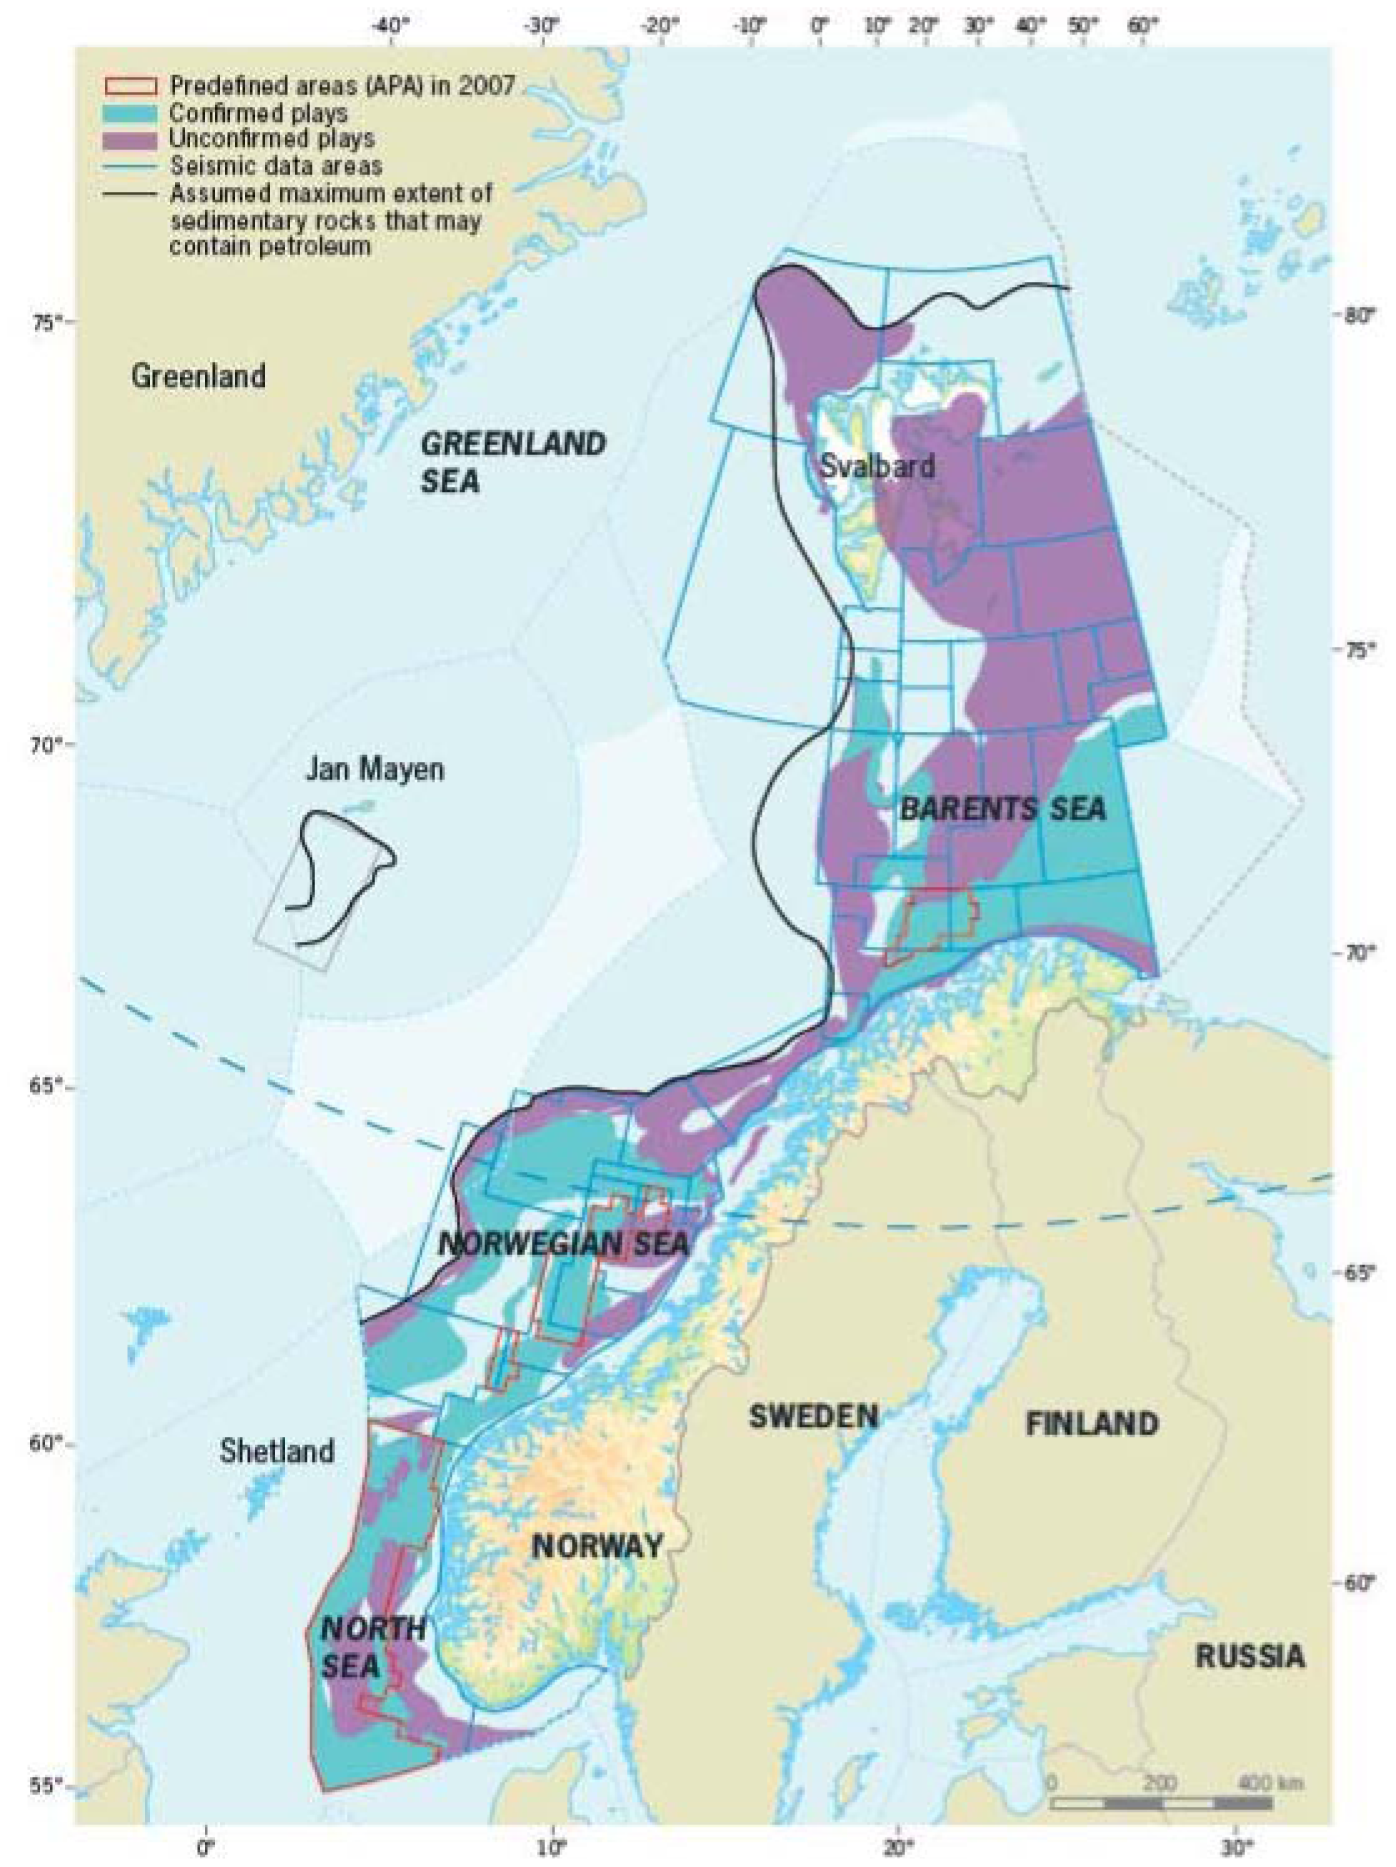
The North Sea oil fields, discovered in the 1960s, represent one of the few major global oil developments in recent decades. There are about 400 fields in the North Sea, most producing oil, gas condensate and natural gas liquids. Collectively, these products are called petroleum. The overwhelming majority of the volume of North Sea oil is in the United Kingdom and Norway, with small amounts in Denmark and the Netherlands. Some fields are quite large. In Norway (Figure 1), for example, there are a total of 22 fields each containing over 500 million barrels of original recoverable resources (Table 1). Likewise, in England there are a number of very large fields such as Brent and the Forties. The large fields were developed first and were extremely profitable. As of 2010, Norway is still reaping enormous financial profits from these fields but the production in both the English and Norwegian sectors has clearly peaked (for oil in 1999 and 2000 respectively, and now in terms of all energy production). These fields saved England from serious economic decline in the 1980s. The recent decline in production has been a serious contributor to the recent difficult economic and political conditions of the UK. The oil transformed Norway from a poor country to a wealthy one, especially since there are far fewer people in Norway to share the oil wealth. It is important to judge the past, present and future of these oil fields in both economic terms and in terms of their ability to provide net energy to their respective countries [12].
2. EROI
EROI is a tool used in net analysis. EROI is a simple but powerful way to examine the quality of an energy resource. What really matters to our economies is the net energy flow (not the gross) provided by our energy sector and this can be estimated through the EROI approach. EROI is calculated from the following simple equation, although the devil is in the details [6,15]:
Sometimes this equation is applied to finding energy, sometimes for producing it, and most usually and appropriately for both. It should not be used for computing the efficiency of, for example, going from crude oil to gasoline.
Getting values for the numerator is usually easy enough, at least in open societies. Estimates of the fuel produced, usually given in barrels or cubic feet, are multiplied by approximate energy values for that fuel (approximately 6.1 GJ per barrel of oil and 36 GJ per cubic meter of natural gas depending on the characteristics of the fuels).
Generating values for the denominator is usually difficult. The United States and the United Kingdom maintain official public records on the energy use of various sectors of the economy, including the oil and gas industry. These values are published approximately every five years. Data quality is often good. They apply to the entire national industry so it is difficult to see what they might be for particular projects. Brandt [9] has undertaken analyses for specific oil fields in California, but such analyses are rare. Table 2 is a summary of all EROIs for oil and gas that we are aware of. In general, the EROI for extraction of oil and gas for the United States has been decreasing from probably very high, although estimates in the early part of the last century are poorly known, to about 30:1 in the middle of the last century to roughly 10:1 or less today. This pattern is complicated by the tendency of EROIs to increase and decline in a pattern opposite to drilling intensity-in other words, doubling drilling intensity approximately halves the EROI value relative to the secular trend [4,16]. Global values have tended to be about twice as high as US values but are declining similarly [8].
One would think that there would be a good database detailing the energy cost of all of the energy we exploit, since it seems very important to examine this process over time. One might even imagine that such data might be amongst the most important information our entire civilization needs to know. Unfortunately this is not the case, as there are only a few countries that maintain the raw data and make it public, let alone analyze EROI or insure quality control. In addition, there are large economic vested interests and political constituencies who argue that market prices alone are the best way to evaluate and rank fuels, and that scientific analyses undermine the “wisdom of the market”. An even larger problem is that a large proportion (roughly half globally) of oil is produced by national oil companies (NOCs), which show little interest in making any of their information public or having it audited. What we do have is:
Reasonably good data for the United States (but with declining comprehensiveness and perhaps quality), which has maintained for many years statistics on the energy used by all major industries, including oil and gas [19-22].
Similar data for the United Kingdom for a less extended period of time [23,24].
A fairly good database on dollar costs for a large majority of publicly traded oil and gas companies maintained by John S. Herold Incorporated (now IHS) [25]. In a previous paper we were able to derive energy intensities per dollar spent for the U.S. and the U.K. [8]. We combined these with the Herold data to estimate global energy costs of oil and gas extraction.
It would be useful to derive estimates from specific oil and gas fields to examine their EROI against the aggregate national values discussed above. We could also use this analysis to examine the impact of technology vs. that of depletion. While we do not know how either effect can be derived independently, their combined impact can be estimated by the time trend in EROI. In other words, there is a sort of “race” in which technological advancement is in constant contention with depletion. The question of which is “winning” cannot be answered theoretically, but must be addressed empirically [26, 27]. We do this by assessing the time trends in the efficiency (i.e., EROI) with which we produce oil and gas. We need to know how much energy is returned to society in the form of oil and gas compared to that which is invested by the industry in getting it, and how that ratio is changing over time. If the energy return on that invested by the industry is increasing over time, then we would have evidence that new technologies are currently outpacing depletion, and vice versa. The rate of change of EROI may also give us some indication of how close we are to the critical point at which it takes as much energy to extract the resource as we gain through its production [7, 28]. Hence we use as our working hypothesis that the EROI of Norwegian oil and gas is declining. If this were true, it would indicate that depletion is more important than technological advancement in the Norwegian oil and gas industry, at least so far.
3. Methods
We use equation 2 to estimate the EROI of Norwegian oil and gas over the period of their production. The sum total of energy inputs and outputs over the life of most oil and gas fields is unknown simply because most oil and gas fields are still in production. For this reason we use a annual average calculation of EROI, that is, we divide energy output of the Norwegian oil and gas industry (Eo, in MJ) in a given year by the energy input to the oil and gas extraction industry for that same year (Ei, in MJ). Hence:
Where all terms are for a particular year, or more usually for a series of years.
3.1. Energy Outputs
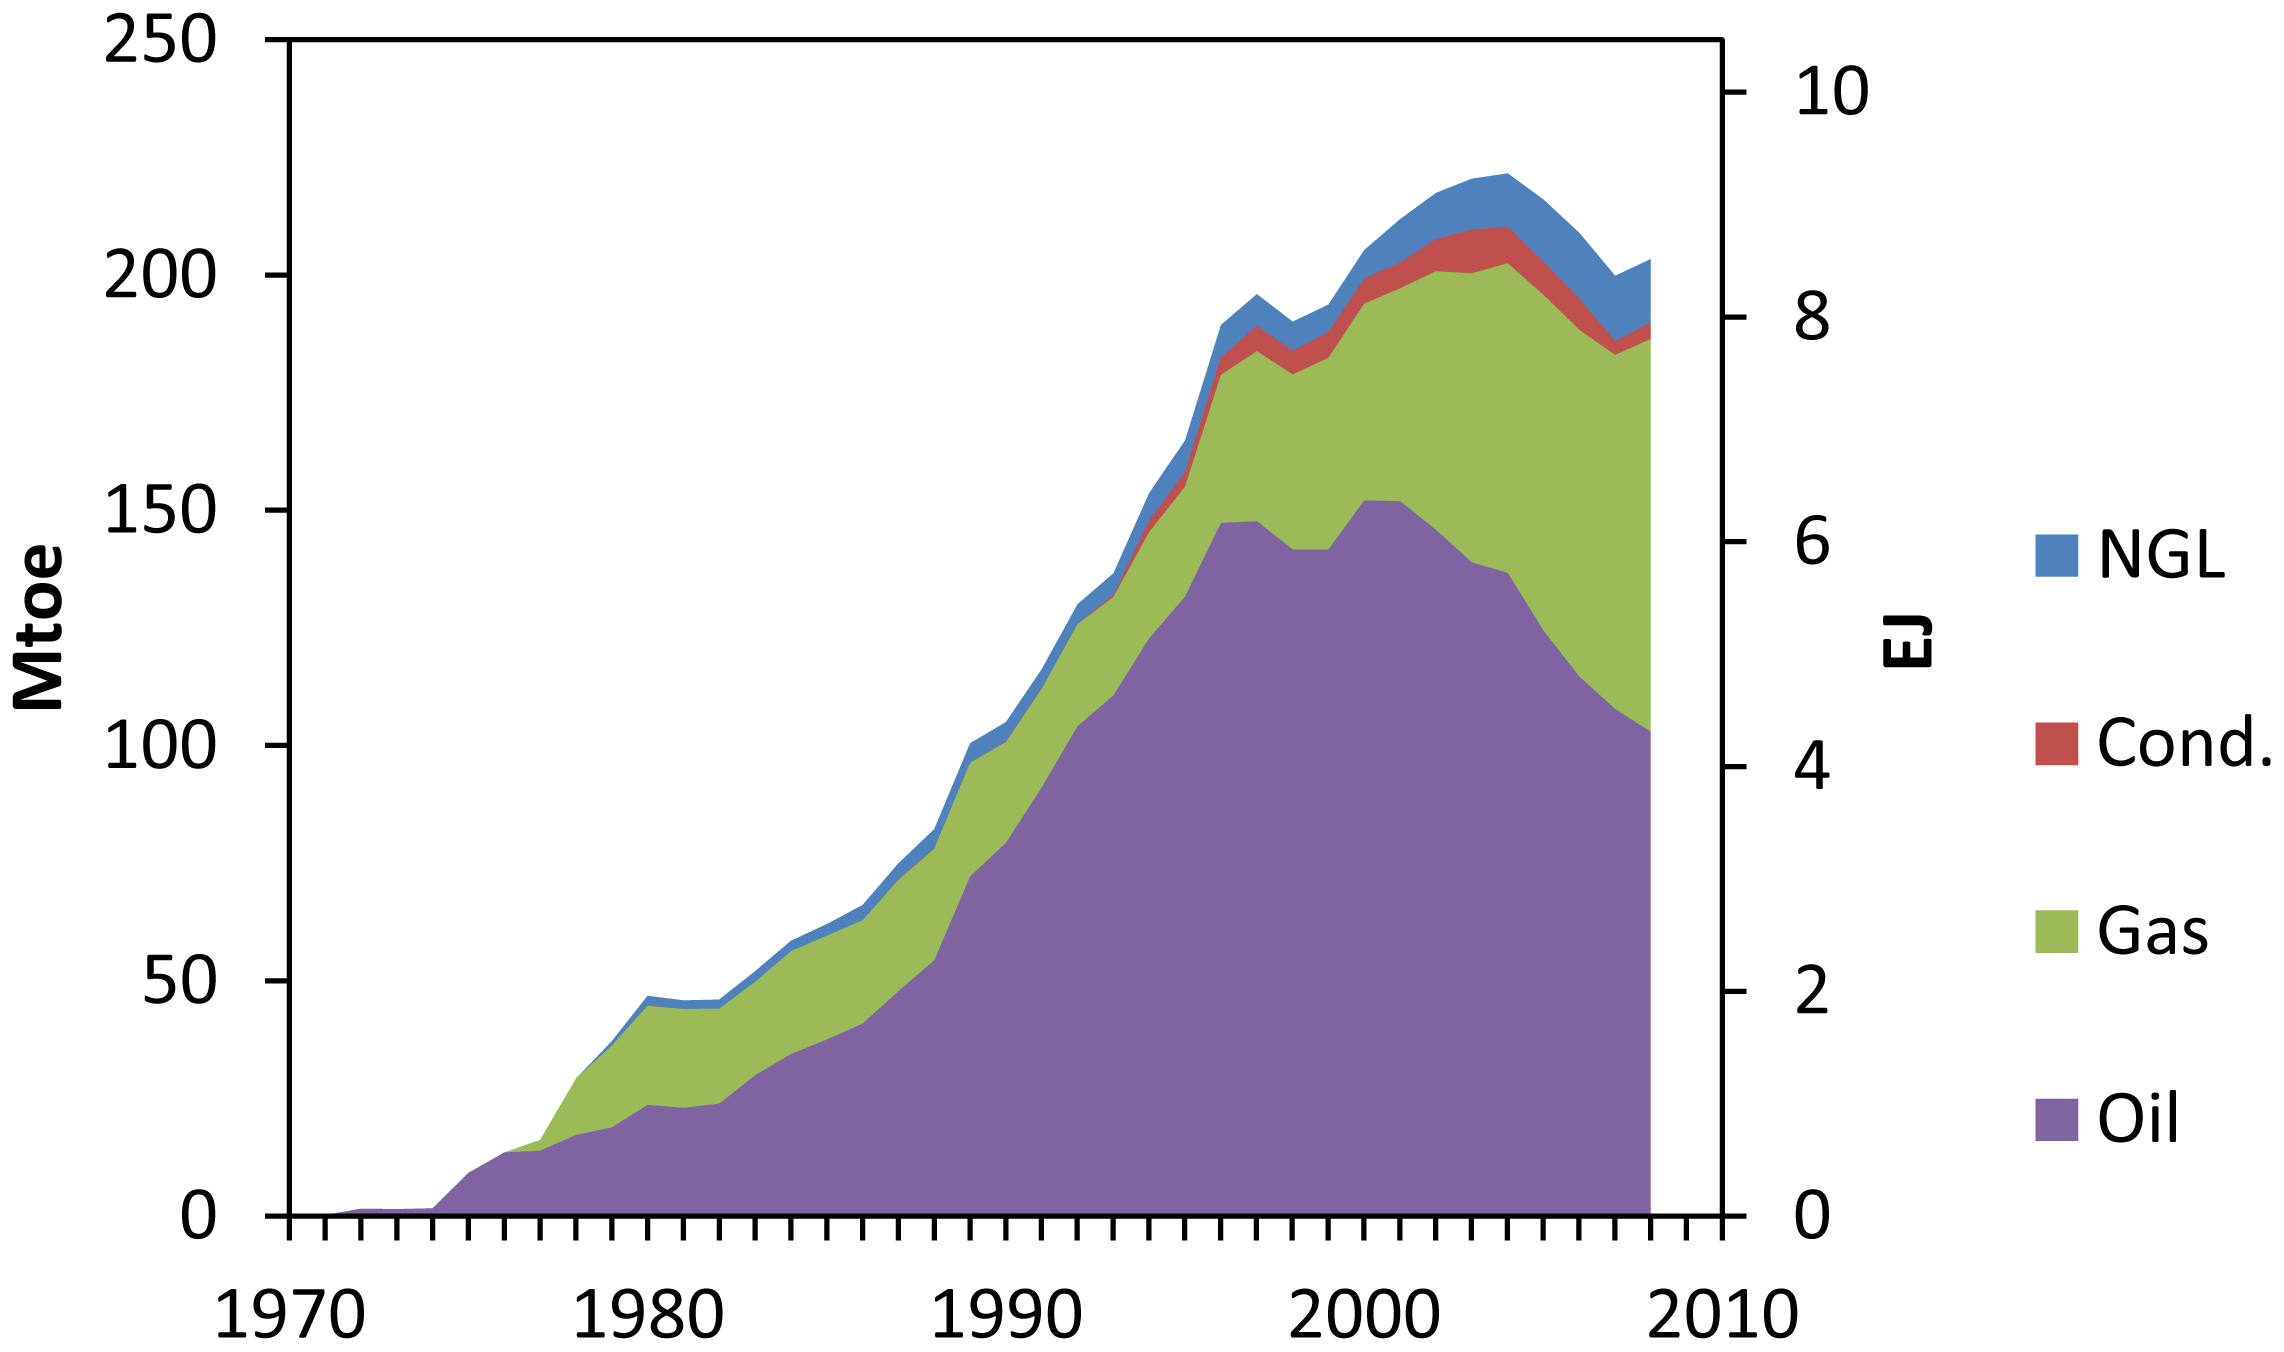
Calculating energy output is easy because of the availability and organization of the data in national data base. We calculated the energy output of all petroleum components (oil, gas, condensate, NGL) from all oil and gas fields based on raw data supplied by the Norwegian Petroleum Directorate, NPD [29]. Norway shares three fields with Great Britain, namely Statfjord, Frigg and Murchison. The figures provided by NPD take into account only the Norwegian share of the production of these fields, plus all other fields in the territorial boundaries of Norway. Figure 2 shows the production from the very beginning of production in 1971 to 2008. An example of that data for the peak production year (2000) is given in Table 3. Table 4 gives estimates of the energy value of these data and the conversions used.
3.2. Energy Inputs
There are various categories of energy inputs and each requires different means of estimating their value [30]:
Direct energy is that used on the site to operate, for example, a seismic survey, turn a rotary bit, pump or pressurize a field, operate maintenance vehicles and so on. The data is usually derived from direct statistics on the site;
Indirect energy (or embodied energy) is used to make the materials used on site: for example steel forms, cement, vehicles and so on. There is generally little debate about the appropriateness of including direct and indirect energies (even though the question related to the boundaries of the analysis is more controversial). The other categories are more controversial but can include:
The energy cost of providing labor [28];
The energy cost of the energy required to build the infrastructure to use the energy in question (i.e., a truck or highway) [15], and;
The energy cost of compensating for environmental damage.
The energy cost of financial services.
While we believe that these other categories (3–5) are very important we leave their discussion and consideration to other papers in this special issue [30] and elsewhere [7,31].
By relying on the data by Norwegian Petroleum Directory and Statistics Norway (values for both the direct energy consumption on site and also monetary values for various other categories, such as capital equipment expenditure and fuel expenditure), we were able to derive comprehensive, if somwhat imprecise, estimates of total energy used. Our EROI calculation in this paper is consistent with the standard EROI suggested by Murphy and Hall [30]. It refers to the energy cost and therefore the EROI value at the well head. According to Statistics Norway pipeline transport leads to additional energy costs adding approximately 5–10% to the direct energy costs at well head [32]. Thus EROI calculated on shore would be accordingly smaller.
3.3. On-Site Energy
Normally, energy companies use natural gas as much as possible in the fields since oil is more valuable and gas is more difficult to transport. We were able to derive energy inputs used on-site (i.e., at the platforms) from two different sources:
The first energy input is fuel consumed for all other aspects of petroleum production except drilling. We obtained detailed field-by-field consumption figures for gas (in scm, standard cubic meters) beginning in 1974 and for diesel (in liters) beginning in 1994. Additionally, we received aggregate diesel consumption figures for the years 1991–1993 [33]. The data covers only the fuel consumed for petroleum production (i.e., energy used to pump products or pressurize fields) but not the energy consumed in drilling. The data is compiled by the Norwegian Petroleum Directorate. An example of the data for Troll area is given in Table 5. We estimated the Norwegian share of the diesel and gas consumed for the border fields (Statfjord, Frigg and Murchison) based on the ratio of Norwegian to British plus Norwegian petroleum production figures at these particular fields. The Norwegian oil and gas production figures were obtained from NPD [29]. The British production figures for the three border fields were obtained from the so called “Brown Book” in the case of Frigg [34] and for Murchison and Statfjord from the UK Department of Energy and Climate Change [35] (years 1980–2008). Table 4 includes conversion factors to convert all values to toe.
Energy used to drill wells. The NPD data base provides the fuel consumption for petroleum production, but not the energy used to drill wells. Thus we need to know the direct fuel consumption for both exploratory and production drilling activities.
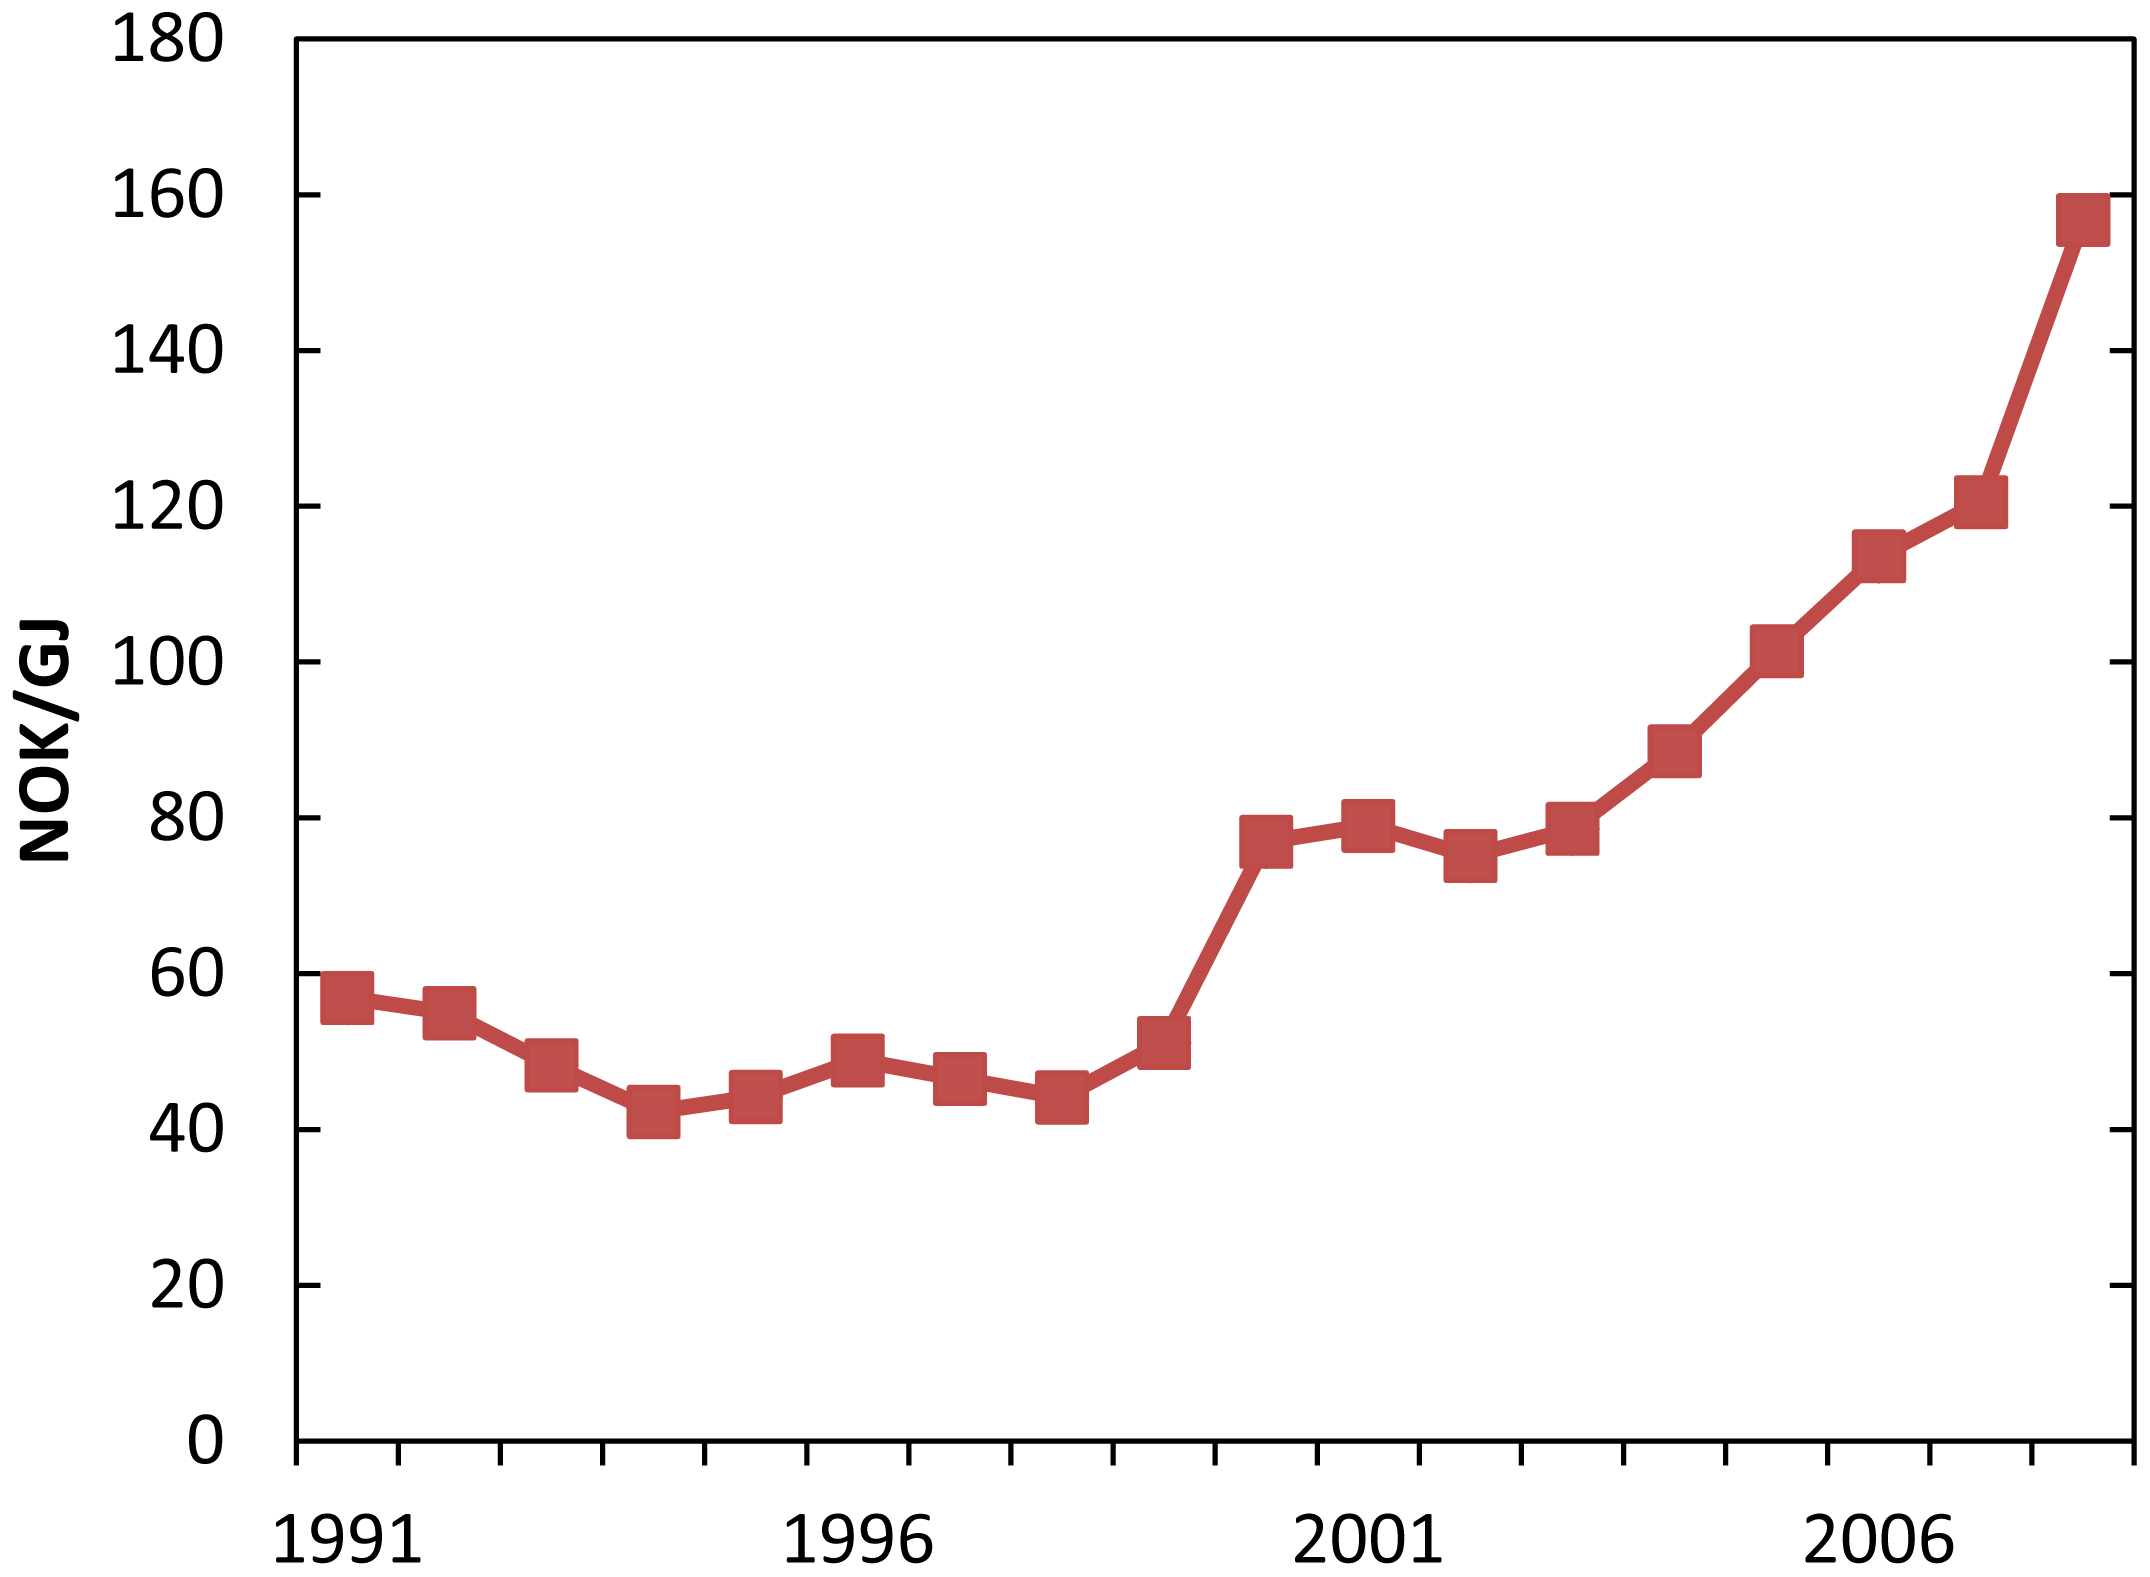
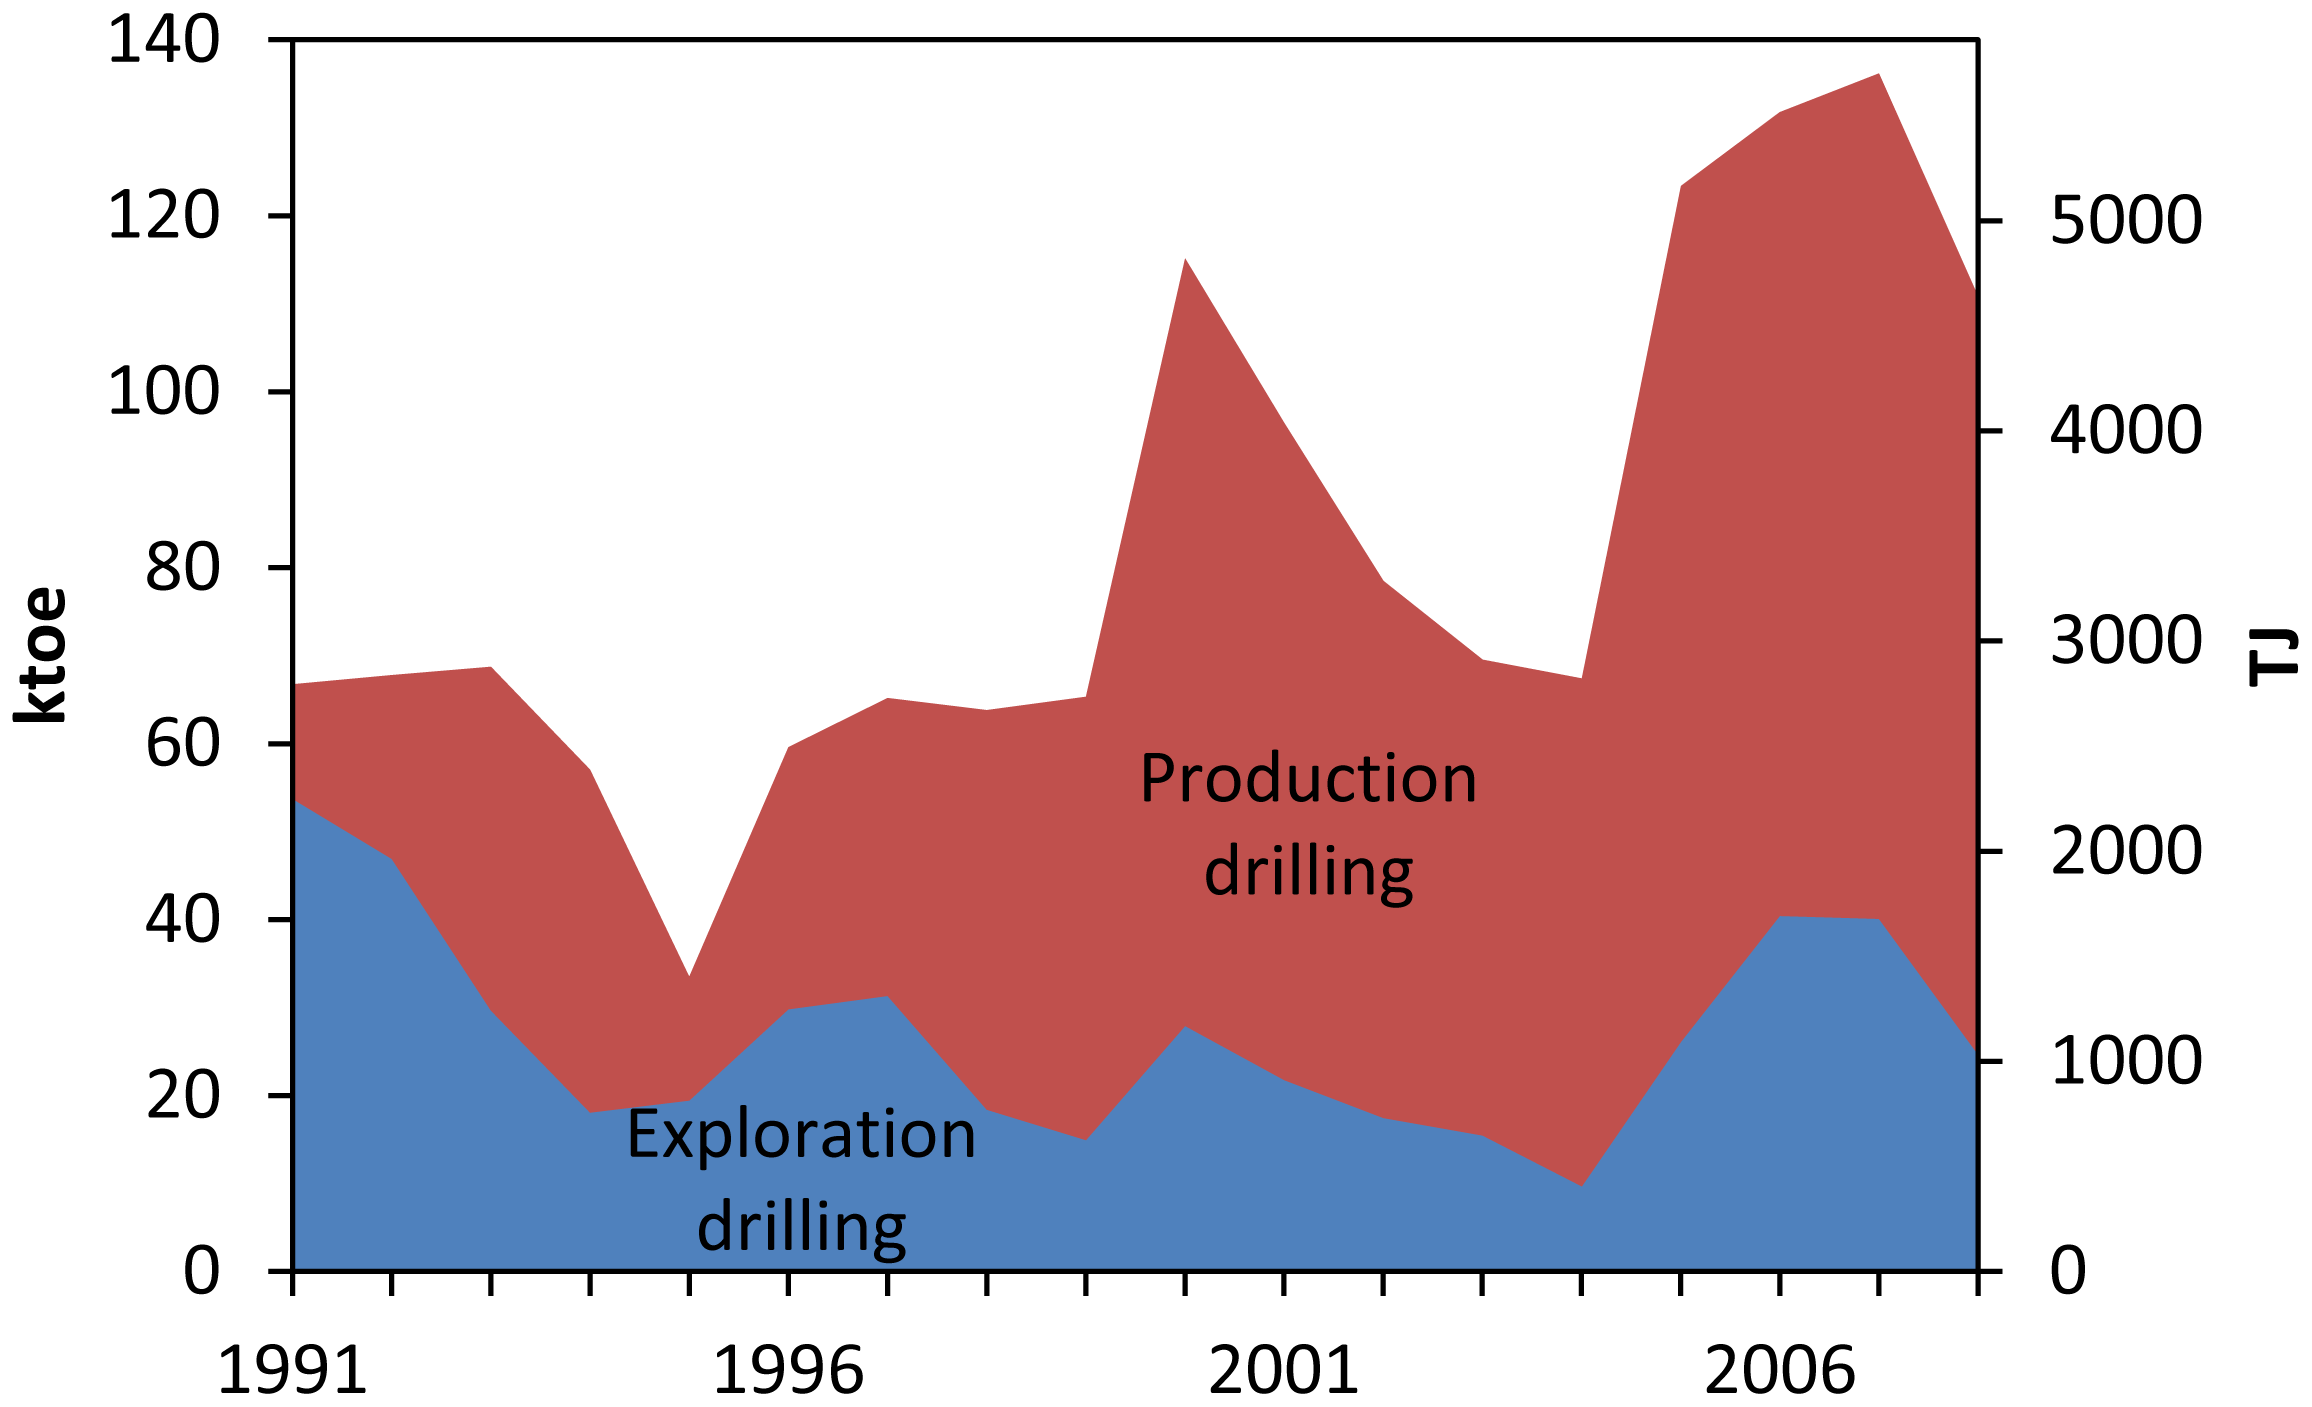
Statistical Bureaus usually publish energy consumption figures for various industrial sectors. Unfortunately, in the case of Norway the oil and gas sector is not included in the industrial energy statistics. However, Statistics Norway publishes very detailed data on investments in the oil and gas sector, including direct fuel consumption for drilling purposes, in monetary terms [36,37]. It is divided into three sections (exploration, field development and fields on stream) and each section covers investments for services, drilling and commodities (Table 6). Fuels are covered under “commodities”. We divided monetary investments for fuels by average fuel prices paid by Norwegian industry (Figure 3) to give fuel consumption for drilling in physical units (Figure 4). The average fuel prices were obtained from Statistics Norway [38]. We used the price for light heating oil in our calculations since we assume the fuel used to be largely diesel oil. The values obtained this way might be underestimating the actual fuel consumption for drilling because the oil and gas industry obtains fuel for a lower price than the average price paid by the Norwegian industry. Table 6 gives a summary of the various categories of investment data for exploration and an example of our calculations for the year 2000.
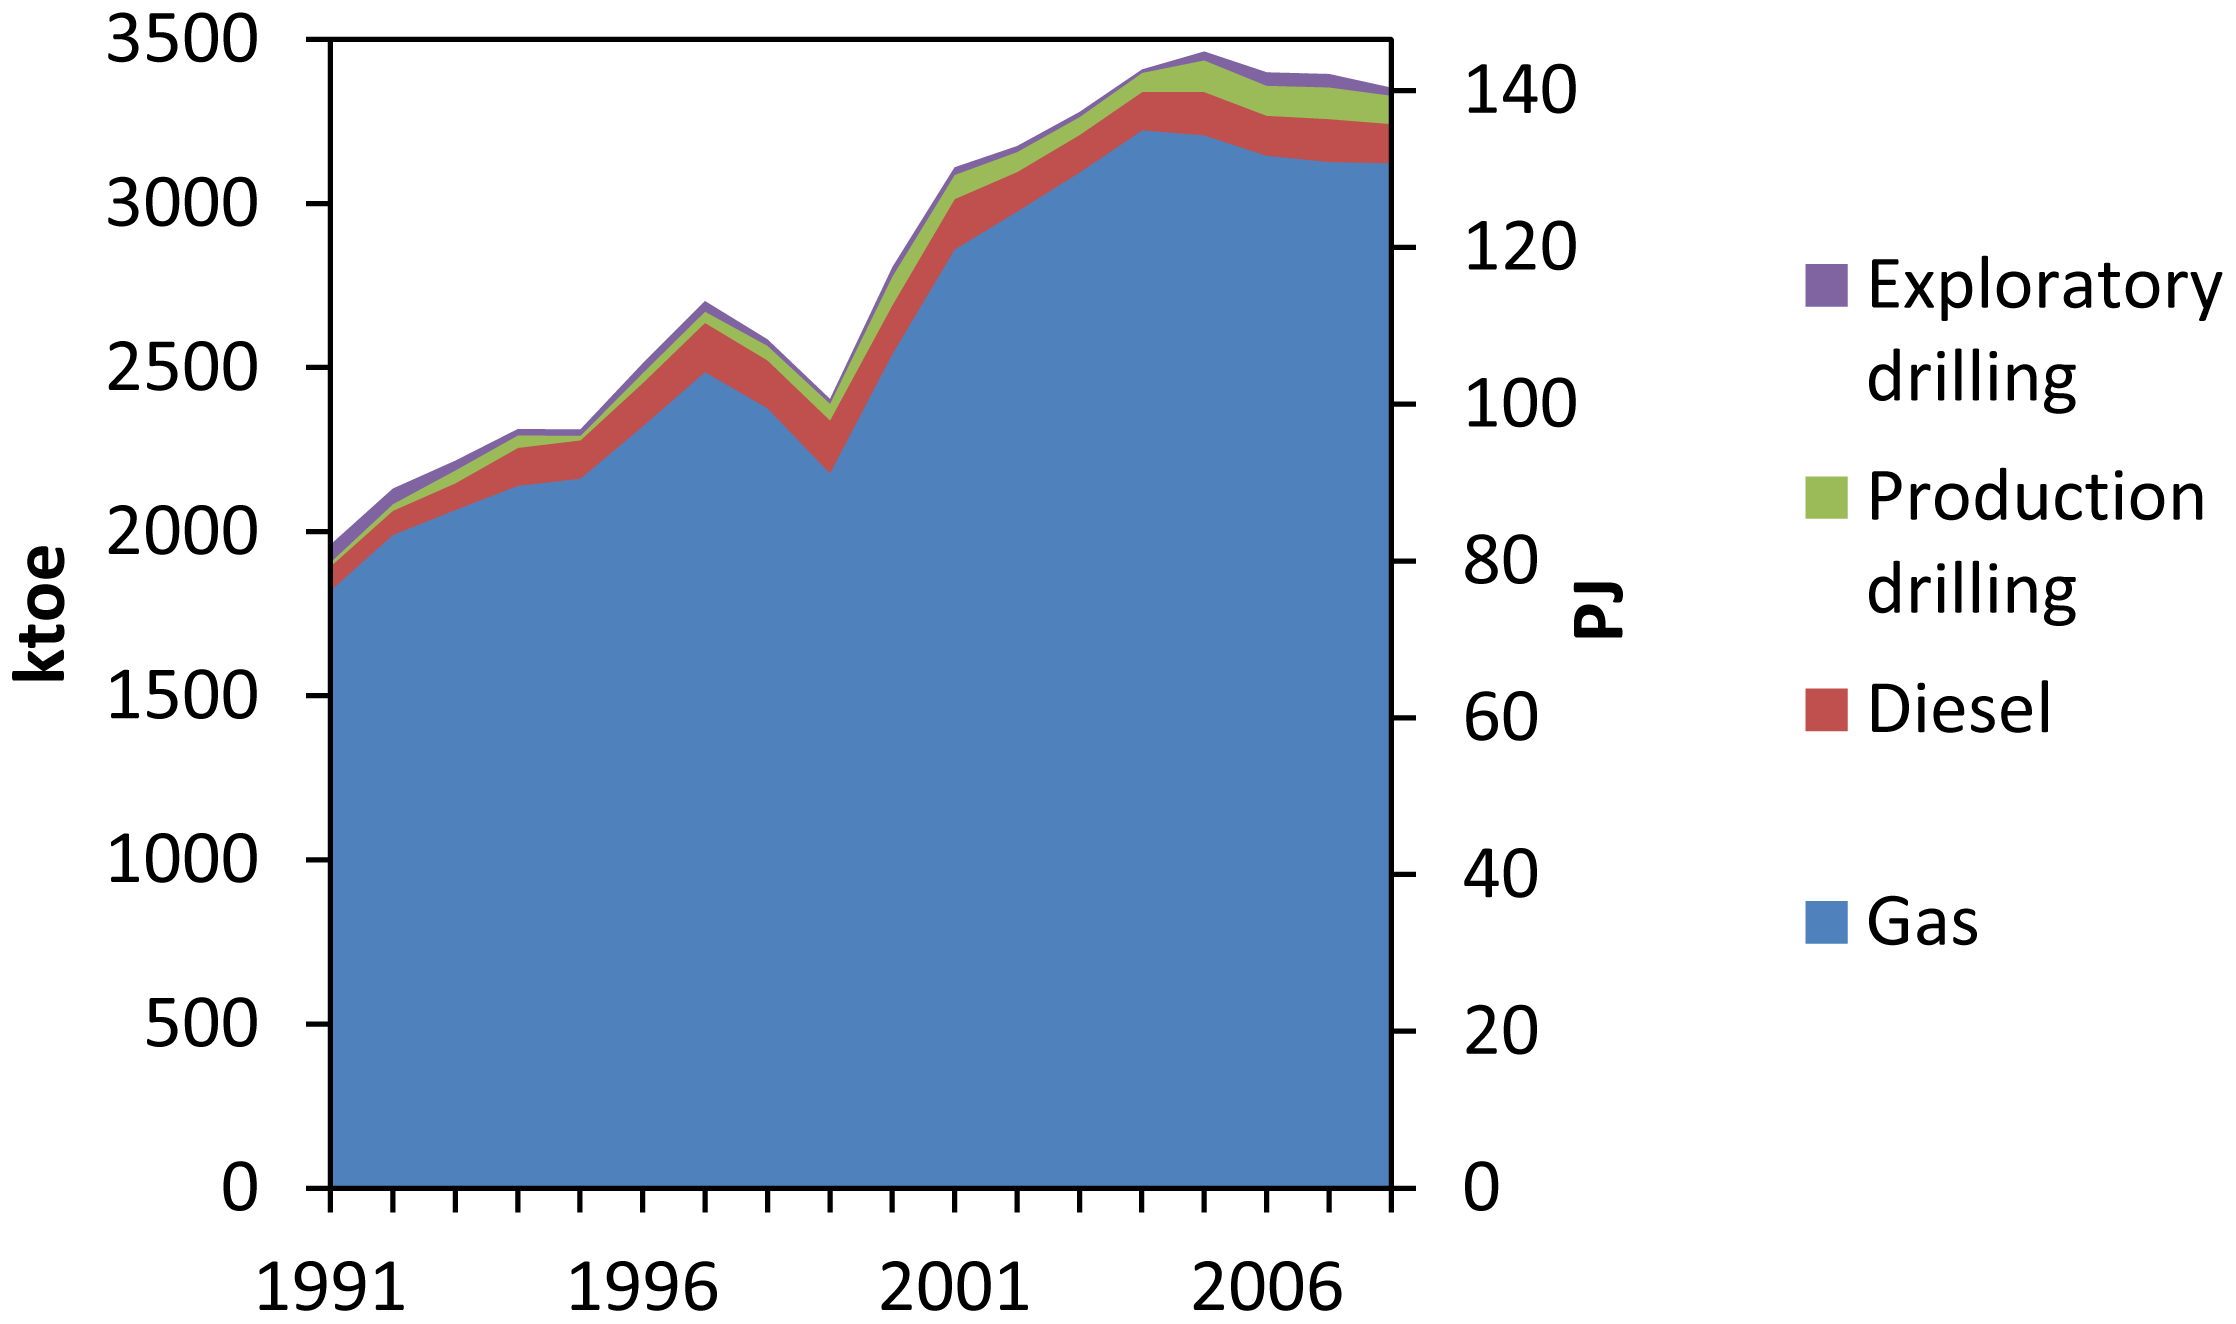
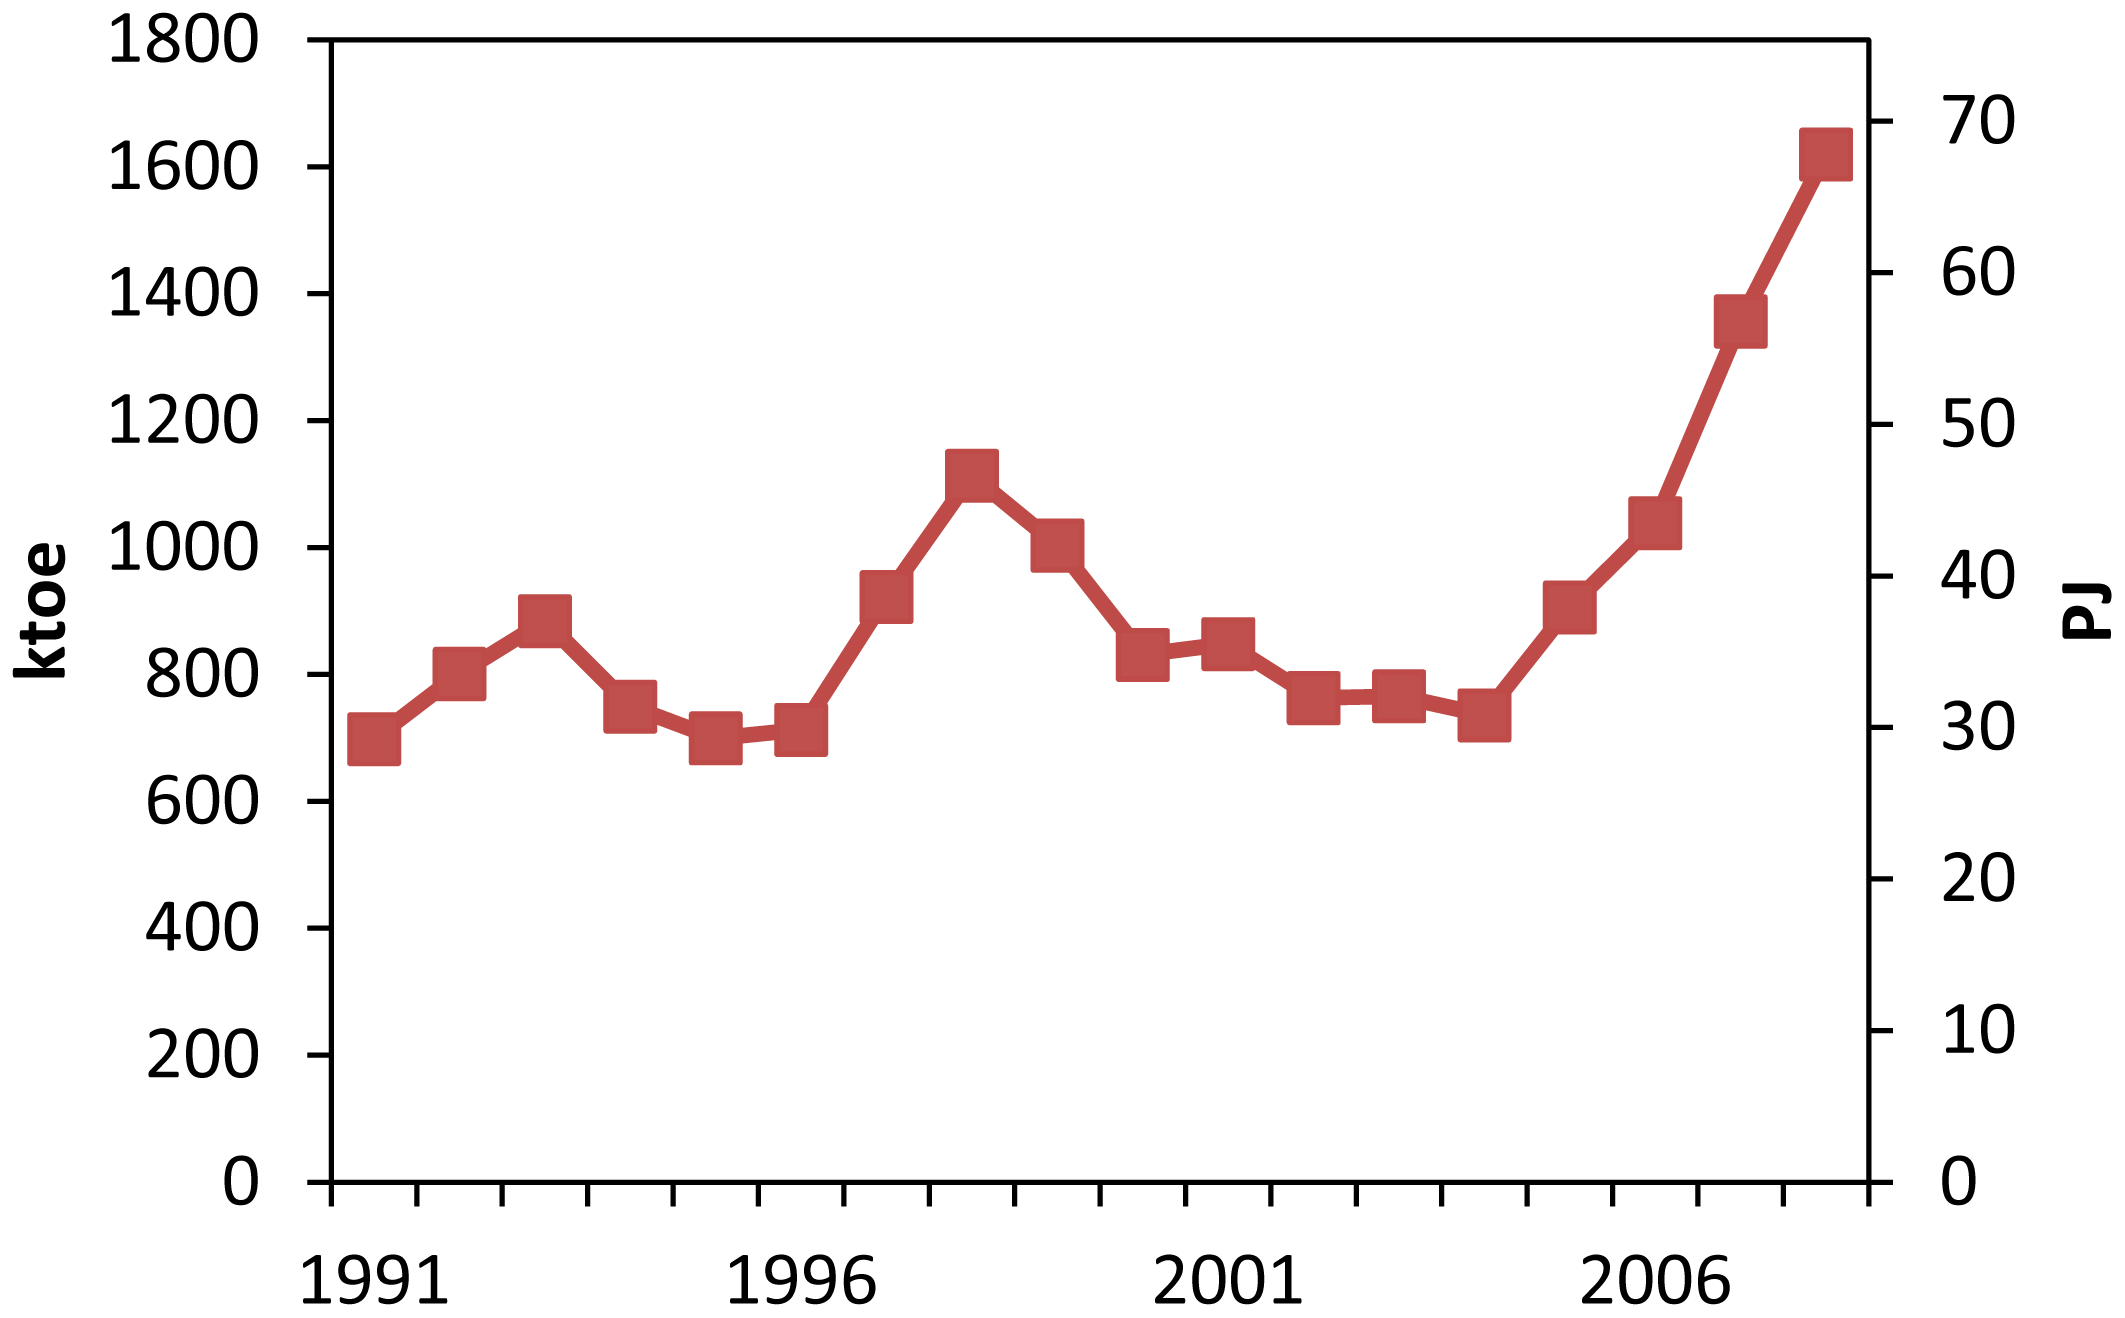
Figure 5 comprises all direct fuel consumption of the Norwegian oil and gas sector including both fuels used for production and fuels used for drilling.
3.4. Indirect Energy
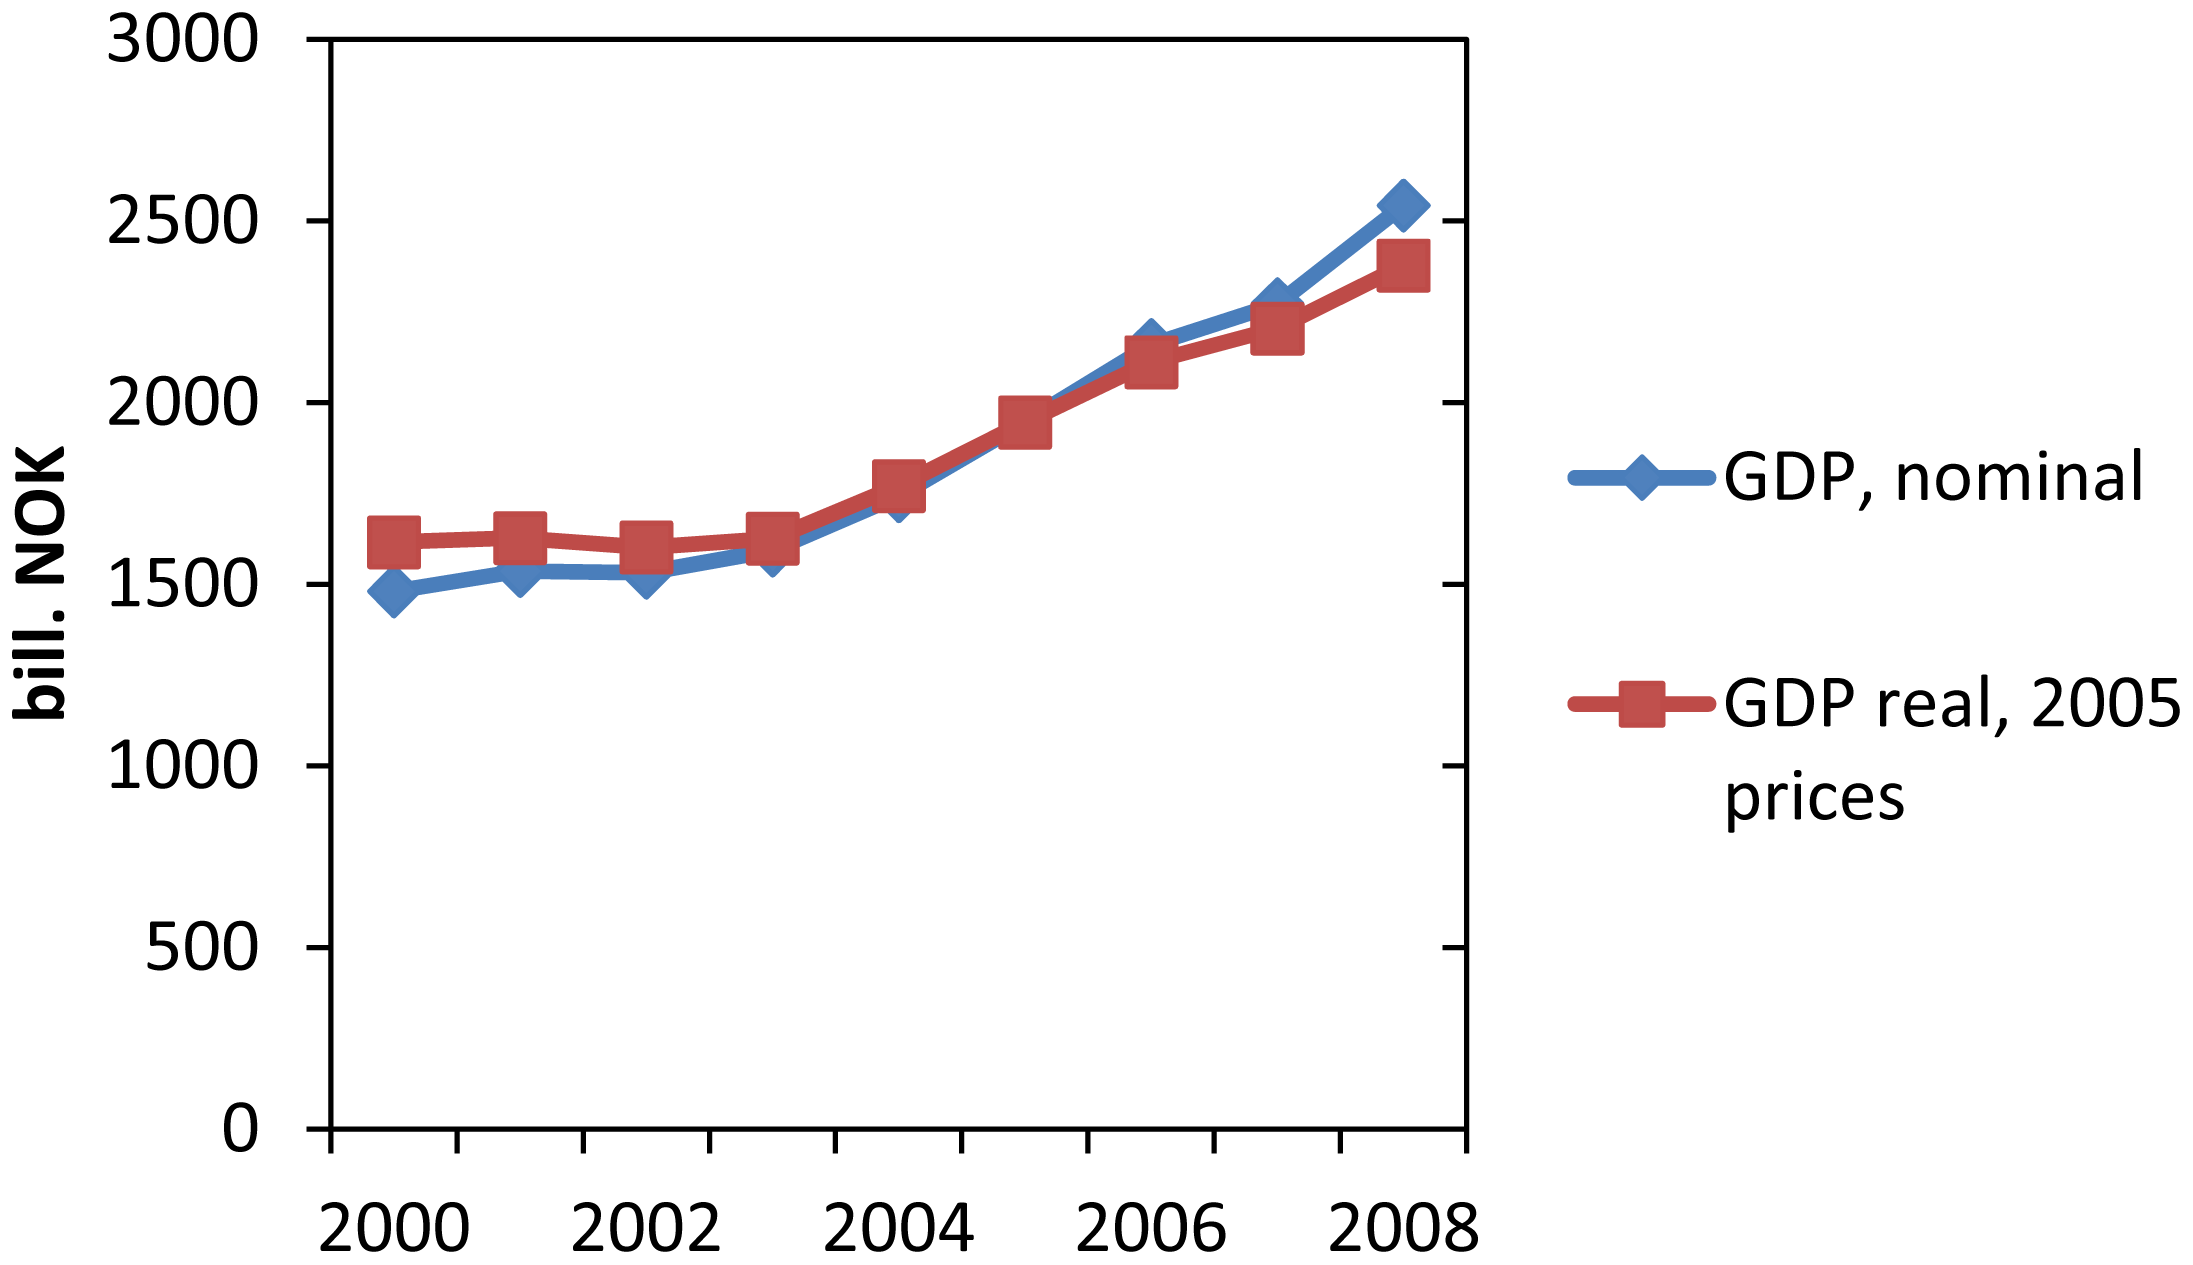
The calculation of indirect energy is an attempt to estimate the energy consumption of materials, services etc. related to petroleum production by deriving the energy intensity (energy used per dollar or Krone) of an activity for which there is financial data. An estimate (4.01MJ/$) for the energy intensity of the Norwegian economy as a whole was calculated as follows: the Norwegian GDP (according to current prices) [39] was inflation adjusted to 2005 using CPI [40]. Data on the Norwegian GDP is presented in Figure 6.
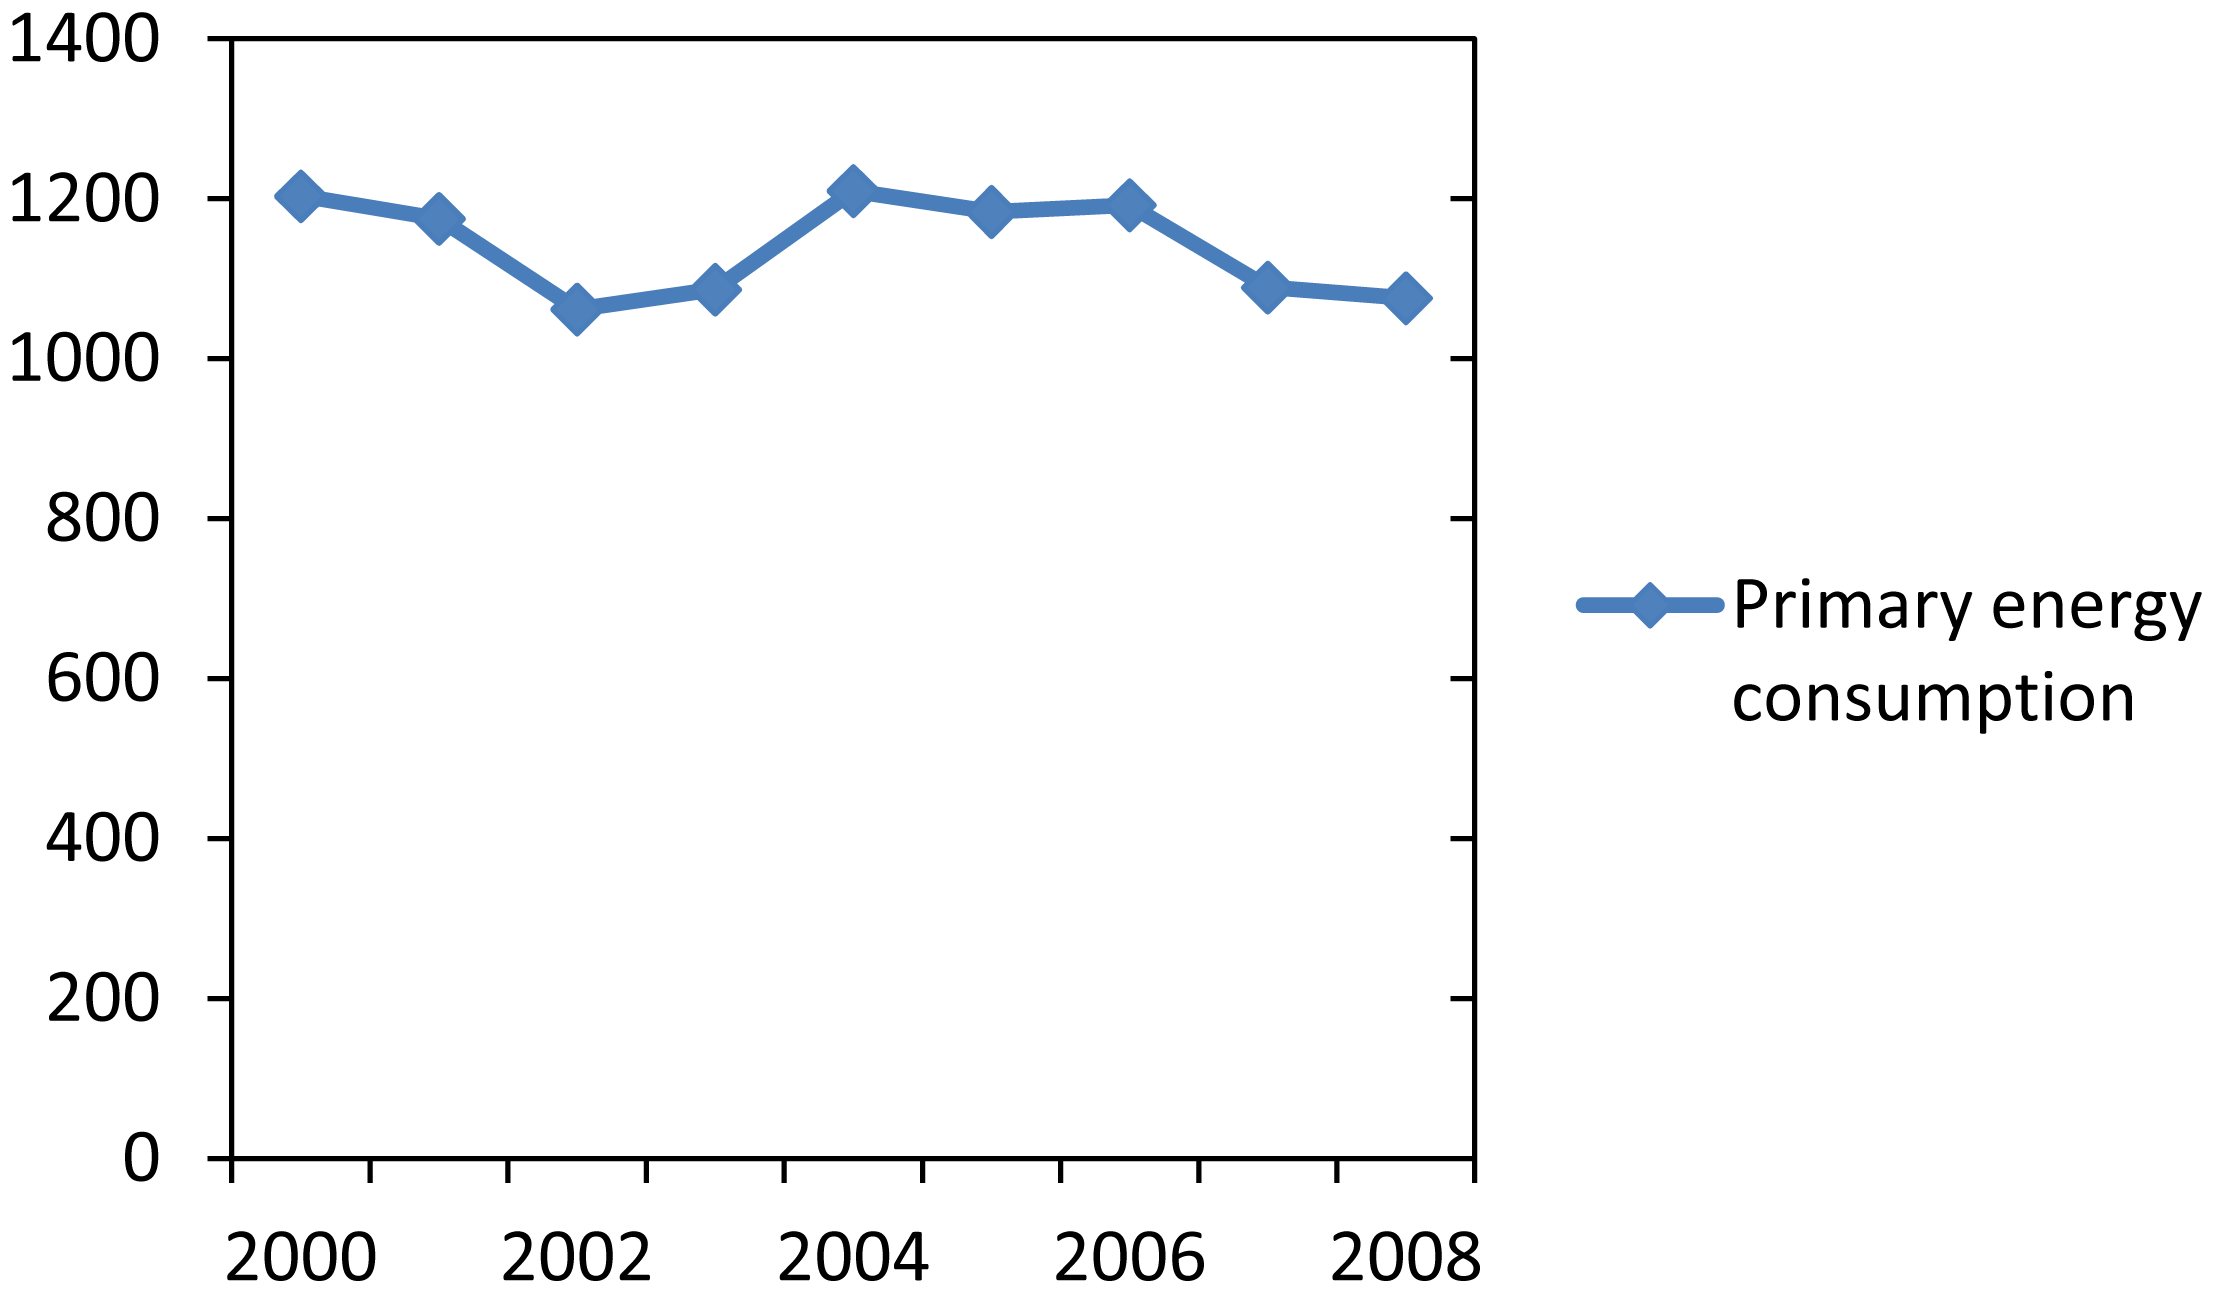
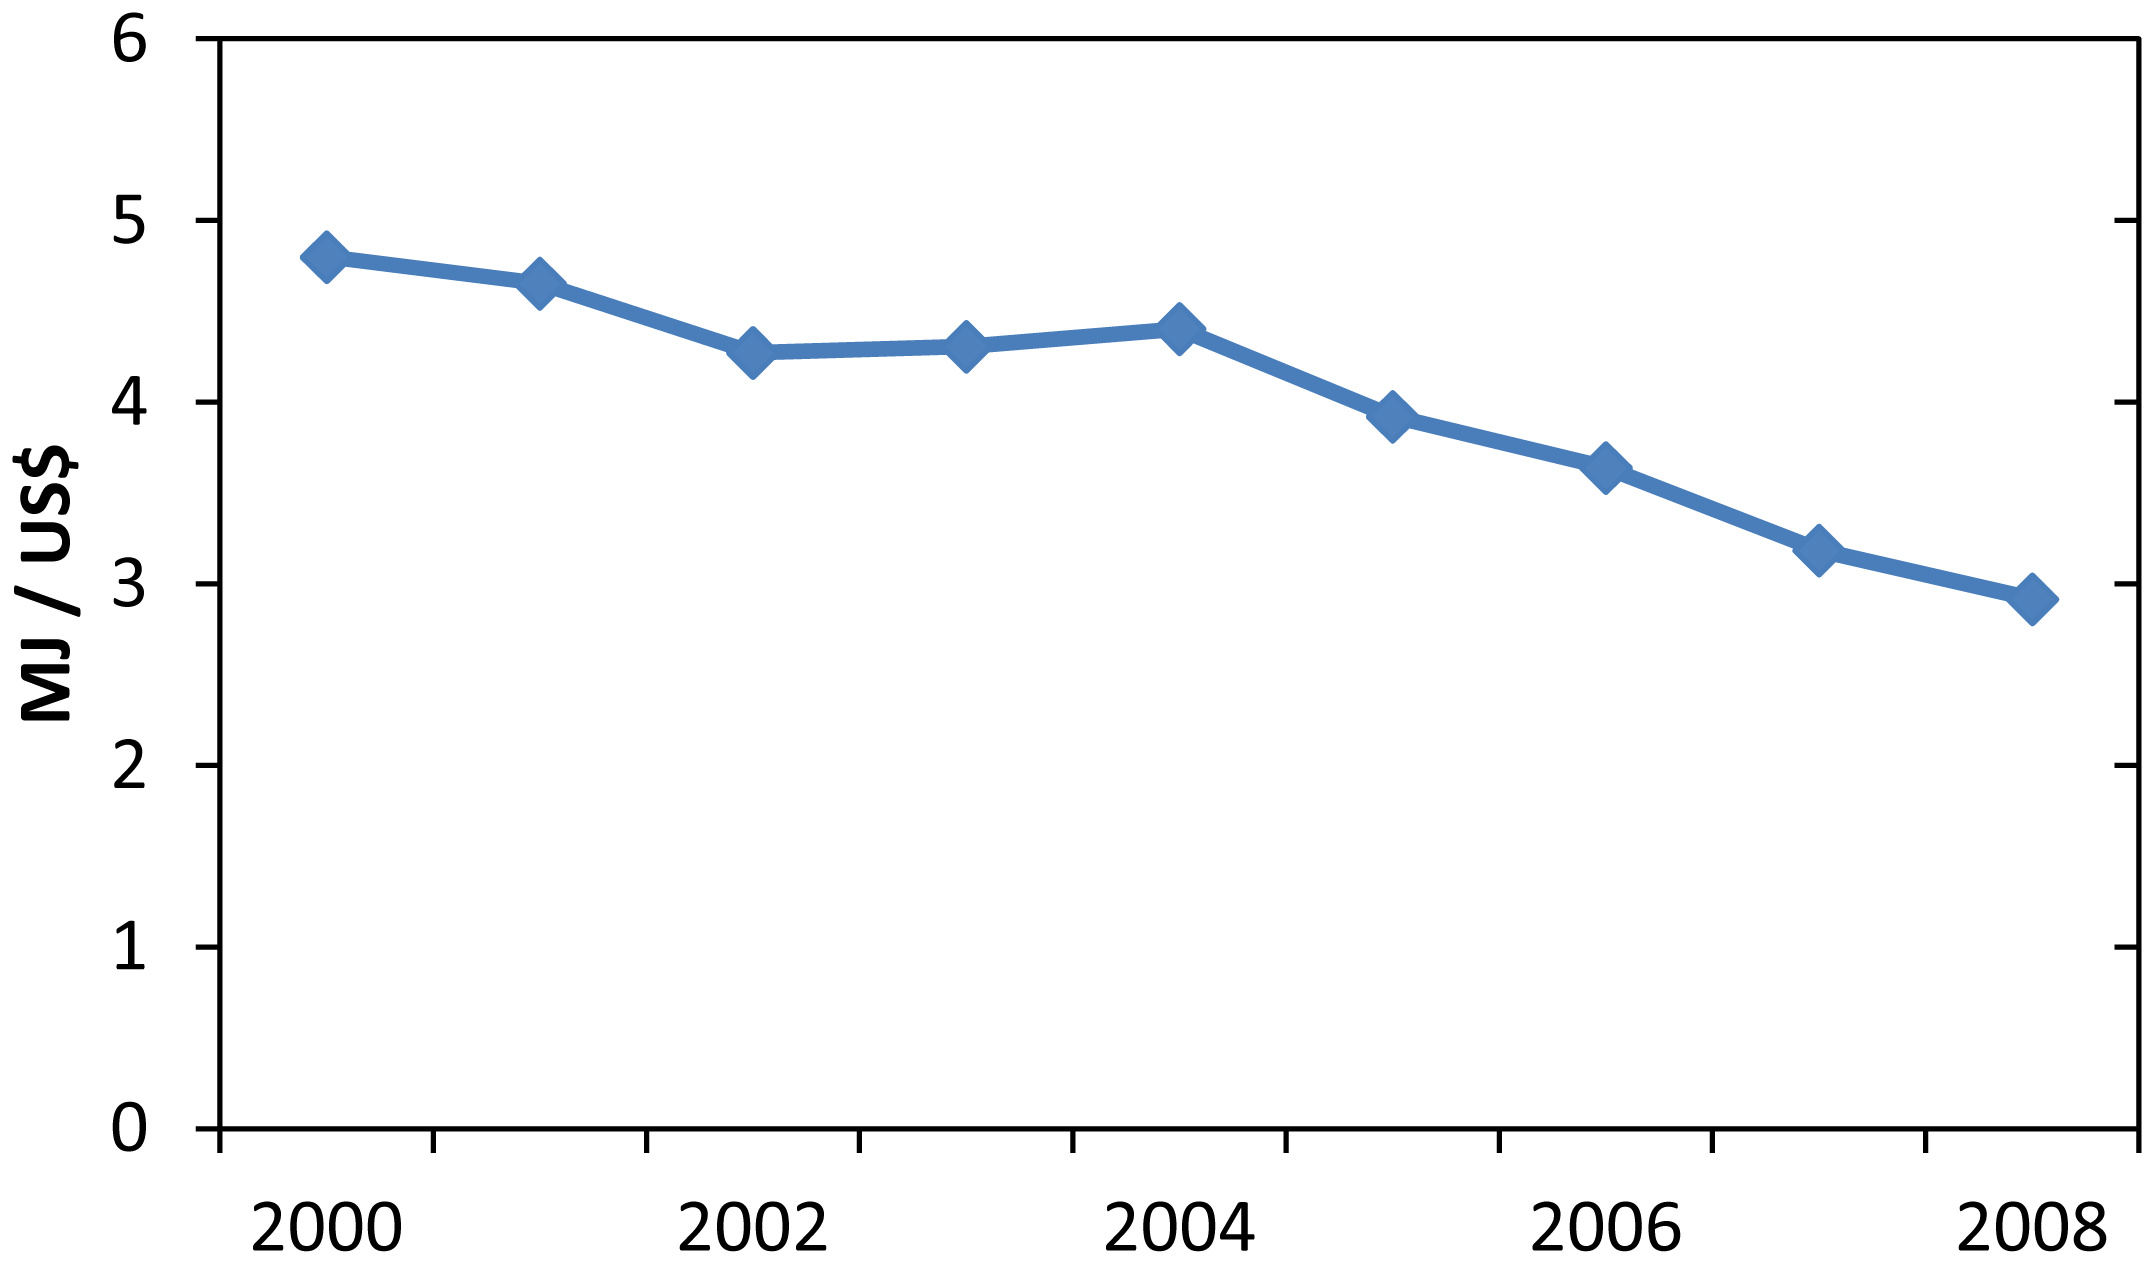
The GDP (in 2005 NOK) was converted to US$ according to the exchange rate from the year 2005 (6.445 NOK/US$). The primary energy consumption of the Norwegian economy (excluding natural gas for flaring) was divided by this dollar value for each year to give the average energy use associated with each dollar spent for the country as a whole and all expenditures [41]. Primary energy consumption can be found in Figure 7 and the calculated energy intensity of the Norwegian economy in Figure 8.
The energy intensity calculation was done for 2000–2008. The result varies between 2.9–4.8 MJ/US$ with an average of 4.01 MJ/US$. The energy intensity of the Norwegian economy declined by 39% over this time period.
Estimates for the indirect energy associated with the purchases by the petroleum sector were derived based on comprehensive investment data provided by Statistics Norway [36,37]. The statistics give detailed information on commodities, services, administrative costs and drilling activities. We excluded the investments needed for fuel (which we had calculated independently). The costs given in current value were inflation-adjusted to 2005 and converted to US dollars (6.445 NOK/US$, average exchange rate for 2005). Table 6 gives a summary of the various categories of investment data for exploration and an example of our calculations for the year 2000. Figure 9 shows the indirect energy for the whole oil and gas sector for the time period 1991–2008. Figure 10 adds all energy components (both direct and indirect also called embodied energy) together.
4. Data Quality Checks
We were able to derive three independent estimates of year-to-year total effort: dollars invested, direct energy invested and feet drilled [29]. Investment data allows us to separate various investments for drilling purposes (including both exploratory and production drilling) and other investments. We received data on fuel consumption for petroleum production (excluding production drilling) and we were able to develop estimates for fuel consumption for drilling purposes (including both exploratory and production drilling) based on investments in fuels and average fuel prices. There was a general correlation between drilling activity (measured in drilled km) and monetary investments for drilling, as well as between fuel consumption for drilling and investments for drilling. A modest correlation was found between drilling activity and drilling fuel consumption (Figures 11–13).
5. Results
We found that the energy return on energy Investment (EROI) for Norwegian petroleum production ranged from 44:1 in the early 1990s to a maximum of 59:1 in 1996, to about 40:1 in the latter half of last decade (Figure 14). The curve basically follows, and is dependent upon, the pattern of production over time (peak in oil production was in 2000 and peak in total petroleum production was in 2004). Approximately 74% of the energy cost is due to direct fuel consumption in production (i.e., pressurizing fields, lifting oil and so on), 2% is due to direct fuel consumption for drilling (including both exploratory and production drilling). The remaining 24% of energy cost is energy used indirectly in generating the needed infrastructure and services.
EROI values for oil alone varied from 46:1 in 1996 to around 20:1 in recent years (Figure 14). In terms of production, these values only take oil into account (they exclude gas, NGL and condensate). On the consumption side, however, it covers the whole energy consumption of the petroleum industry.
6. Discussion
These EROI values for Norwegian oil and gas reflect the very high quality of the North Sea oil fields, their high profitability, their newness and the impact of the high level of technology and human skills used. There are very few, if any, oil and gas resources today with such a favorable EROI. However, if the current rate of decline in EROI continues it will reach very low values in a relatively few decades. Like all petroleum-based wealth, Norway's present high living standard is likely to be a passing phenomenon, unless the country's wealth is prudently invested, financially and physically.
What are the reasons for the decline in the EROI estimates, especially since 1999? Probably the most important factor is that it appears that depletion is a somewhat more powerful force than technological improvement. A second effect is that of drilling intensity presented in Figure 15. Previous studies have shown that exploitation efficiency in the petroleum industry declines when exploitation intensity increases [4,16]. The integrated effects of depletion and variable drilling effort may also explain much of the variability in both the US and the global data. This data shows both a general secular decline over the entire period analyzed and a flattening or even an increase in EROI during periods of reduced drilling effort and a reduction during times of intense drilling.
When looking closer at the Norwegian data, it seems that changes in EROI are mostly due to field age. However changes in drilling activity could also have a small impact on the calculated EROI values. Linear curves fitted to the data (Figure 16) show that, since 2003, years with higher drilling activity lead to a slightly lower value of EROI whereas years with higher drilling activity lead to somewhat lower values of EROI.
The overwhelming share of the energy expenditures in the oil and gas sector is due to production (Figure 10). Drilling activity uses only 2–4% of total direct fuel consumption of the industry. However, 23–54% of investments are caused by drilling activity, which means that a similar share of the indirect energy can be attributed to drilling. This way the share of drilling activity in the total energy cost (both direct and embodied energy) of the sector varies between 7–17%.
Between 1999 and 2001 there was an almost 30% increase in drilling activity and, in the same timeframe, a small decline in EROI. This increased drilling intensity may be the cause of a decline in EROI, and may not result in as much additional net energy delivered to society as would initially seem to be the case. The subsequent decline in drilling activity in 2001 to 2004 may have helped the EROI to increase again. Since 2003, the drilling activity has been oscillating between 700 and 800 km annually whereas EROI declined steadily by 25% from 2003 to 2008. It is most likely that this decline was caused by field depletion and it may continue as the Norwegian oil and gas fields continue to age [12]. A recent announcement by the Norwegian Petroleum Directory to enhance recovery in mature fields [42] could further deteriorate EROI of the Norwegian oil and gas production, since it requires often very energy intensive techniques such as nitrogen or CO2 injection.


| Name of the field | Resources (mill. scm o.e.) | Resources (mill. Barrels) | Name of the field | Resources (mill. scm o.e.) | Resources (mill. Barrels) |
|---|---|---|---|---|---|
| Draugen | 149 | 938 | Oseberg | 491 | 3089 |
| Ekofisk | 712 | 4479 | Sleipner Vest | 163 | 1023 |
| Eldfisk | 186 | 1171 | Sleipner øst | 120 | 753 |
| Frigg | 117 | 734 | Snorre | 250 | 1570 |
| Grane | 116 | 731 | Snøhvit | 191 | 1199 |
| Gullfaks | 390 | 2453 | Statfjord | 688 | 4324 |
| Gullfaks Sør | 105 | 662 | Troll | 1626 | 10225 |
| Heidrun | 231 | 1452 | Ula | 97 | 613 |
| Kvitebjørn | 107 | 674 | Valhall | 181 | 1141 |
| Norne | 109 | 686 | Visund | 88 | 552 |
| Ormen Lange | 423 | 2662 | Åsgard | 368 | 2315 |
| Resource | Year | EROI | Reference |
|---|---|---|---|
| US Oil and Gas Discoveries | |||
| Oil and gas | 1930 | >100:1 | [18] |
| Oil and gas | 1970 | 8:1 | [6] |
| Oil and gas | 2000 | 5:1 | [17] |
| US Oil and Gas Production | |||
| Oil and gas | 1970 | 30:1 | [6] |
| Oil and gas | 1980 | 20:1 | [6] |
| Oil and gas | 2000 | 11–18:1 | [18] |
| Oil and Gas | 2005 | 10:1 | [17] |
| World oil and gas | 1990s | 35:1 | [8] |
| production | 2006 | 18:1 | [8] |
| California oil fields | 1980 | 12:1 | [9] |
| 2010 | 3:1 to 5:1 | [9] |
| Mtoe | mill. barrel | EJ | ||
|---|---|---|---|---|
| Oil | 181.2 mill. scm | 152.2 | 1139.6 | 6.4 |
| Gas | 49.7 bill. scm | 41.8 | 312.9 | 1.7 |
| Condensate | 6.3 mill. scm | 5.3 | 39.5 | 0.2 |
| NGL | 7.2 mill. scm | 6.1 | 45.4 | 0.3 |
| Energy carrier | Conversion factor |
|---|---|
| Oil | 1 scm = 1 scm o.e. |
| Gas | 1000 scm = 1 scm o.e. |
| Condensate | 1 scm = 1 scm o.e. |
| NGL | 1 scm = 1 scm o.e. |
| Diesel: Density | 0.845 t/m3 |
| Energy density (per mass) | 42.8 GJ/t |
| Energy density (per volume) | 0.864 toe/1000 liters |
| Gas (1000 scm) | Diesel (1000 litres) | Gas (TJ) | Diesel (TJ) | Total (TJ) | |
|---|---|---|---|---|---|
| 1990 | 18349 | 645.3 | 645.3 | ||
| 1991 | 36756 | 1292.7 | 1292.7 | ||
| 1992 | 55056 | 1936.3 | 1936.3 | ||
| 1993 | 43700 | 1536.9 | 1536.9 | ||
| 1994 | 43548 | 1531.5 | 1531.5 | ||
| 1995 | 51746 | 3550 | 1819.9 | 128.4 | 1948.3 |
| 1996 | 109269 | 3751.8 | 3842.9 | 135.7 | 3978.6 |
| 1997 | 105746 | 2143.5 | 3719.0 | 77.5 | 3796.5 |
| 1998 | 122023 | 924.9 | 4291.4 | 33.5 | 4324.9 |
| 1999 | 121310 | 8916.8 | 4266.4 | 322.5 | 4588.9 |
| 2000 | 195737 | 7326.9 | 6883.9 | 265.0 | 7148.9 |
| 2001 | 227755 | 4350 | 8009.9 | 157.3 | 8167.3 |
| 2002 | 217916 | 1984.4 | 7663.9 | 71.8 | 7735.7 |
| 2003 | 239543 | 7486.1 | 8424.5 | 270.7 | 8695.3 |
| 2004 | 277539 | 7180 | 9760.8 | 259.7 | 10020.5 |
| 2005 | 272352 | 988 | 9578.4 | 35.7 | 9614.1 |
| 2006 | 263025 | 3835.4 | 9250.3 | 138.7 | 9389.1 |
| 2007 | 272116 | 2099 | 9570.1 | 75.9 | 9646.0 |
| 2008 | 261909 | 4447 | 9211.1 | 160.8 | 9371.9 |
| Category | Expenditures | Expenditures (inflation corrected) | Direct fuel consumption | Indirect energy |
|---|---|---|---|---|
| Mill. NOK | Mill. 2005 NOK (Mill. 2005 US$) | TJ | TJ | |
| General Exploration | 608 | 663 (103) | - | 413 |
| Geology/geophysics | 269 | |||
| Seismic | 289 | |||
| Special studies | 50 | |||
| Field evaluation/field development | 631 | 688 (107) | - | 429 |
| Field evaluation | 140 | |||
| Field development | 489 | |||
| Industrial technology development | 1 | |||
| Environmental studies | 1 | |||
| Administration and other costs | 923 | 1007 (156) | - | 626 |
| License | 126 | |||
| administration | 307 | |||
| Other administration | 476 | |||
| Area fee | 15 | |||
| Nifo/Nofo | - | |||
| Environment taxes; | ||||
| Other taxes and duties | ||||
| Exploration drilling | 3110 | 3393 (526) | 1170 | 2113 |
| Drilling rigs | 1089 | 1188 (184) | - | 739 |
| Hire of drilling rigs | 955 | |||
| Other drilling costs | 134 | |||
| Transport costs | 265 | 289 (45) | - | 180 |
| Helicopters and airplanes | 68 | |||
| Vessels | 197 | |||
| Commodities | 327 | 357 (55) | 1170 | 222 |
| Lines, wellheads, drill bits etc. | 92 | 100 (16) | - | 62 |
| Cement | 20 | 22 (3.4) | - | 14 |
| Drilling mud | 71 | 77 (12) | - | 48 |
| Fuel | 90 | - | 1170 | - |
| Use of machinery and equipment | 37 | 40 (6) | - | 25 |
| Smaller equipment | 18 | 20 (3) | - | 12 |
| Technical services | 1433 | 1563 (243) | - | 972 |
| Clearing | 26 | |||
| Cement services | 20 | |||
| Drilling mud services | 25 | |||
| Logging | 143 | |||
| Testing | 15 | |||
| Diving | 21 | |||
| Costs, on shore bases | 136 | |||
| Other technical services | 1046 | |||
| TOTAL | 5272 | 5751 (892) | 1170 | 3581 |
Acknowledgments
We appreciate the support of the Santa-Barbara Family Foundation and of ASPO USA, without which this work would not have been possible. We are very greatful to several experts at Norwegian Petroleum Directorate and Statistics Norway, who provided us very helpful unpublished data on on-site fuel consumption (Rune Hult, NPD), investments (Ståle Mæland, Statistics Norway) and average energy prices paid by Norwegian industry (Sadina Jama, Statistics Norway). Two anonymous reviewers have provided valuable comments and have thus helped in the process of writing this analysis.
References and Notes
- Campbell, C.J.; Laherrere, J.H. The end of cheap oil. Sci. Am. 1998, 78–83. [Google Scholar]
- Statistical Review of World Energy; BP Global: London, UK, 2007.
- ASPO. Available online: http://www.peakoil.net/ (accessed on 10th of January 2010).
- Hall, C.A.S.; Cleveland, C.J. Petroleum drilling and production in the United States: Yield per effort and net energy analysis. Science 1981, 211, 576–579. [Google Scholar]
- Cleveland, C.; Costanza, R.; Hall, C.A.S.; Kaufmann, R.K. Energy and the U.S. economy: A biophysical perspective. Science 1984, 225, 890–897. [Google Scholar]
- Hall, C.A.S.; Cleveland, C.; Kaufmann, R.K. Energy and Resource Quality: The Ecology of the Economic Process; Wiley: New York, NY, USA, 1986; p. 577. [Google Scholar]
- Hall, C.A.S.; Day, J.W. Revisiting the limits to growth after peak oil. Am. Sci. 2009, 97, 230–237. [Google Scholar]
- Gagnon, N.; Hall, C.A.S.; Brinker, L. A preliminary investigation of energy return on energy investment for global oil and gas production. Energies 2009, 2, 490–503. [Google Scholar]
- Brandt, A. Oil depletion and the energy efficiency of oil production: The case of California. Sustainability 2011, 3, 1833–1854. [Google Scholar]
- Munasinghe, M. The sustainomics trans-disciplinary meta-framework for making development more sustainable. Applications to energy issues. Int. J. Sustain. Dev. 2002, 5, 125–182. [Google Scholar]
- Lynch, M.C. The new pessimism about petroleum resources: Debunking the Hubbert model (and Hubbert Modelers). Miner. Energy 2003, 18, 21–32. [Google Scholar]
- Höök, M.; Aleklett, K. A decline rate study of Norwegian oil production. Energy Policy 2008, 36, 4262–4271. [Google Scholar]
- Sørenes, T. Energy scenarios for a sustainable future. The Norwegian Continental Shelf. Presented at Energy Scenarios conference, Stockholm, Sweden, 22 October 2009.
- Nordvik, F.M., Moen, T., Zenker, E., Eds.; Facts, The Norwegian Petroleum Sector 2009; Ministry of Petroleum and Energy, Norwegian Petroleum Directorate: Norway, 2009. Available online: http://www.npd.no/en/Publications/Facts/Facts-2009/ (accessed 14 January 2010).
- Hall, C.A.S.; Balogh, S.; Murphy, D.J. What is the minimum EROI that a sustainable society must have? Energies 2009, 2, 25–47. [Google Scholar]
- Davis, W. A study of the future productive capacity and probably reserves of the US. Oil Gas J. 1958, 56, 105–119. [Google Scholar]
- Guilford, M.; Hall, C.A.S.; Cleveland, C.J. New estimates of EROI for United States oil and gas, 1919–2010. Sustainability 2011, 3, 1866–1887. [Google Scholar]
- Cleveland, C. Net energy from the extraction of oil and gas in the United States. Energy 2005, 30, 769–782. [Google Scholar]
- 1992 Census of Mineral Industries; U.S. Bureau of the Census: Washington, DC, USA, 1996.
- 1997 Census of Mineral Industries; U.S. Bureau of the Census: Washington, DC, USA, 2001.
- 2002 Census of Mineral Industries; U.S. Bureau of the Census: Washington, DC, USA, 2005.
- Annual Energy Review 2006; U.S. Energy Information Administration: Washington DC, USA, 2007.
- Digest of United Kingdom Energy Statistics: 2007; U.K. Department for Business Enterprise and Regulatory Reform: London, UK, 2007.
- Digest of United Kingdom Energy Statistics: 2005; U.K. Department of Trade and Industry: London, UK, 2005.
- Global Upstream Performance Review; John S. Herold, Inc.: Norwalk, CT, USA, Harrison Lovegrove & Co. Ltd.: London, UK; 2007.
- Rodriguez, X.A.; Arias, C. The effects of resource depletion on coal mining productivity. Energy Econ 2008, 30, 397–408. [Google Scholar]
- Tilton, J.E. Assessing the threat of mineral depletion. Minerals & Energy 2003, 18, 33–42. [Google Scholar]
- King, C.; Hall, C.A.S. Relating financial and Energy Return on Investment. Sustainability 2011, 3, 1810–1832. [Google Scholar]
- Norwegian Petroleum Directorate, fact pages. Available online: http://www.npd.no/engelsk/cwi/pbl/en/index.htm (accessed on 25 January 2010).
- Murphy, D.; Hall, C.A.S. Order from chaos: A preliminary protocol for determining EROI for fuels. Sustainability 2011, 3, 1888–1907. [Google Scholar]
- Henshaw, P.F.; King, C.; Zarnikau, J. System Energy Assessment (SEA), defining a standard measure of EROI for energy businesses as whole systems. Sustainability 2011, 3, 1908–1943. [Google Scholar]
- Bøeng, A.C. Statistics Norway; Oslo, Norway, Personal communication; 2010. [Google Scholar]
- Hult, R. Norwegian Petroleum Directorate; Stavanger, Norway, Personal communication; 2009. [Google Scholar]
- Development of the Oil and Gas Resources of the United Kingdom 2001; UK Department of Trade and Industry: London, UK, 1984-2004. Available online: http://www.dbd-data.co.uk/bb2001/book.htm (accessed on 15 January 2010).
- UK Department of Energy and Climate Change. Petroleum production data. 1980-2008. Available online: https://www.og.decc.gov.uk/pprs/full_production.htm (accessed on 15 January 2010). [Google Scholar]
- Oil and Gas Activity 4th Quarter 1999; Statistics Norway: Oslo, Norway, 2000.
- Oil and Gas Activity 4th Quarter 2004 2005.
- Jama, S. Statistics Norway; Oslo, Norway, Personal communication; 2010. [Google Scholar]
- Statistics Norway. Norwegian GDP. Available online: http://www.ssb.no/nr_en/tabe-01.html (accessed on 15 May 2010).
- Statistics Norway. Norwegian CPI. Available online: http://www.ssb.no/kpi_en/tab-01-en.html (accessed on 15 May 2010).
- Statistics Norway. Net energy consumption. Available online: http://www.ssb.no/english/subjects/01/03/10/energiregn_en/tab-2010-04-23-06-en.html (accessed on 15 August 2010).
- Økt utvinning på norsk kontinentalsokkel. En rapport fra utvinningsutvalget. Ministry of Petroleum and Energy: Oslo, Norway, 2010. Available online: http://www.regjeringen.no/upload/OED/pdf%20filer/Oktutvinning.pdf (accessed 26 September 2010).
© 2011 by the authors; licensee MDPI, Basel, Switzerland. This article is an open access article distributed under the terms and conditions of the Creative Commons Attribution license (http://creativecommons.org/licenses/by/3.0/).
Share and Cite
Grandell, L.; Hall, C.A.S.; Höök, M. Energy Return on Investment for Norwegian Oil and Gas from 1991 to 2008. Sustainability 2011, 3, 2050-2070. https://doi.org/10.3390/su3112050
Grandell L, Hall CAS, Höök M. Energy Return on Investment for Norwegian Oil and Gas from 1991 to 2008. Sustainability. 2011; 3(11):2050-2070. https://doi.org/10.3390/su3112050
Chicago/Turabian StyleGrandell, Leena, Charles A.S. Hall, and Mikael Höök. 2011. "Energy Return on Investment for Norwegian Oil and Gas from 1991 to 2008" Sustainability 3, no. 11: 2050-2070. https://doi.org/10.3390/su3112050